


Características


¿Tienes alguna pregunta?
Recomendar


5 diapositivas
Types of Pets Infographics
There are a wide variety of pets that people can choose from, depending on their preferences, lifestyle, and the level of care they are willing to provide. These infographic templates offer an engaging way to showcase different types of pets and provide valuable information to viewers. Its customizable features, visually appealing elements, and modern design make it an effective tool for educational presentations, pet-related events, or any presentation related to pet types and their characteristics. These infographics are perfect to showcase various types of pets that people can keep as companions.


28 diapositivas
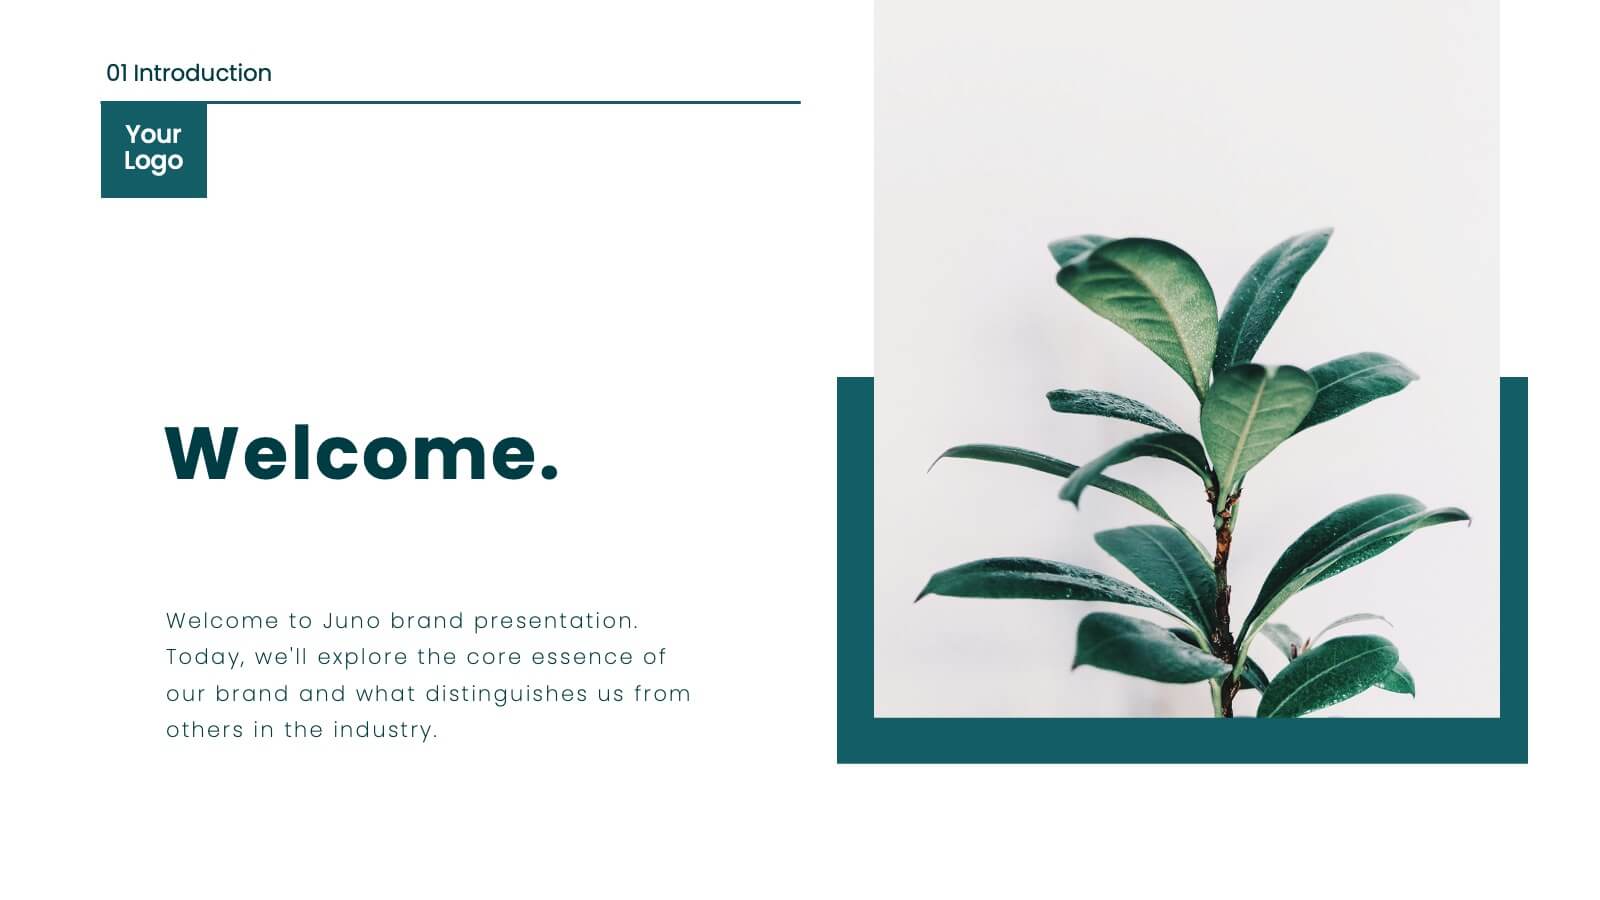
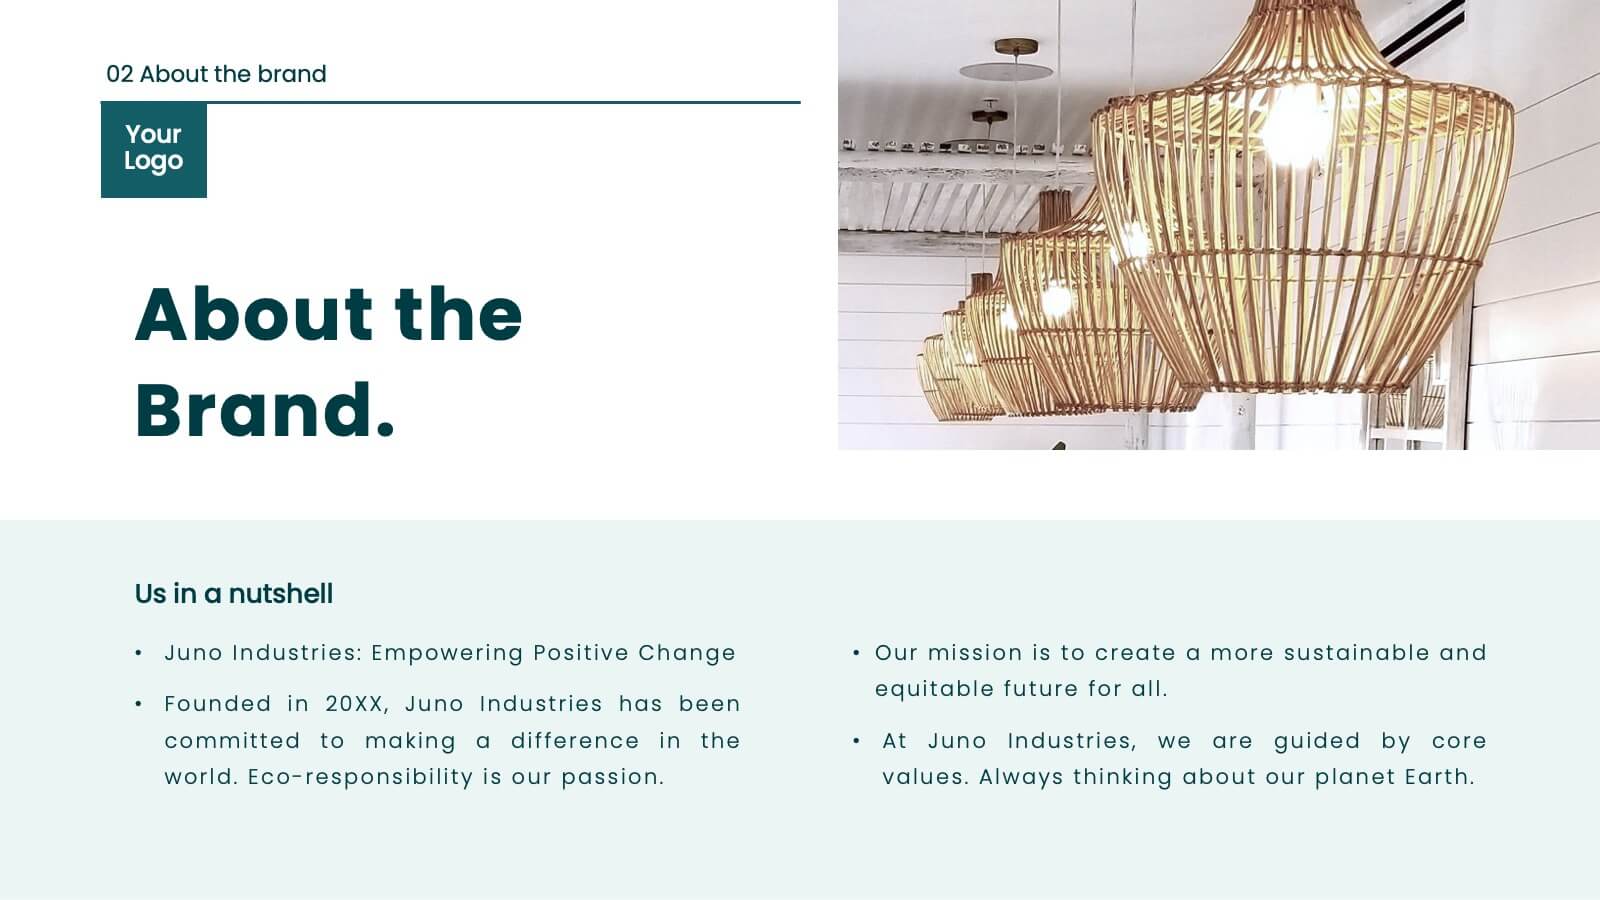
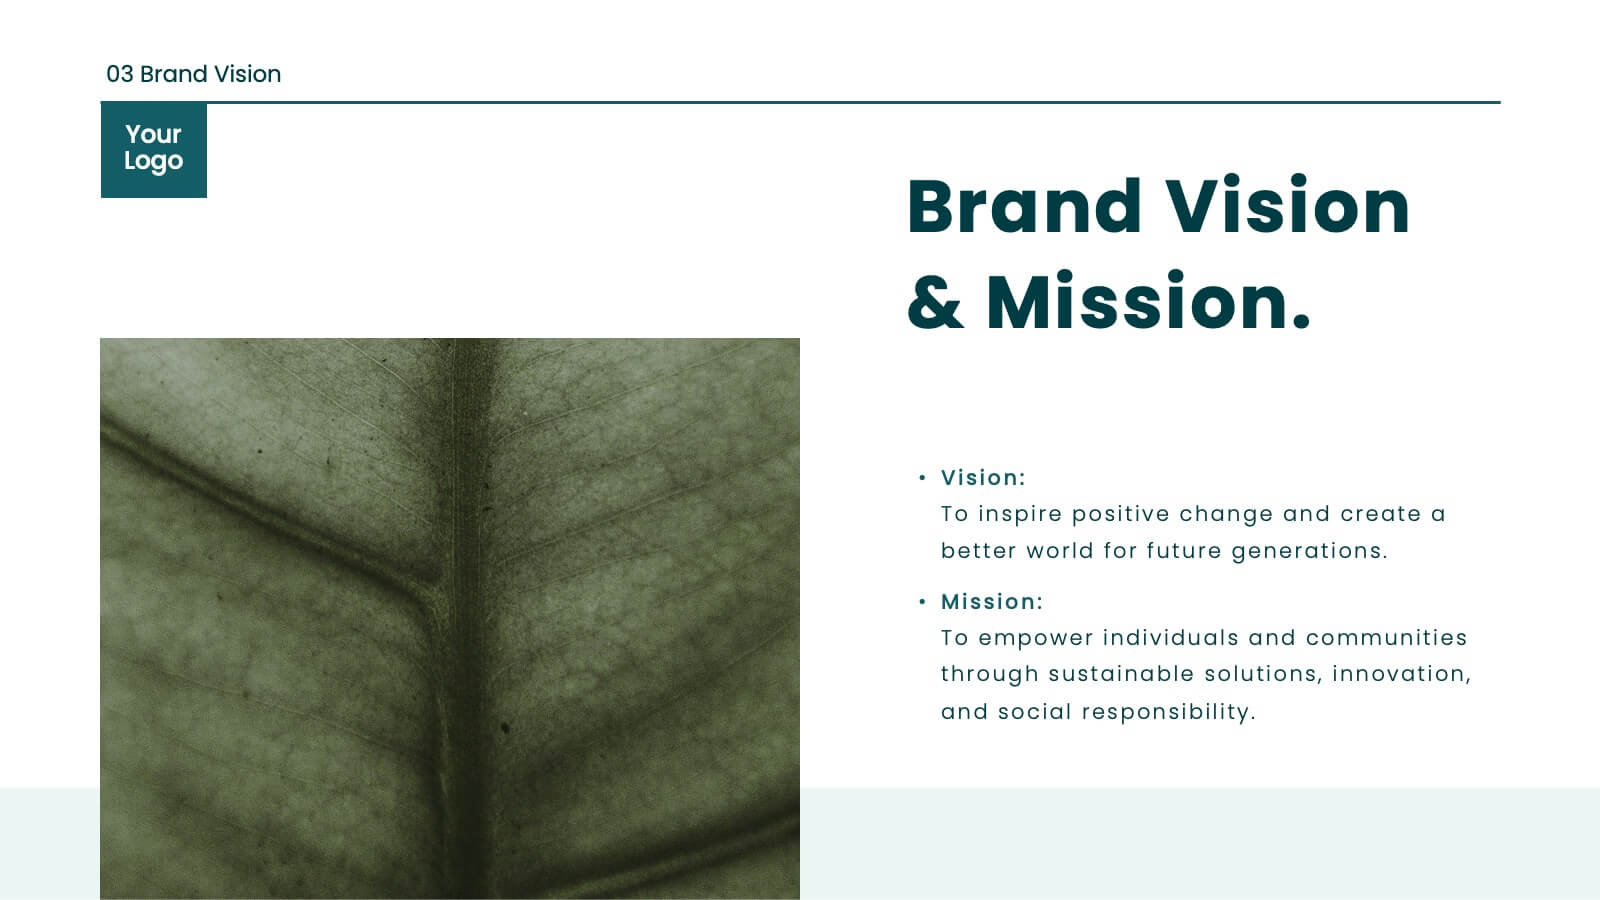
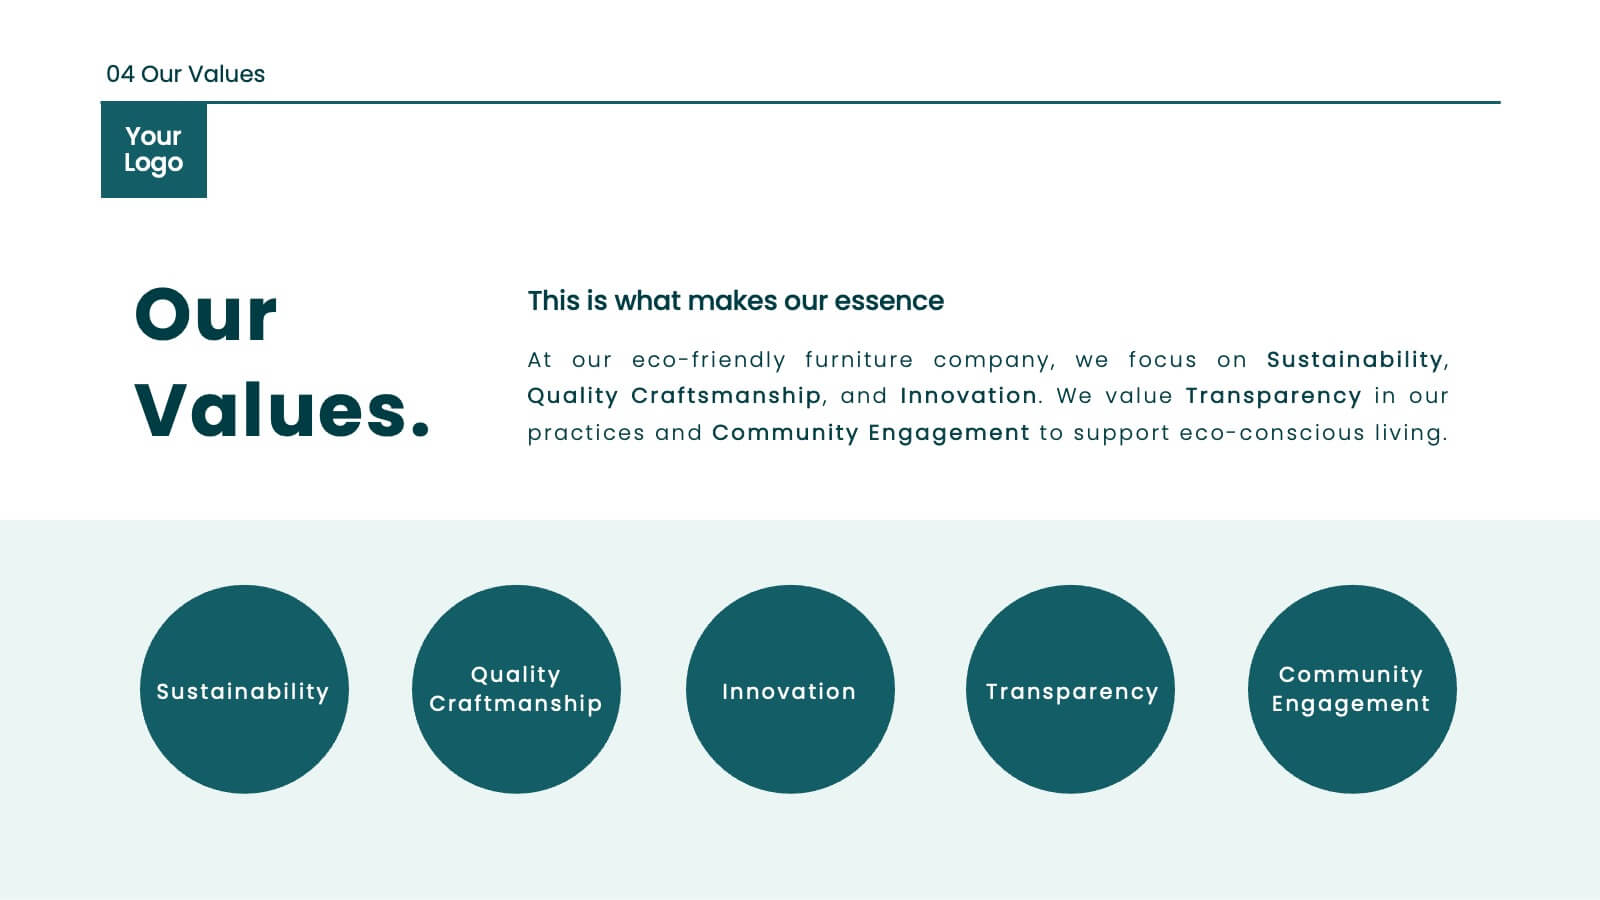
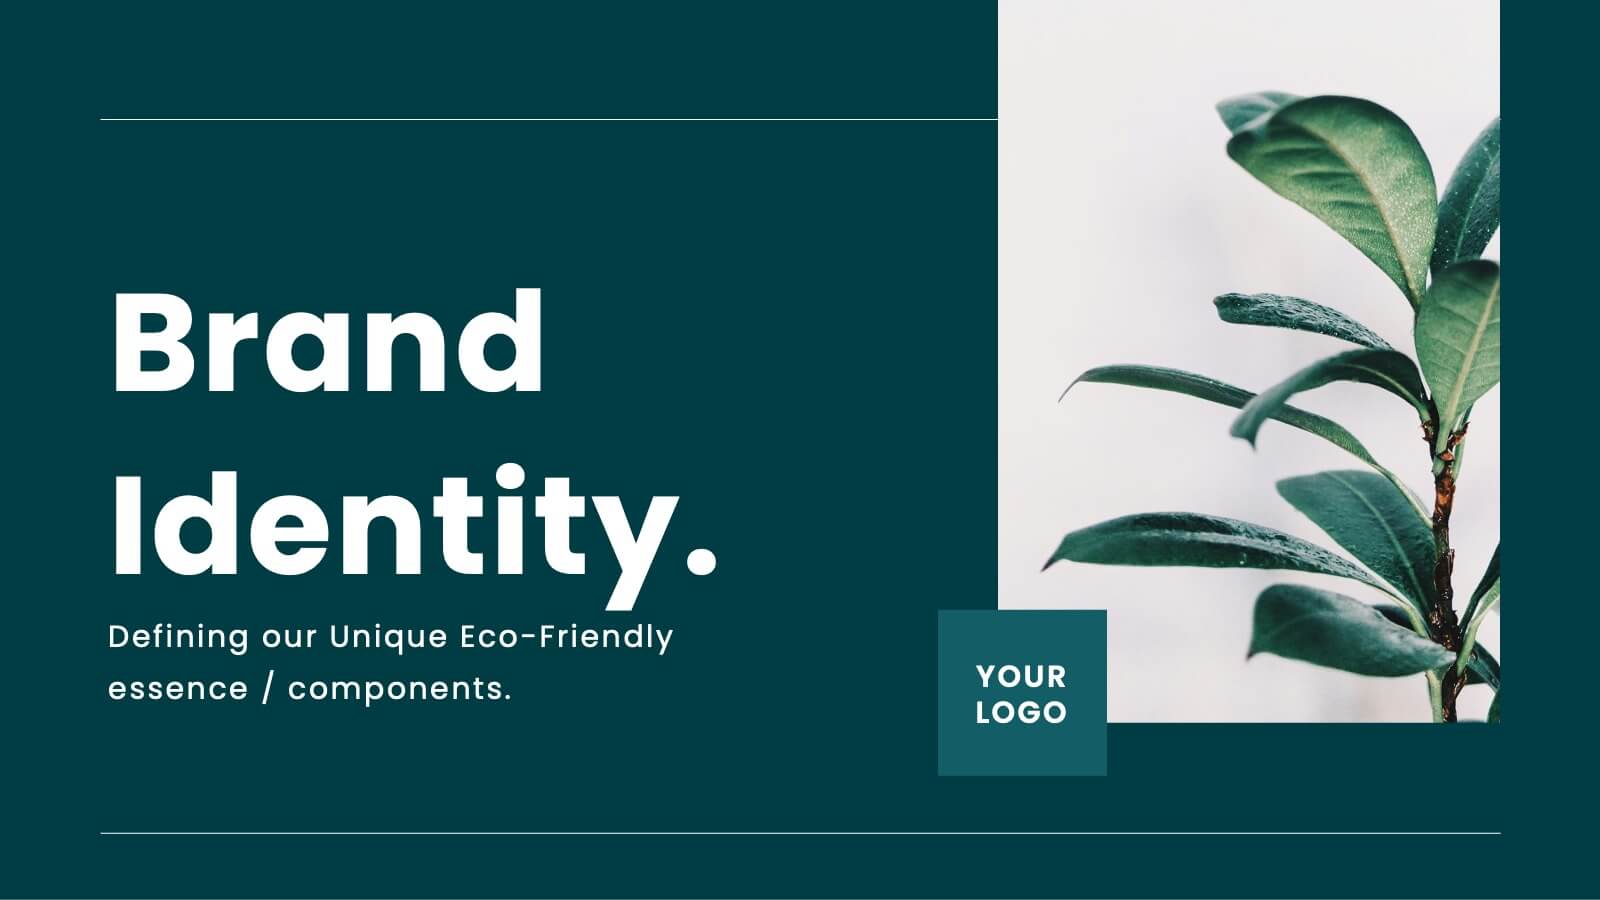
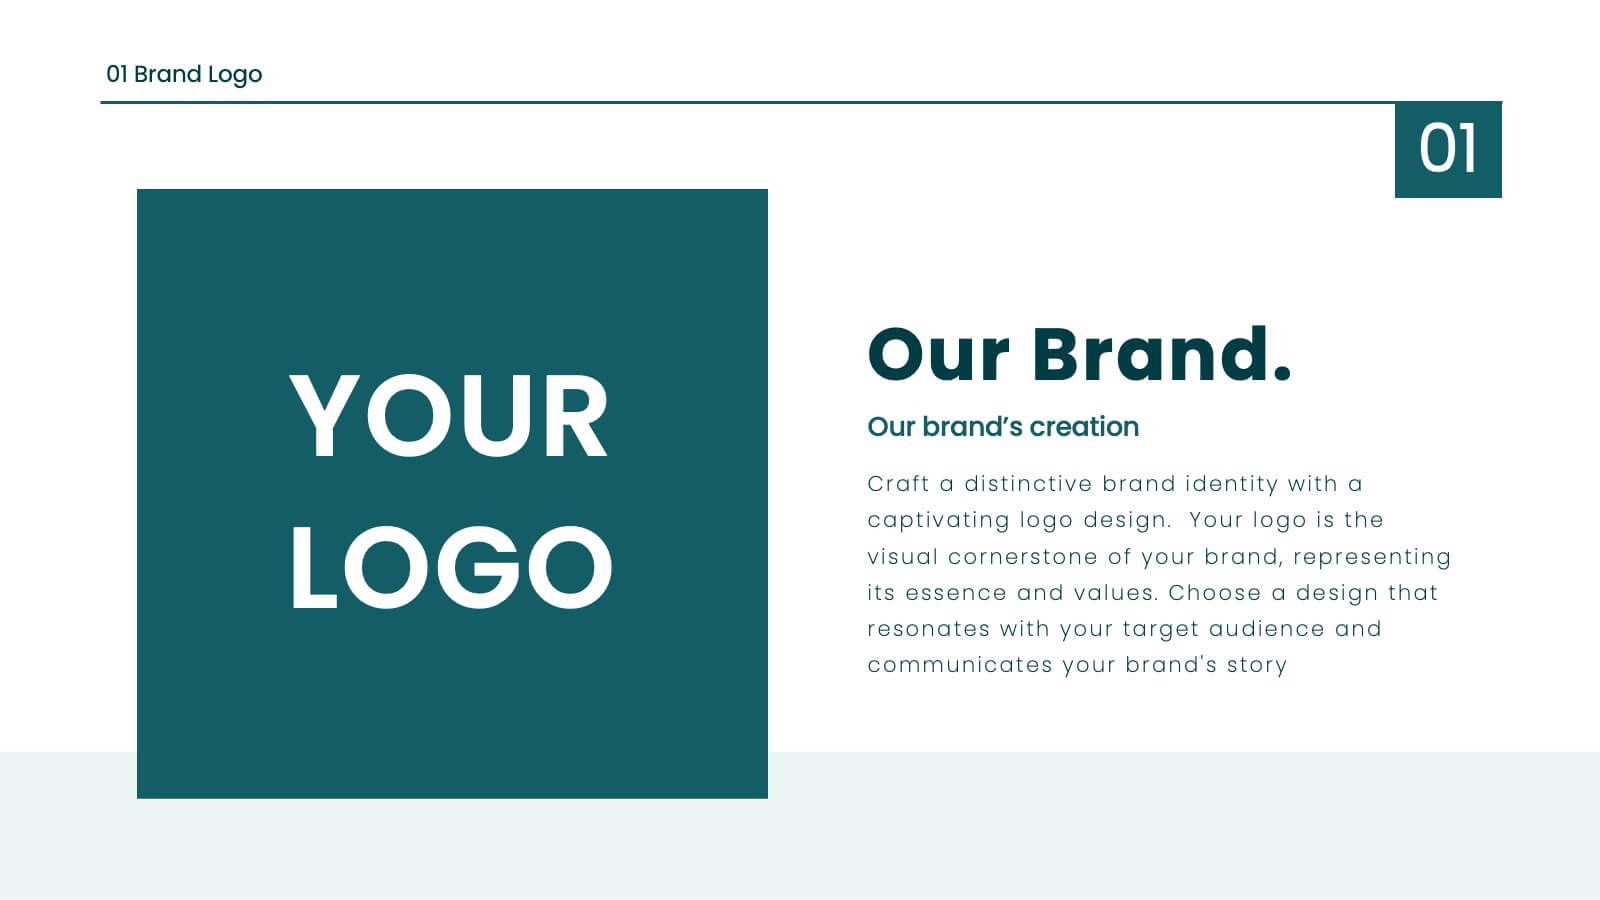
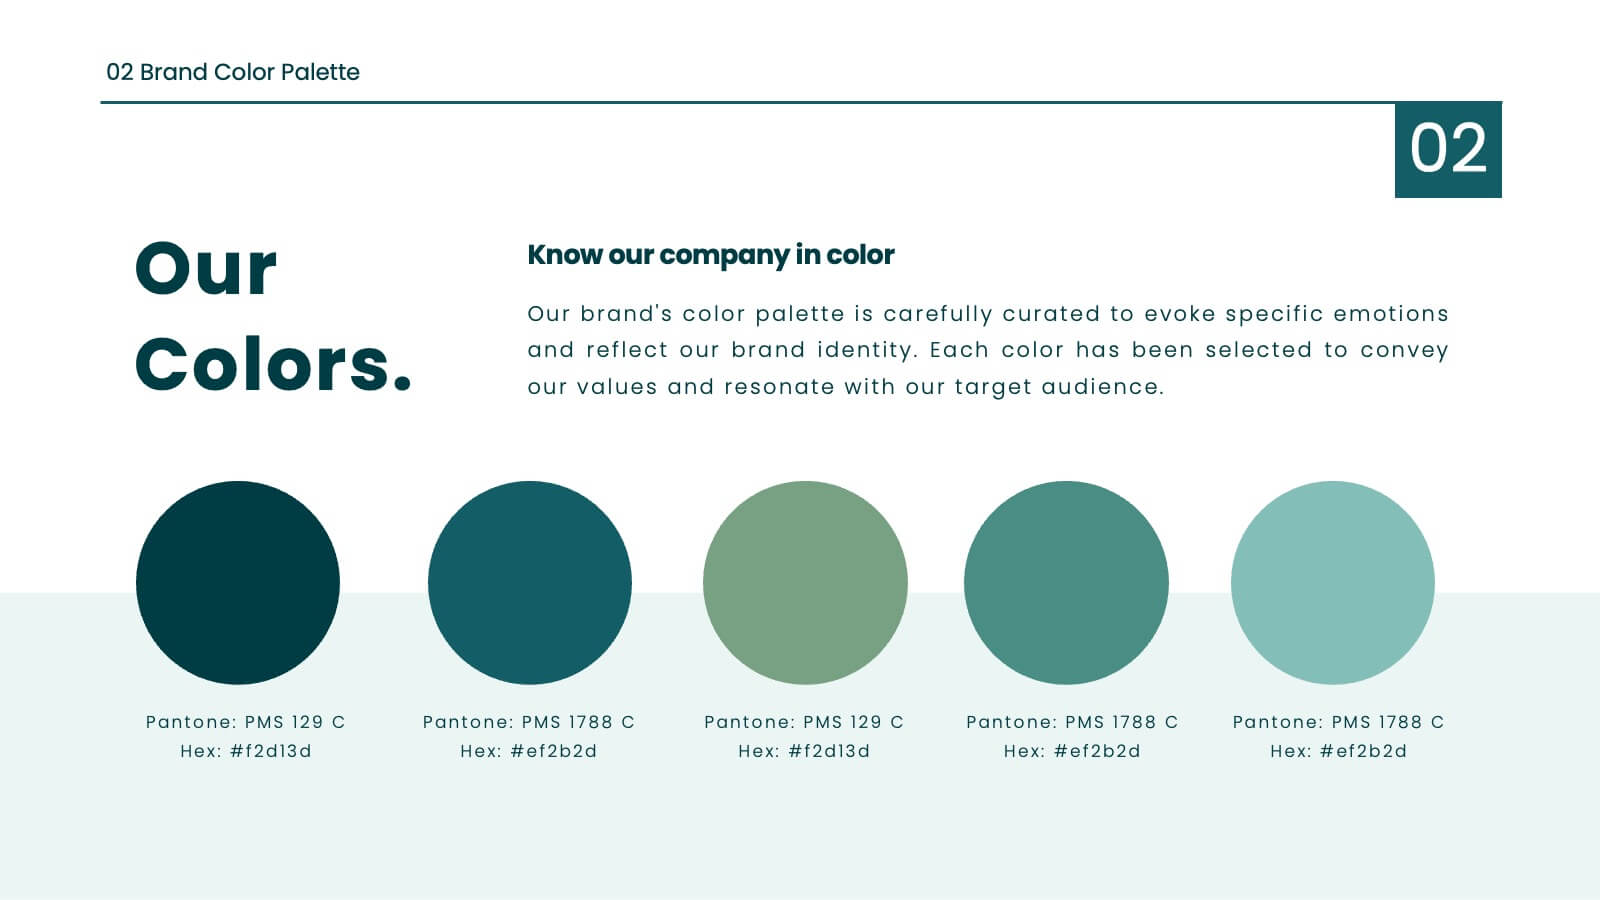
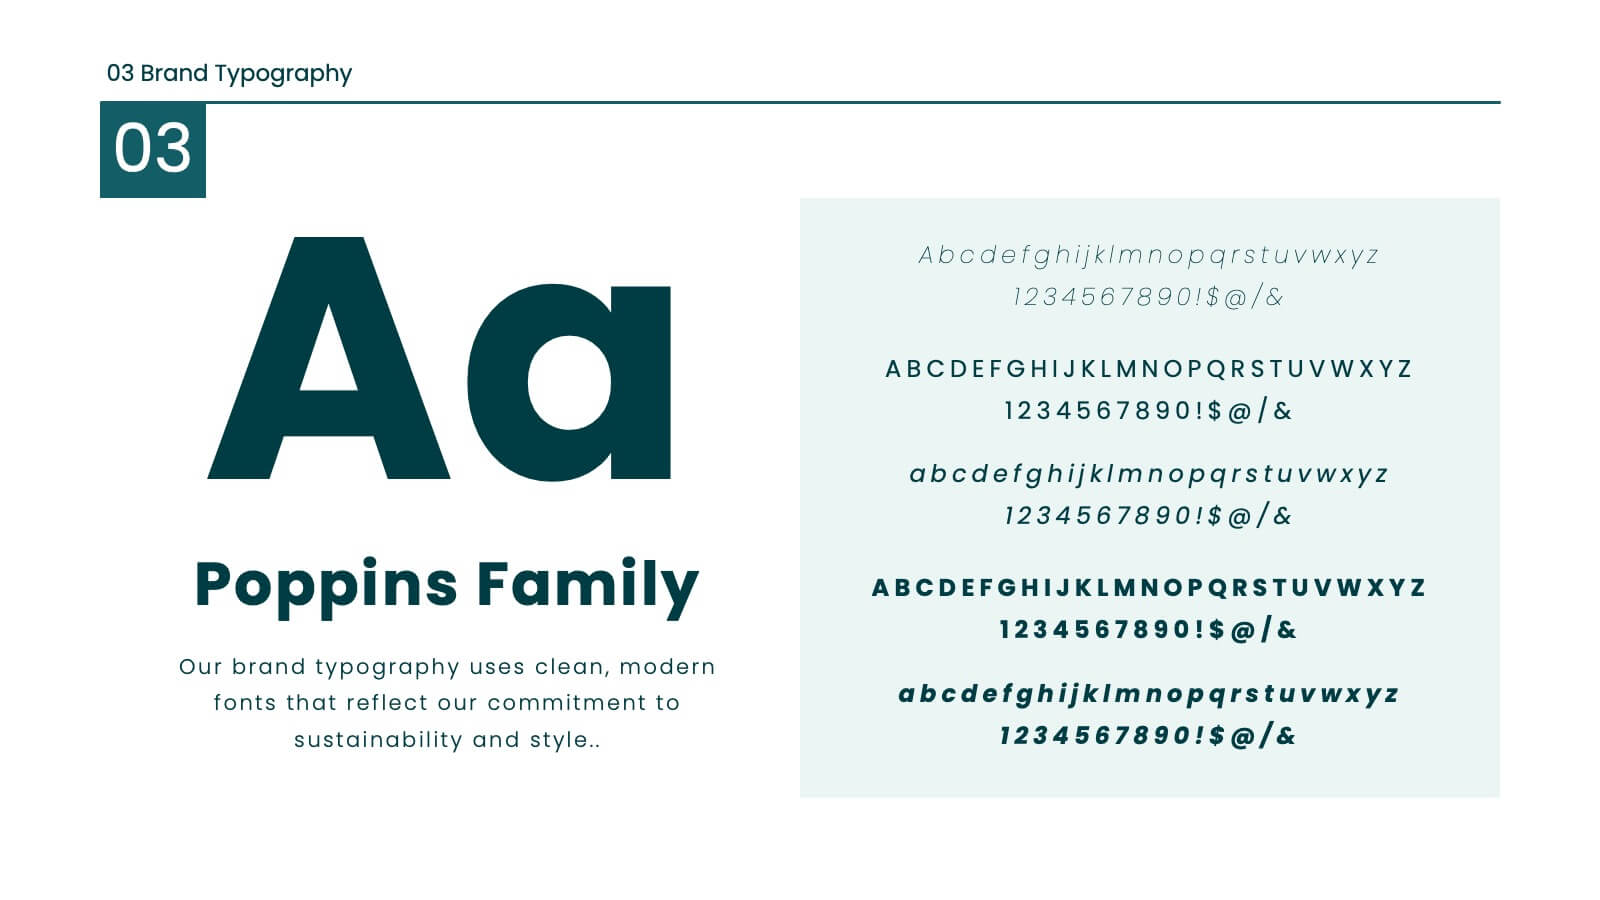
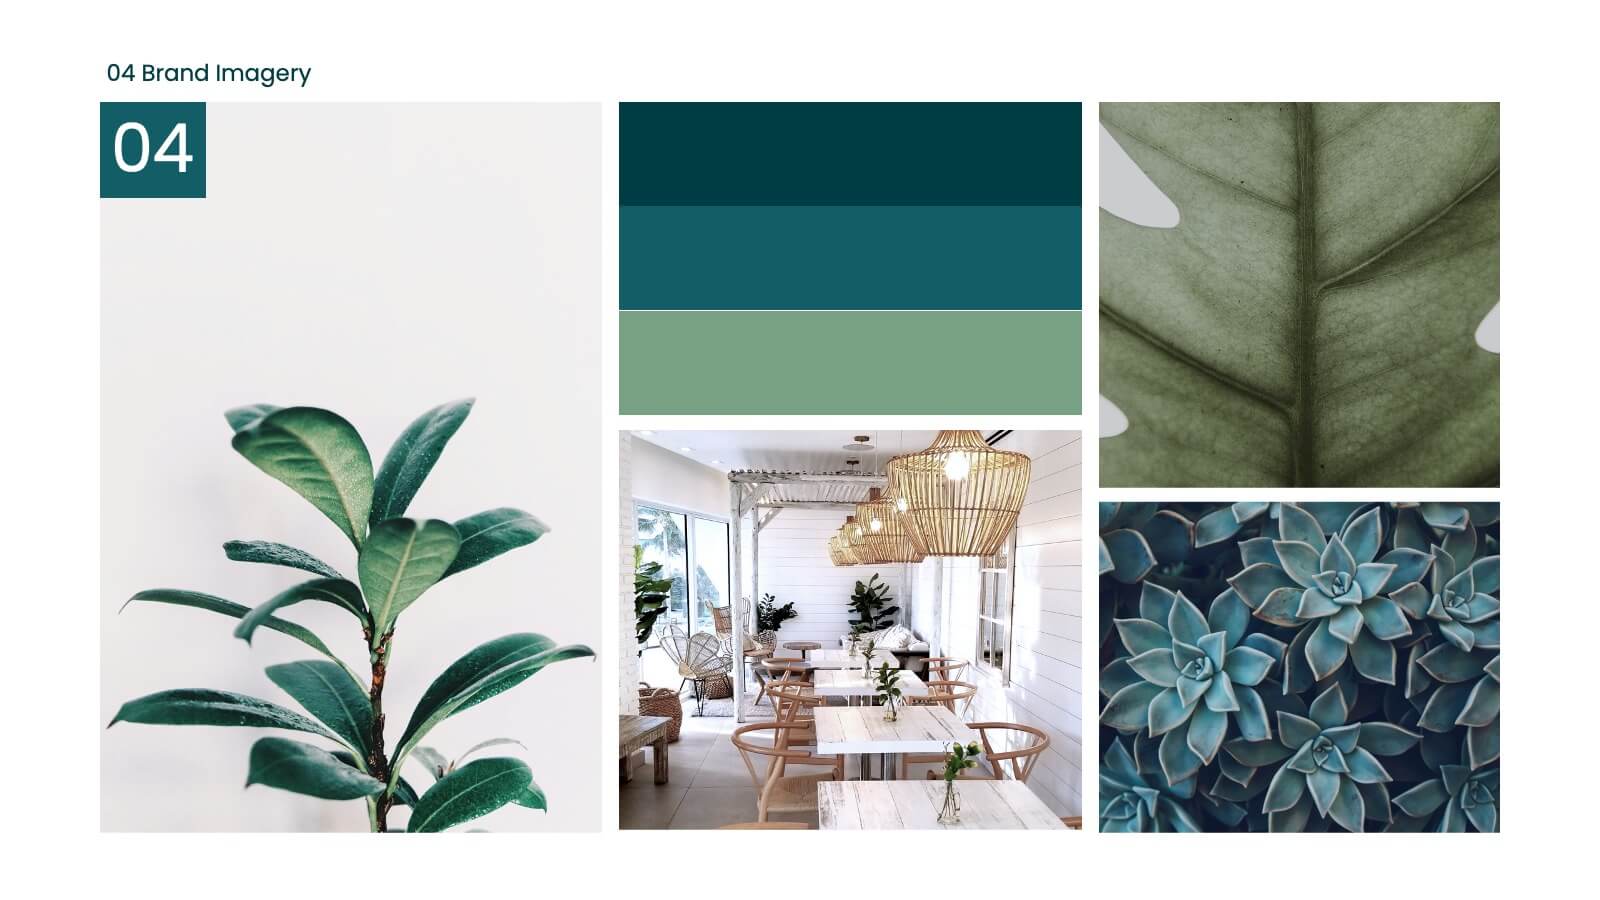
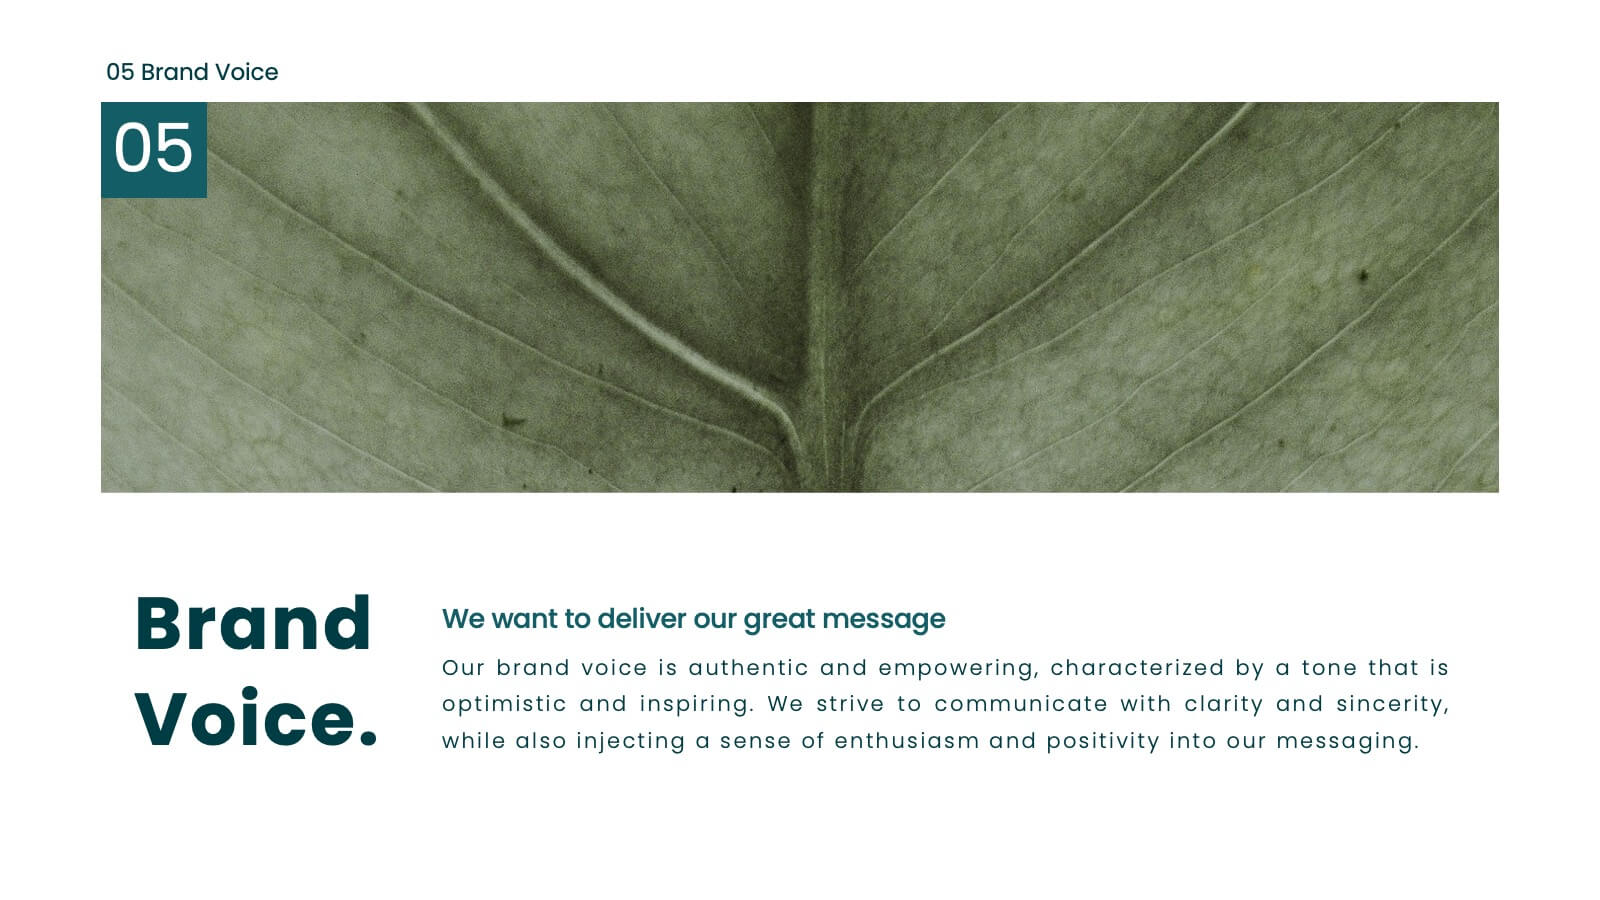
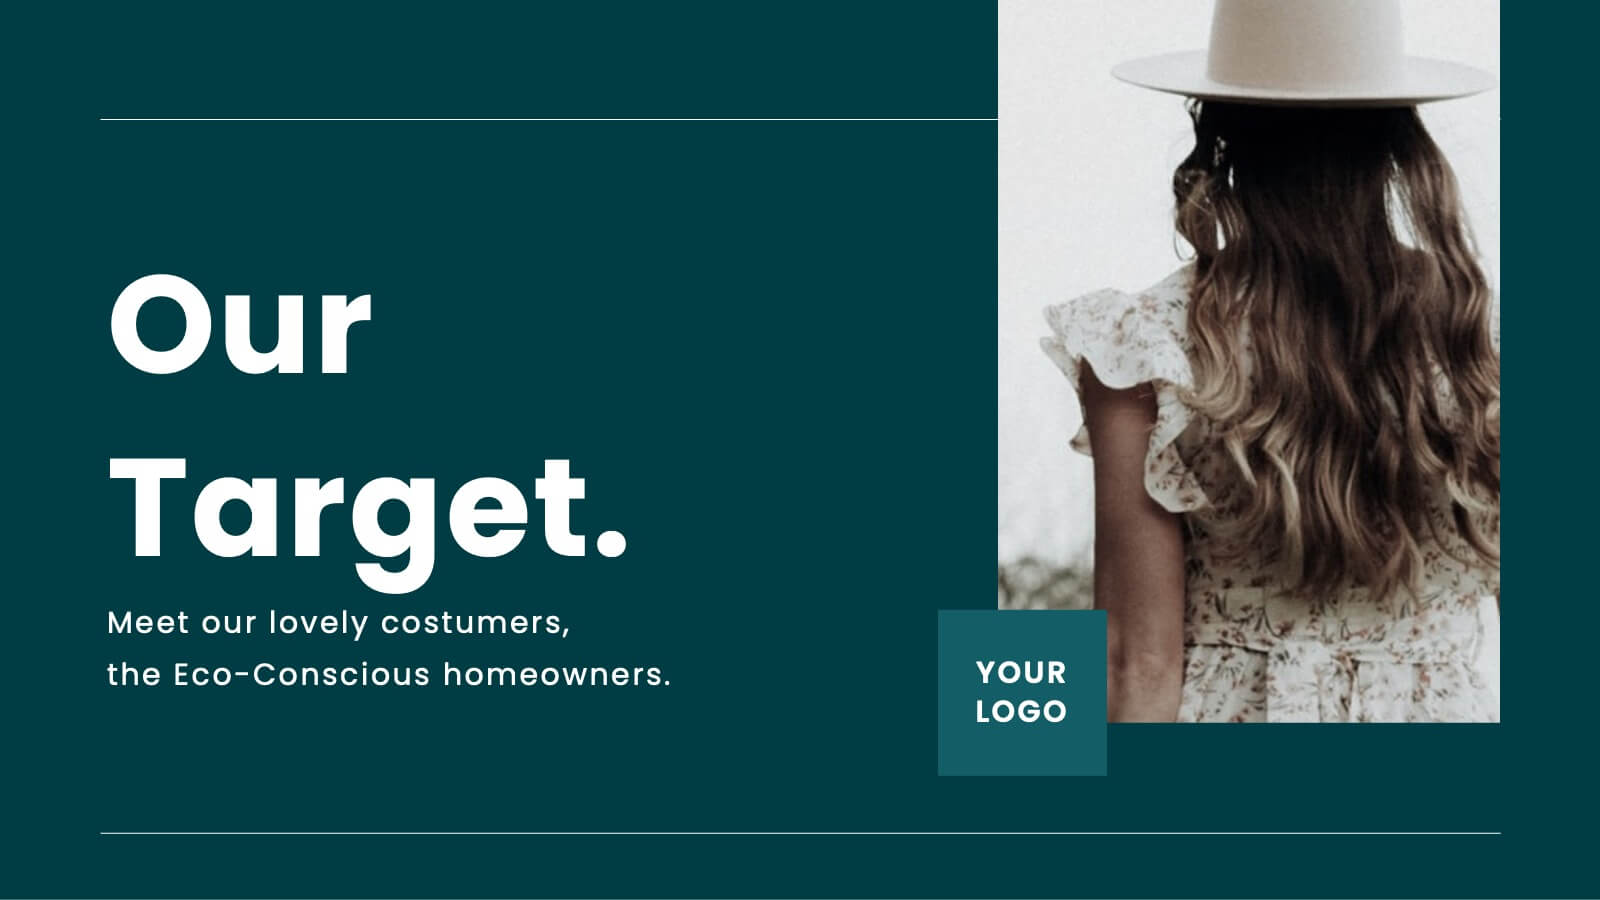
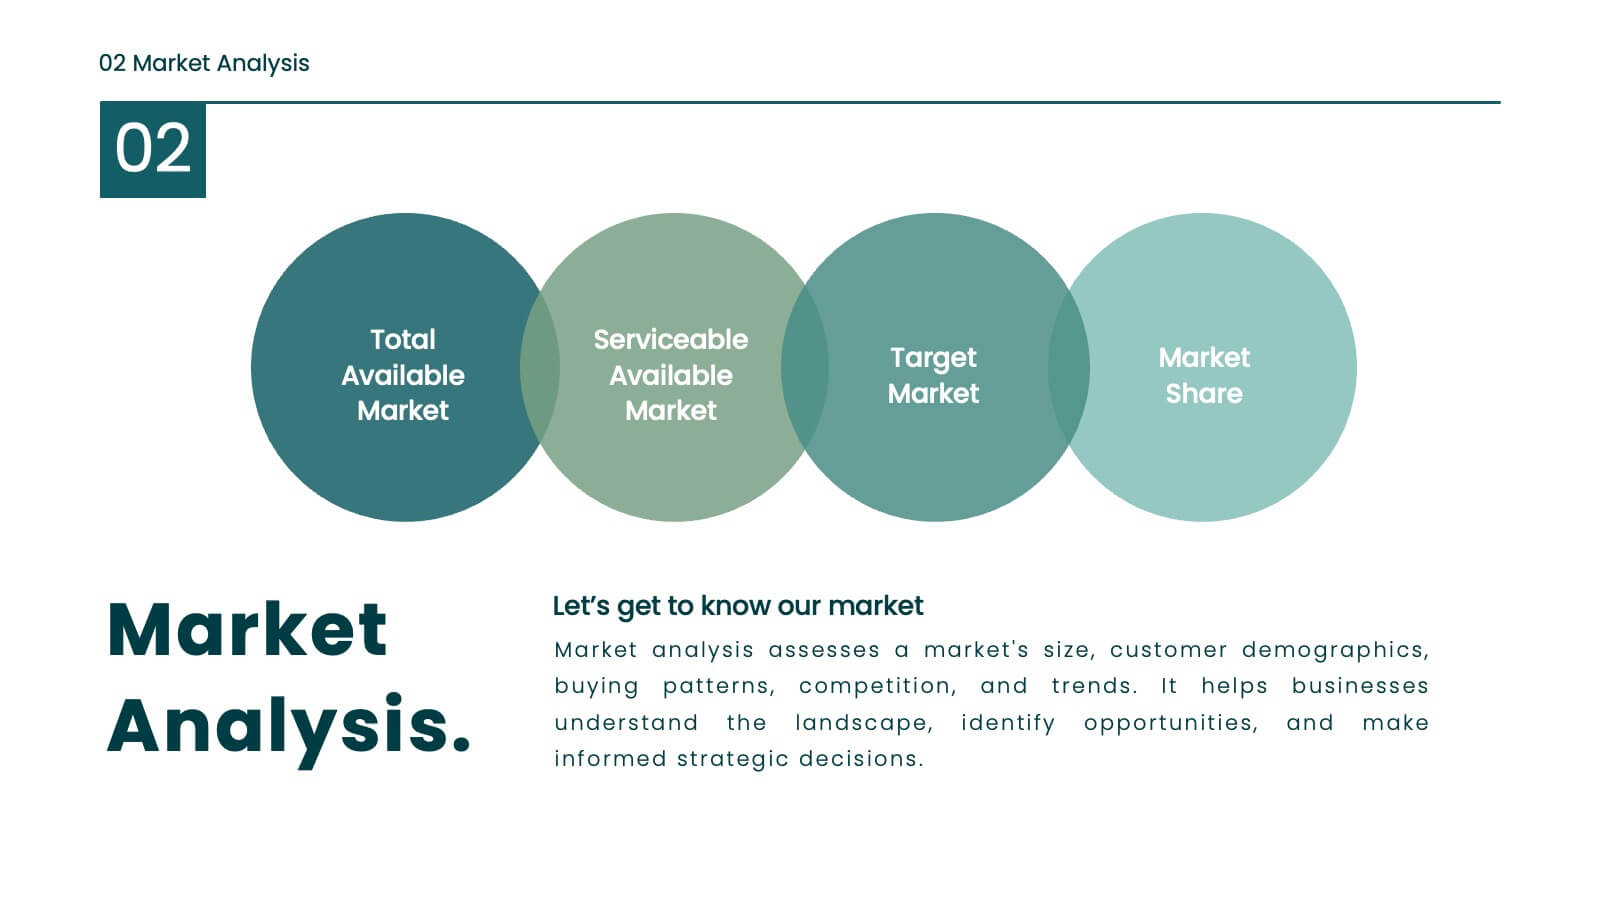
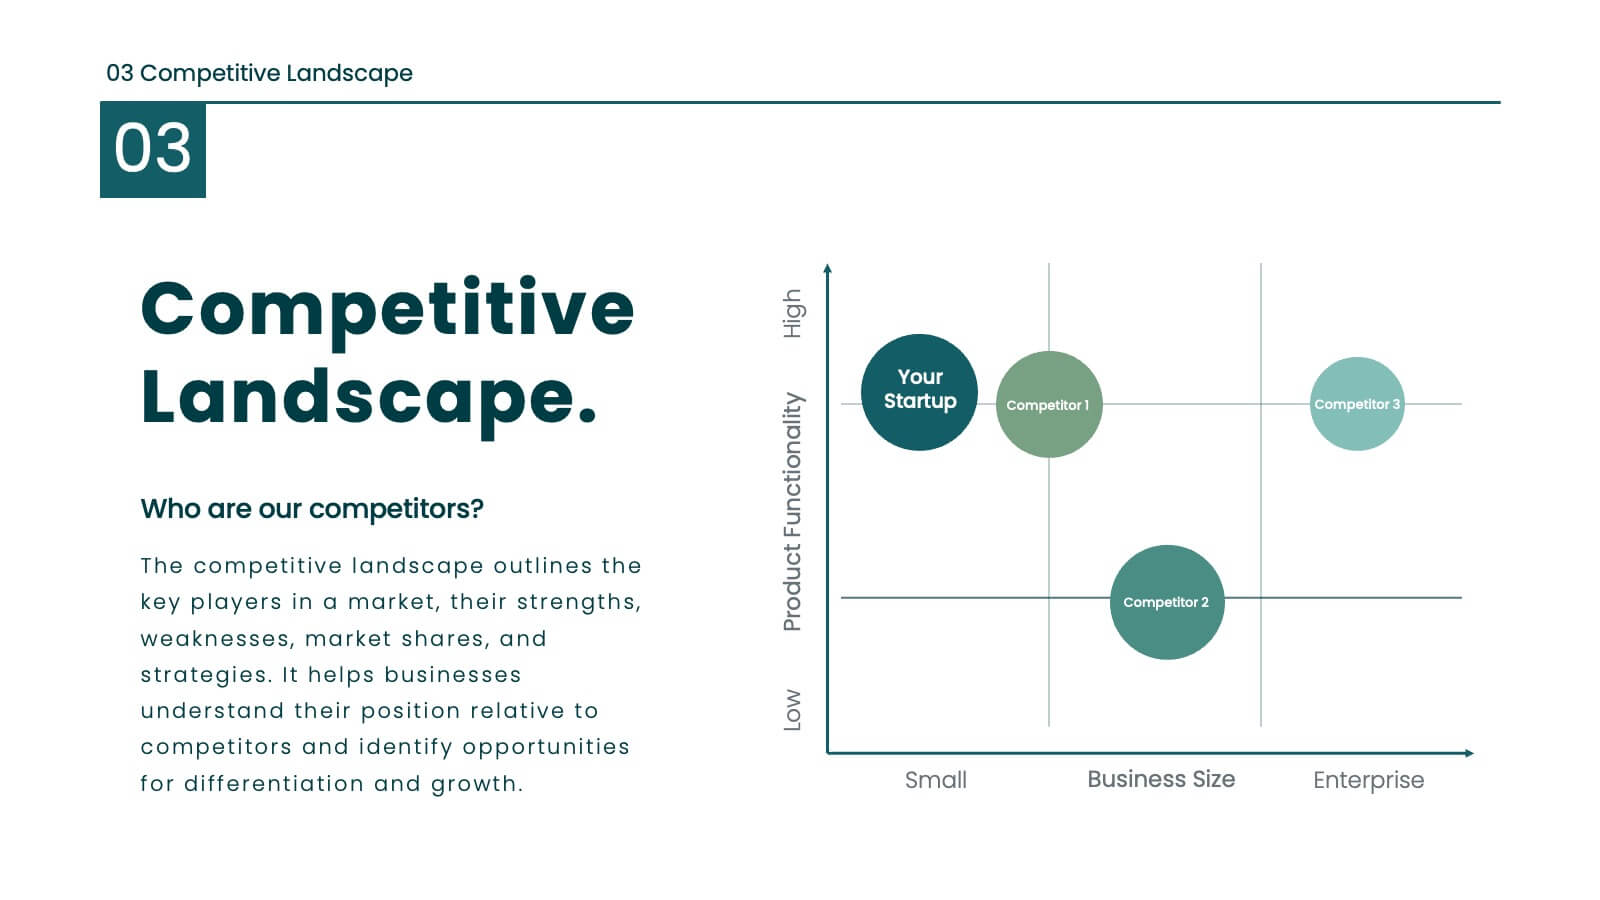
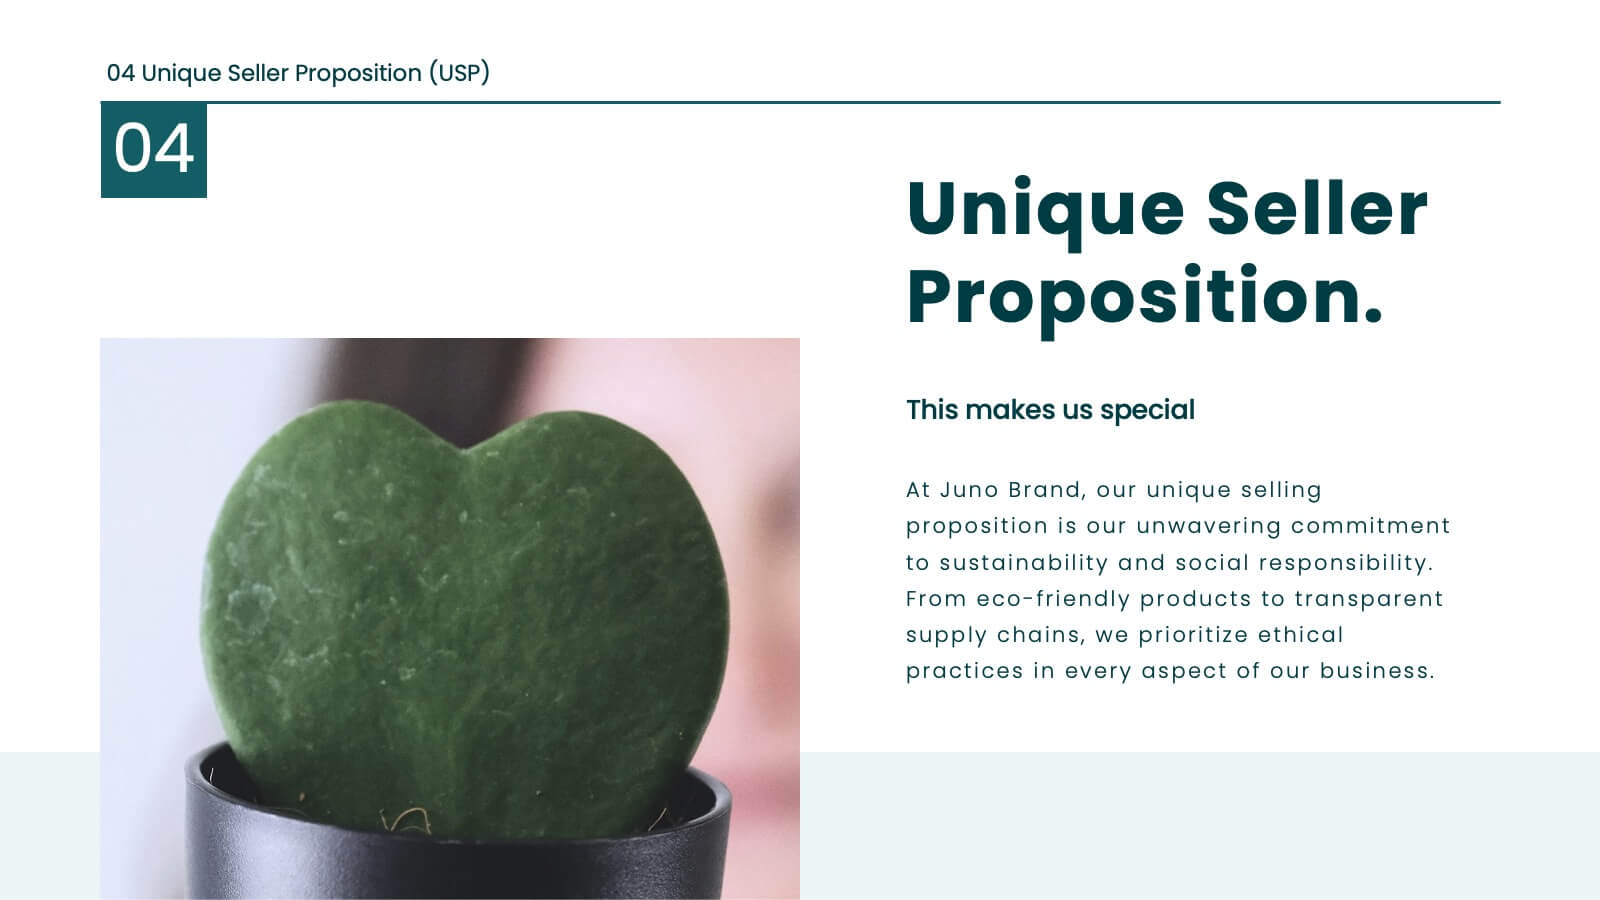
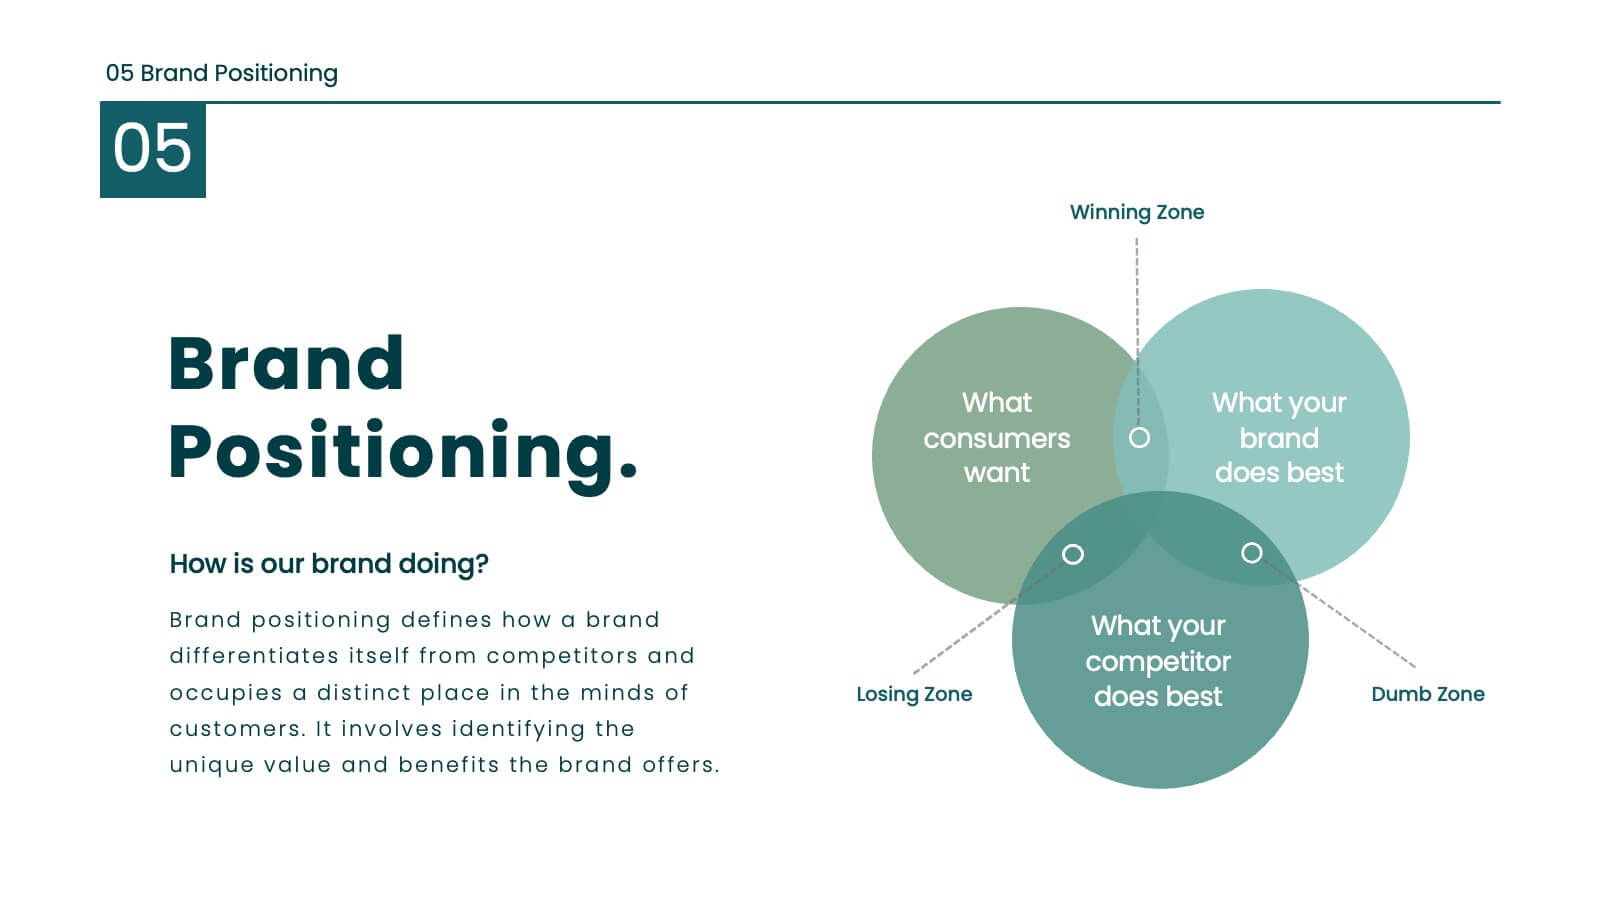
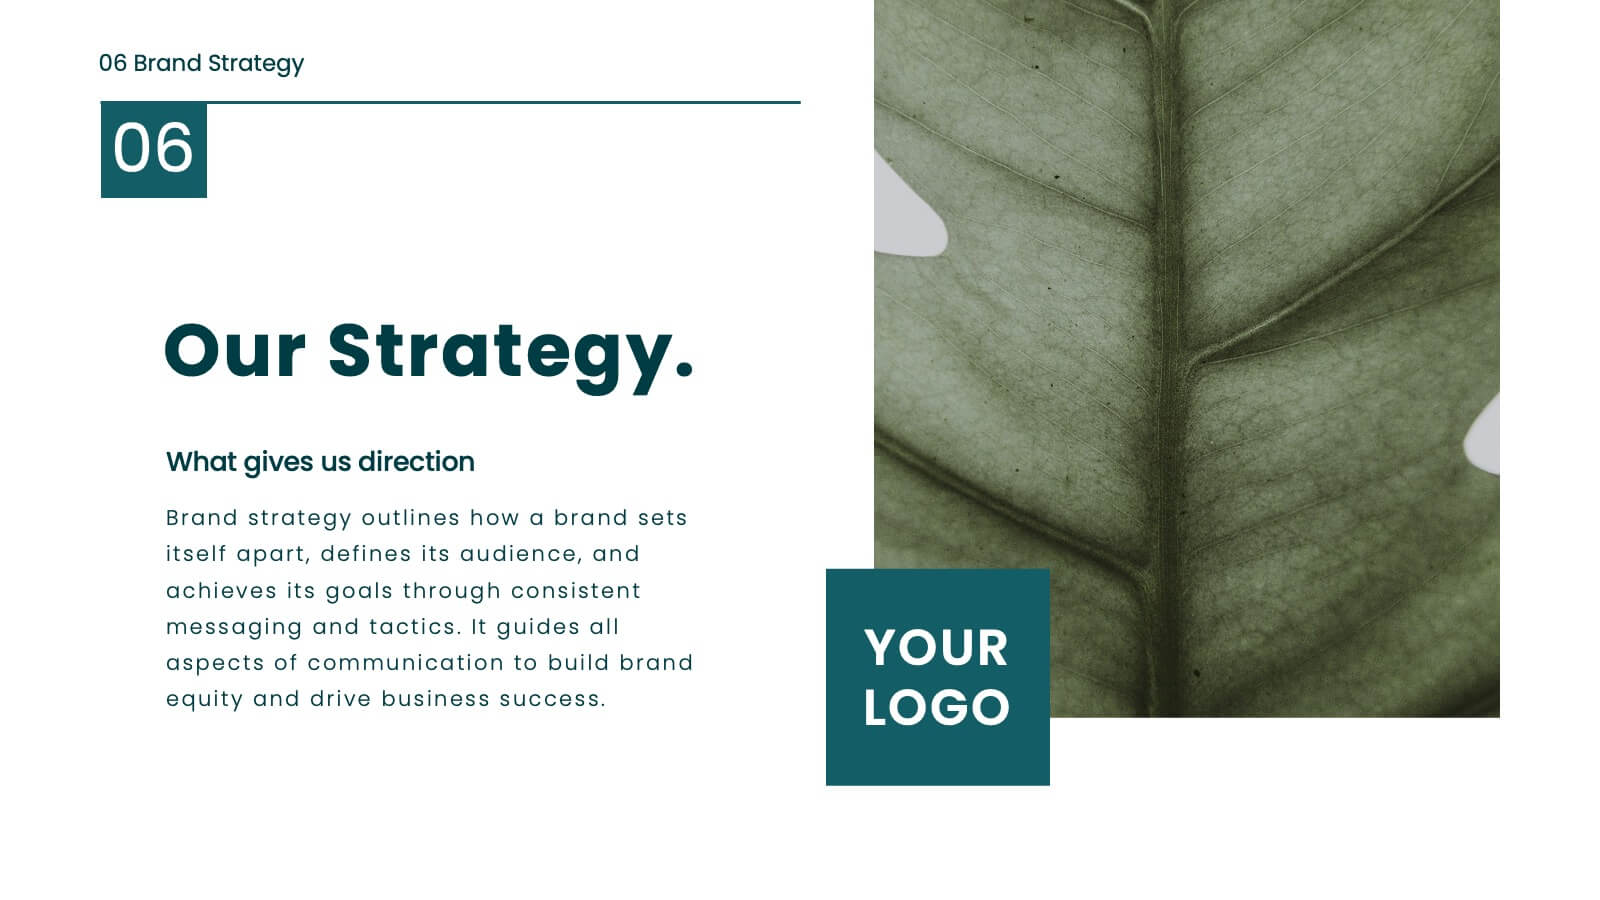
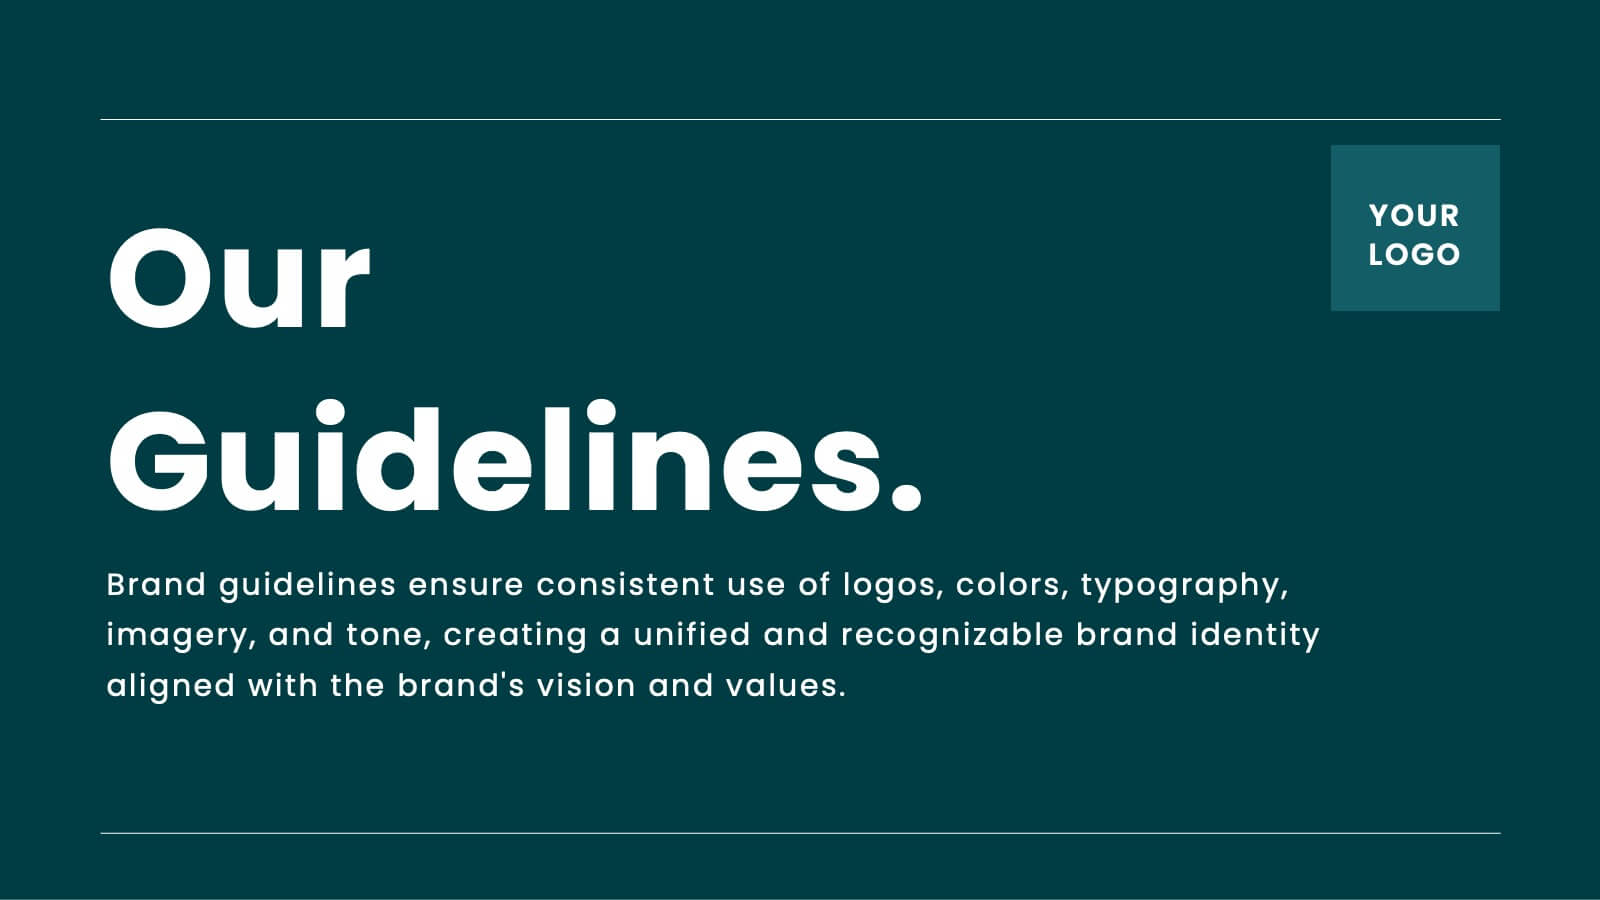
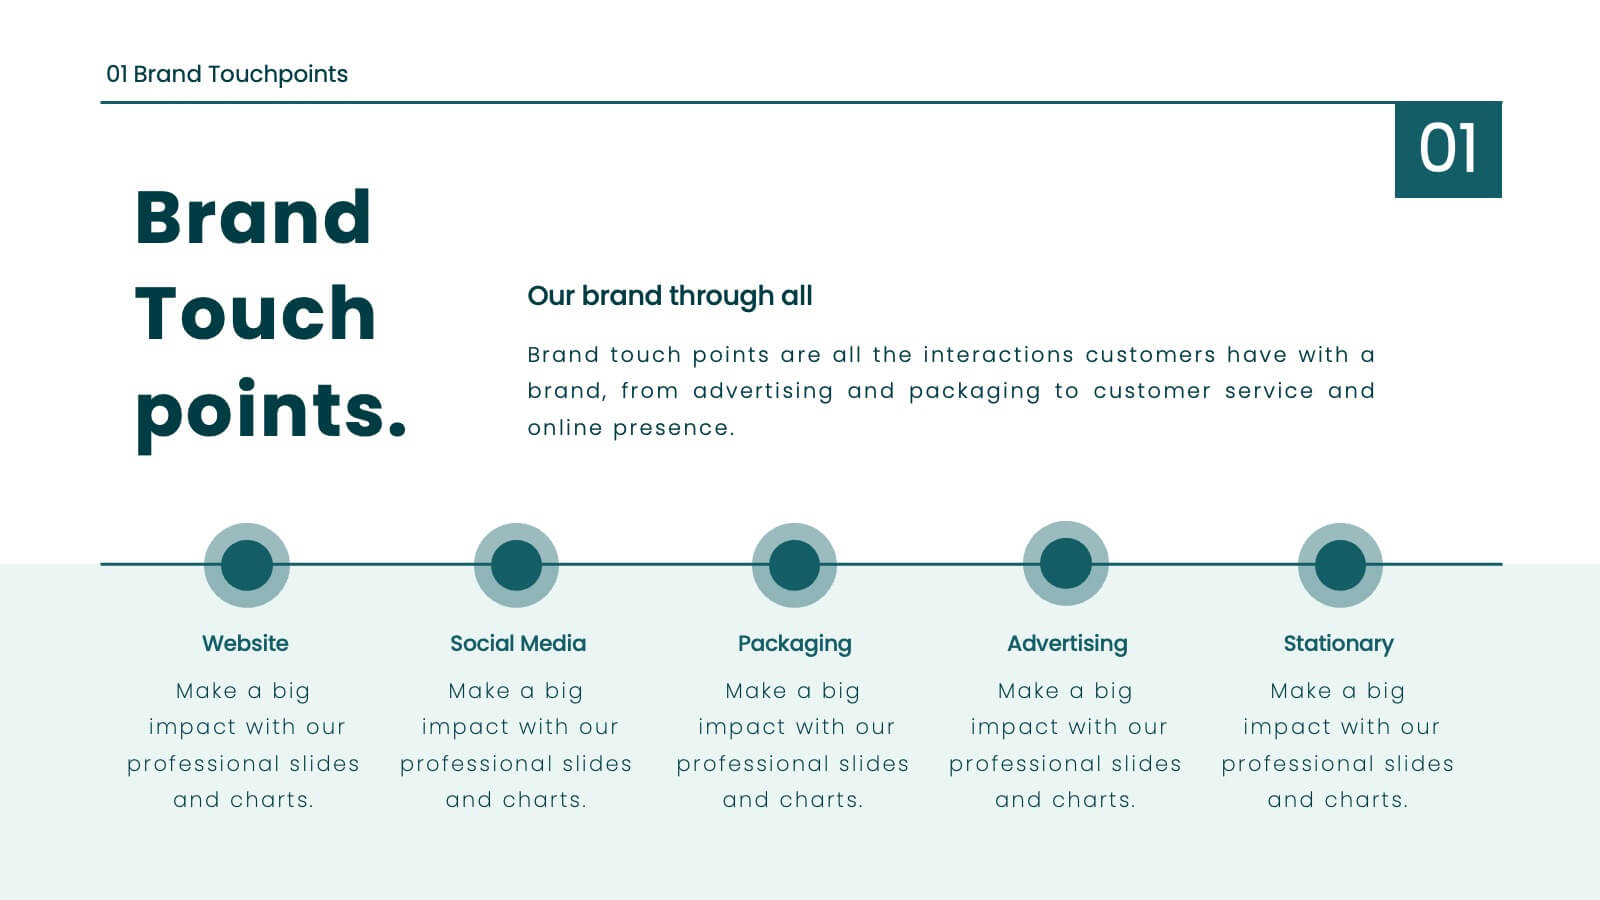
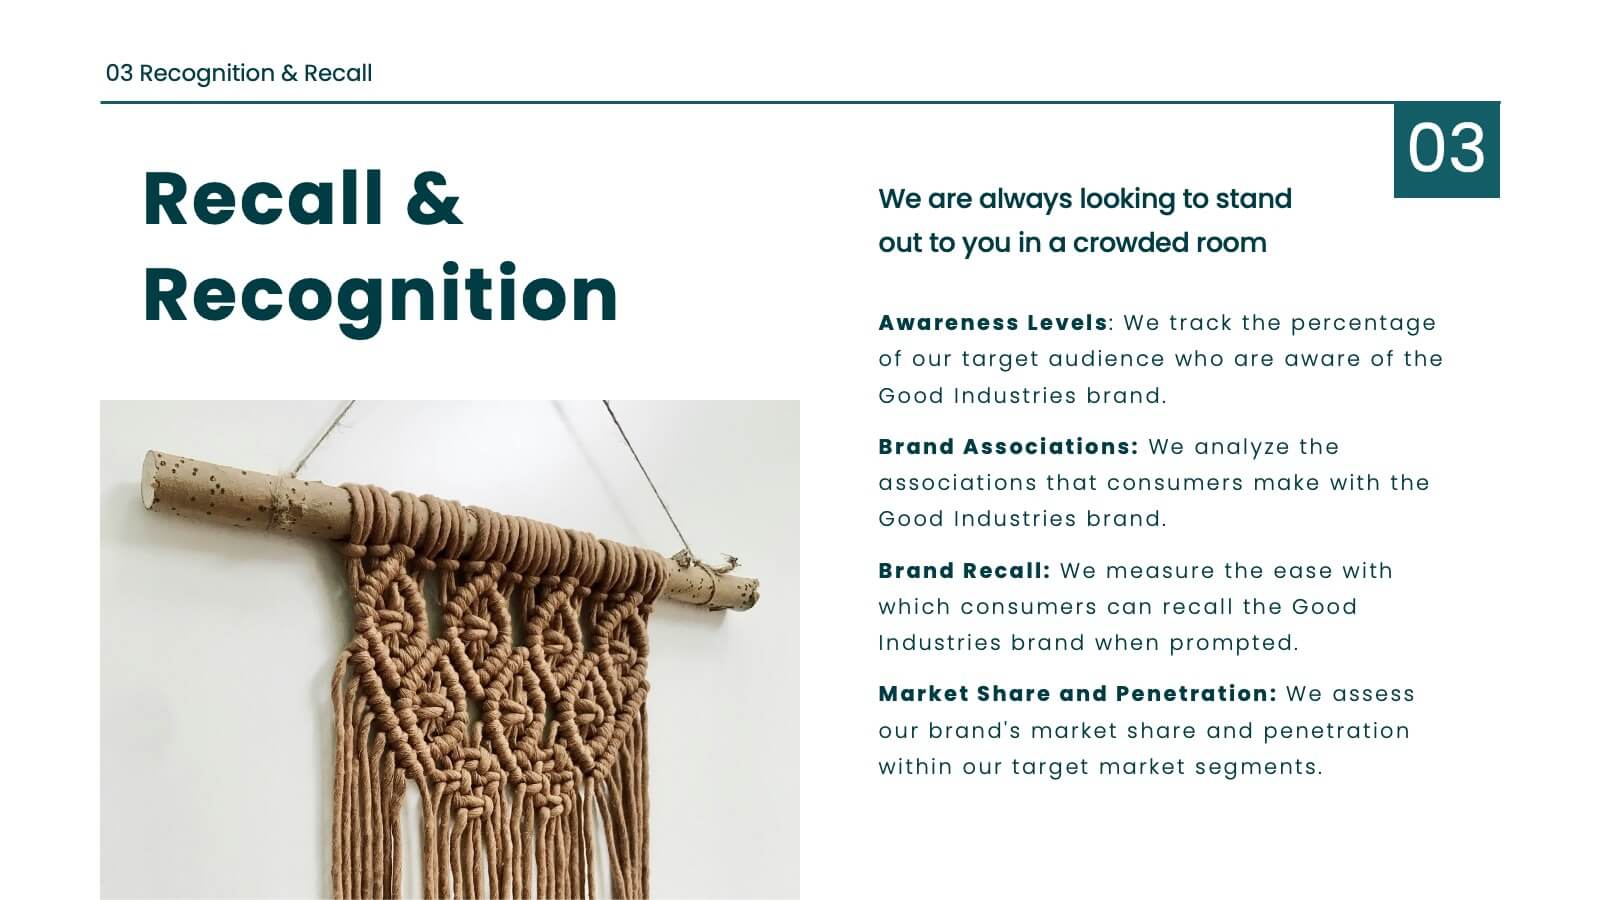
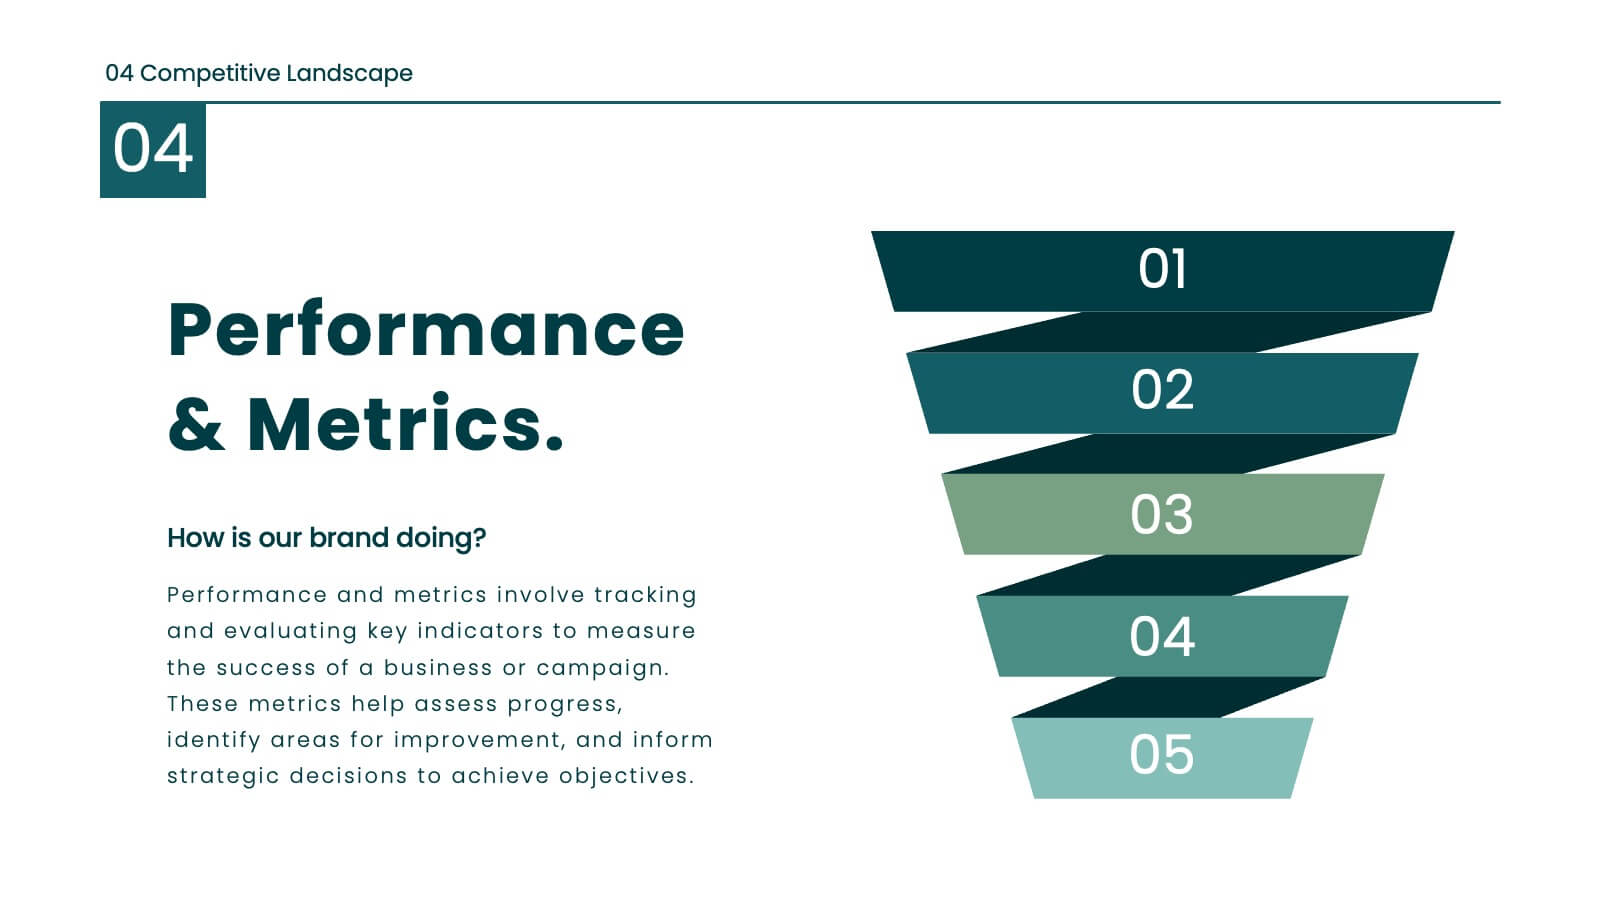
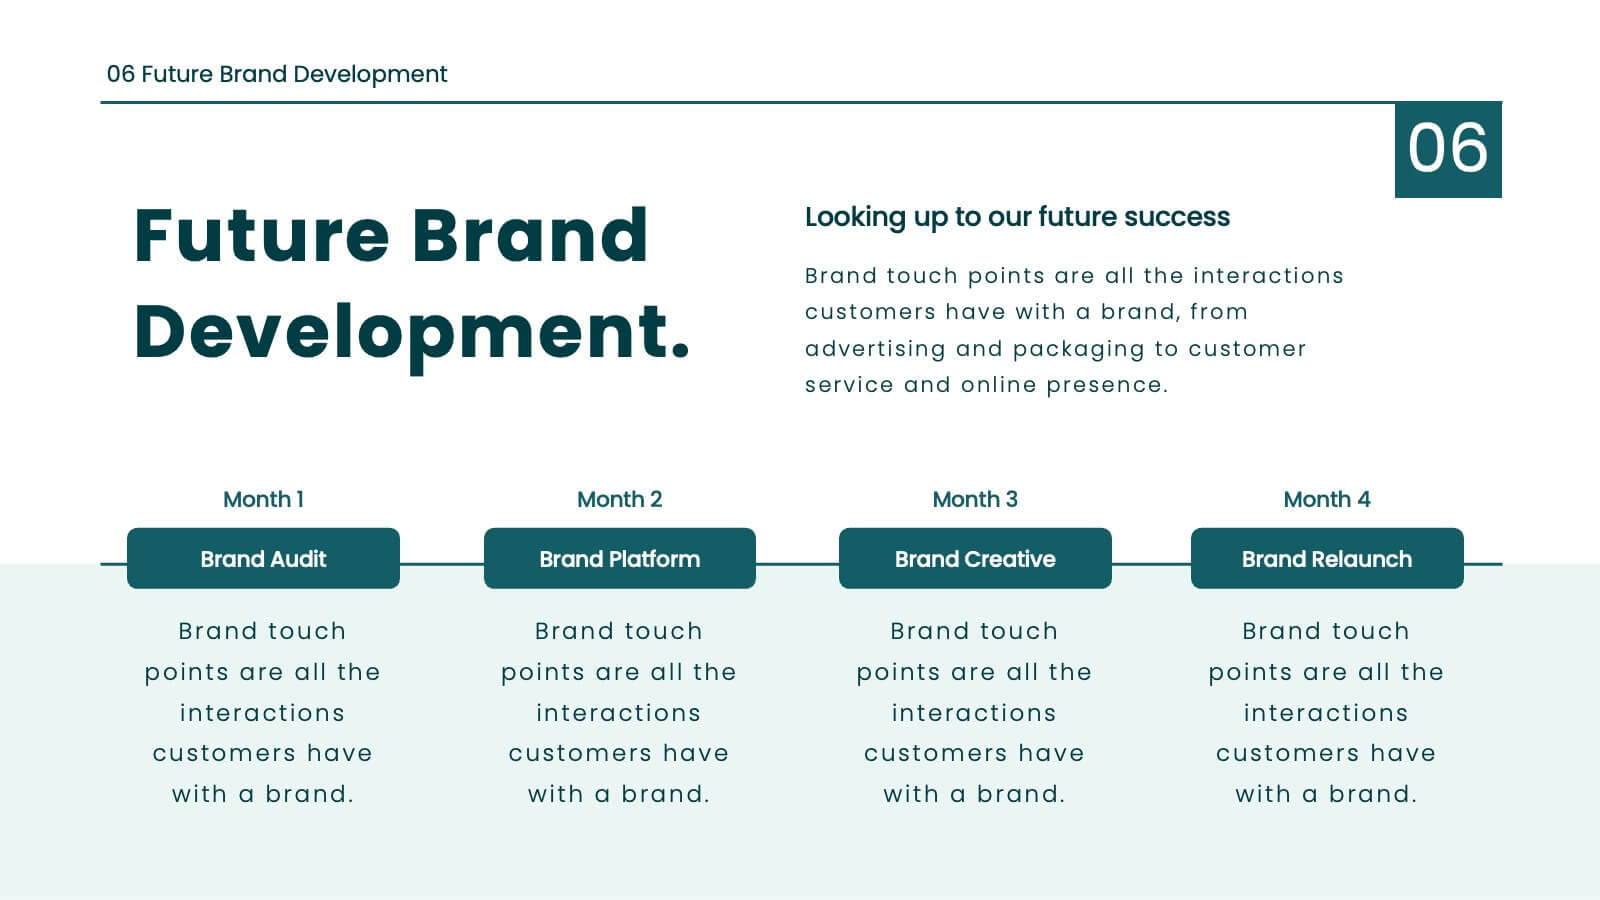
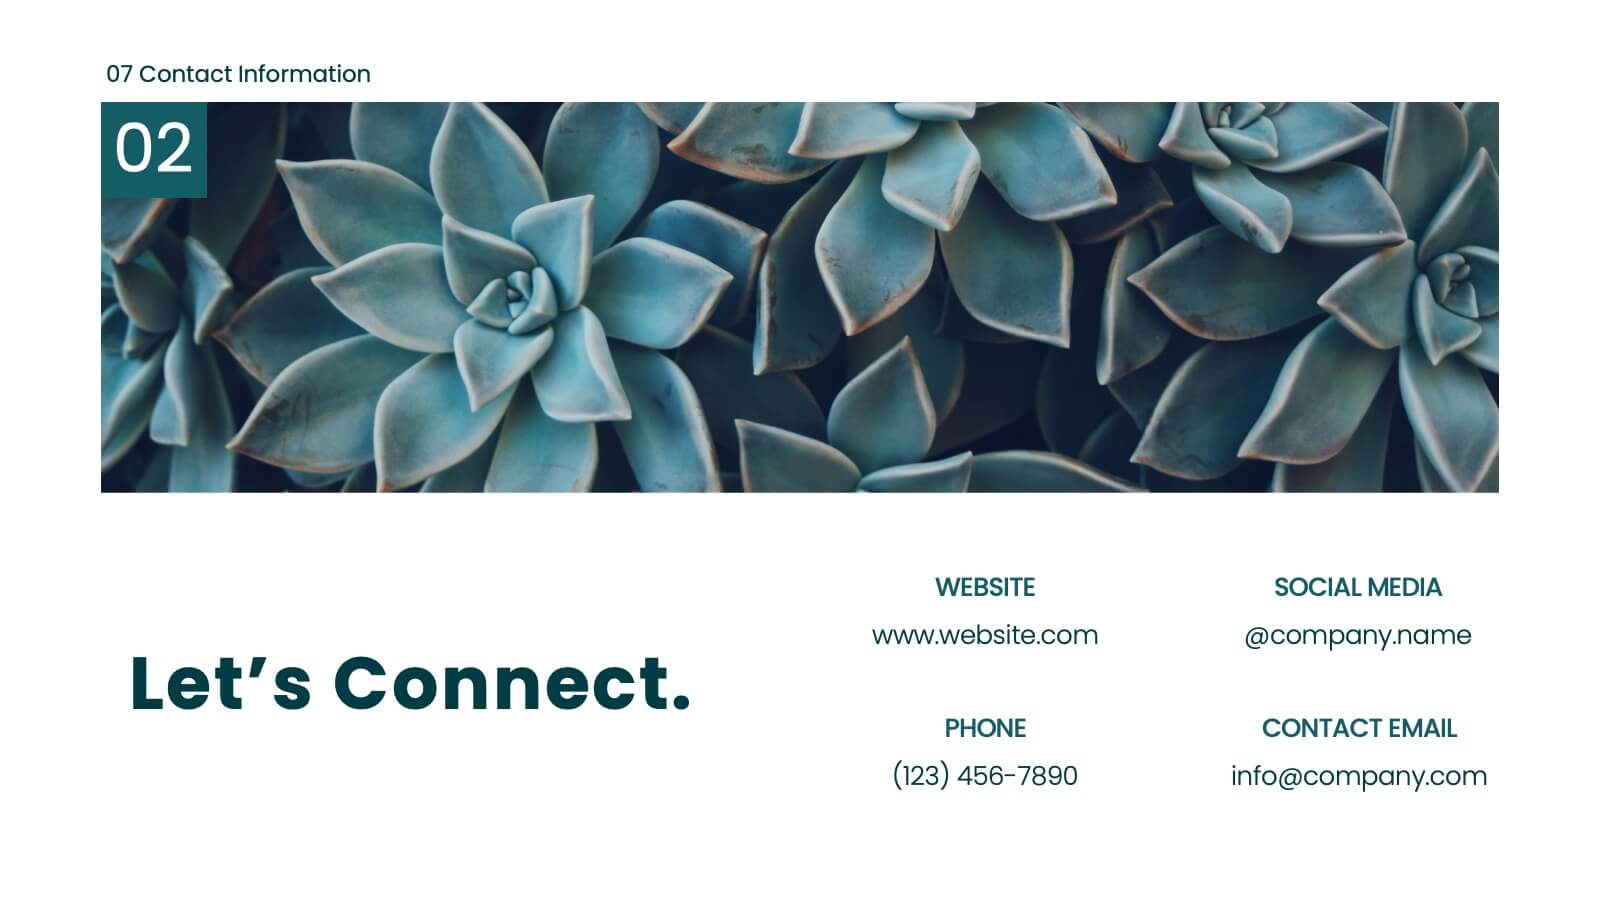
Juno Brand Guidelines Proposal Presentation
Define your brand's identity with this comprehensive, stylish presentation template. Perfect for detailing brand guidelines, vision, mission, and market analysis, it features a clean design with a professional layout. Highlight key elements like color palettes, typography, and unique selling propositions to ensure consistency and clarity. Compatible with PowerPoint, Keynote, and Google Slides, it’s ideal for any platform.


4 diapositivas
Veterinary Services and Animal Care Presentation
Deliver professional insights with compassion using the Veterinary Services and Animal Care presentation. This slide features a clean, pet-centered illustration layout ideal for showcasing services such as treatment, grooming, preventive care, and boarding. Each section includes editable icons and placeholder text, making it easy to customize for veterinary clinics, pet hospitals, or animal wellness campaigns. Fully compatible with PowerPoint, Keynote, and Google Slides.


22 diapositivas
Syncopate Agency Portfolio Presentation
Showcase your agency’s expertise and achievements with a professional portfolio presentation designed to captivate and inform. This versatile template is tailored for agencies looking to highlight their services, approach, and client success stories with clarity and impact. The presentation includes thoughtfully designed slides covering company mission, market analysis, creative processes, case studies, and future strategies. Utilize dedicated sections to detail campaign executions, partnership opportunities, and awards received. The layout balances aesthetic appeal with functionality, ensuring your audience remains engaged throughout your presentation. Compatible with PowerPoint, Google Slides, and Keynote, this template is fully customizable. Easily edit colors, text, and images to align with your agency's branding. Present your portfolio with confidence, leaving a lasting impression on clients, partners, and stakeholders.


7 diapositivas
World Map Weather Infographic
A world weather map is a graphical representation that displays current weather conditions and forecasts across different regions of the world. Unveil the world's atmospheric tapestry with our world map weather infographic template. This visually stunning and informative infographic is your passport to understanding global weather patterns, giving you a clear view of climate diversity and trends across continents. This template is designed to provide an overview of various meteorological parameters, including temperature, precipitation, wind speed and direction, humidity, and atmospheric pressure.


5 diapositivas
Types of Diabetes Infographics
Knowing the types of diabetes is very important for effective treatment, risk assessment, prevention, education, and research. Our Types of Diabetes Infographics provide information about the different types of diabetes. These infographics are designed to present key facts, statistics, and illustrations to help educate and raise awareness about the various forms of diabetes. They include vertical sections on symptoms, risk factors, diagnosis, treatment options, and prevention strategies. This can be a useful resource for individuals seeking to understand diabetes and promote awareness about the different forms of the condition.


7 diapositivas
Service Finance Infographic
Service finance refers to the management of financial resources, transactions, and strategies within the service industry. This infographic template ensures that the services provided are financially sustainable, meet customer needs, and contribute to the overall growth and success of the organization. Fully customizable and compatible with Powerpoint, Keynote, and Google Slides. Showcase the dynamics that drive the financial world, uncovering the core elements of the ecosystem. This infographic will encourage action and invite your audience to embrace a financial renaissance, soaring towards their prosperous future.


5 diapositivas
Mind and Brain Creativity Concept Diagram Presentation
Ignite fresh thinking with the Mind and Brain Creativity Concept Diagram Presentation—a smart and visually engaging template that maps out five core concepts around a central brain icon. Each idea is linked with intuitive visuals and labeled A through E, ideal for creative strategy, innovation pitches, or mental model breakdowns. Fully customizable in PowerPoint, Keynote, and Google Slides.


5 diapositivas
Eco-Friendly Practices Implementation Presentation
Brighten your message with a clean, circular design that maps out every green initiative step-by-step. This visual template illustrates key eco-conscious actions, helping you present sustainable practices with ease. Perfect for environmental reports, team strategies, or policy pitches. Fully compatible with PowerPoint, Keynote, and Google Slides for flexible editing.


5 diapositivas
End-to-End Value Chain Map Presentation
Bring clarity to complex operations with a smooth, visual flow that makes every stage of your process easy to follow. This presentation maps activities from start to finish, helping teams understand dependencies, improve efficiency, and spot opportunities for optimization. Fully compatible with PowerPoint, Keynote, and Google Slides.


5 diapositivas
Human Capital Planning Overview Presentation
Streamline workforce strategies with the Human Capital Planning Overview Presentation. This structured template helps visualize talent development, succession planning, and HR workflows in clear, step-by-step layouts. Perfect for HR leaders, consultants, and executives. Fully editable in PowerPoint, Keynote, and Google Slides for seamless customization to match your team or organization.


20 diapositivas
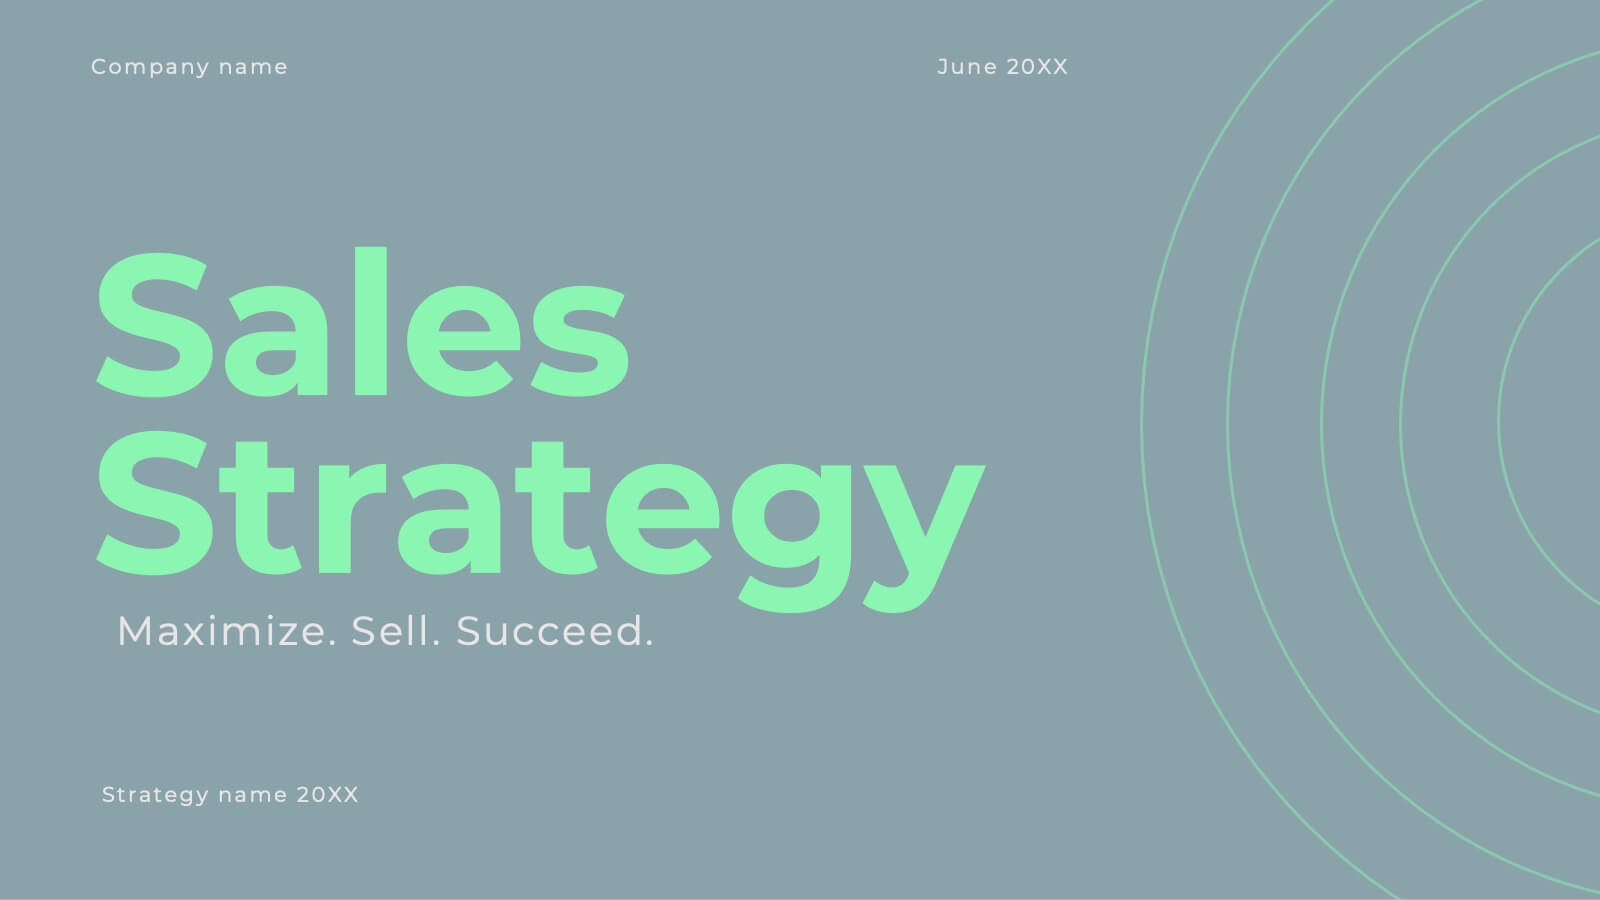
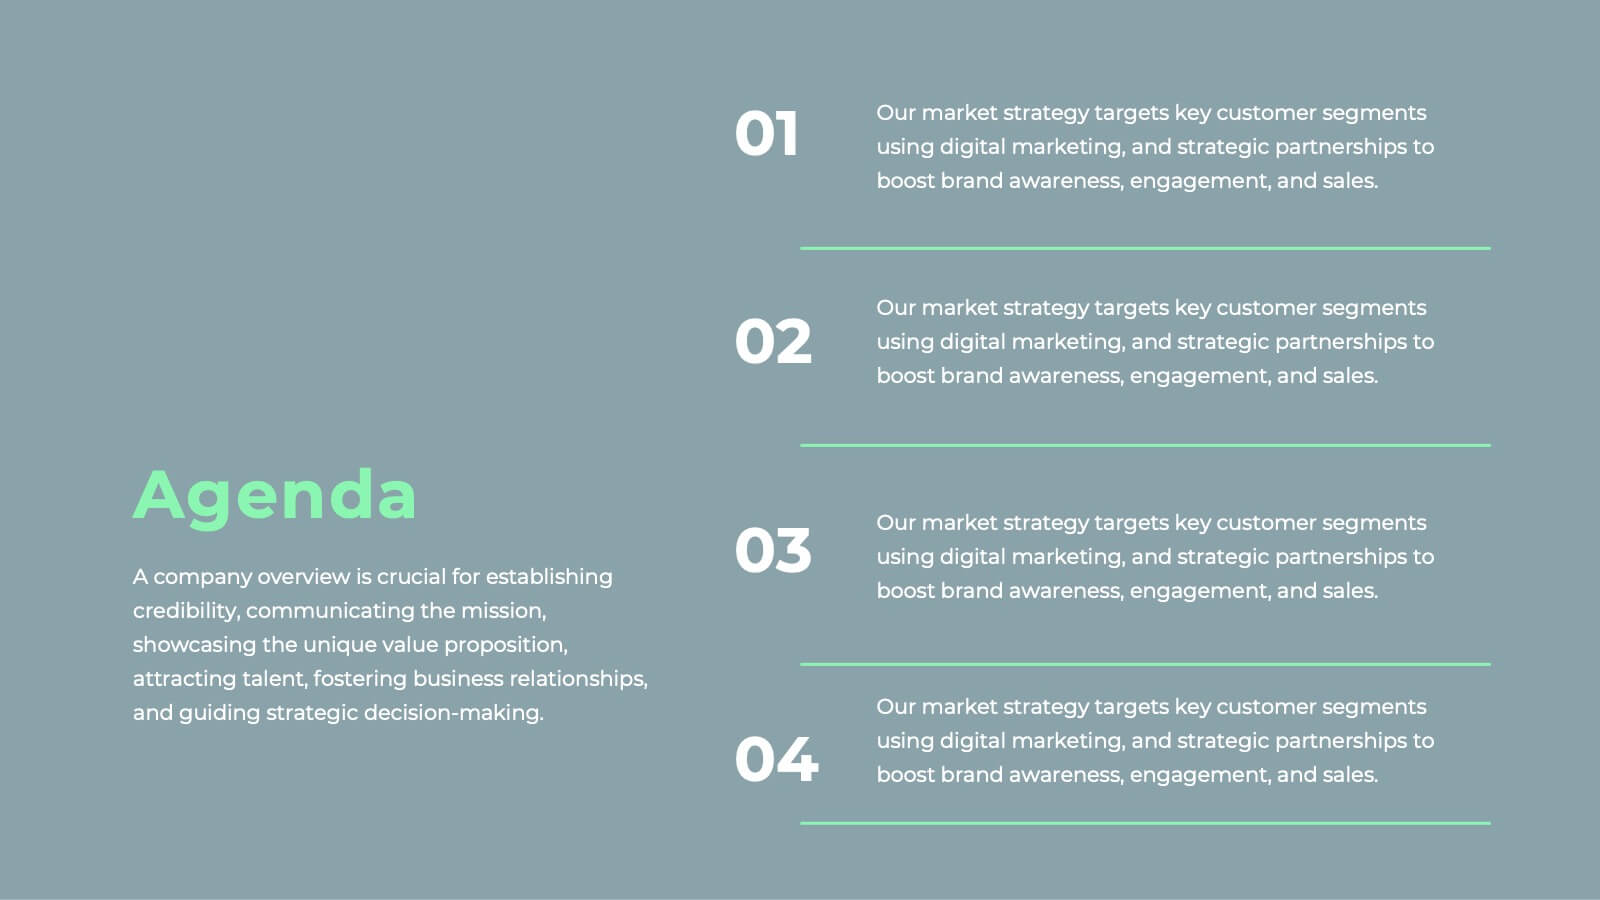
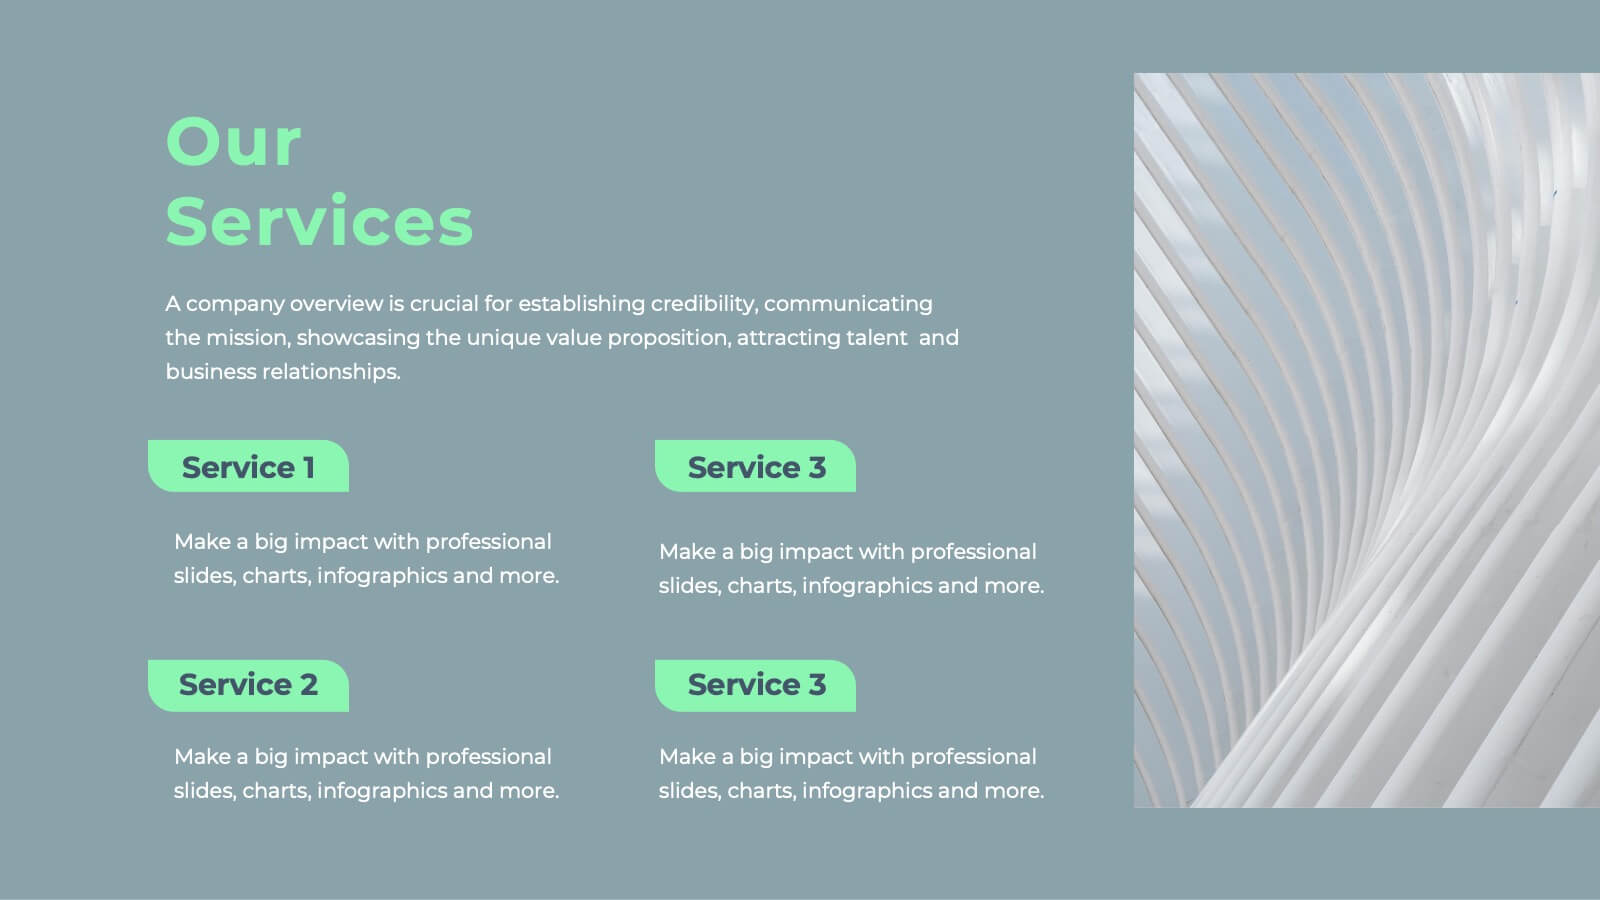
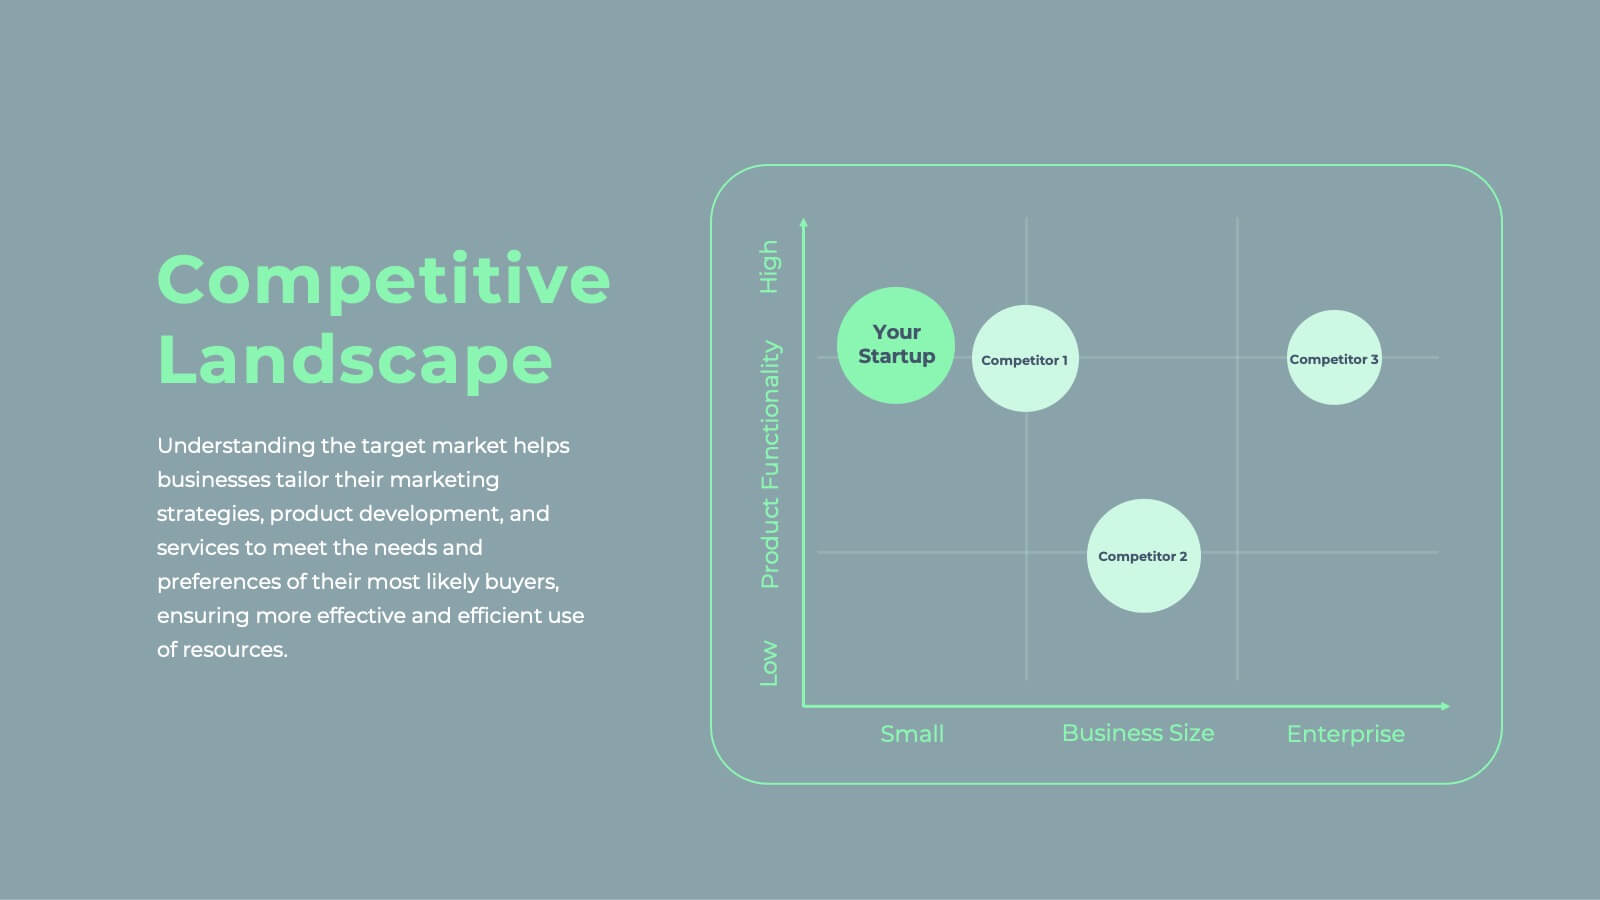
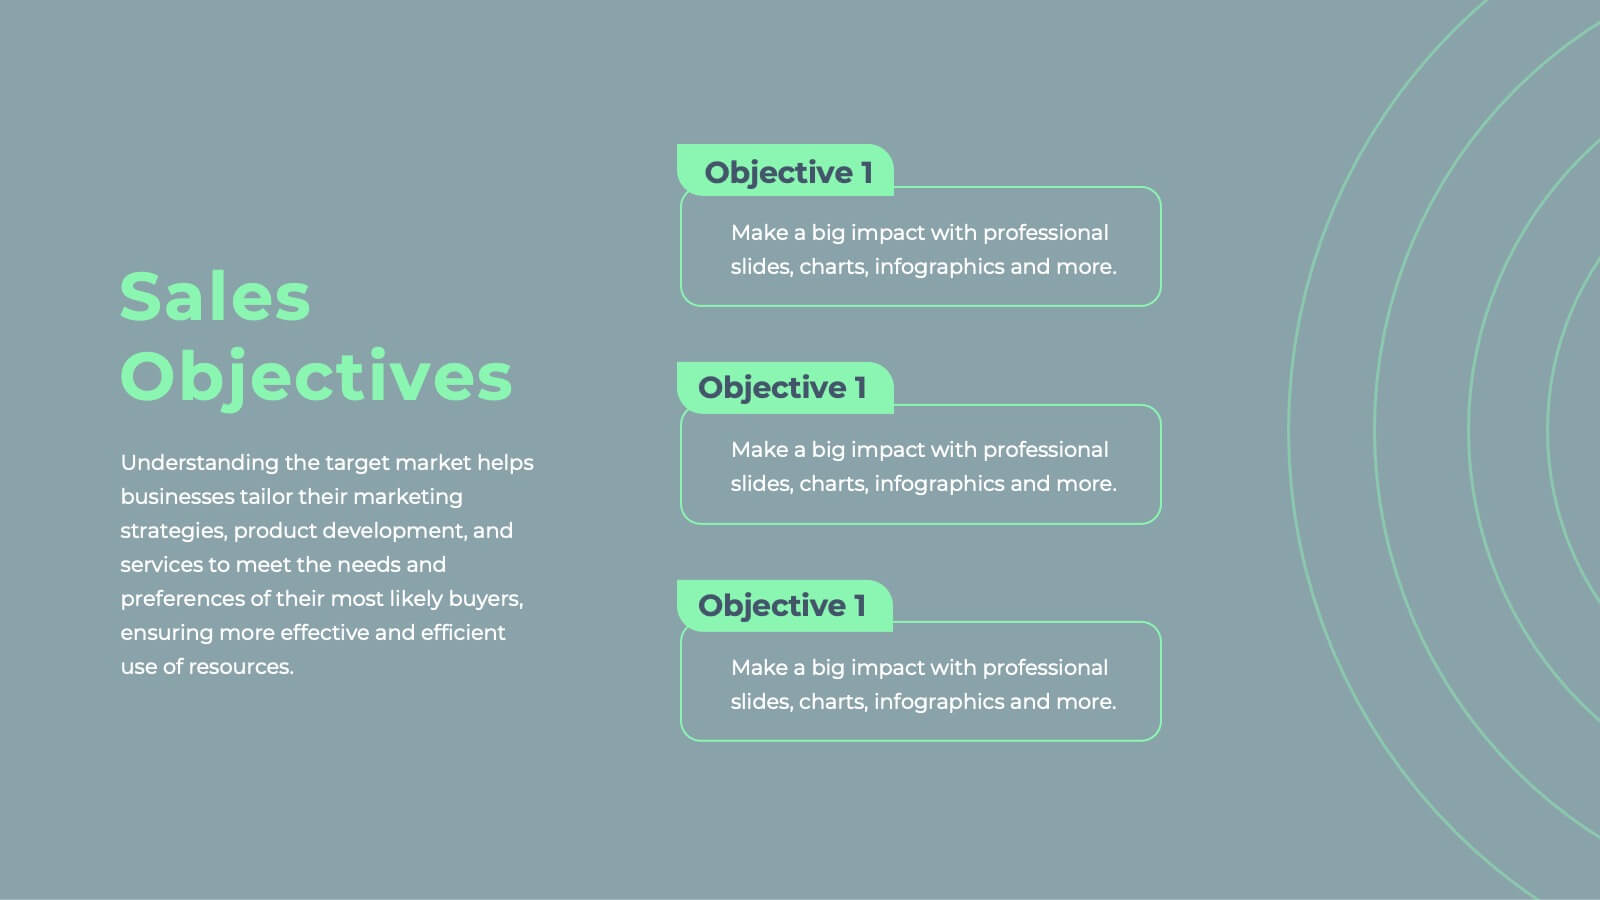
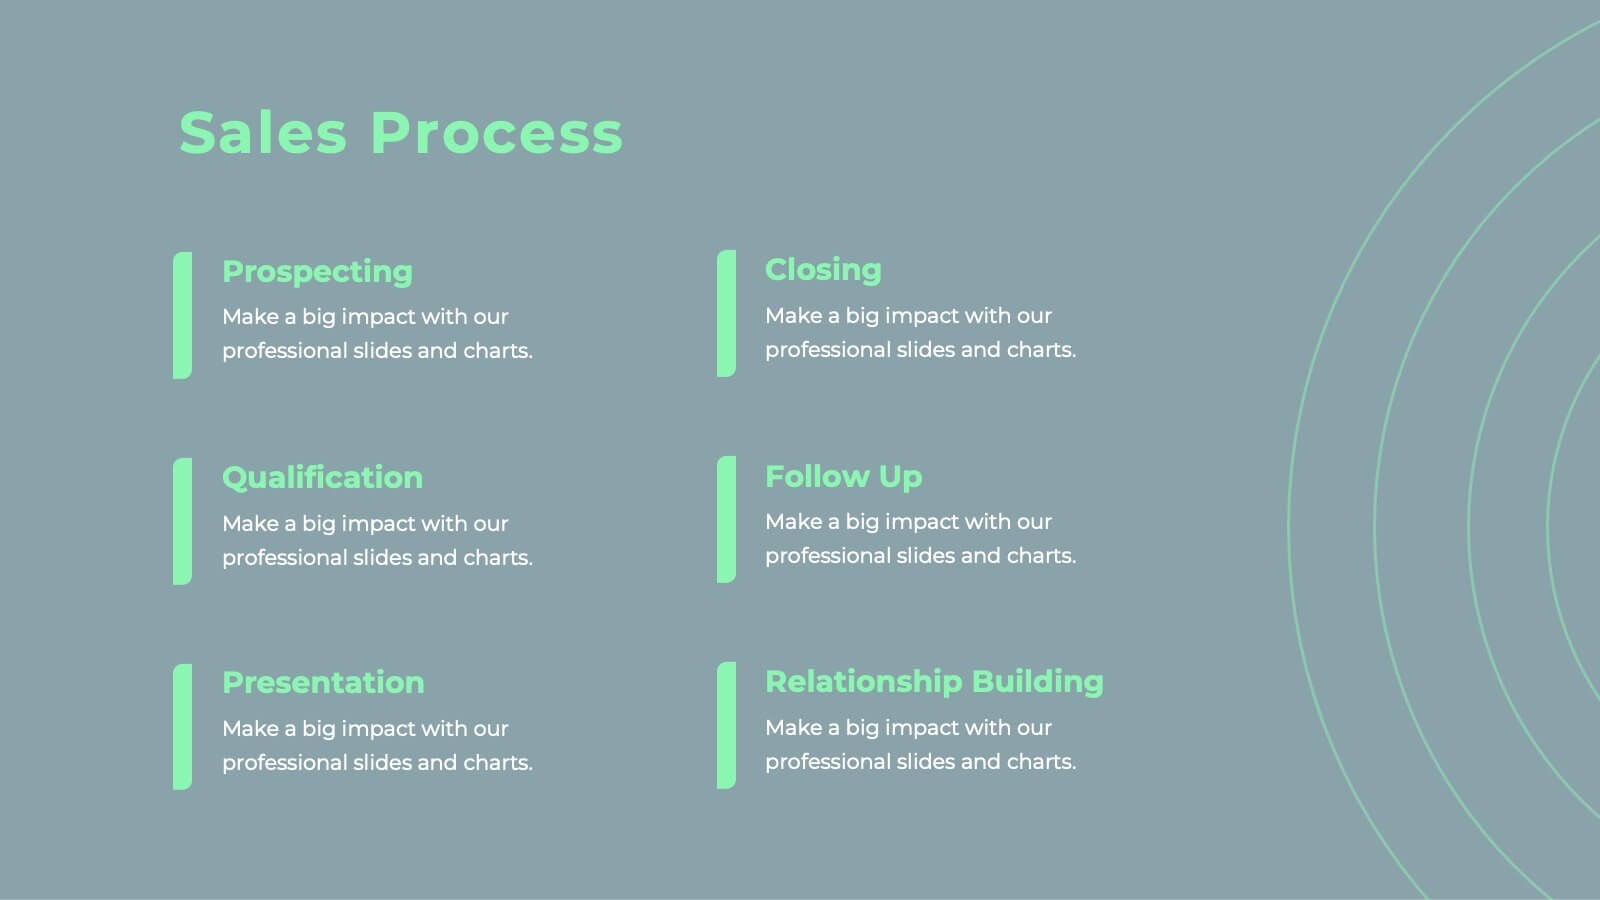
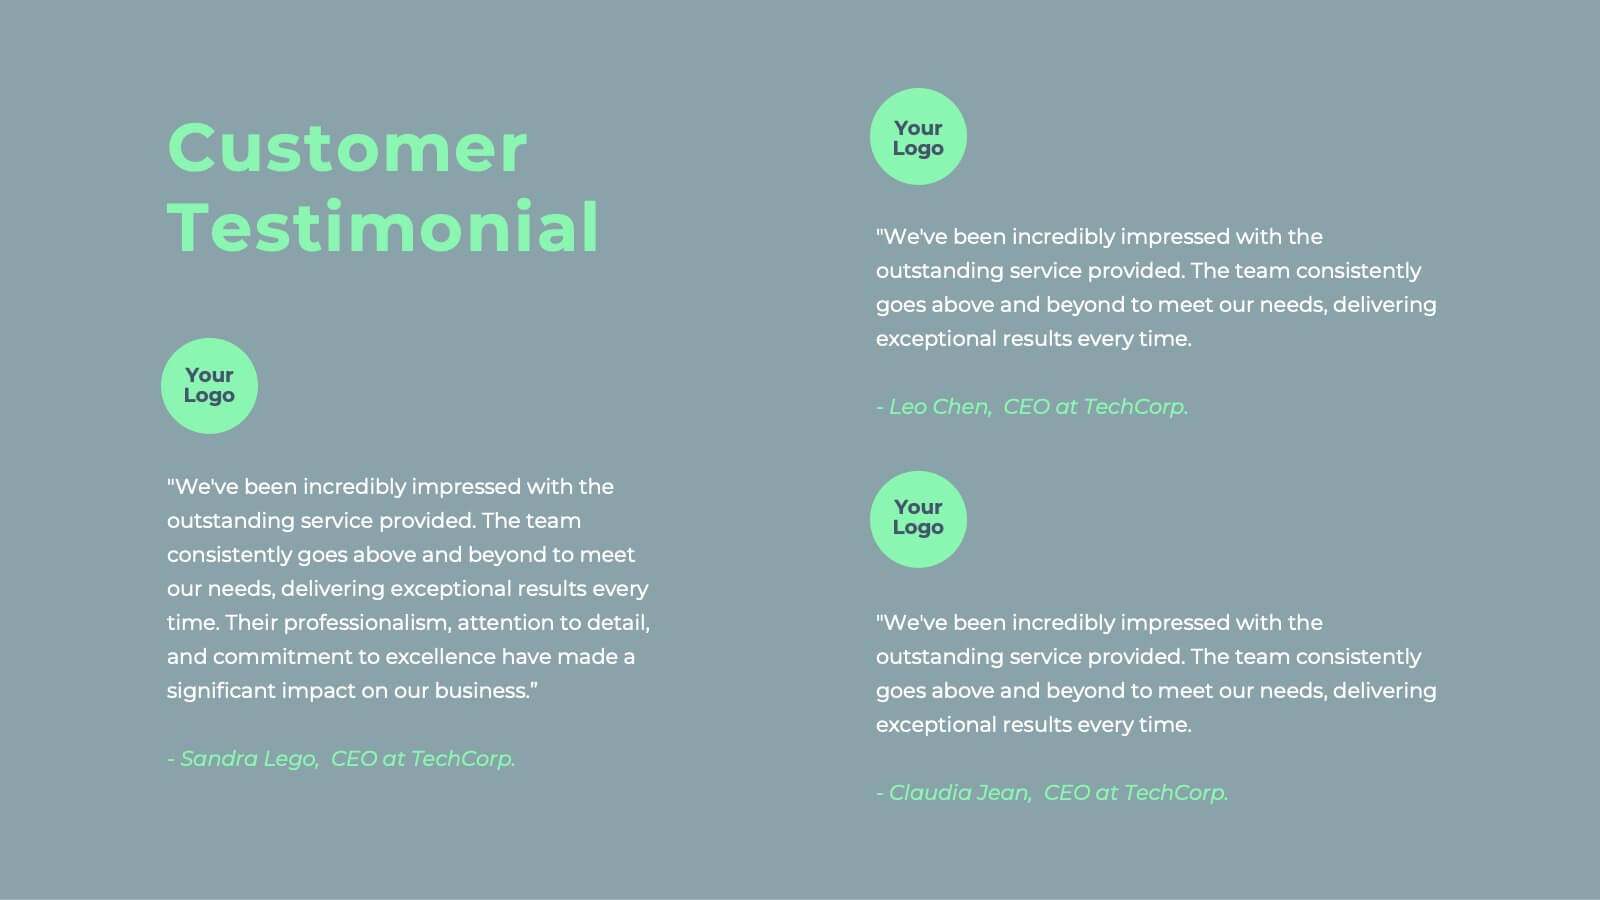
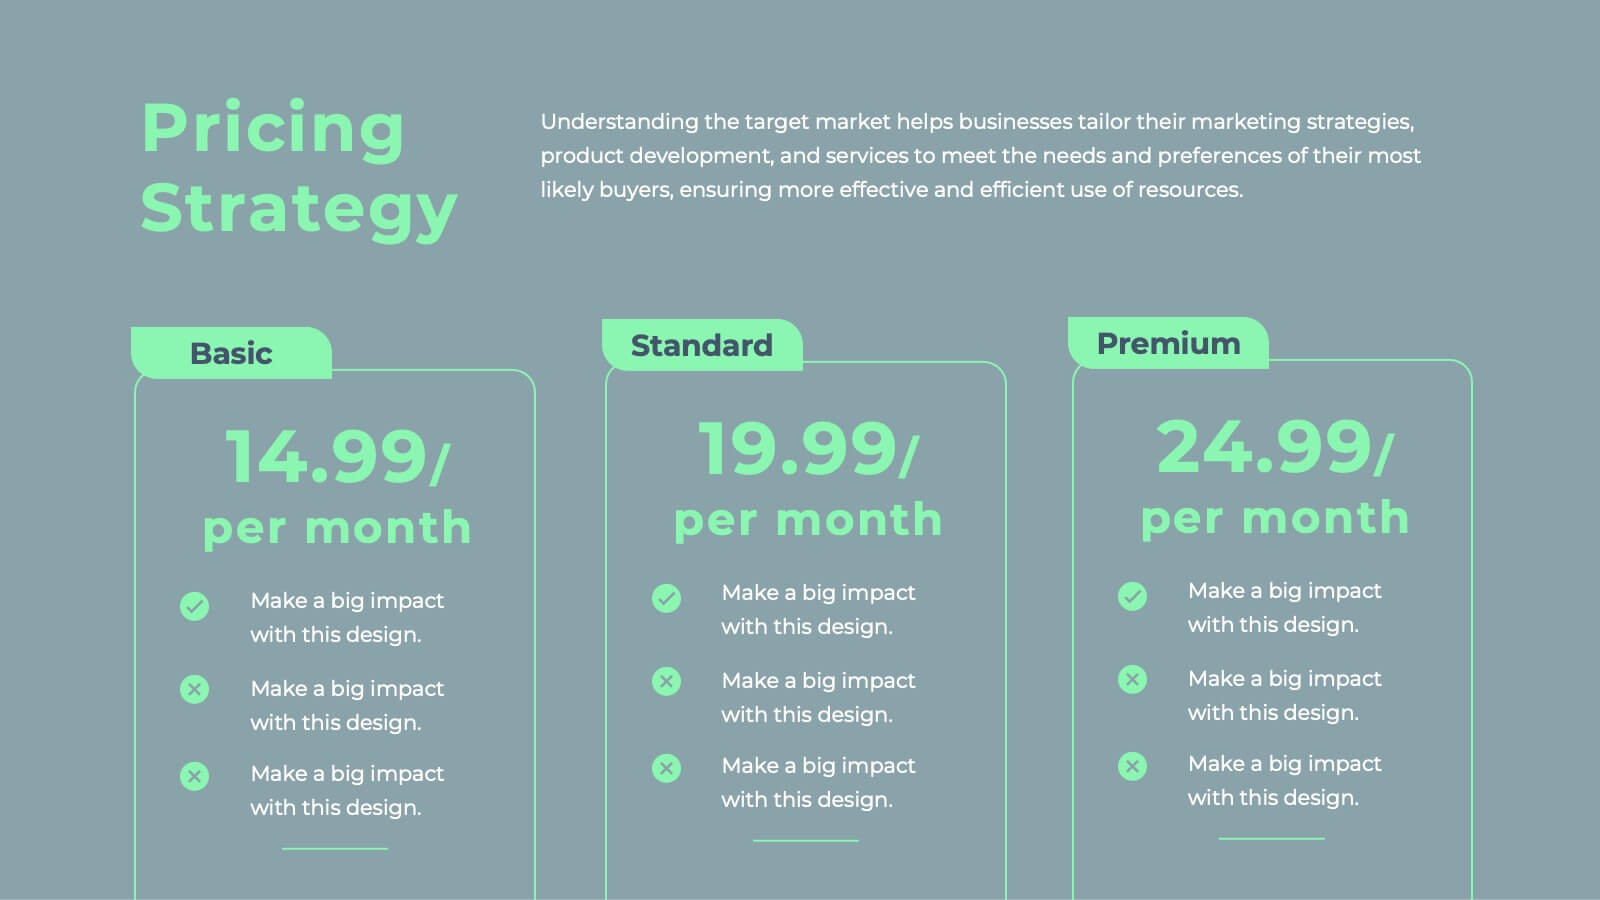
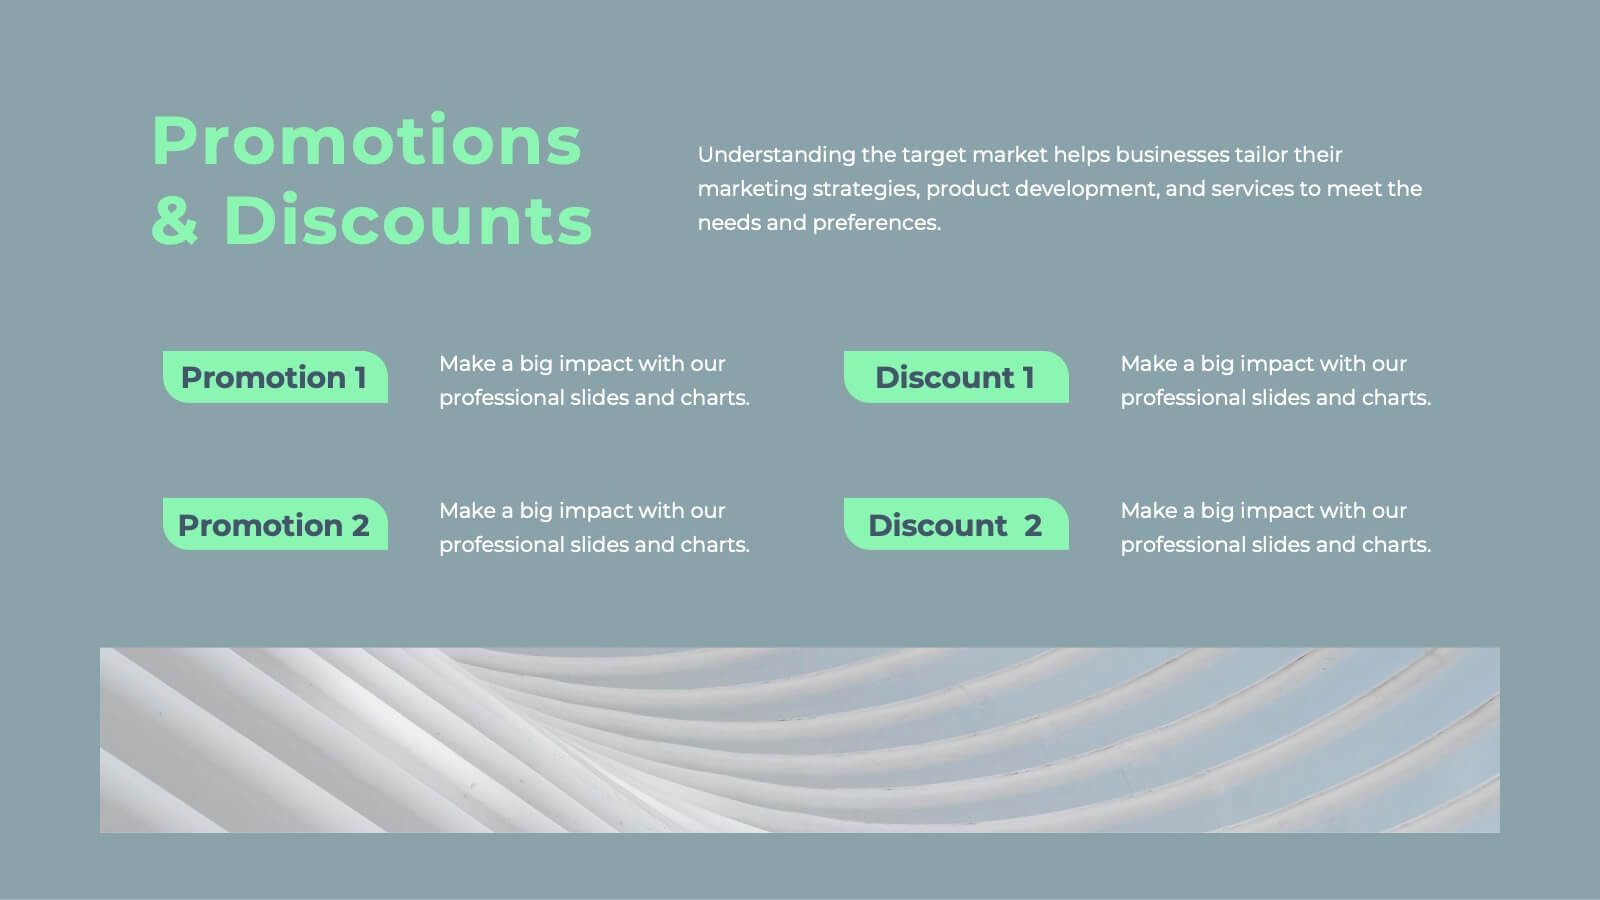
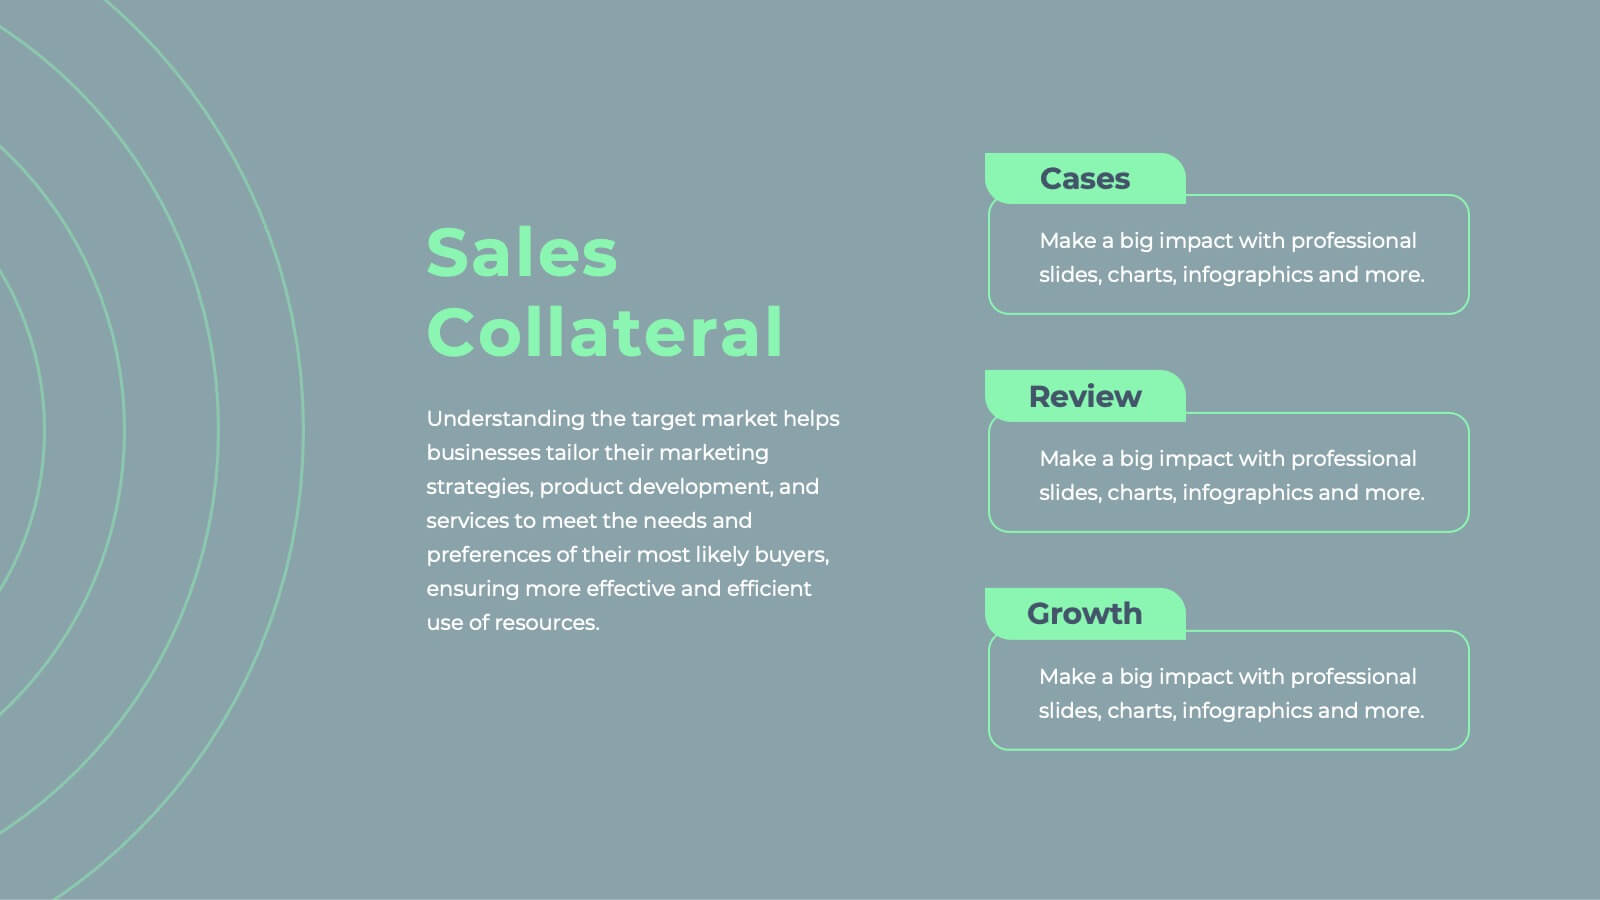
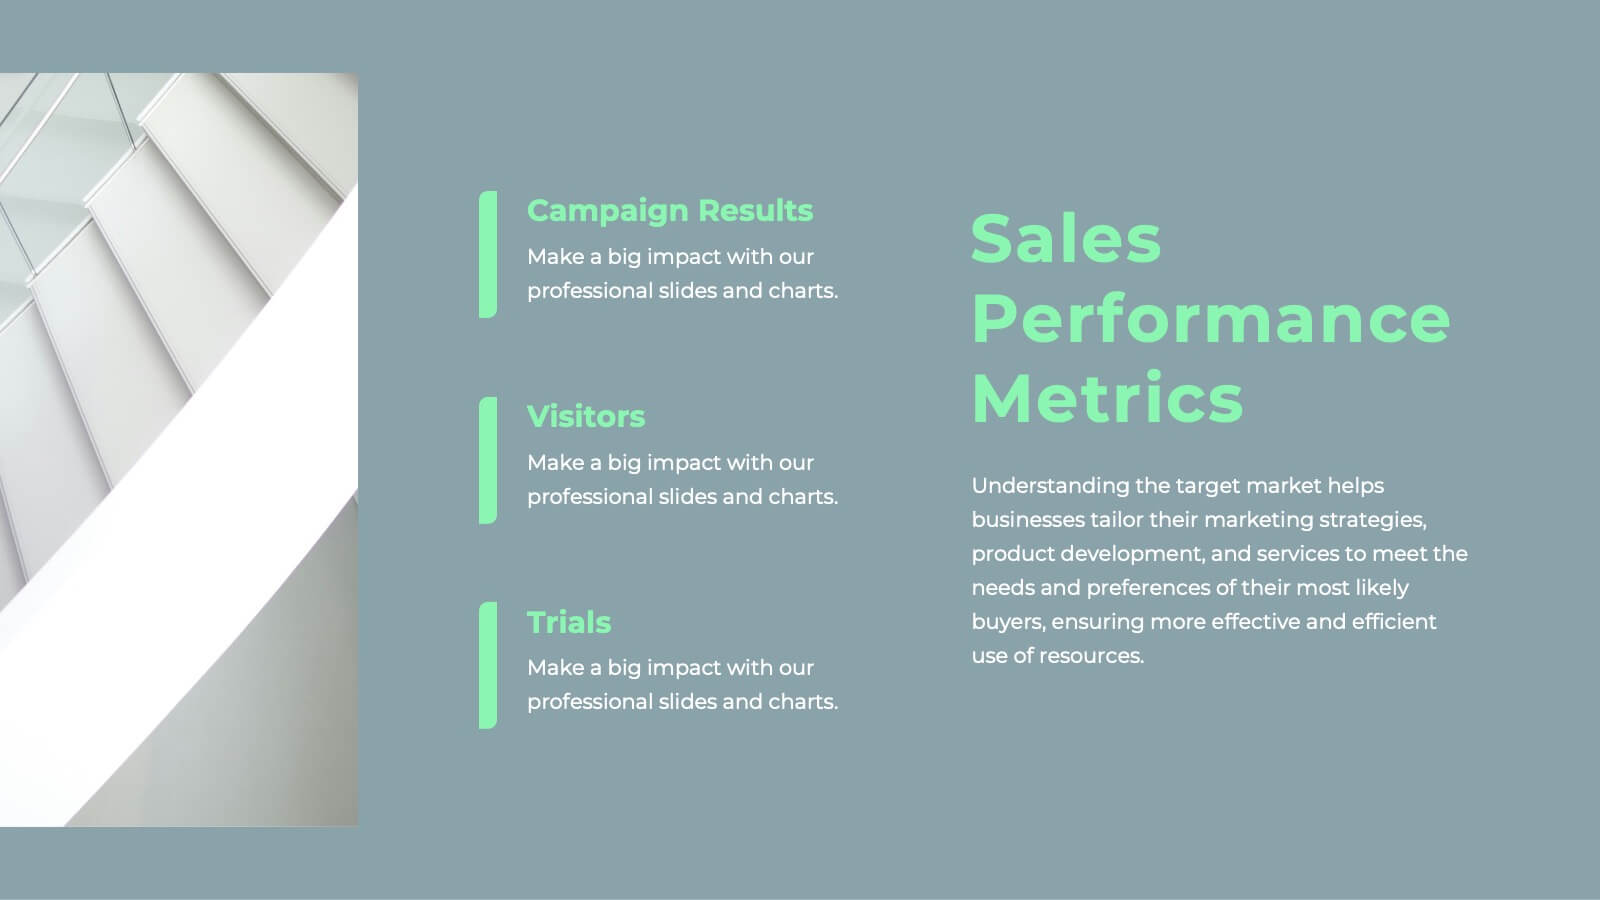
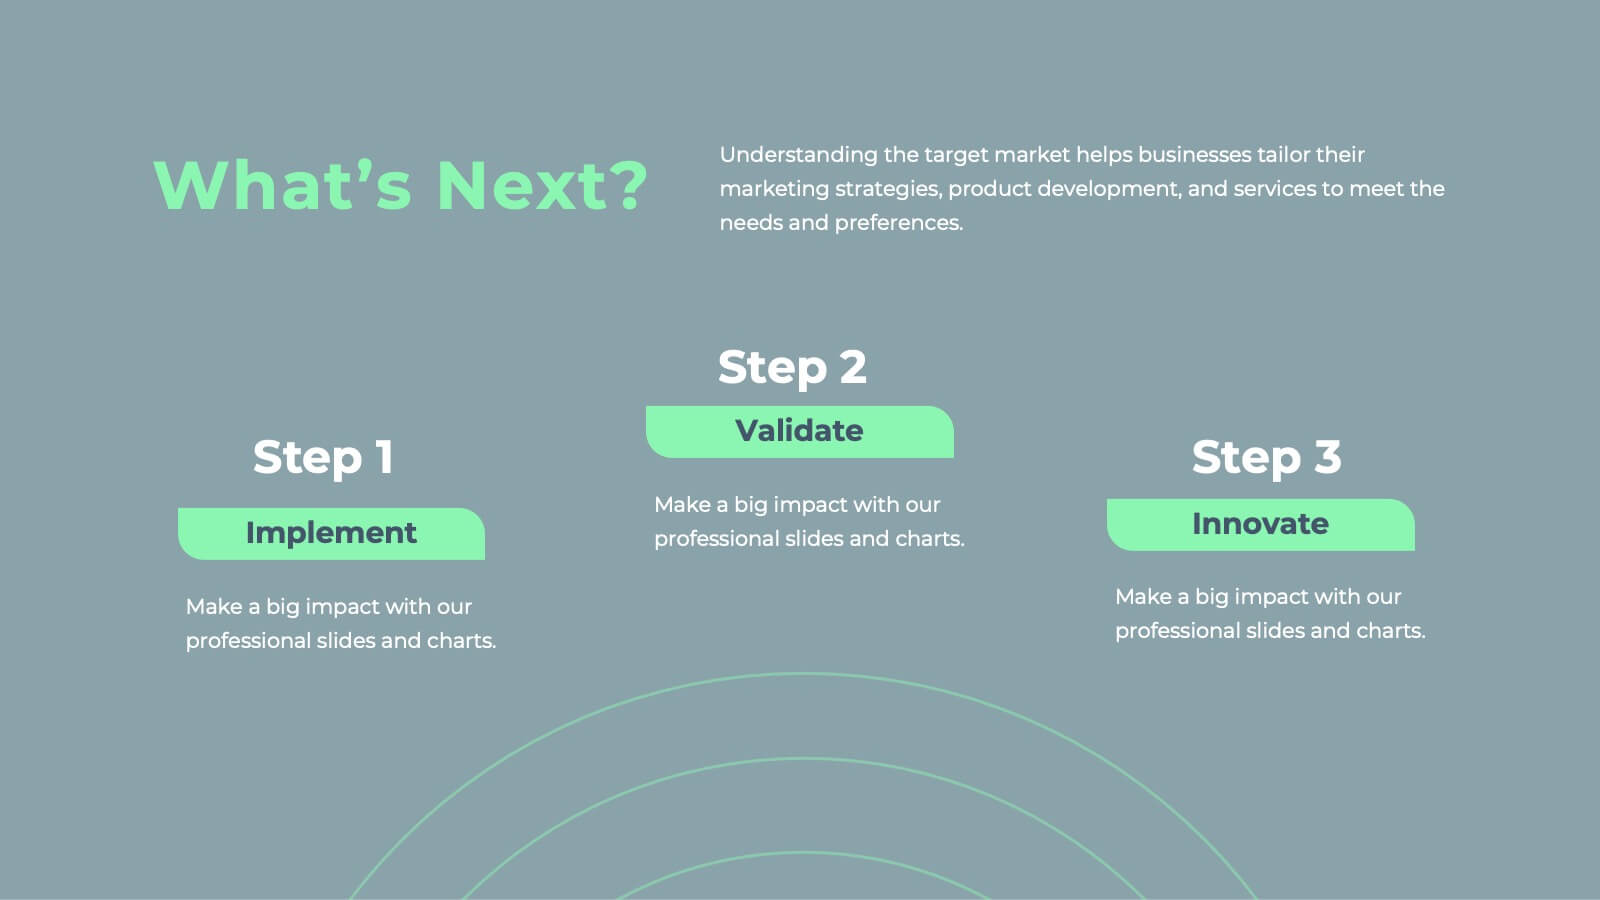
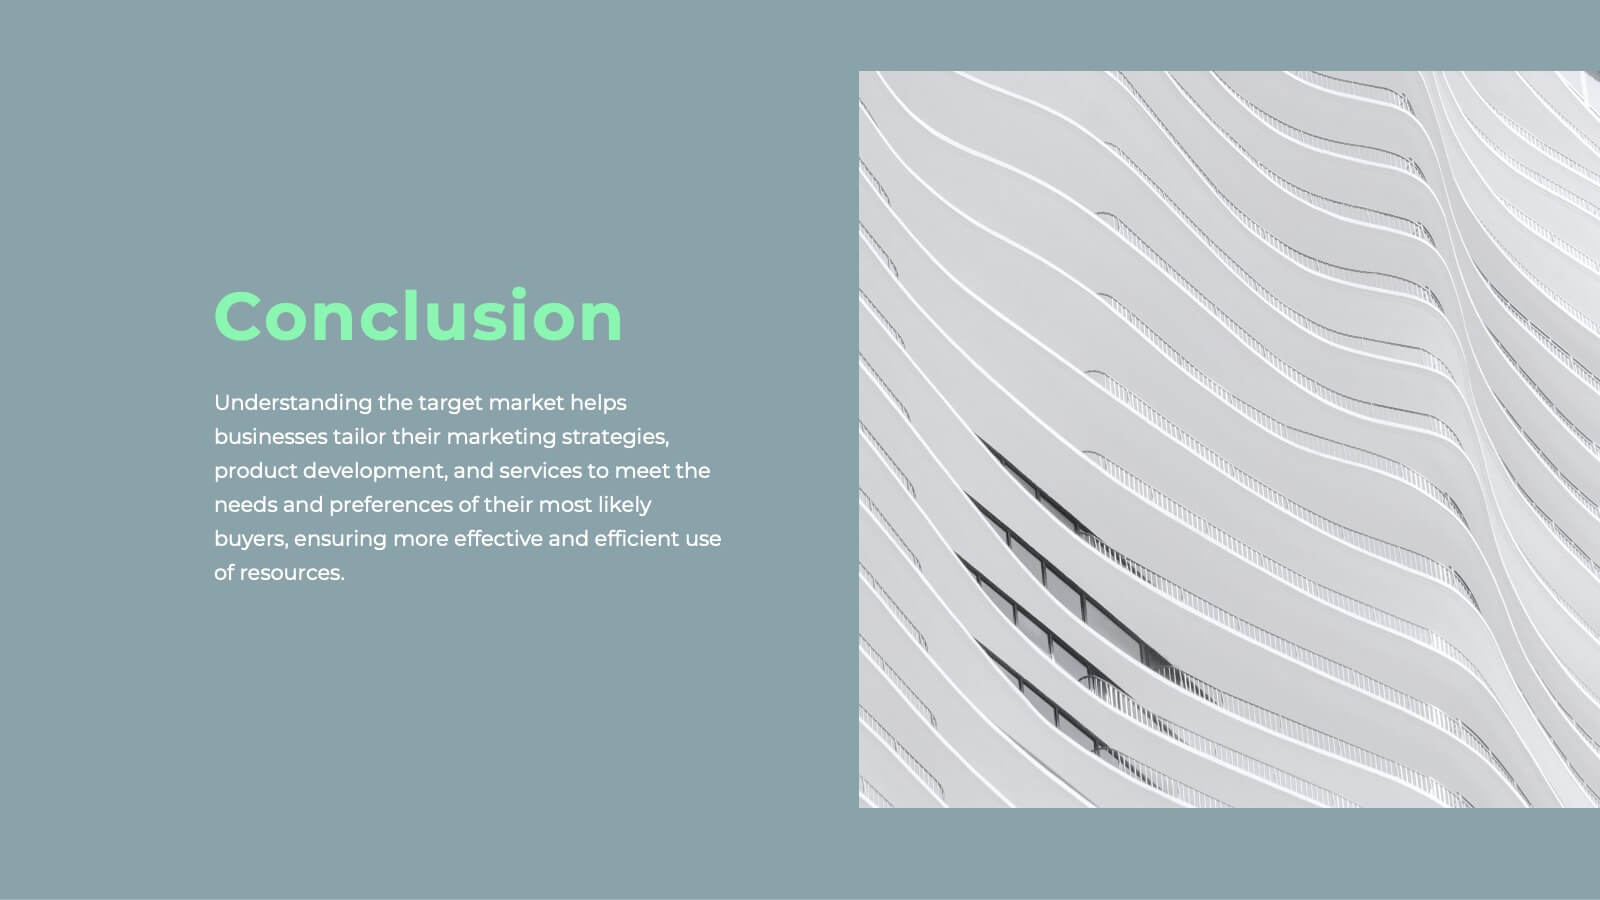
Javelin Sales Strategy Presentation
Boost your sales strategy with this sleek template! Perfect for outlining objectives, processes, performance metrics, and future opportunities. Tailored for impactful presentations to clients and teams. Fully customizable and compatible with PowerPoint, Keynote, and Google Slides.


6 diapositivas
Corporate Profiles Layout Presentation
Bring your business story to life with a clean, modern layout that makes every detail feel polished and professional. This presentation is designed to showcase company highlights, key services, and essential profile information with clarity and impact. Fully editable and easy to customize in PowerPoint, Keynote, and Google Slides.


7 diapositivas
Short Term Goals Infographic Presentation
Short-term Goals are important because they provide a clear focus and direction for individuals or organizations to achieve their long-term objectives. Get started on your goals in no time with this template. It is professional, clean and has everything you need to create a presentation. It's a good choice for career advancement and pitches. This template is designed to help your audience visualize the impact of your goals. Use this template as a base to brainstorm your vision and objectives with your team. The goal-oriented design will bring awareness and create excitement about your goals.


6 diapositivas
Multi-Layer Diagram Presentation
Illustrate Complex Processes with Ease using this Multi-Layer Diagram Presentation template. Designed for business strategies, IT architectures, data structures, and organizational hierarchies, this layered diagram helps break down multi-step processes in a clear and structured way. Fully customizable and available for PowerPoint, Keynote, and Google Slides, this template ensures your message is both impactful and visually appealing.


5 diapositivas
Big Data Analytics Process Presentation
Visualize your data journey with this clean and professional slide layout. Featuring four circular icons around a central cloud graphic, it’s ideal for showcasing data collection, processing, analysis, and storage. Perfect for tech briefings or analytics teams. Fully editable and compatible with PowerPoint, Keynote, and Google Slides.


6 diapositivas
IT Architecture Diagram Presentation
Turn complex system structures into clear visual stories with this professional presentation. Perfect for mapping processes, software layers, or organizational workflows, it helps communicate how technology components connect and operate. Fully editable and compatible with PowerPoint, Keynote, and Google Slides for seamless customization and engaging technical presentations.