


Características


¿Tienes alguna pregunta?
Recomendar


7 diapositivas
Customer Question for Support Infographic
Step into the spotlight with our vibrant Infographic Template, where every inquiry is a star! Designed to dazzle, this template offers a show-stopping way to address customer queries with flair and precision. Imagine vibrant backdrops and playful fonts that turn ordinary support interactions into captivating visual stories.Tailor-made for businesses eager to shine in customer service, this template transforms FAQs into eye-popping, memorable visuals. Whether it’s tech glitches, product how-tos, or service details, your answers will not only be seen—they’ll be remembered. Customize to fit your brand’s personality, deploying colors and styles that resonate with your audience.Ideal for help centers, product support pages, or digital kiosks, it makes customer support not just helpful, but spectacularly engaging. Ready for use with popular graphic design tools, it’s your backstage pass to standing ovations in customer care.


22 diapositivas
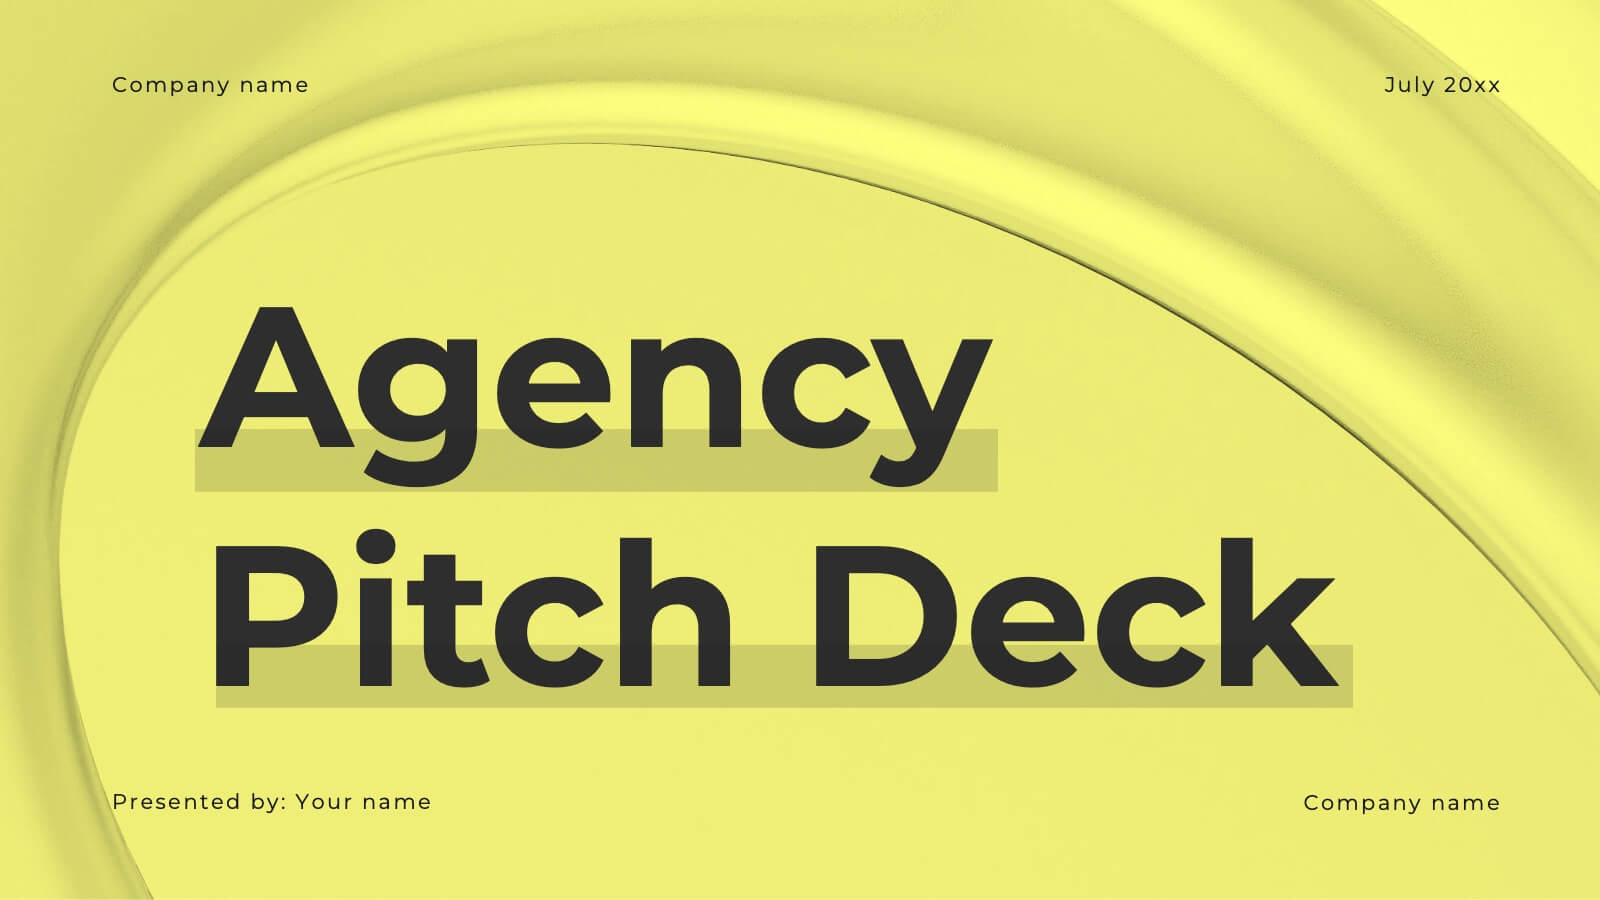
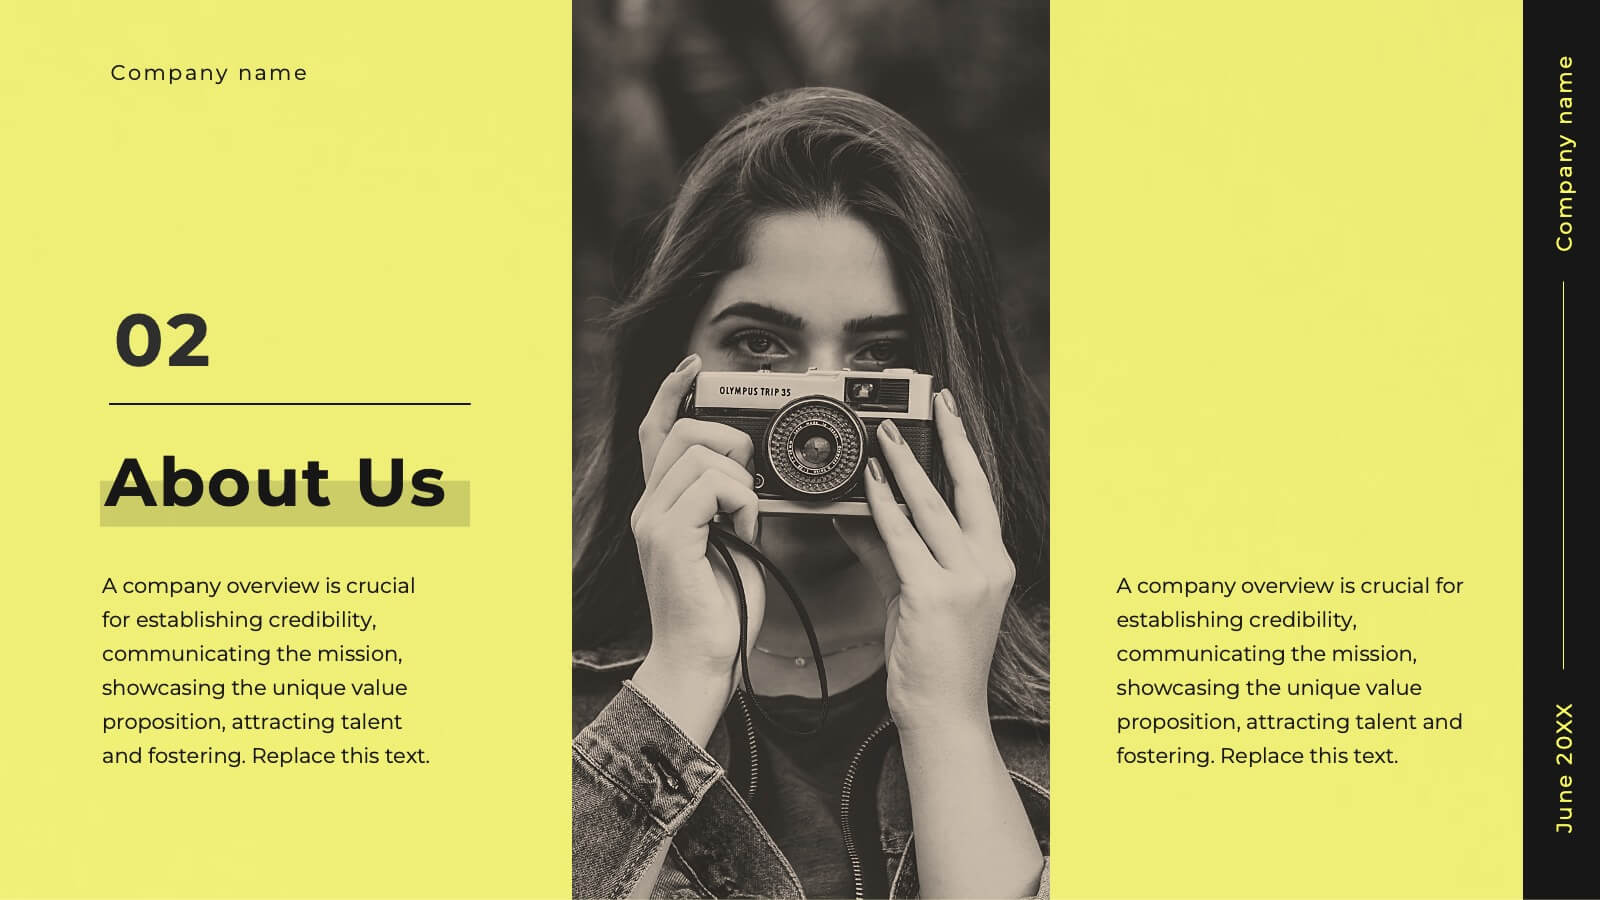
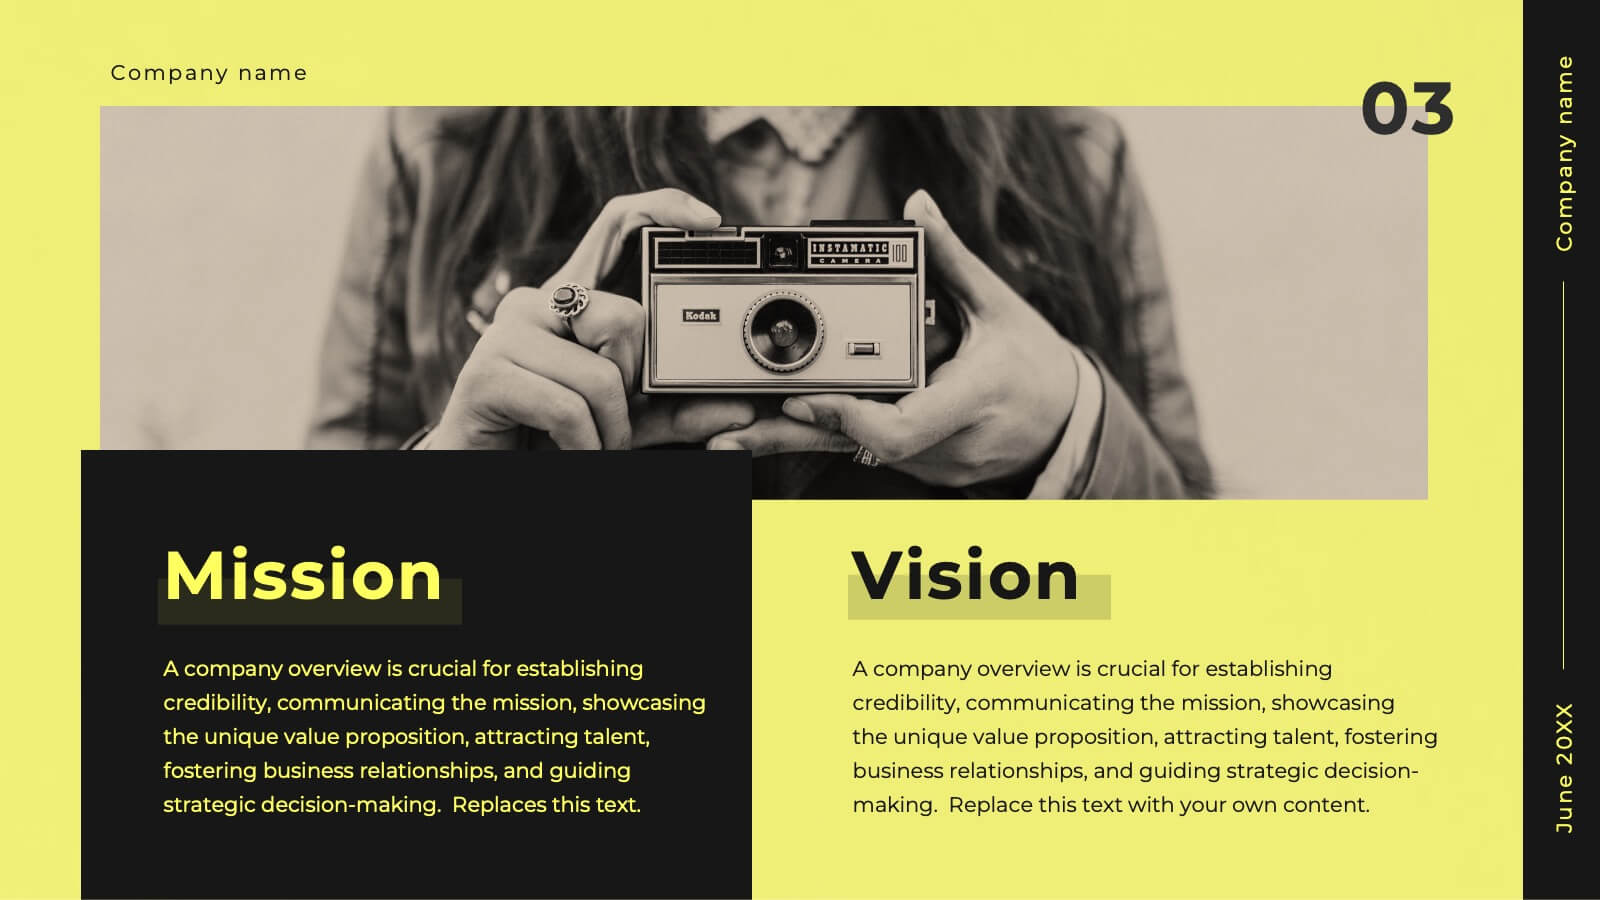
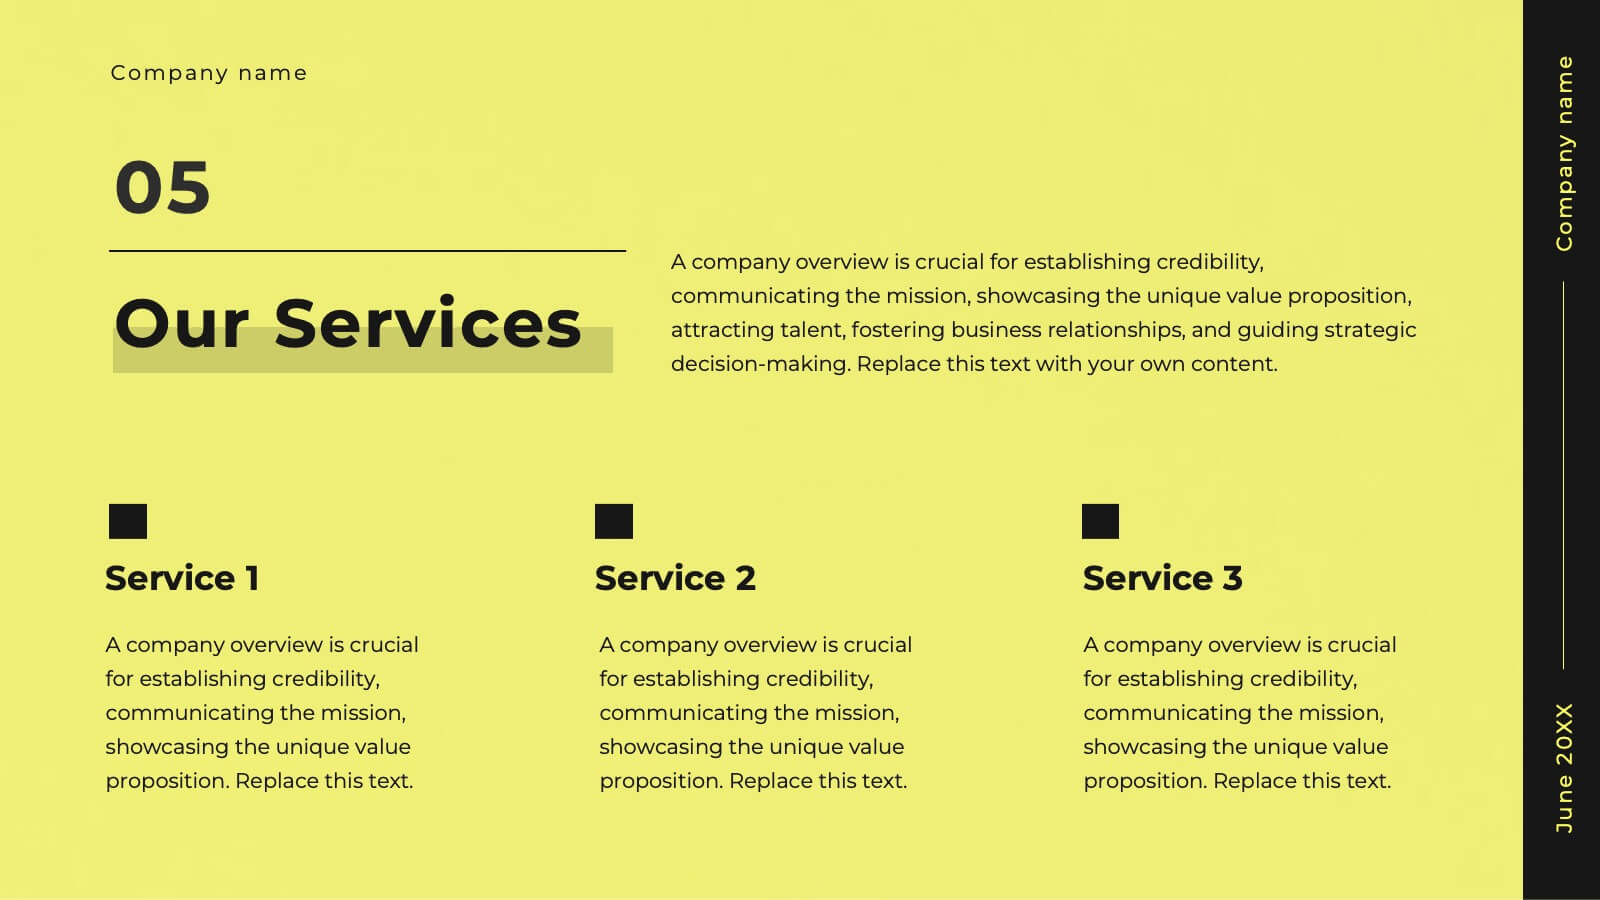
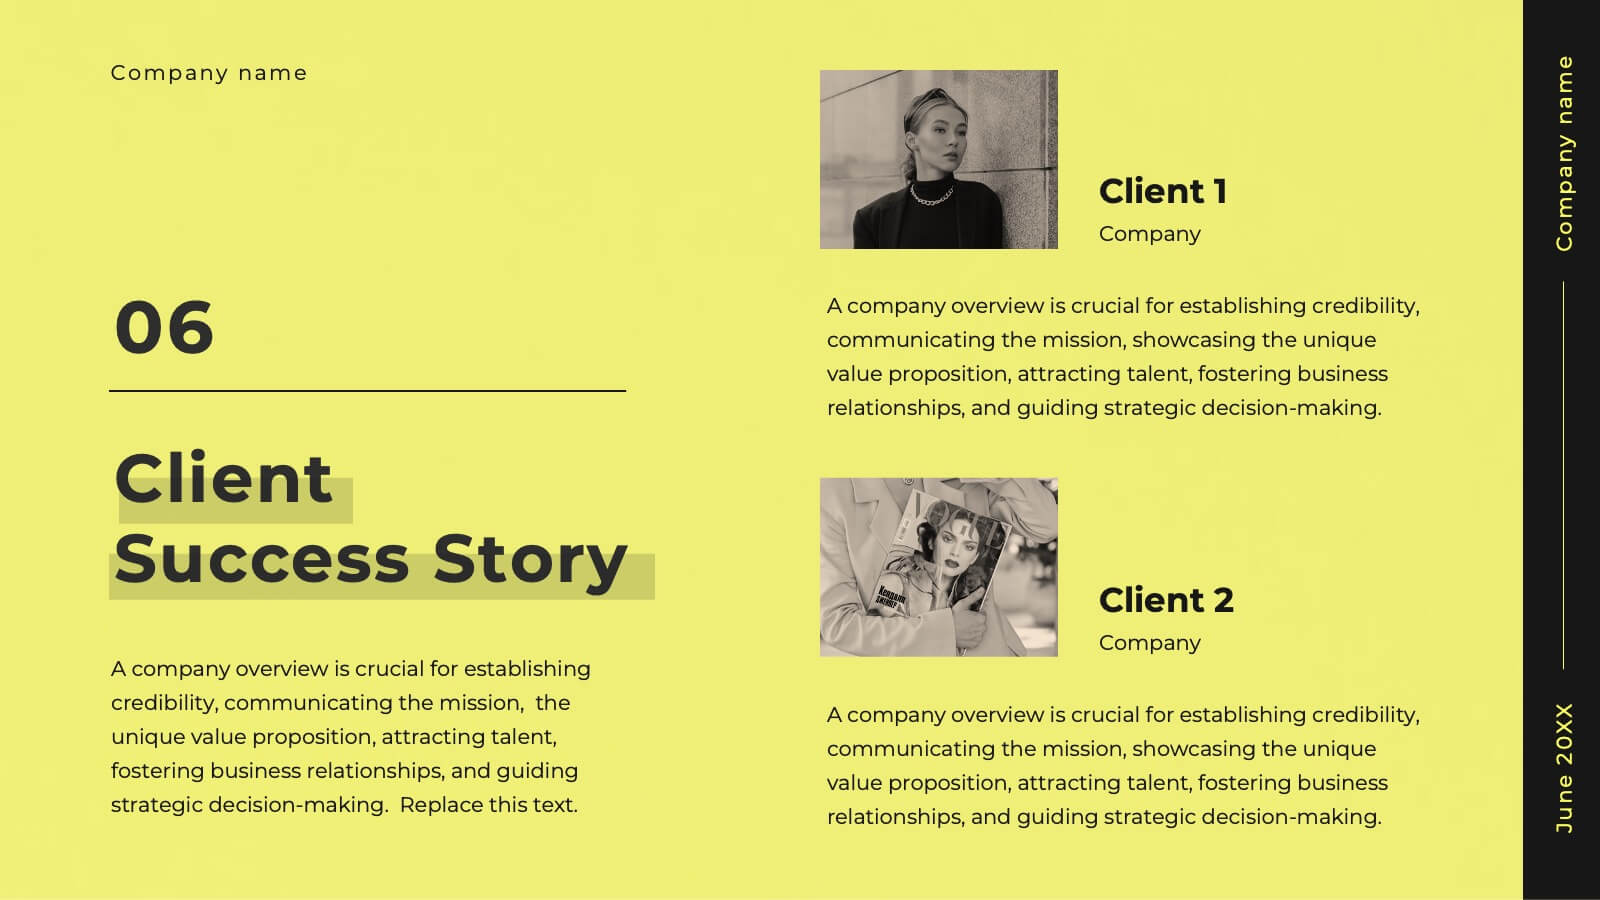
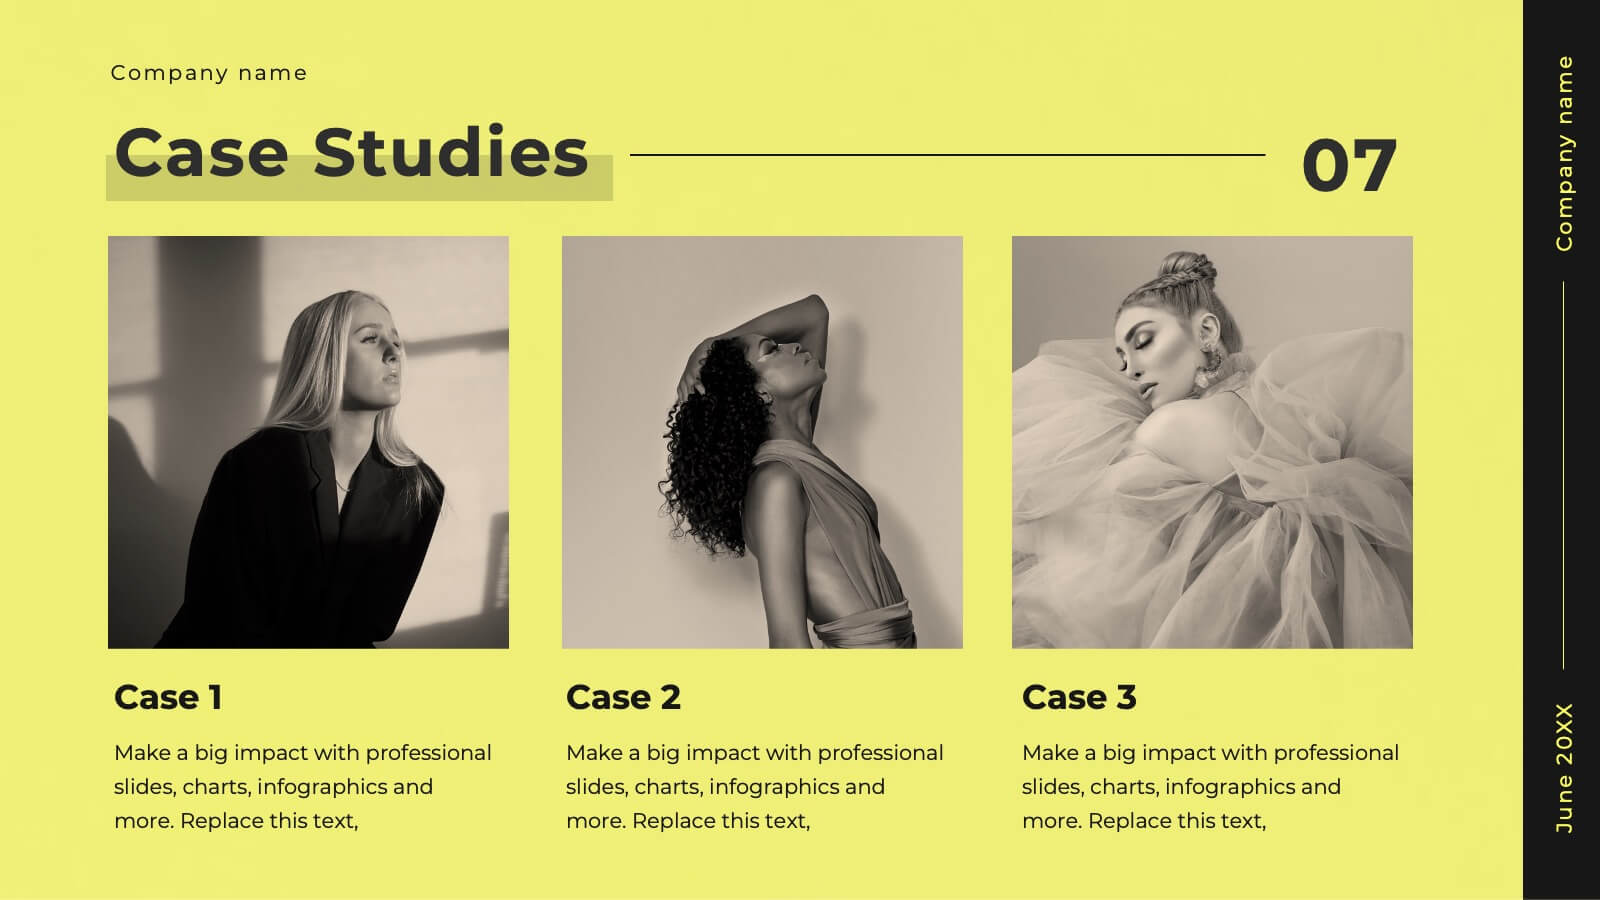
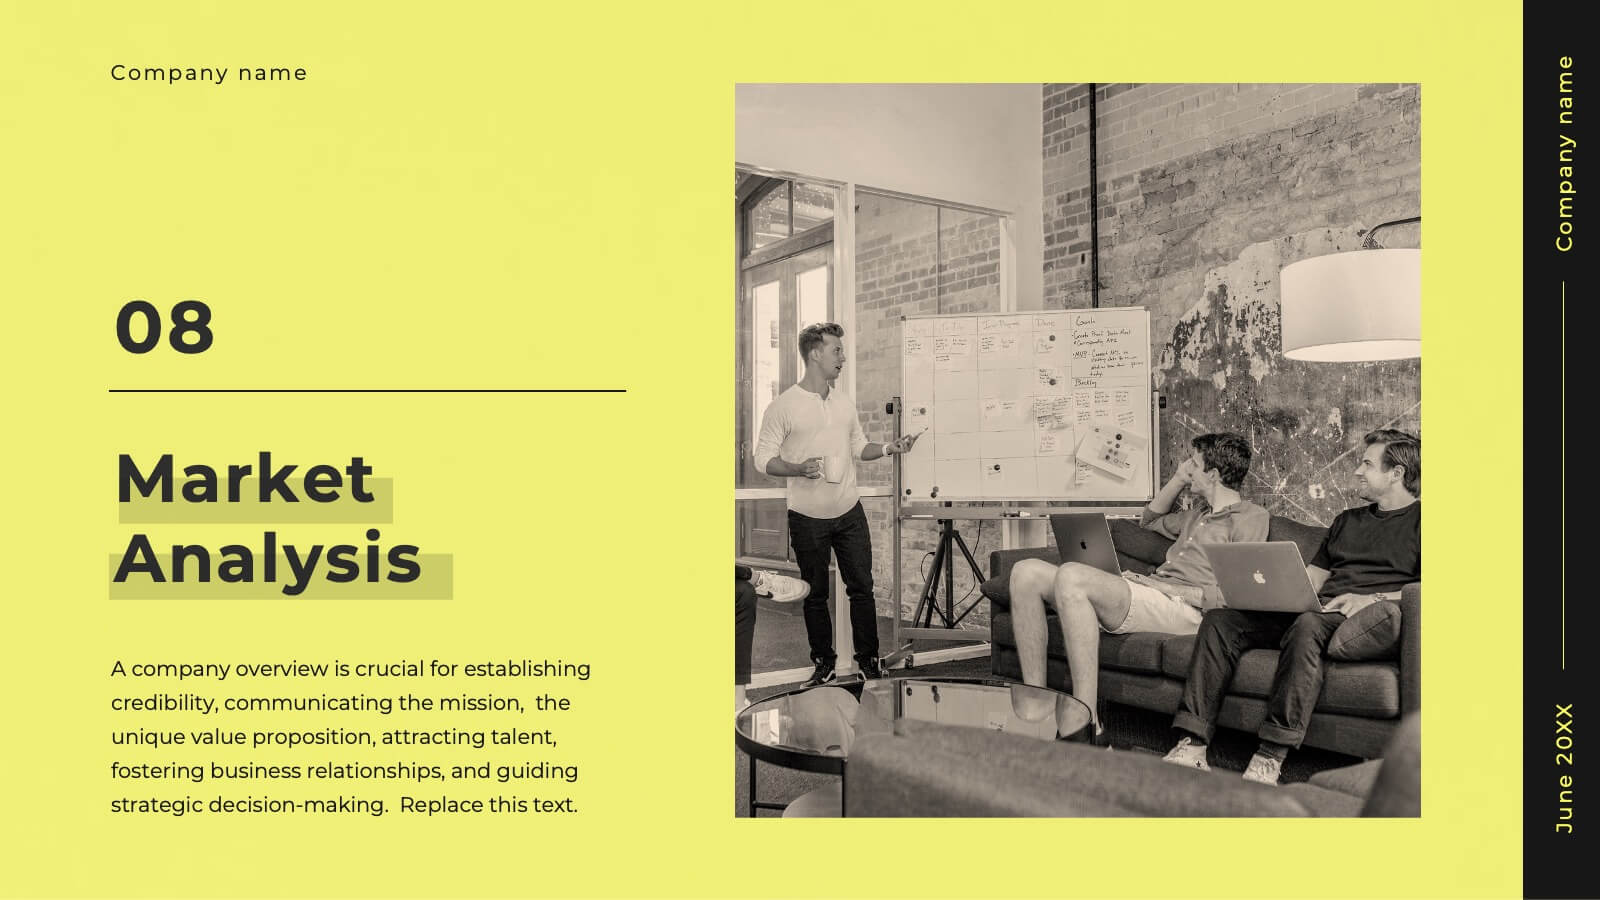
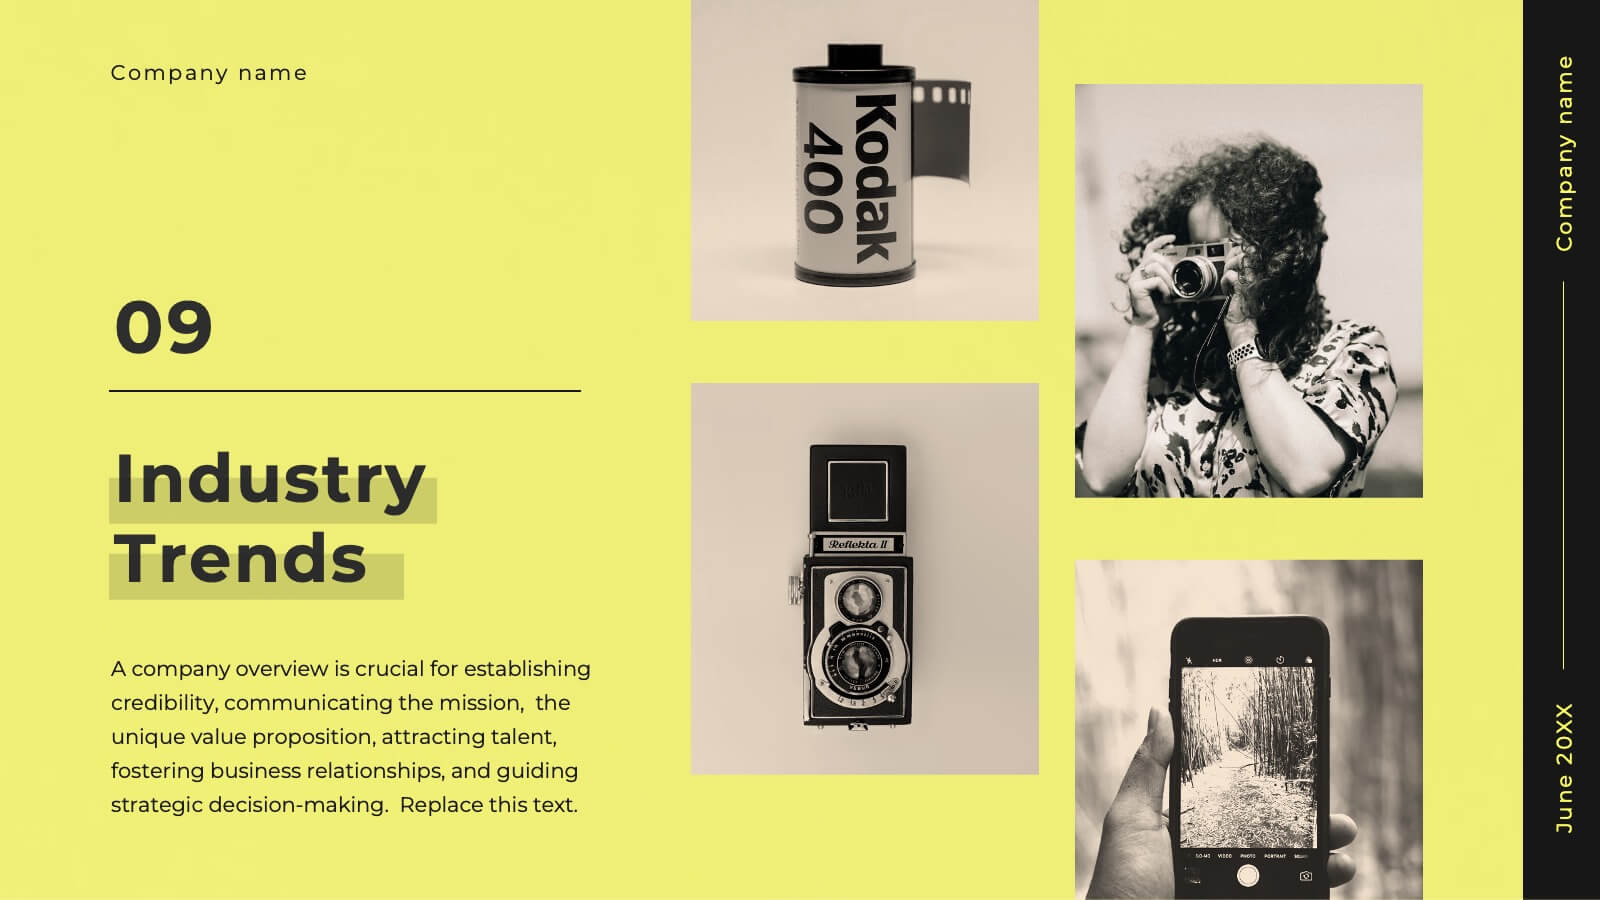
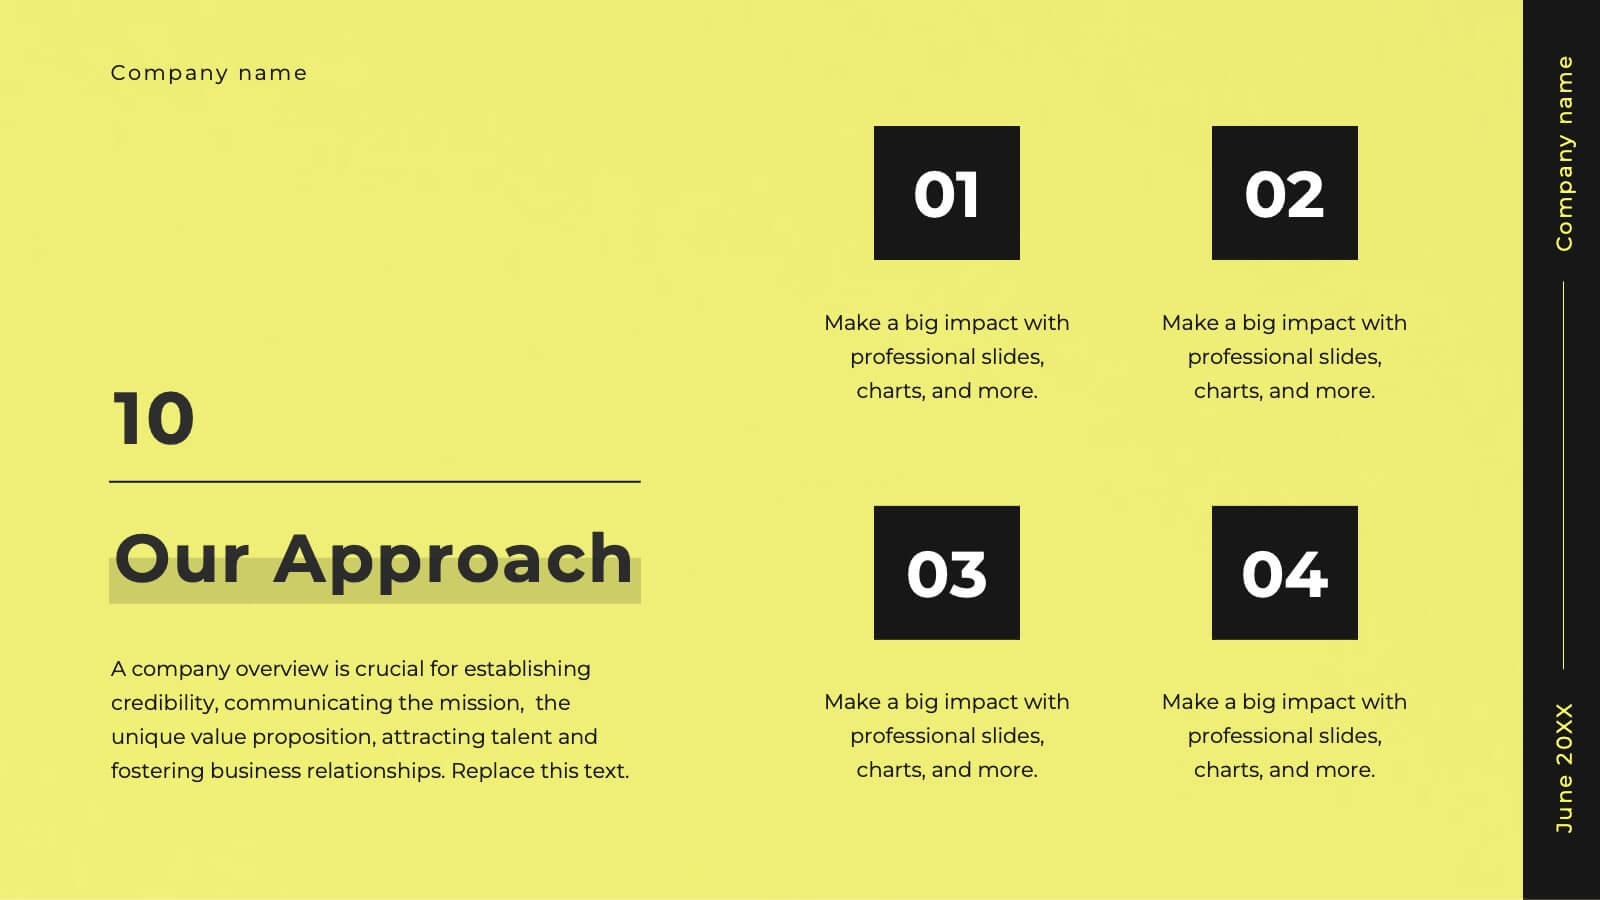
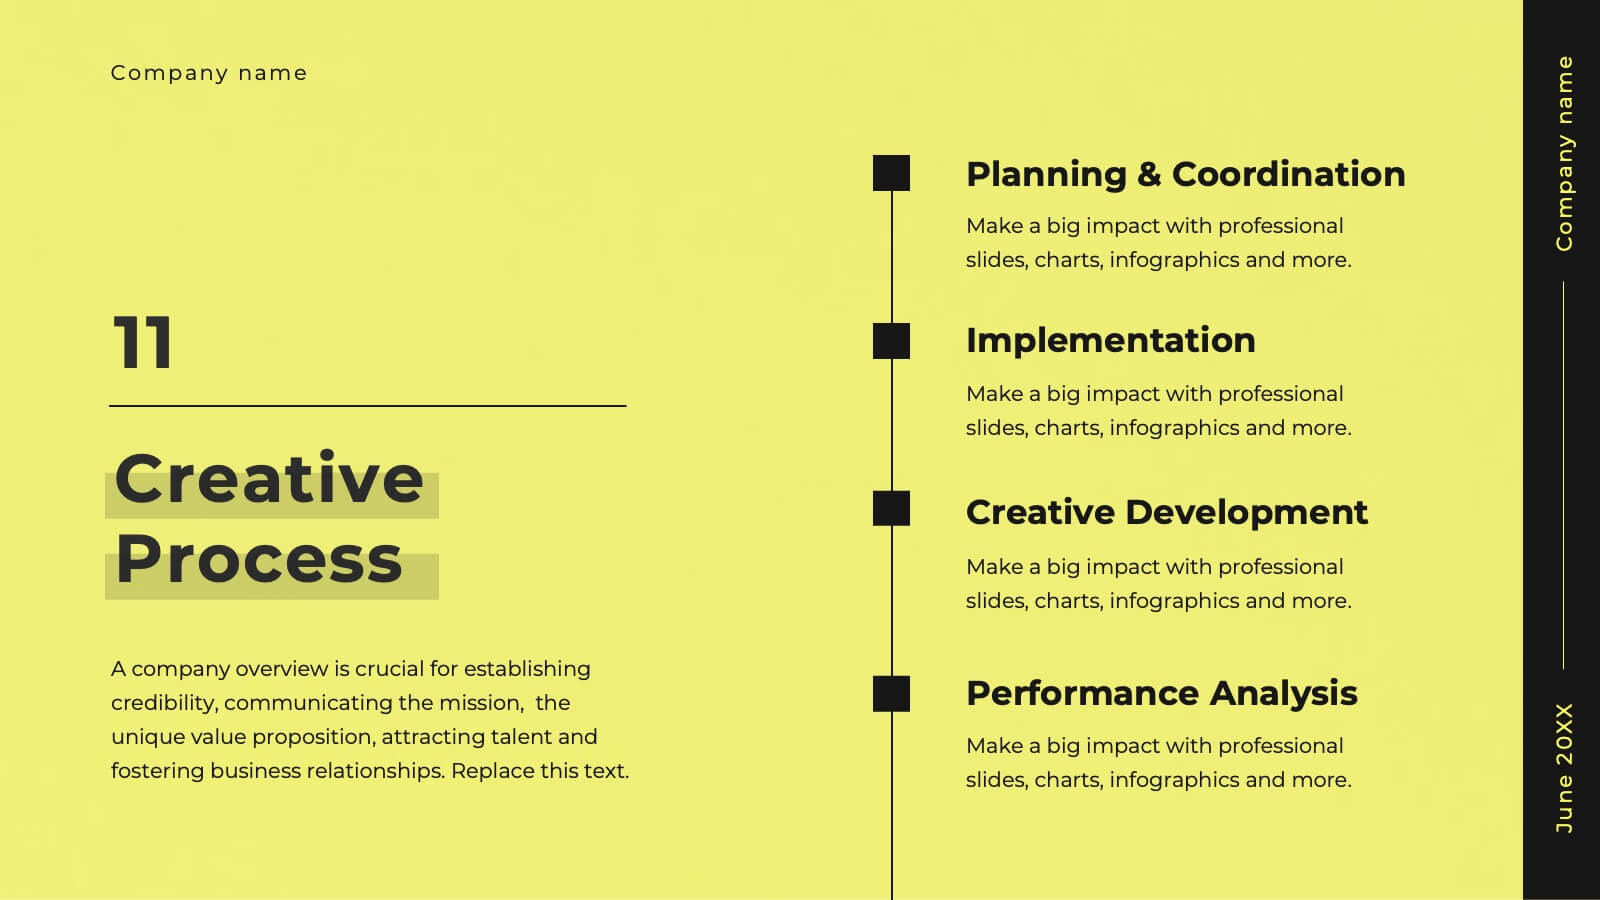
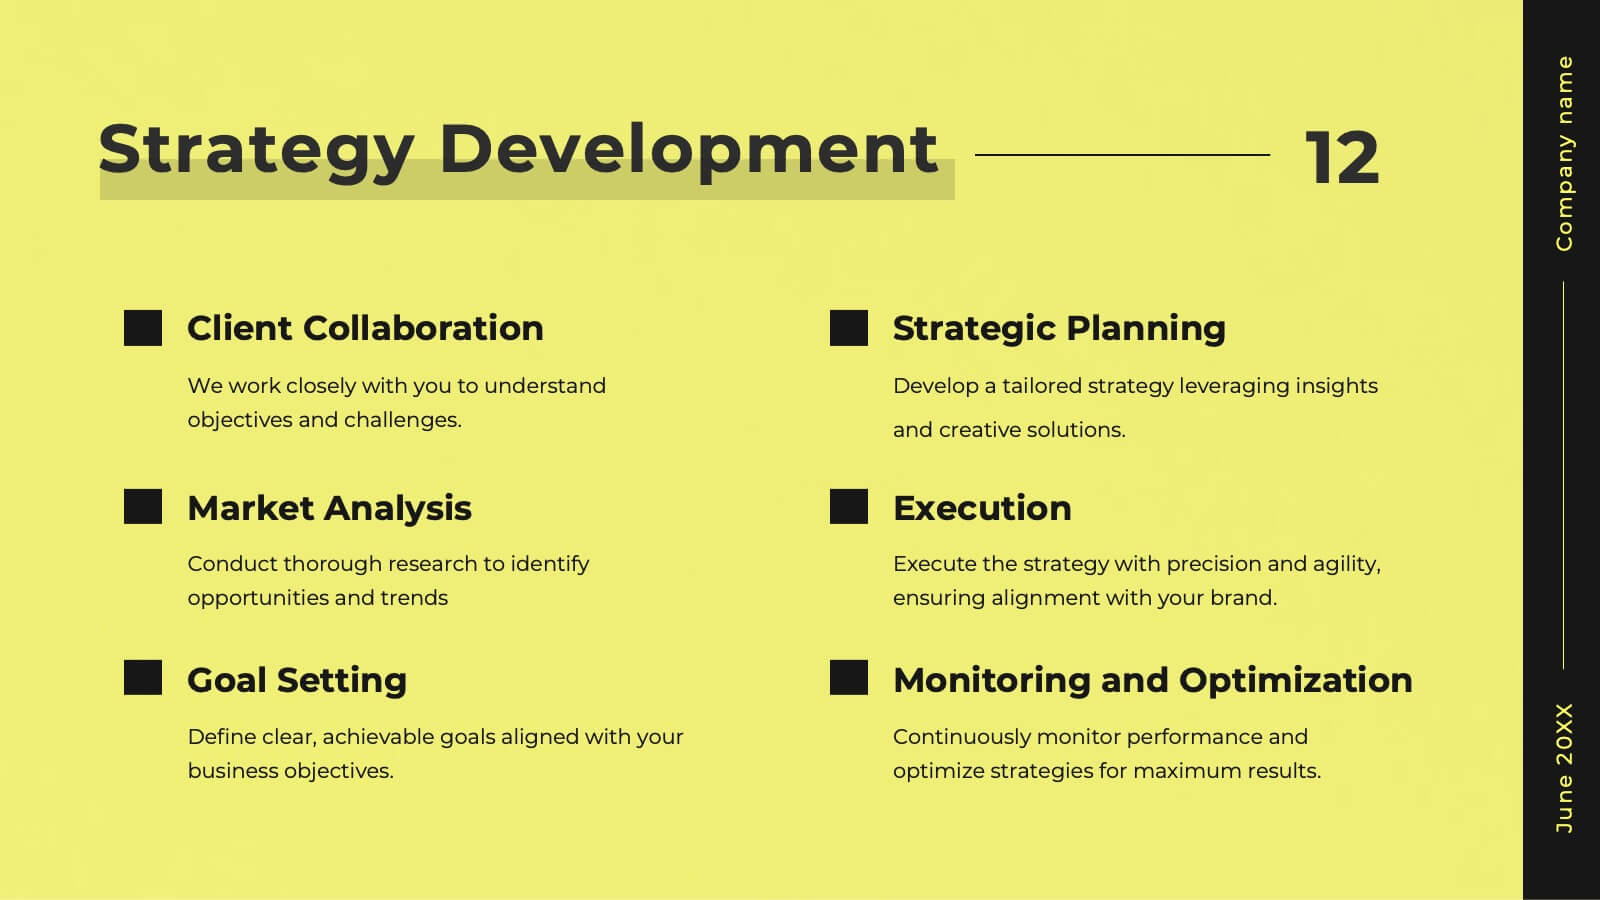
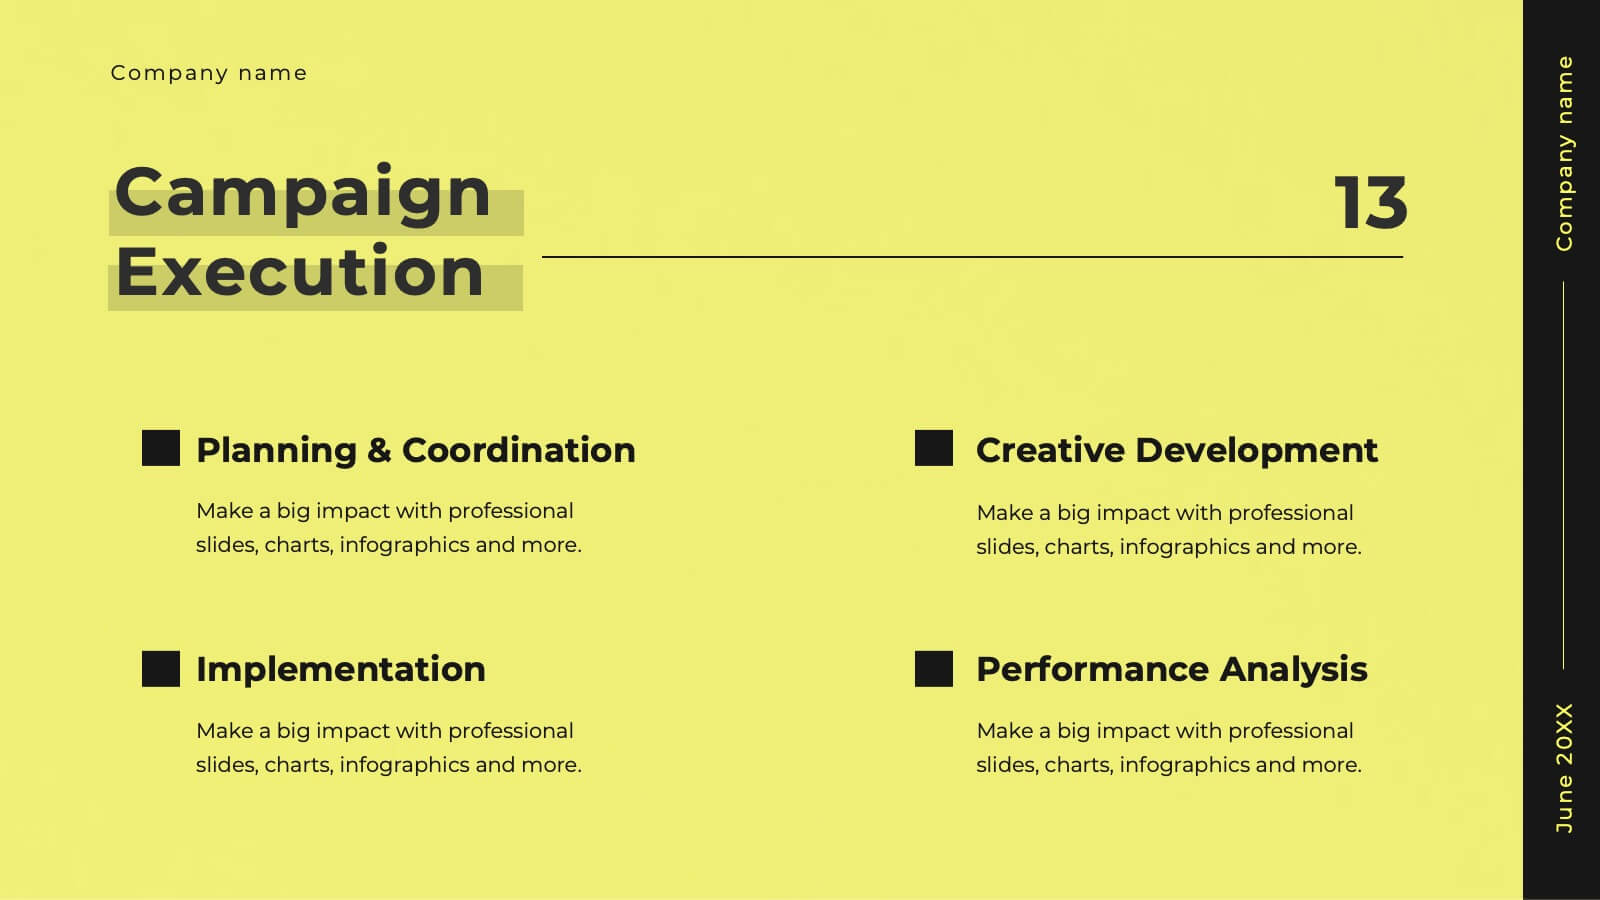
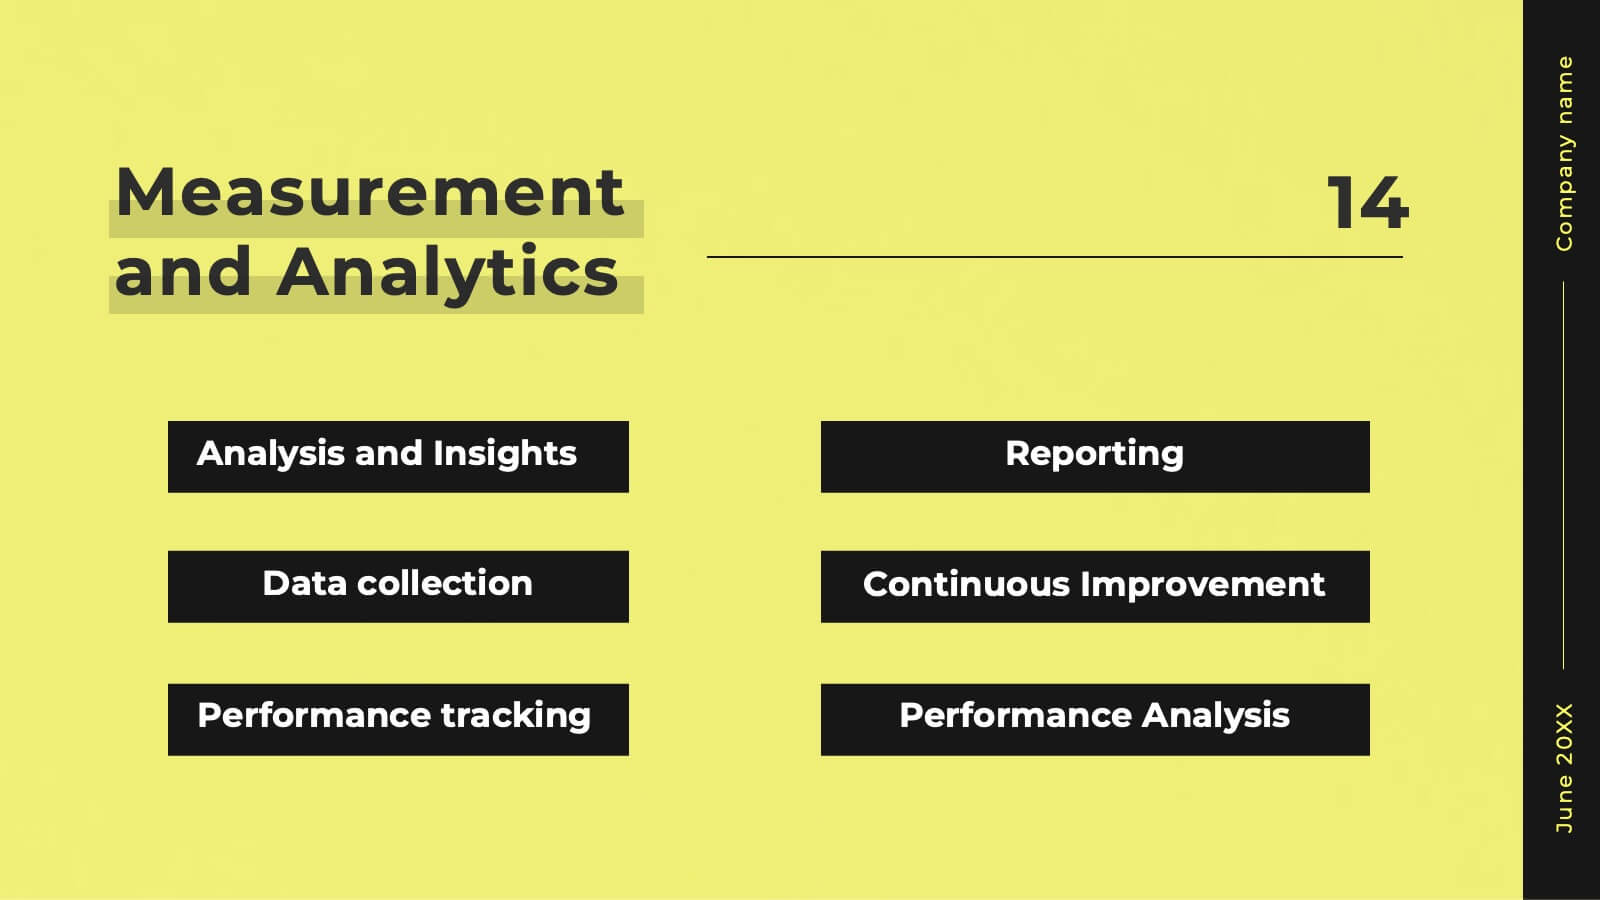
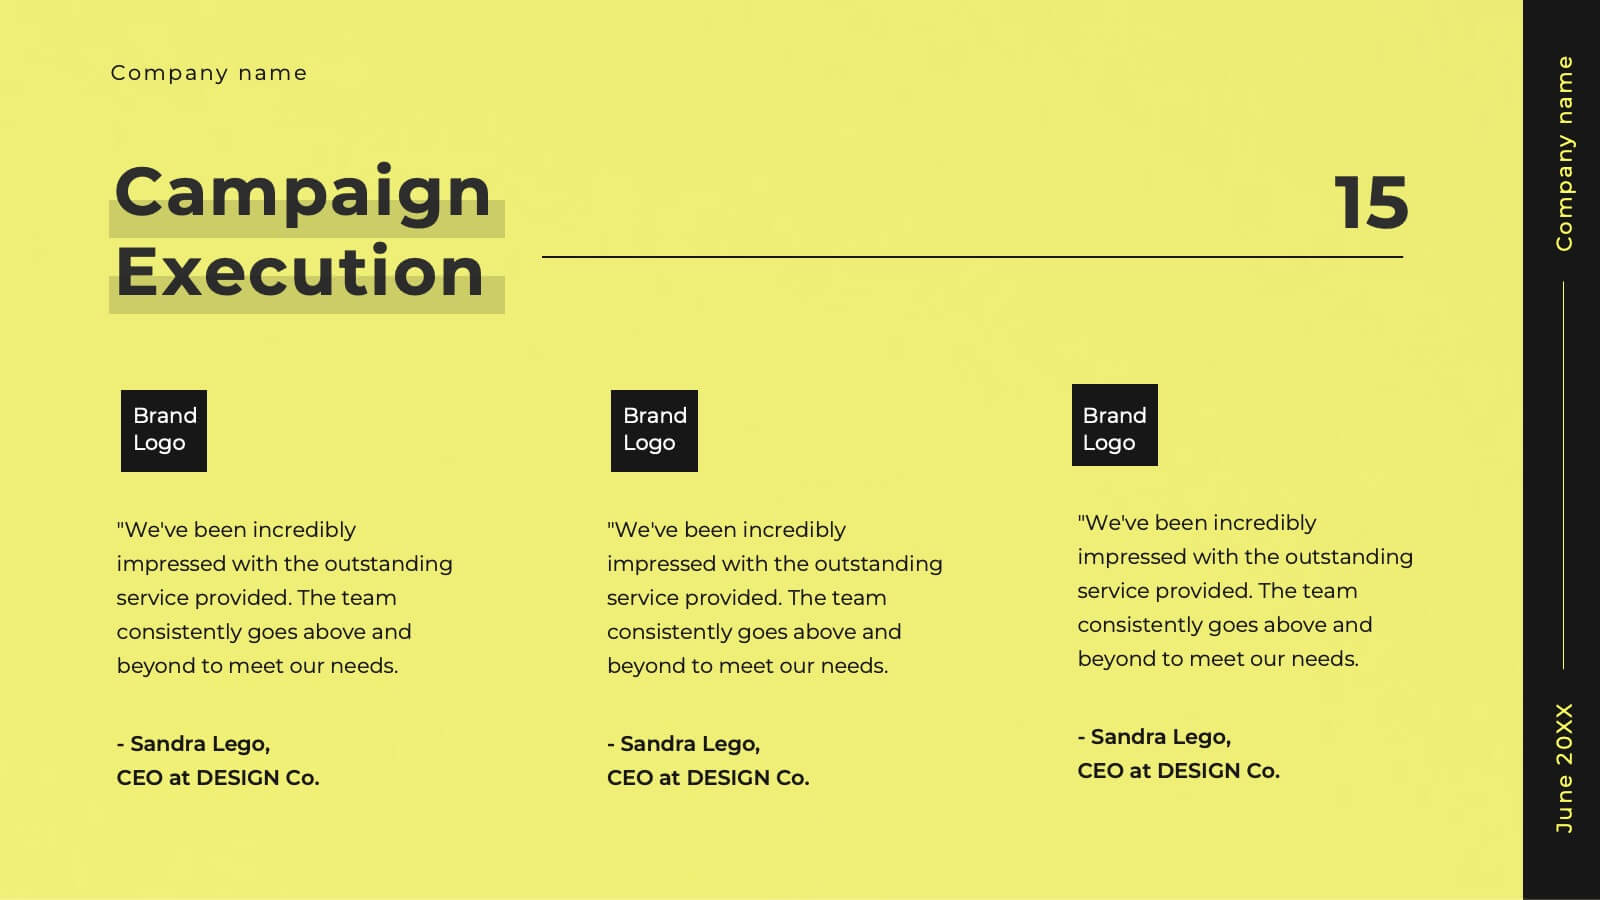
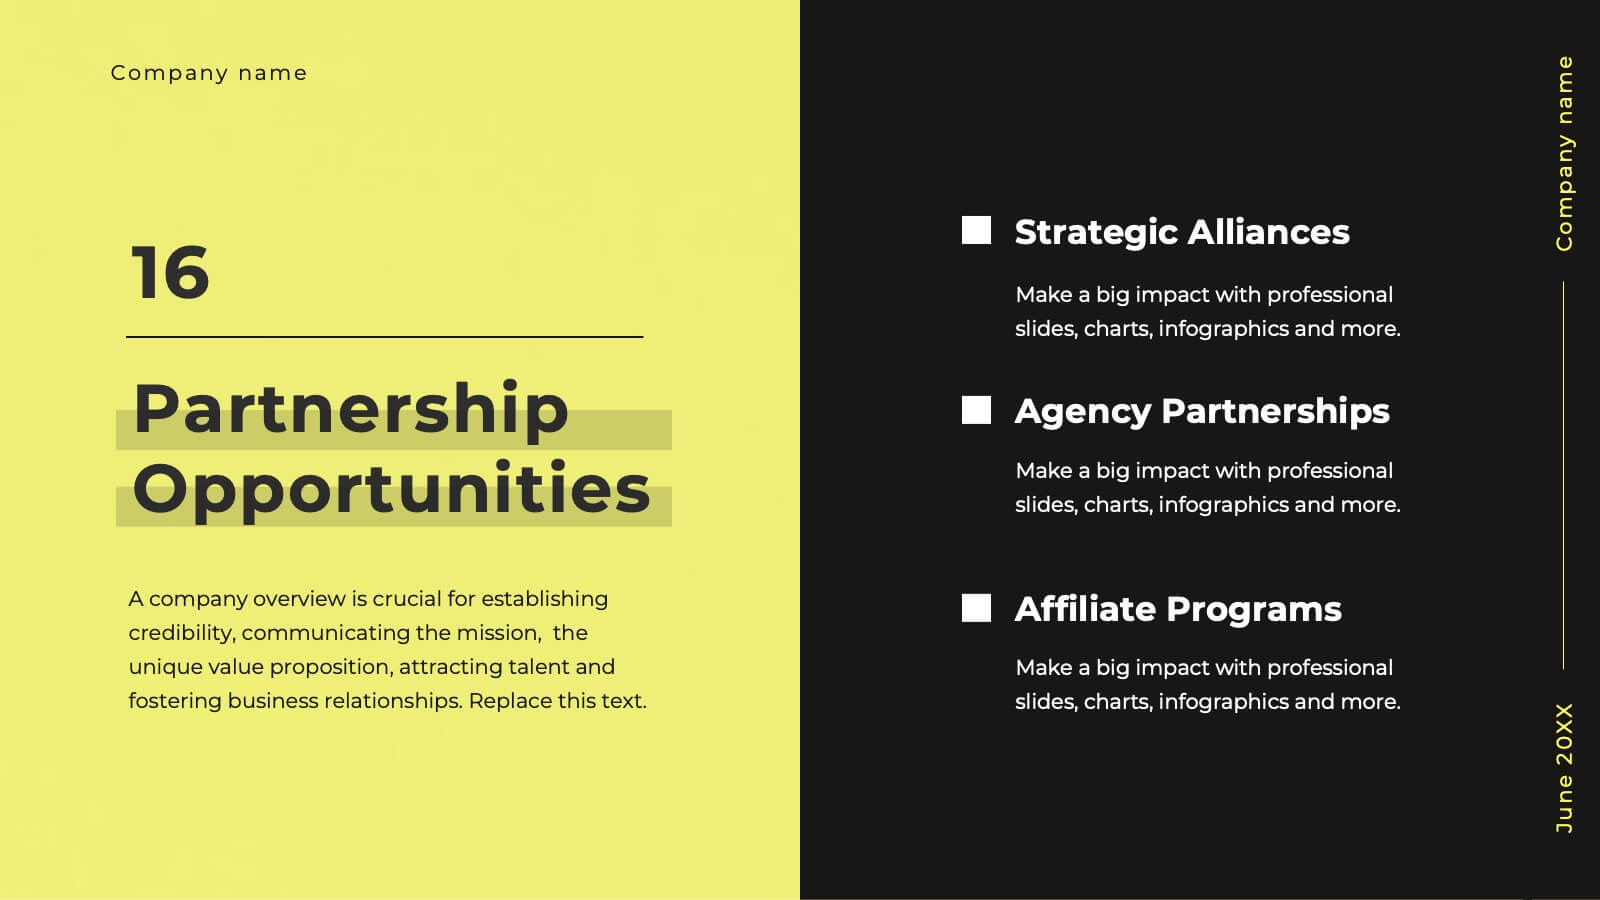
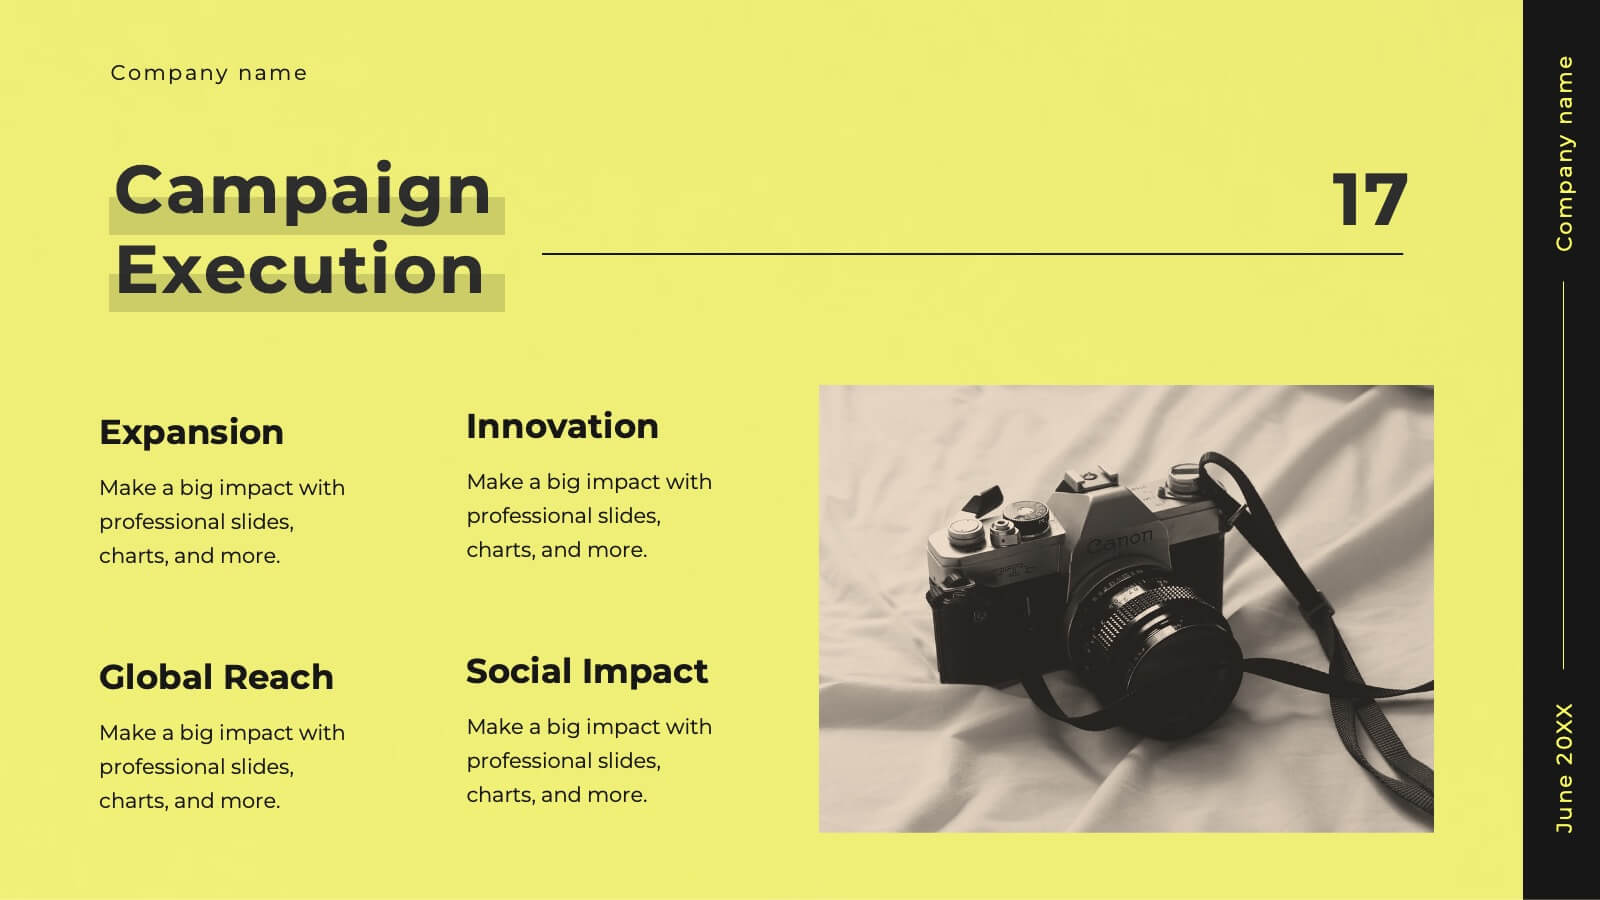
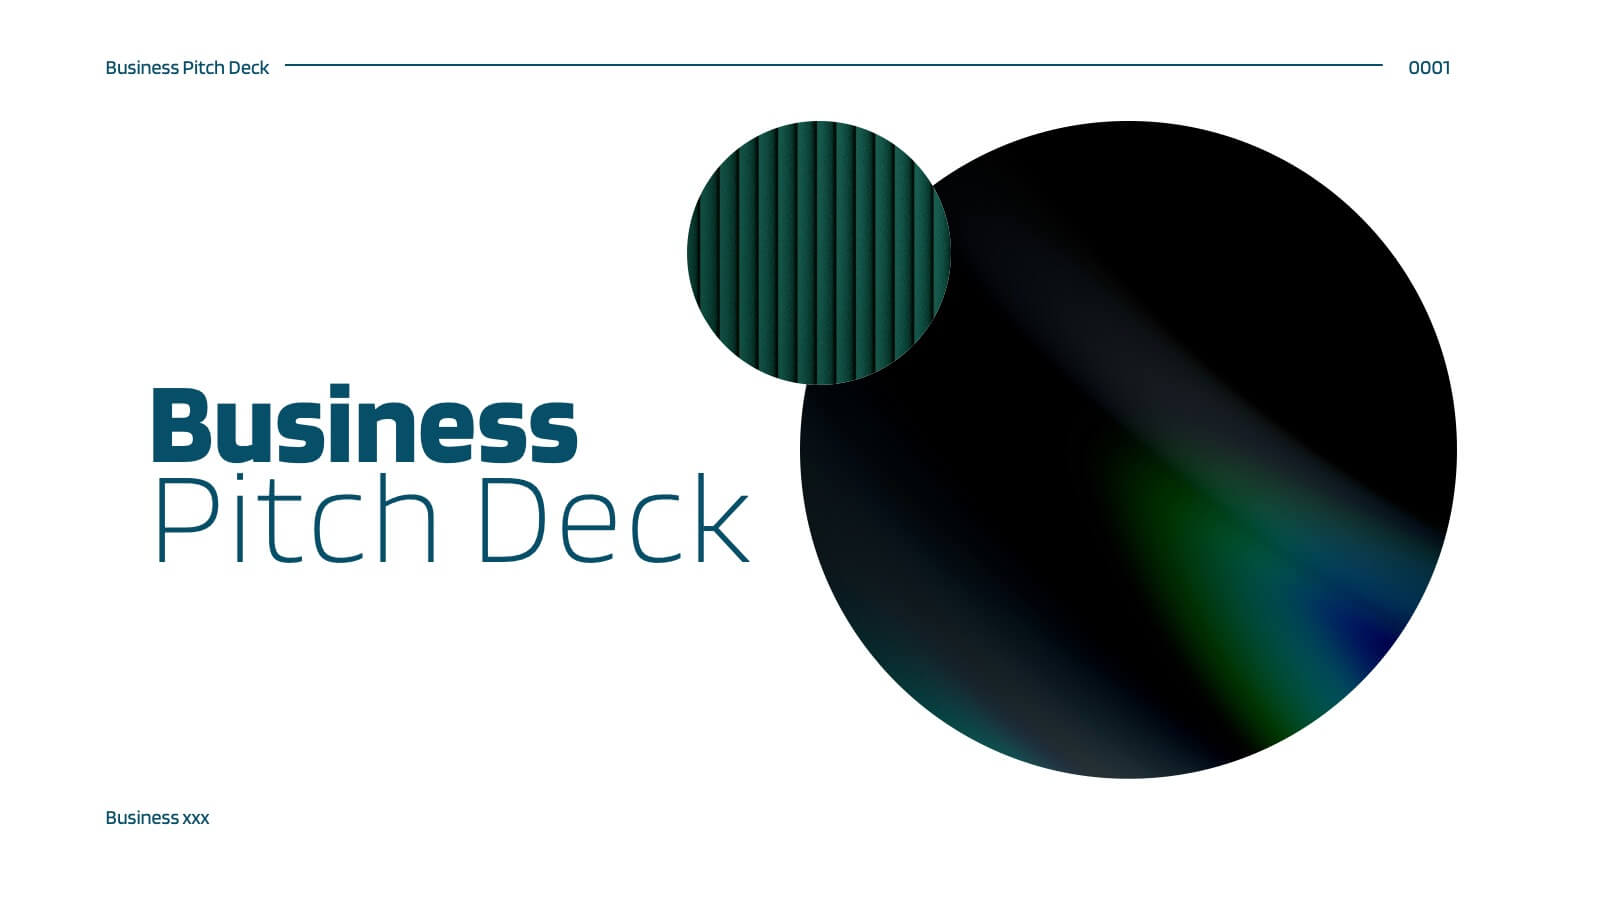
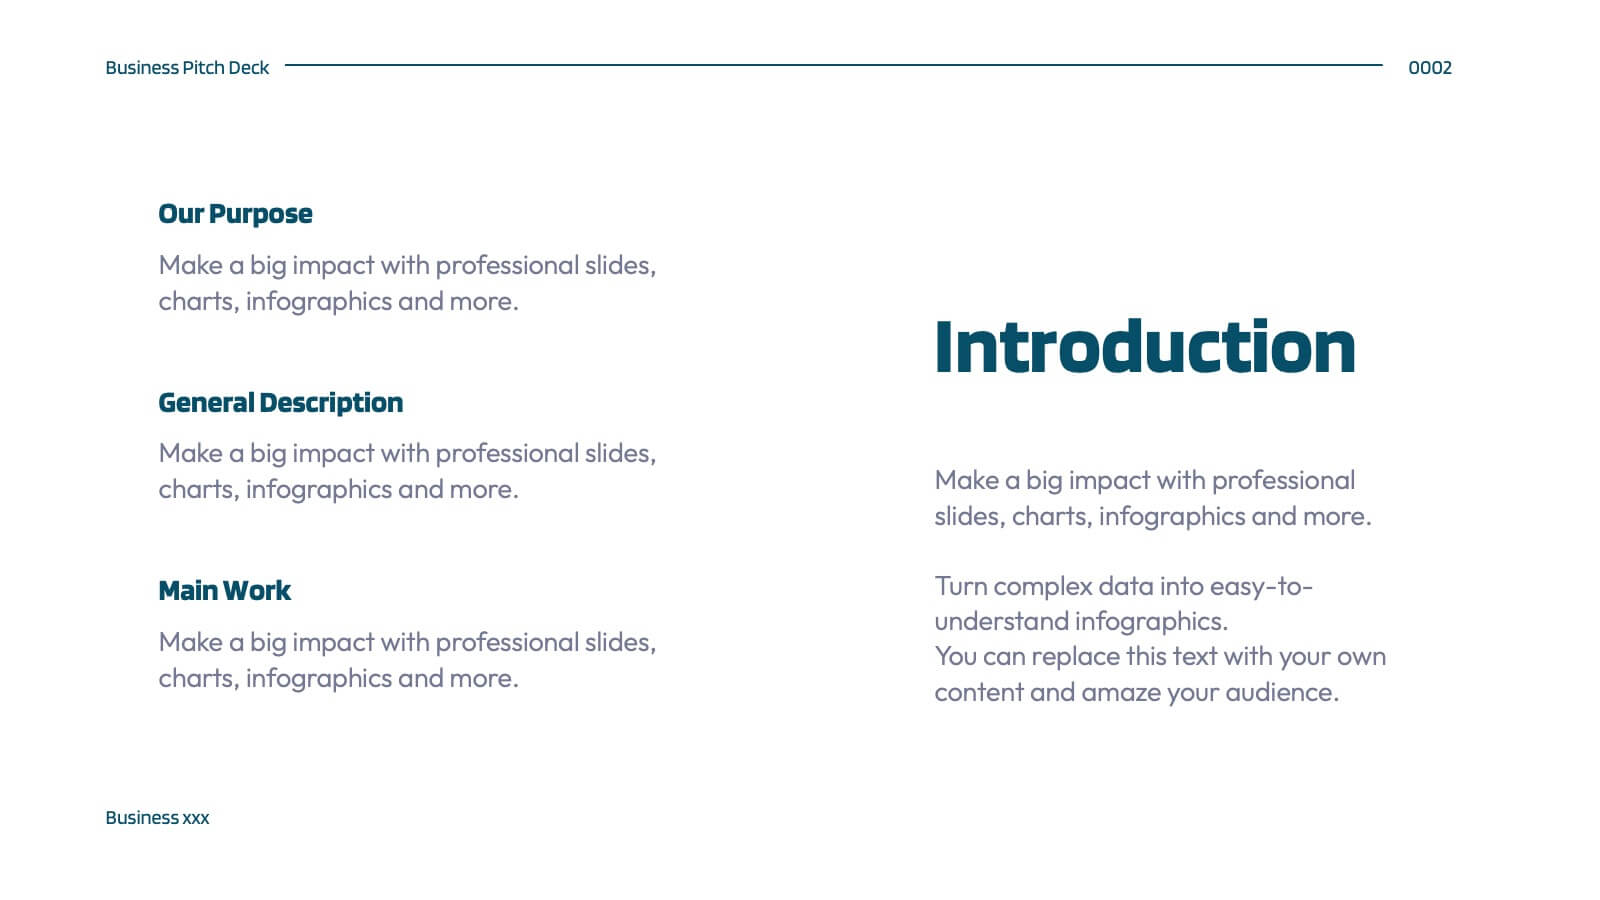
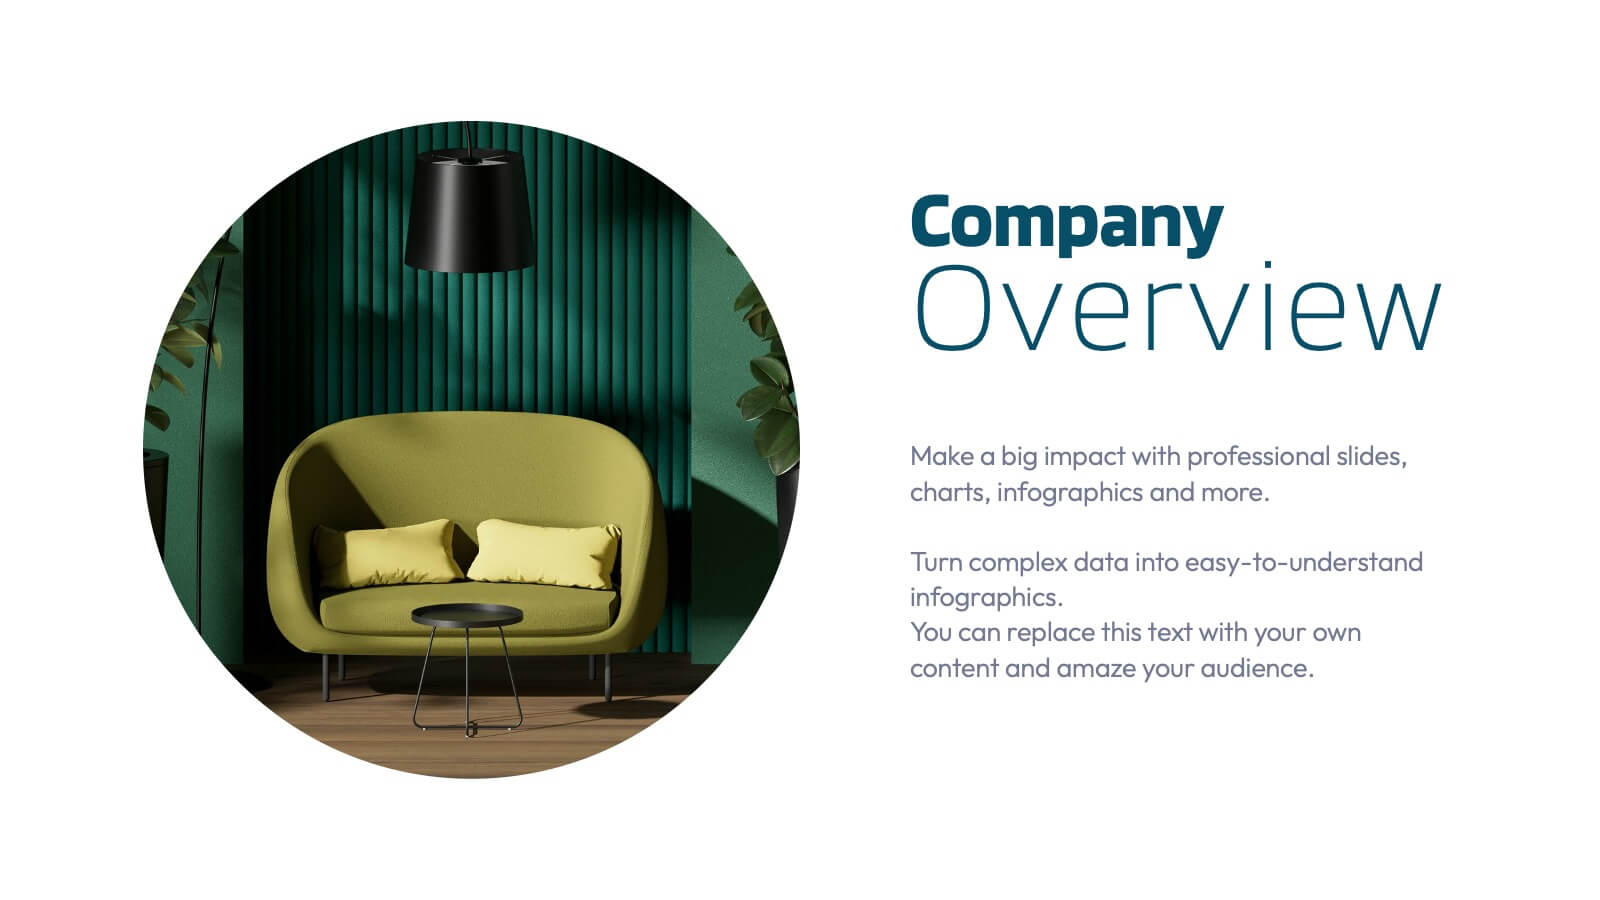
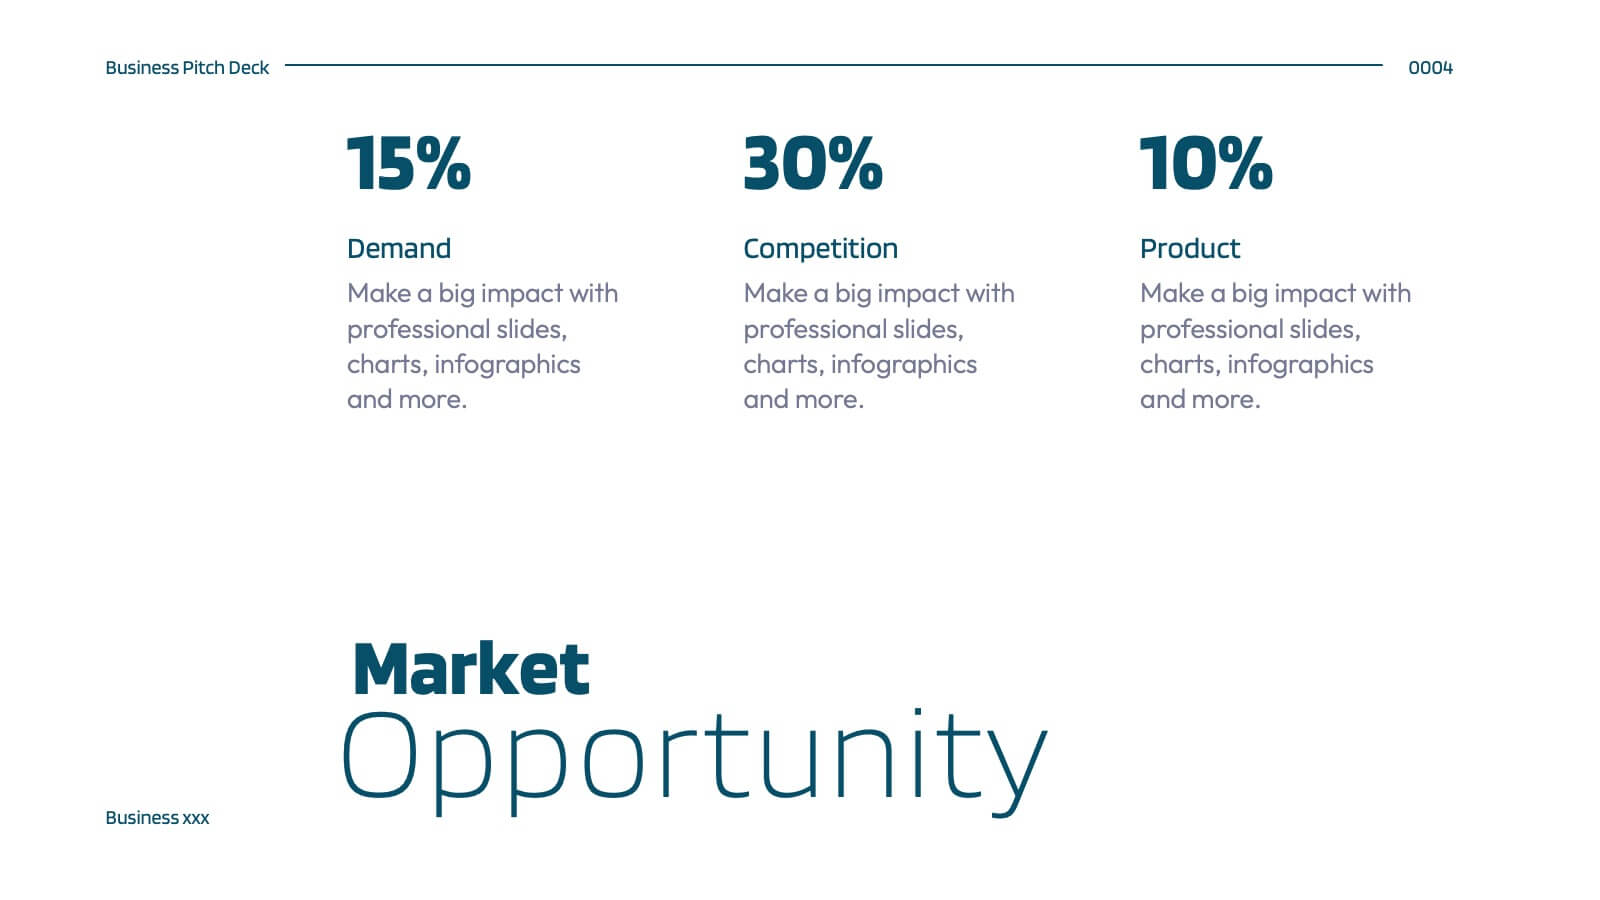
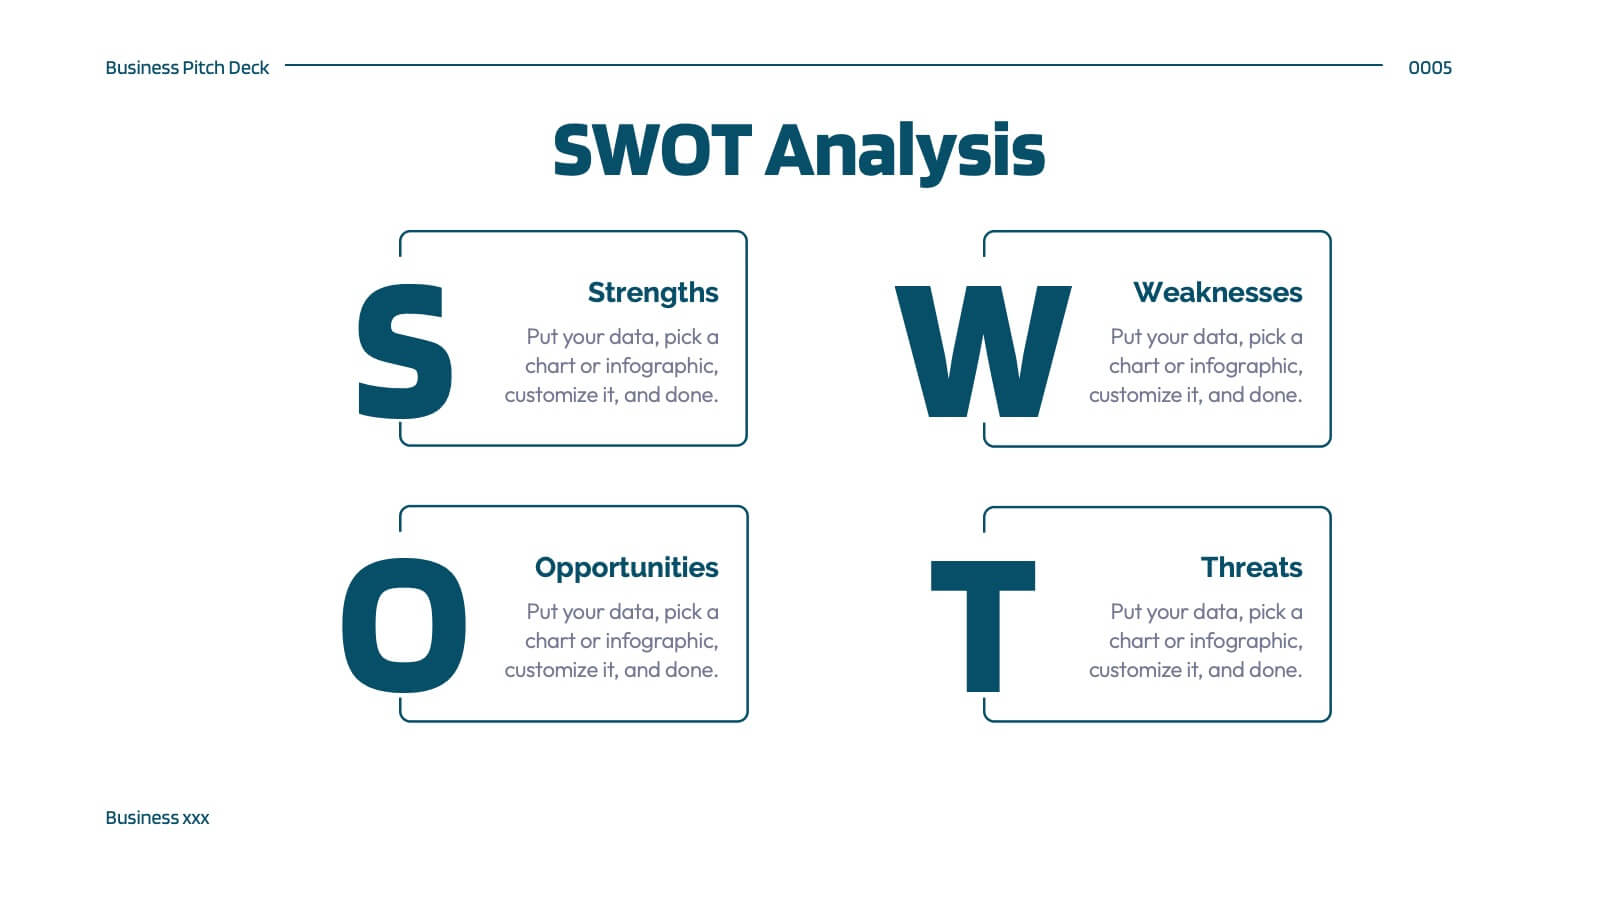
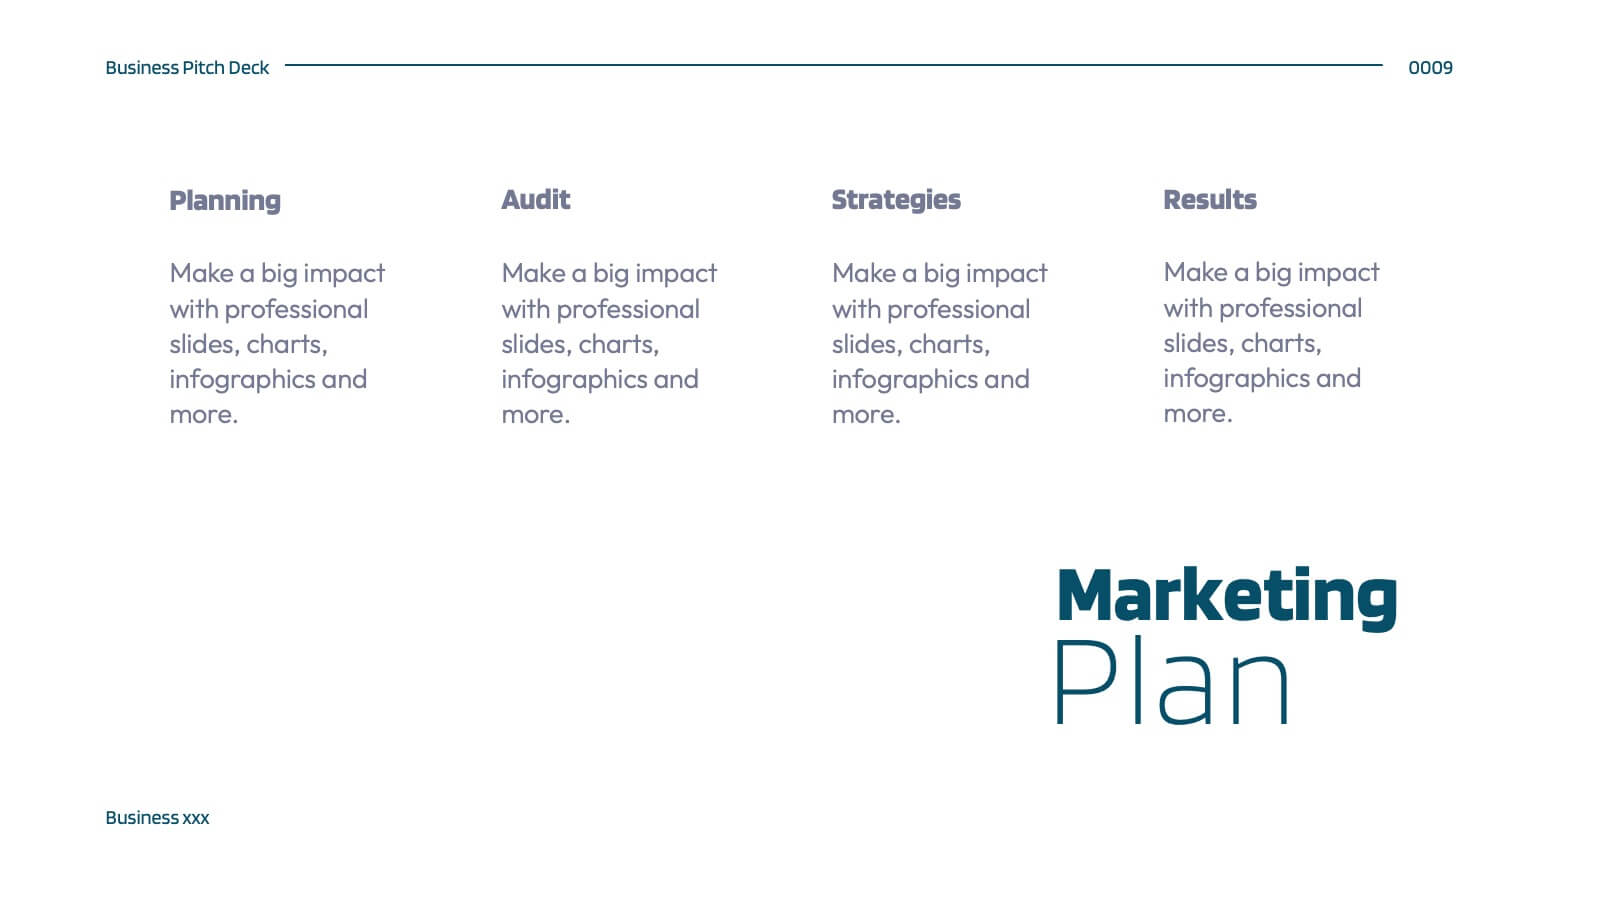
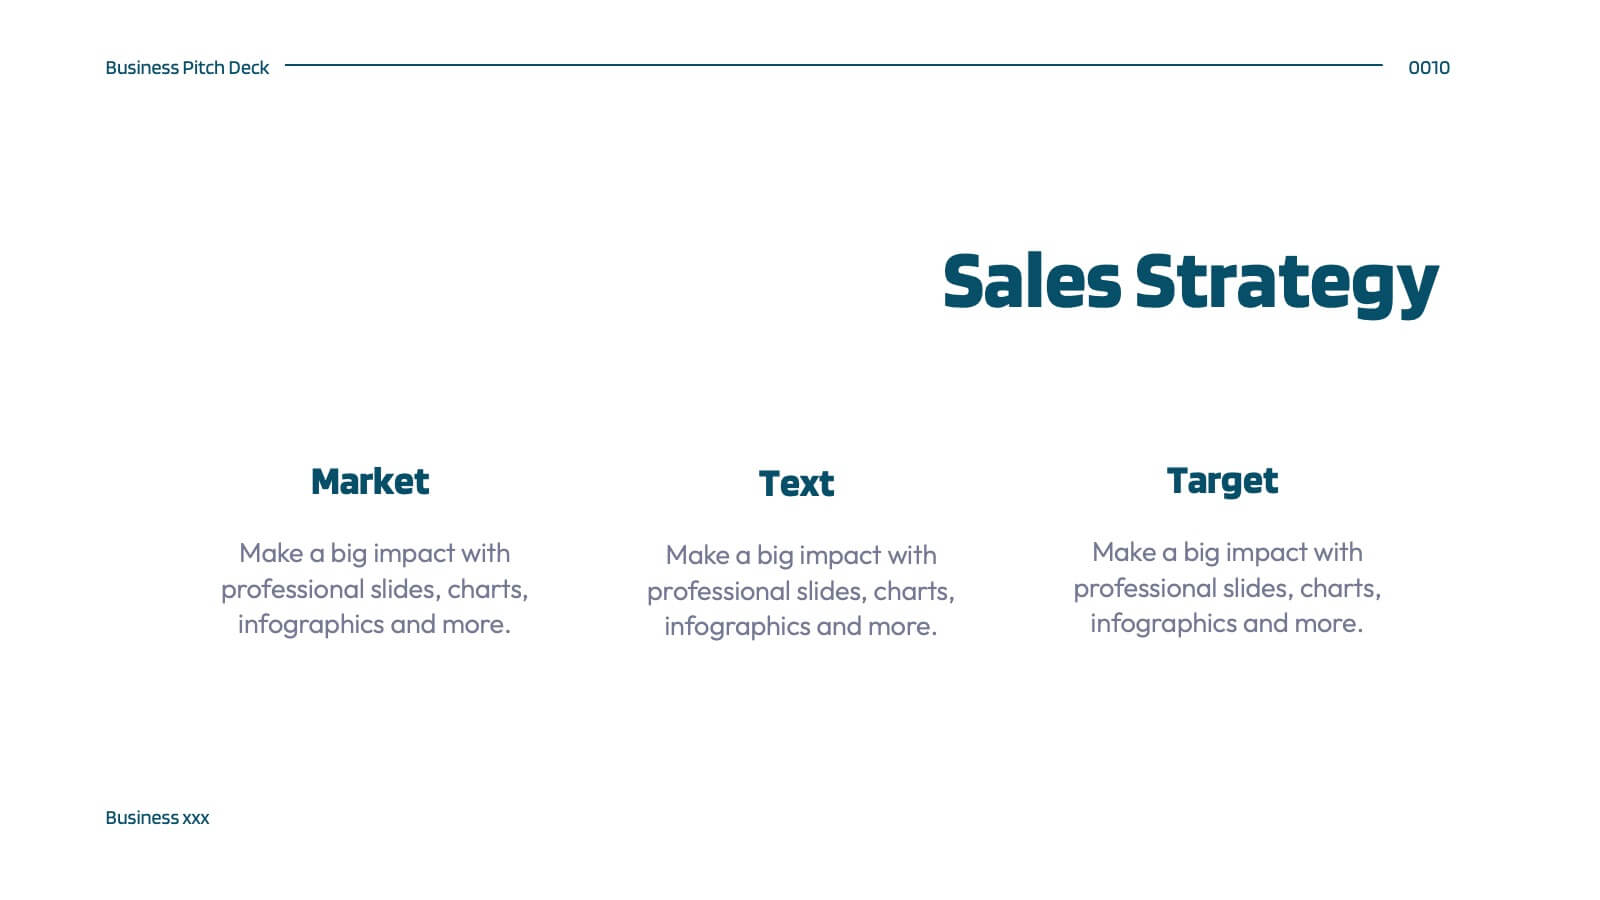
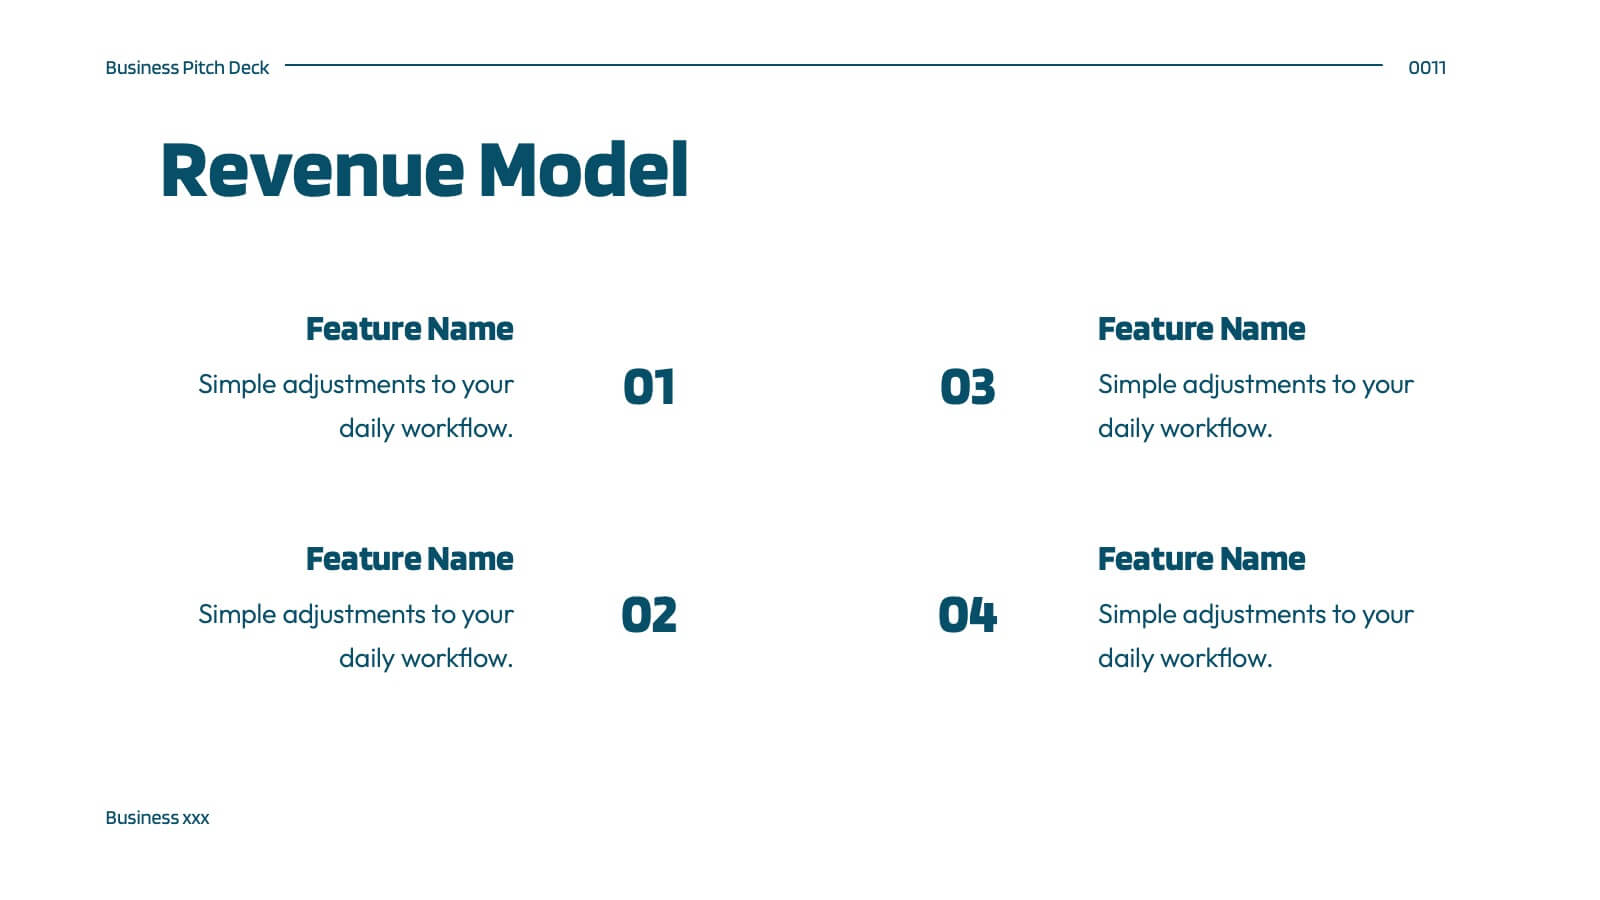
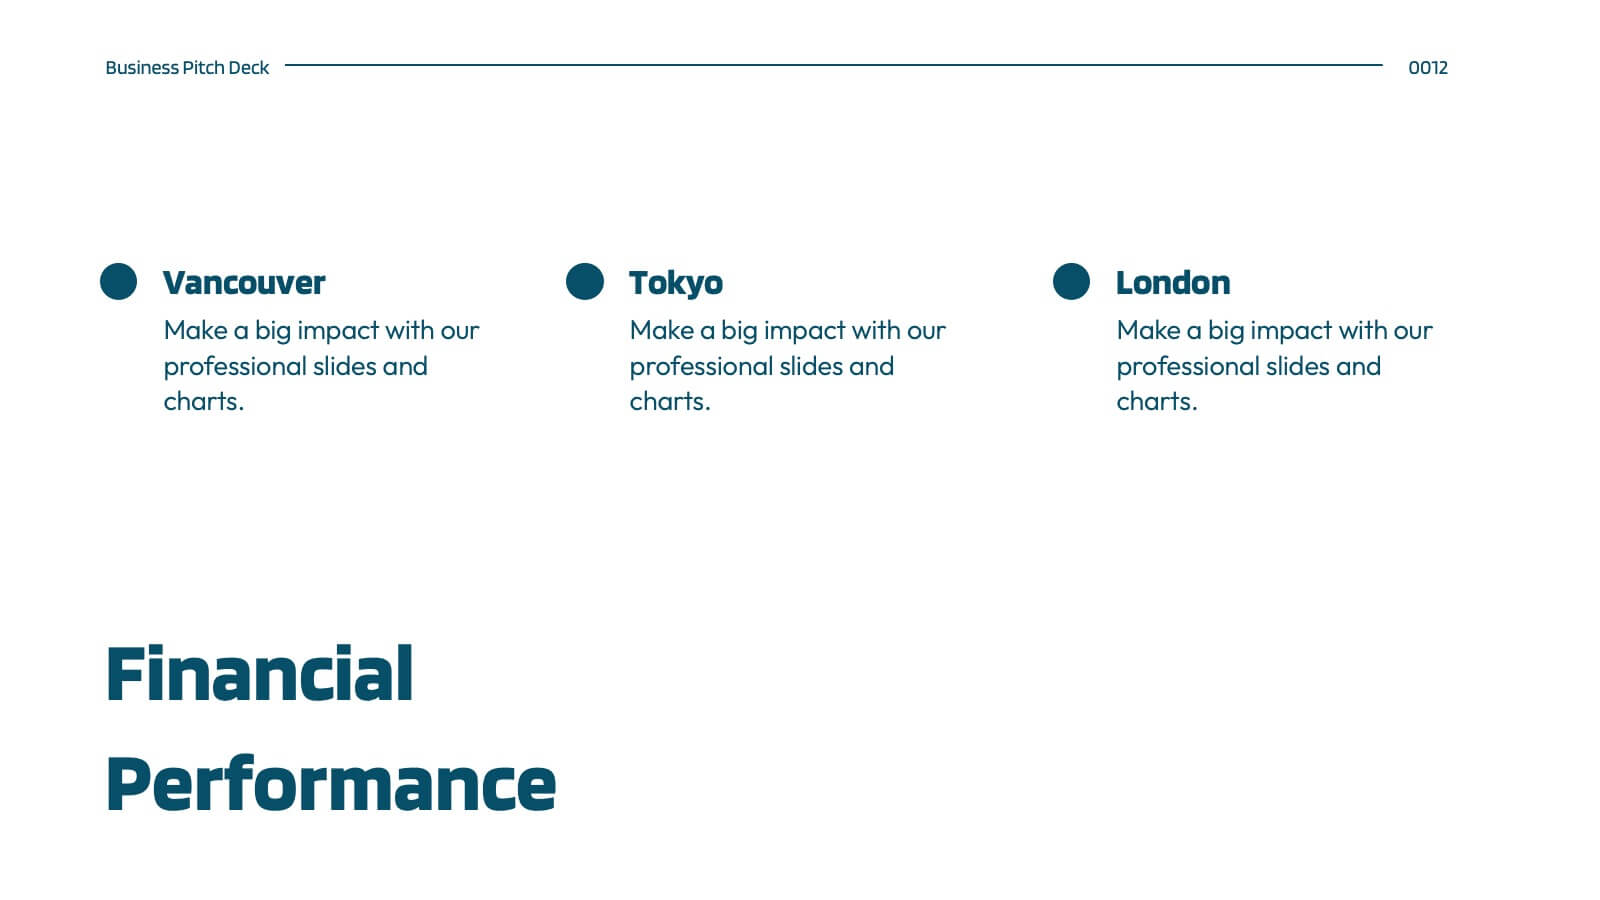
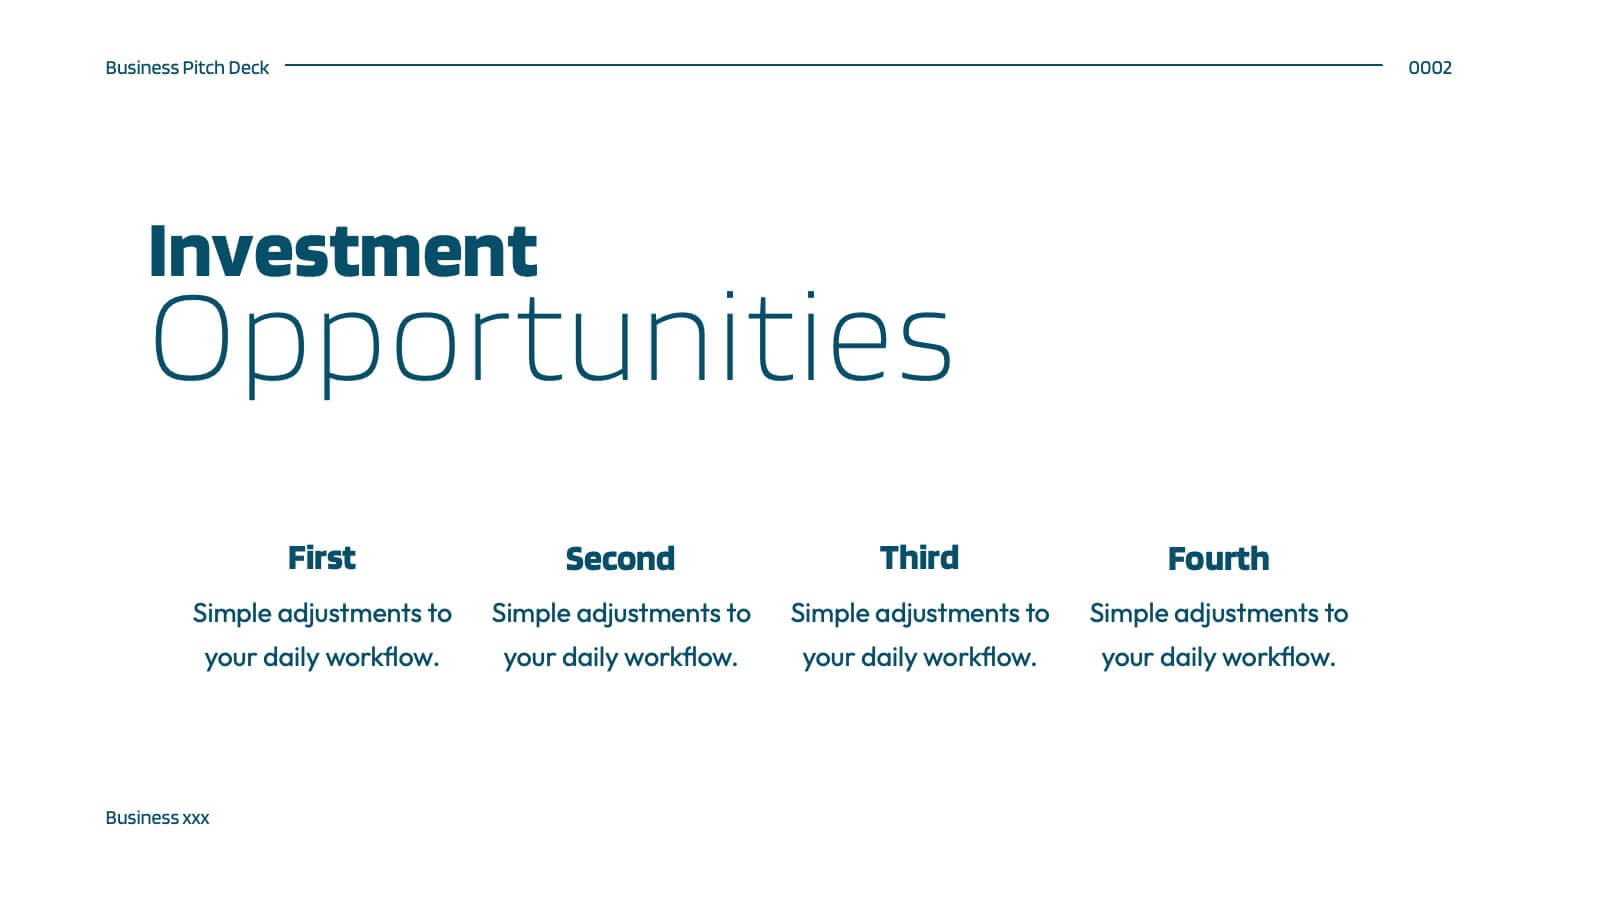
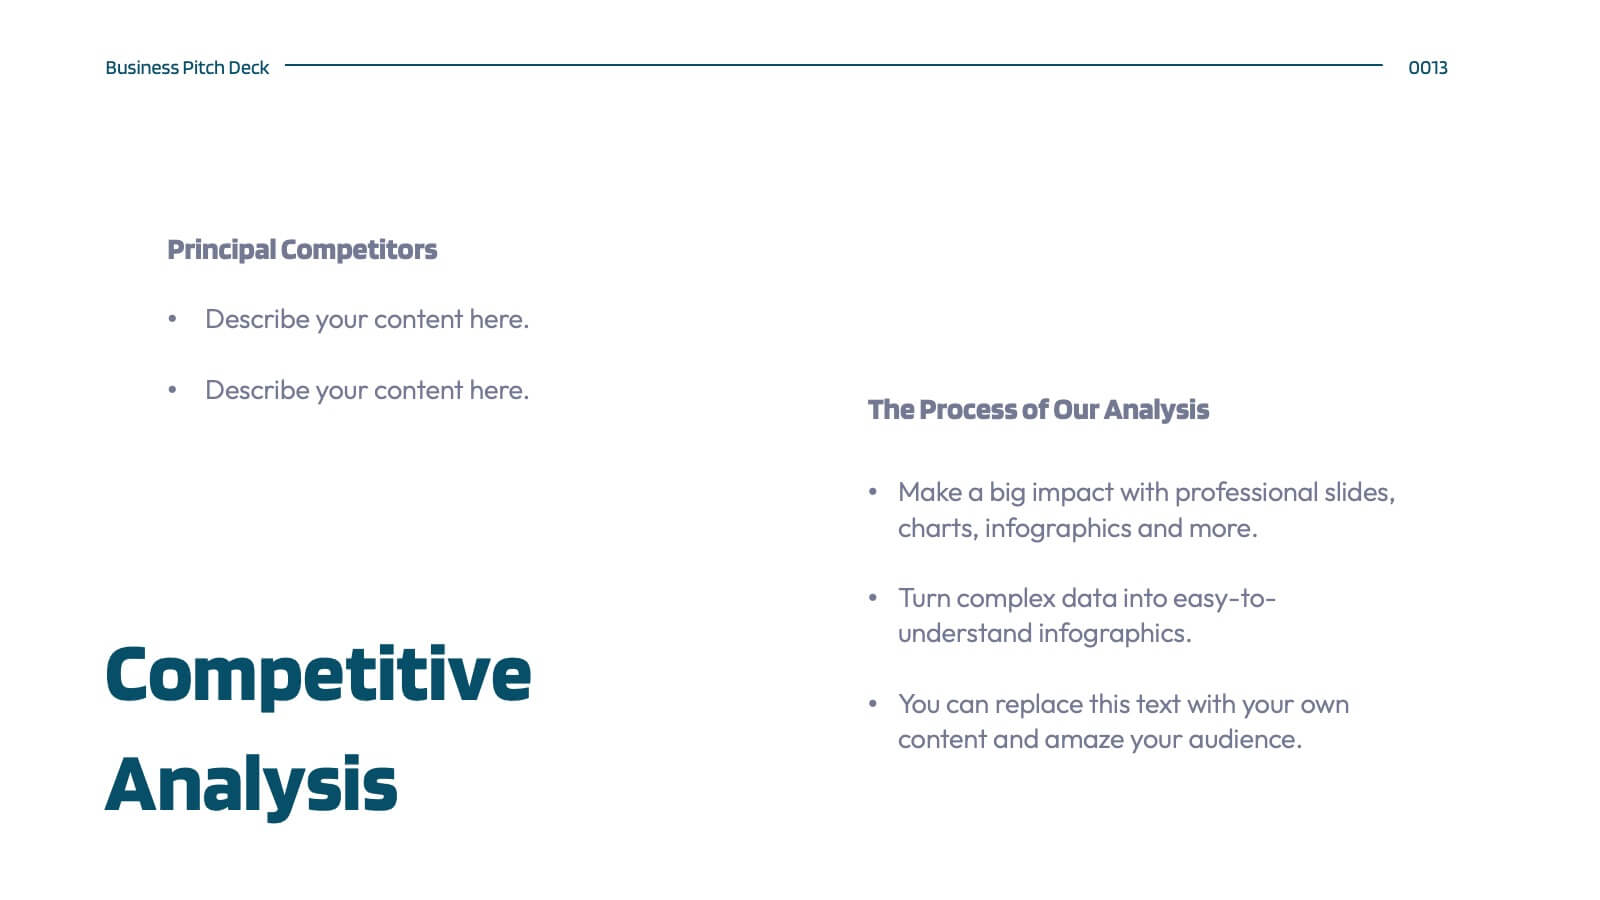
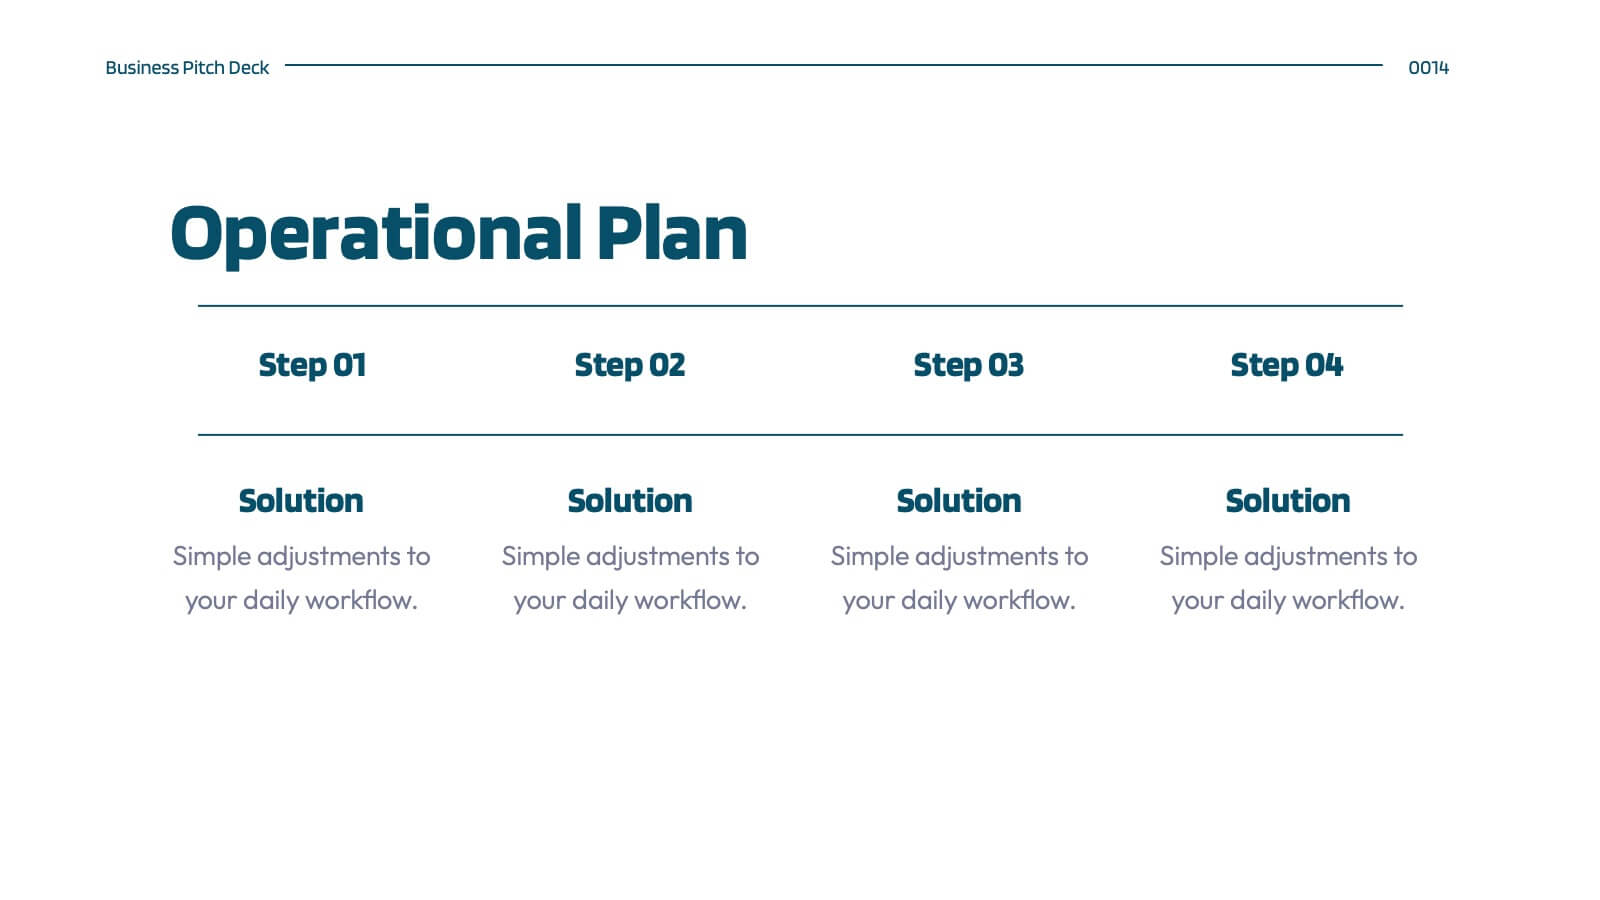
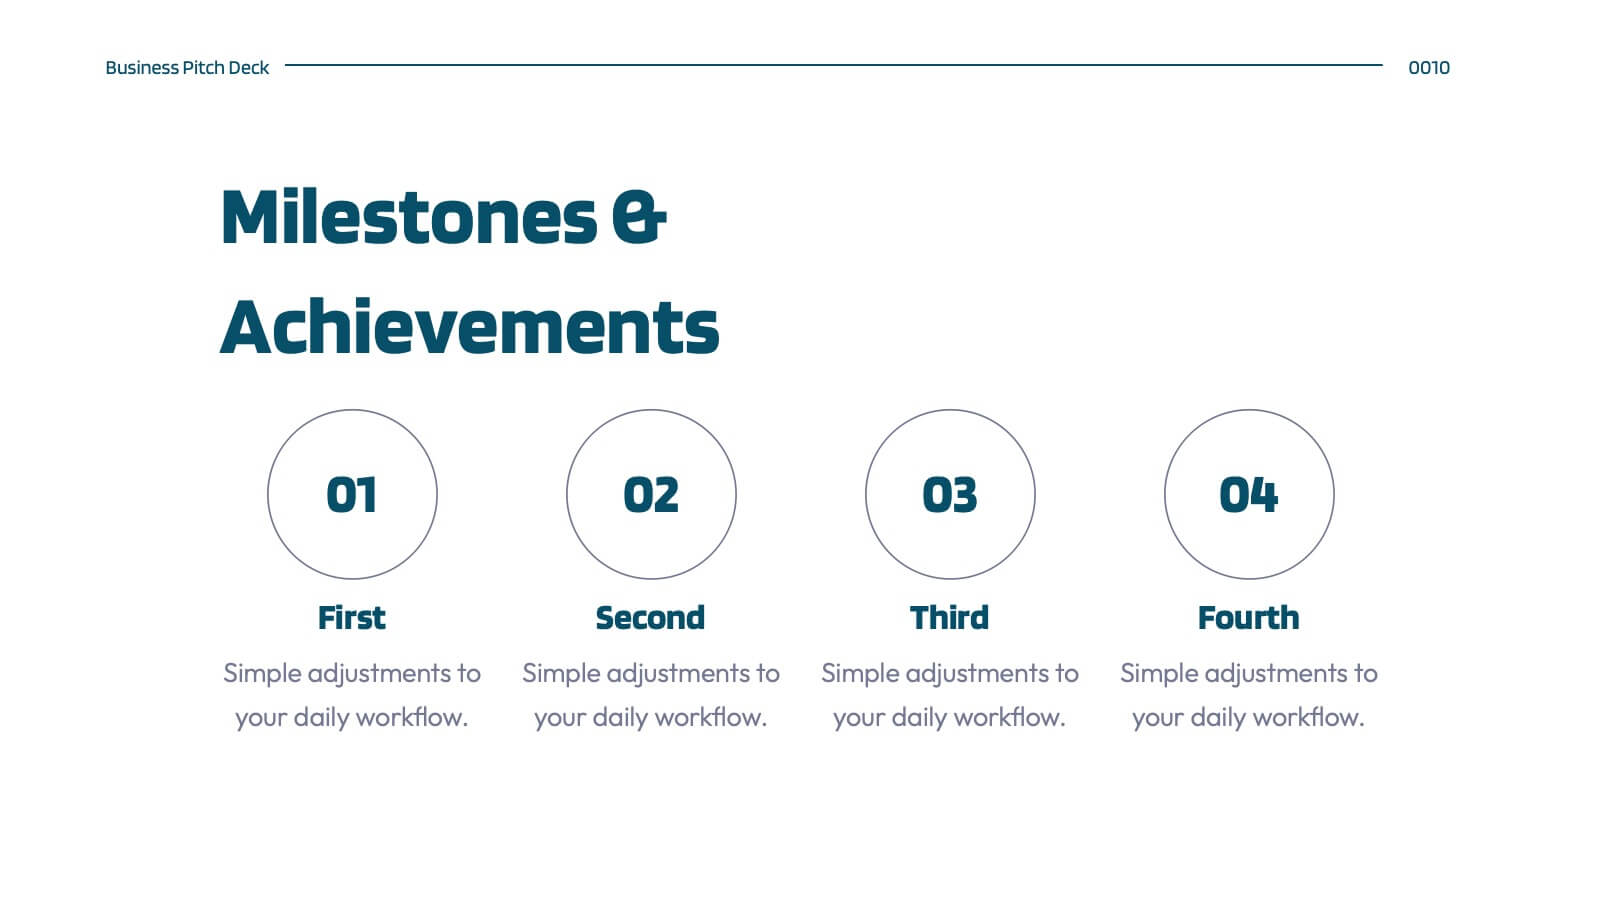
Glimmer Creative Agency Pitch Deck Presentation
Step up your game with this vibrant agency pitch deck template! Ideal for showcasing your services, client success stories, and strategic approach, it includes dynamic slides for market analysis and campaign execution. Engage potential clients with compelling visuals and well-organized content. Compatible with PowerPoint, Keynote, and Google Slides for a smooth presentation experience on any platform.


5 diapositivas
Construction Projects Infographics
Construction projects refer to the process of planning, designing, and building structures, infrastructure, or facilities. These vertical infographics are visually appealing and informative resources designed to showcase various aspects of construction projects. It provides a comprehensive overview of the construction industry, highlighting key statistics, trends, and best practices. The template showcases different types of construction projects. It includes visuals and brief descriptions to illustrate the unique characteristics and requirements of each type. Compatible with Powerpoint, Keynote, and Google Slides.


10 diapositivas
Effective Team Communication Presentation
Streamline your Effective Team Communication with this modern infographic template. Designed to enhance collaboration and workflow clarity, this slide helps visualize key communication strategies for better team efficiency. Fully customizable in PowerPoint, Keynote, and Google Slides, making it perfect for corporate training, leadership meetings, and project planning.


6 diapositivas
PESTEL Environment Analysis Infographics
Elevate your strategic analysis presentations with our PESTEL Environment Analysis infographic template. Designed for PowerPoint, Keynote, and Google Slides, this template is a must-have for business strategists, analysts, and students alike. This template efficiently breaks down the complex components of PESTEL analysis - Political, Economic, Social, Technological, Environmental, and Legal factors. Each segment is given its own distinct space, making it easy to input and display your analysis in a clear, organized manner. The sophisticated and educational design of the template ensures that your content is both accessible and engaging. The diverse yet harmonious color palette of the template enhances its visual appeal, reflecting the multifaceted nature of PESTEL analysis. This makes it ideal for detailed presentations where clarity and aesthetics are key. Whether you're presenting to a classroom, a boardroom, or at a conference, this infographic template will help you convey your environmental analysis with professionalism and style.


4 diapositivas
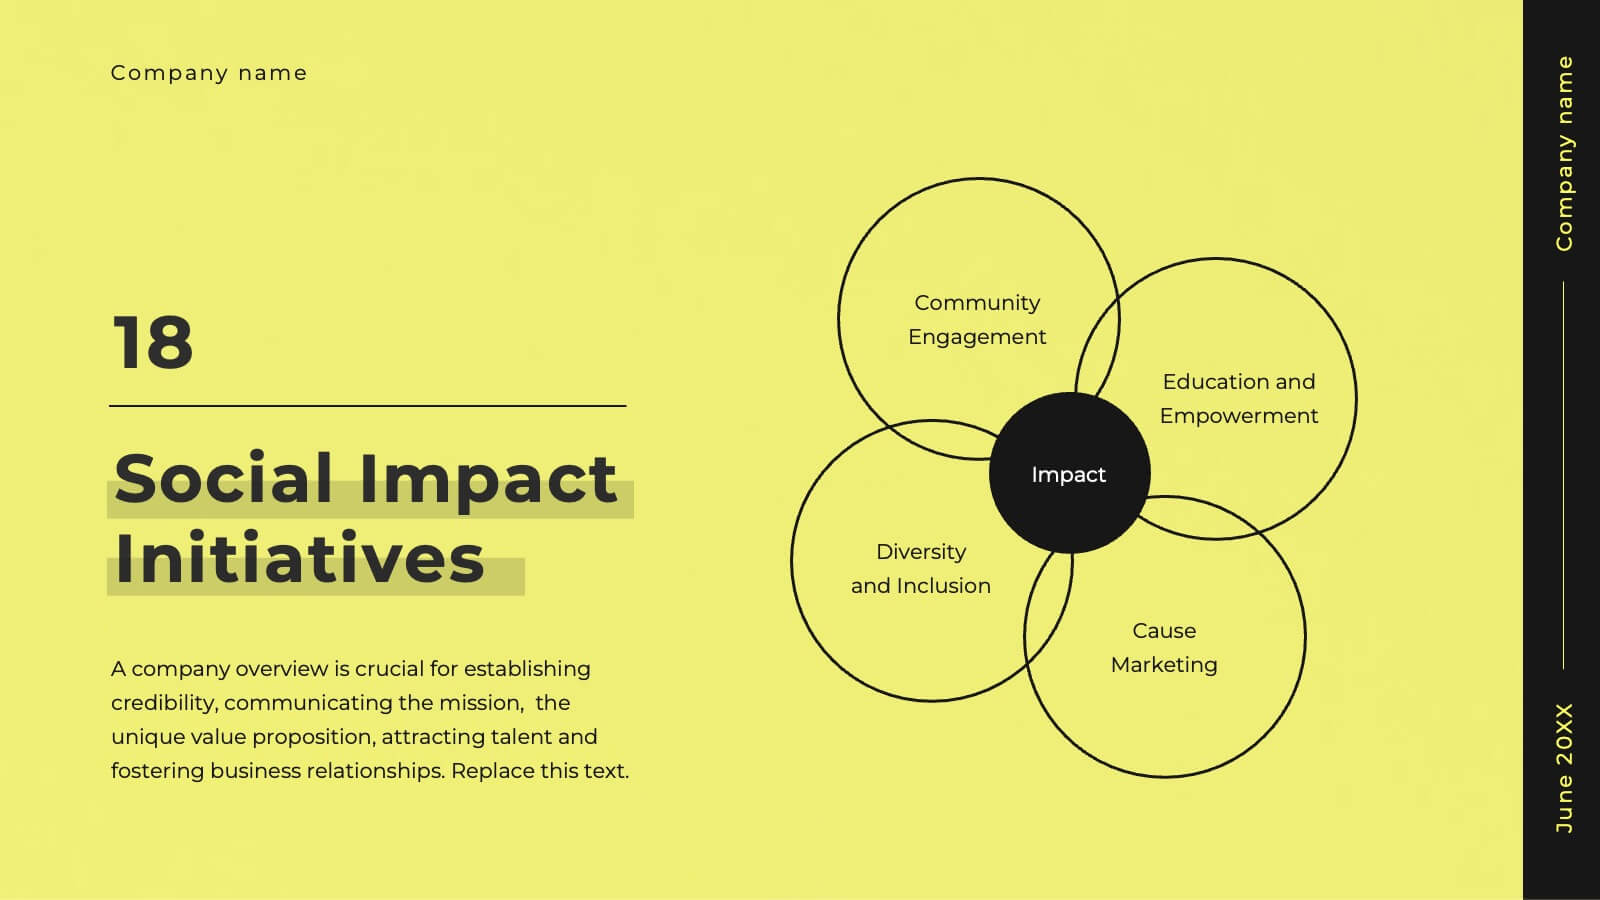
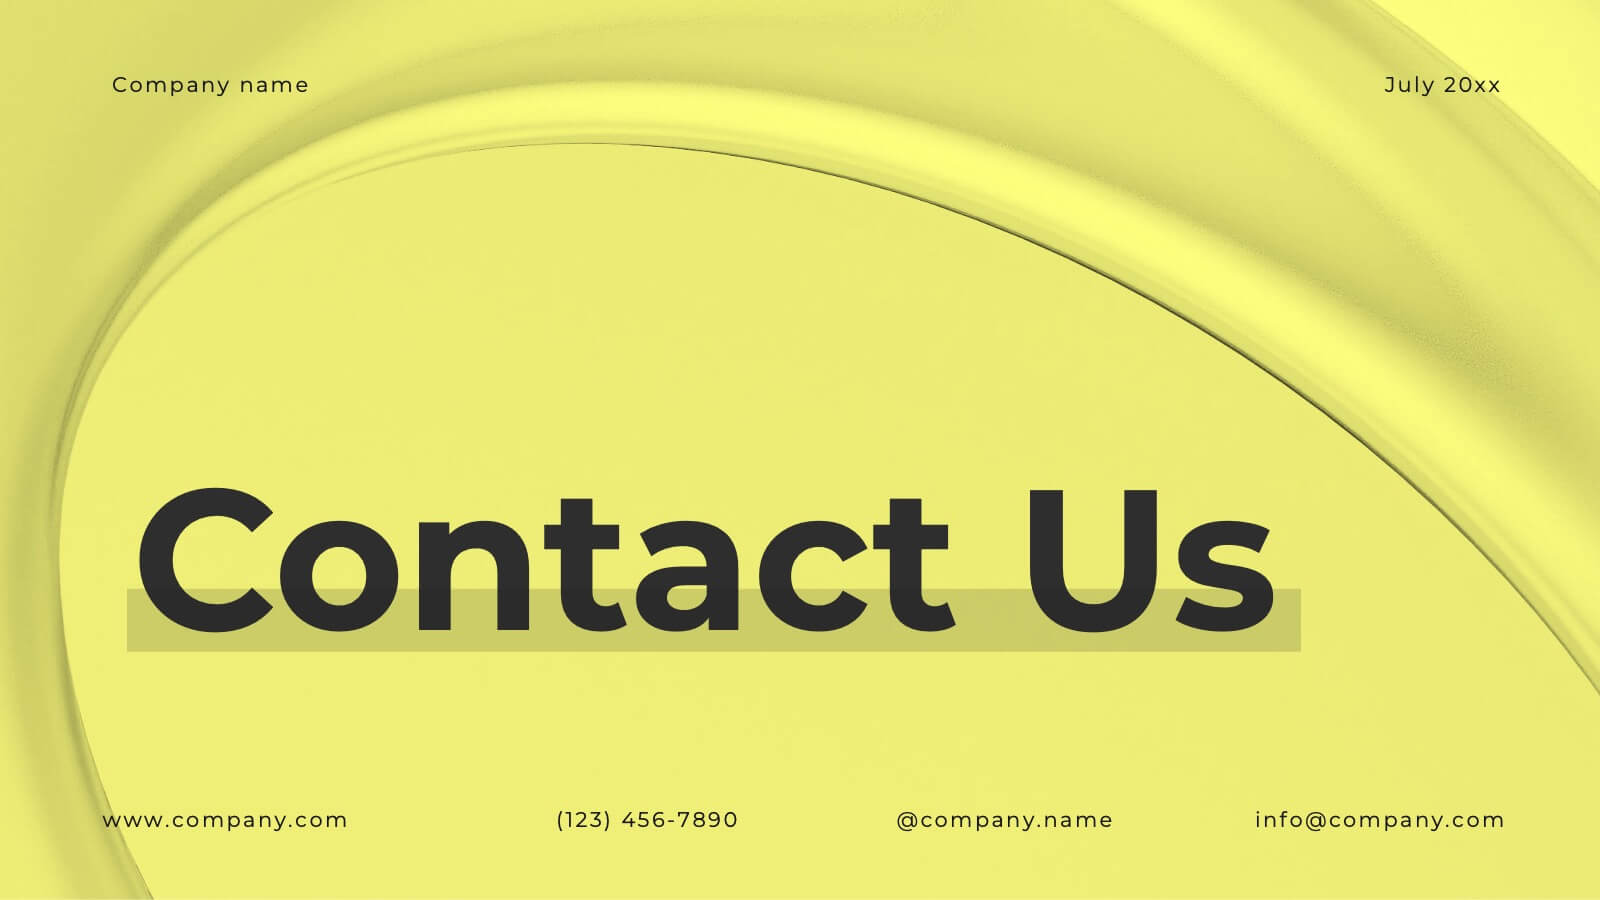
Modern Company Profile Layout Presentation
Bring your brand to life with this clean and modern layout built to highlight your company’s mission, values, and team. Its balanced design and easy-to-read sections make every detail stand out beautifully. Fully editable and compatible with PowerPoint, Keynote, and Google Slides for smooth customization and professional presentations.


5 diapositivas
Project Management Plan Presentation
Bring structure and clarity to every phase of your workflow with this clean, arrow-based layout designed to outline tasks, milestones, and key deliverables. This presentation makes planning feel organized, engaging, and easy to follow for any audience. Fully editable and ready to use in PowerPoint, Keynote, and Google Slides.


7 diapositivas
Mind Map Process Infographic
A Mind Map Process Infographic is a visual representation that illustrates a process or a series of steps using the structure and principles of a mind map. This template diagram is a dynamic visual guide to help individuals and teams harness the true potential of mind mapping. This is used to visually organize information in a hierarchical and interconnected manner, often starting with a central concept or theme and branching out into related ideas or subtopics. Mind maps are the ultimate tool for brainstorming, planning, and innovating, and this template is your gateway to unlocking their full potential.


5 diapositivas
5 Whys Analysis Slide Presentation
Unlock problem-solving clarity with a vibrant, puzzle-style layout that helps teams dig deeper and uncover the true reason behind any challenge. This presentation guides viewers through each “why” step in a simple, structured flow, making root-cause insights easy to communicate. Fully compatible with PowerPoint, Keynote, and Google Slides.


5 diapositivas
Financial Investment Portfolio Presentation
Visualize portfolio distribution like never before. This presentation features glass dome-protected coin stacks to represent diverse asset categories, risk levels, or growth stages. Ideal for financial advisors, investors, or business analysts presenting asset management plans. Fully editable in PowerPoint, Keynote, and Google Slides.


4 diapositivas
High-Performance Team Collaboration Presentation
Showcase teamwork, trust, and synergy with this bold, interconnected arms graphic. Ideal for illustrating roles, partnerships, or team frameworks, this infographic is perfect for leadership, HR, or corporate strategy slides. Fully customizable in PowerPoint, Keynote, and Google Slides.


5 diapositivas
Step-by-Step Strategy Guide Presentation
Present your ideas with clarity and impact using this clean, structured layout made for professionals who value organization and design. Perfect for outlining strategies, steps, or lists, it keeps your message focused and engaging. Easily customizable and fully compatible with PowerPoint, Keynote, and Google Slides for polished results.


22 diapositivas
Hellenic Small Business Pitch Deck Presentation
Unleash the spirit of entrepreneurship with this captivating Hellenic-themed presentation! Designed specifically for small business pitches, this template allows you to showcase your business concept, market analysis, and financial plans with elegance and clarity. Its vibrant visuals will engage your audience and leave a lasting impression. Compatible with PowerPoint, Keynote, and Google Slides.


5 diapositivas
Buyer Journey Infographic Presentation
Understanding how buyers move from awareness to action becomes effortless with this clean, visual presentation. It guides you through each stage, helping you explain behaviors, insights, and touchpoints with clarity. Easy to customize and fully compatible with PowerPoint, Keynote, and Google Slides.


7 diapositivas
Schedule Infographics Presentation Template
Featuring our Schedule Infographic template, this is a great tool for business owners, students and others who need to create an impactful presentation. Using this template will ensure that your main point is emphasized and can be easily understood by all of your viewers. This template includes different colors and fonts that can be easily edited and changed. This will help you visualize your existing data and create a presentation that includes all of your points. Use this template to make a professional and smart looking schedule, and present your plan to others in an easy to understand way.


26 diapositivas
Warm Tones Real Estate Presentation
Create an engaging and inviting Warm Tone Real Estate presentation with this easy to use template. The color scheme of this welcoming template features warm tones to set the mood for a peaceful, natural environment. The cover slide features emerald green and brown, while the next two slides use warmer brown, tan shades, keeping the same theme going. Fully customizable, this template is ready to help you sell and promote properties quickly and easily. This layout is perfect for showcasing properties with a premium feel that’ll inspire confidence in both buyers and sellers alike.


6 diapositivas
Leadership Vision and Strategy Presentation
Present your organization’s goals with this leadership vision and strategy template, designed with a hierarchy graphic to represent team structure and growth. Perfect for strategic planning, leadership meetings, and corporate presentations. Fully editable in Canva, PowerPoint, or Google Slides, making it easy to customize colors, text, and layout to fit your brand.