Leadership and Organizational Vision Presentation
PowerPoint Template and Google Slides Theme


Características
- Eliminar de favoritos
Plantilla de PowerPoint
1 MB
Plantilla de Google Slides
Enlace externo
Plantilla de Keynote
2 MB
Recomendar
- Eliminar de favoritos
Plantilla de PowerPoint
1 MB
Plantilla de Google Slides
Enlace externo
Plantilla de Keynote
2 MB
7 diapositivas
Security Infographic Presentation Template
Security is the key to protecting your information and the future of your business. Security is the ability to defend a position and data from threats. This presentation template is a great way to show how important security is for your businesses. This includes physical security and digital security. With this template show how a strong security strategy is essential. Your first priority as a business owner should be the safety and security of your workplace. This template features the perfect security illustrations you need to get your point across when displaying this presentation.
- Eliminar de favoritos
Plantilla de PowerPoint
5 MB
Plantilla de Google Slides
Enlace externo
Plantilla de Keynote
6 MB
26 diapositivas
Corporate Social Responsibility (CSR) Presentation
Reinforce your commitment to positive impact with our Corporate Social Responsibility (CSR) presentation template, compatible with PowerPoint, Keynote, and Google Slides. This template is expertly crafted for businesses and organizations looking to present their CSR initiatives, environmental efforts, and community engagements. It features a professional yet inviting design with green accents to symbolize the commitment to sustainability. The template offers a variety of slide types to cover all aspects of your CSR strategy. Use 'process infographics' to outline your sustainable practices, 'mind map infographics' to explore the impact of your activities, and 'chart slides' to present your social and environmental achievements quantitatively. Our CSR template is not just for presentations; it's a statement of your organization's values and dedication to making a difference. Download it now to communicate your CSR goals and actions with clarity and inspire your stakeholders to join you in driving change for a better world.
- Eliminar de favoritos
Plantilla de PowerPoint
1 MB
Plantilla de Google Slides
Enlace externo
Plantilla de Keynote
1 MB
5 diapositivas
Healthcare Innovations and Medical Trends Presentation
Showcase breakthroughs and progress with the Healthcare Innovations and Medical Trends Presentation. This slide features a stylized heart icon with segmented color highlights tied to four labeled icons—perfect for visualizing trends, solutions, or stages in care. Fully editable in Canva, PowerPoint, Keynote, and Google Slides for easy customization.
- Eliminar de favoritos
Plantilla de PowerPoint
1 MB
Plantilla de Google Slides
Enlace externo
Plantilla de Keynote
1 MB
6 diapositivas
Work Flow Chart Infographic
Enhance process understanding with our Workflow Chart Infographic, suitable for Powerpoint, Google Slides, and Keynote. Ideal for project managers, team leads, and operational managers, this infographic simplifies the visualization of workflow processes. With customizable shapes representing different stages, tasks, or decisions, this template helps clearly demonstrate the flow of tasks from start to completion. It's an effective tool for illustrating sequences, responsibilities, and handoffs in business processes. Use this infographic to streamline your operations and communicate processes with clarity to your team and stakeholders.
- Eliminar de favoritos
Plantilla de PowerPoint
1 MB
Plantilla de Google Slides
Enlace externo
Plantilla de Keynote
2 MB
20 diapositivas
Waterfall Project Proposal Presentation
Get ready to impress with the Waterfall Project Proposal template! This visually striking and highly organized template is designed to help you communicate your project plan with clarity and impact. Start with an engaging introduction and company overview, then seamlessly guide your audience through the project summary, problem statement, and your proposed solutions. This template covers all essential aspects, including objectives, goals, scope of work, methodology, and a detailed timeline of milestones. With dedicated sections for pricing structure, team expertise, and client testimonials, you can showcase the strengths and reliability of your proposal. The template also includes slides for risk management, terms and conditions, and a clear next steps action plan. Perfect for any professional setting, this template is fully customizable and compatible with PowerPoint, Keynote, and Google Slides, ensuring that your proposal looks polished and professional every time.
- Eliminar de favoritos
Plantilla de PowerPoint
11 MB
Plantilla de Google Slides
Enlace externo
Plantilla de Keynote
2 MB
21 diapositivas
Graphium Market Analysis Report Presentation
Deliver actionable insights with this sleek market analysis report presentation template. Highlight key areas such as performance metrics, market trends, competitor insights, and strategic initiatives to inform stakeholders and drive decisions. Perfect for analysts and business teams, this template is fully compatible with PowerPoint, Keynote, and Google Slides.
- Eliminar de favoritos
Plantilla de PowerPoint
1 MB
Plantilla de Google Slides
Enlace externo
Plantilla de Keynote
1 MB
7 diapositivas
Programming Framework Infographic
Delve into the intricate world of coding with the programming framework infographic. With a harmonious palette of blue, white, and green, this template visualizes the intricacies of different programming frameworks in a clear and engaging manner. Tailor-made for developers, software engineers, educators, and tech enthusiasts, it transforms complex concepts into digestible visual snippets. Embedded with custom graphics, relevant icons, and adaptable image placeholders, it enhances any tech presentation. Moreover, its seamless adaptability with PowerPoint, Keynote, and Google Slides ensures you leave a lasting impression.
- Eliminar de favoritos
Plantilla de PowerPoint
Enlace externo
Plantilla de Google Slides
Enlace externo
Plantilla de Keynote
Enlace externo
7 diapositivas
Design Process Infographic Presentation
A Process Infographic is a visual representation of a series of steps or stages in a particular process. Get inspired by this hands-on Design Process Infographic. Featuring the process from identifying to management and success. This template is perfect for sharing your story by showing the steps and creating a portfolio. In this template icons and other visual elements are included to help convey your complex information in an easy-to-understand format. Communicate your process clearly and make this your starting point just change the text, colors and fonts to fit your needs in only minutes.
- Eliminar de favoritos
Plantilla de PowerPoint
1 MB
Plantilla de Google Slides
Enlace externo
Plantilla de Keynote
1 MB
4 diapositivas
30-60-90 Day Business Plan
Kickstart new roles, projects, or team onboarding with this bold 30-60-90 Day Business Plan template. Designed to outline goals, milestones, and deliverables over three critical phases, this layout is ideal for managers, job candidates, and team leaders. Fully editable in PowerPoint, Keynote, and Google Slides.
- Eliminar de favoritos
Plantilla de PowerPoint
4 MB
Plantilla de Google Slides
Enlace externo
Plantilla de Keynote
3 MB
20 diapositivas
Solstice Research Proposal Presentation
This sleek research proposal template is crafted to impress! Highlighting sections like research methodology, literature review, key findings, and recommendations, it’s designed for in-depth presentations with a modern touch. Perfect for academic, business, or technical reports, this template is fully compatible with PowerPoint, Keynote, and Google Slides. Ideal for delivering insights with style!
- Eliminar de favoritos
Plantilla de PowerPoint
1 MB
Plantilla de Google Slides
Enlace externo
Plantilla de Keynote
1 MB
6 diapositivas
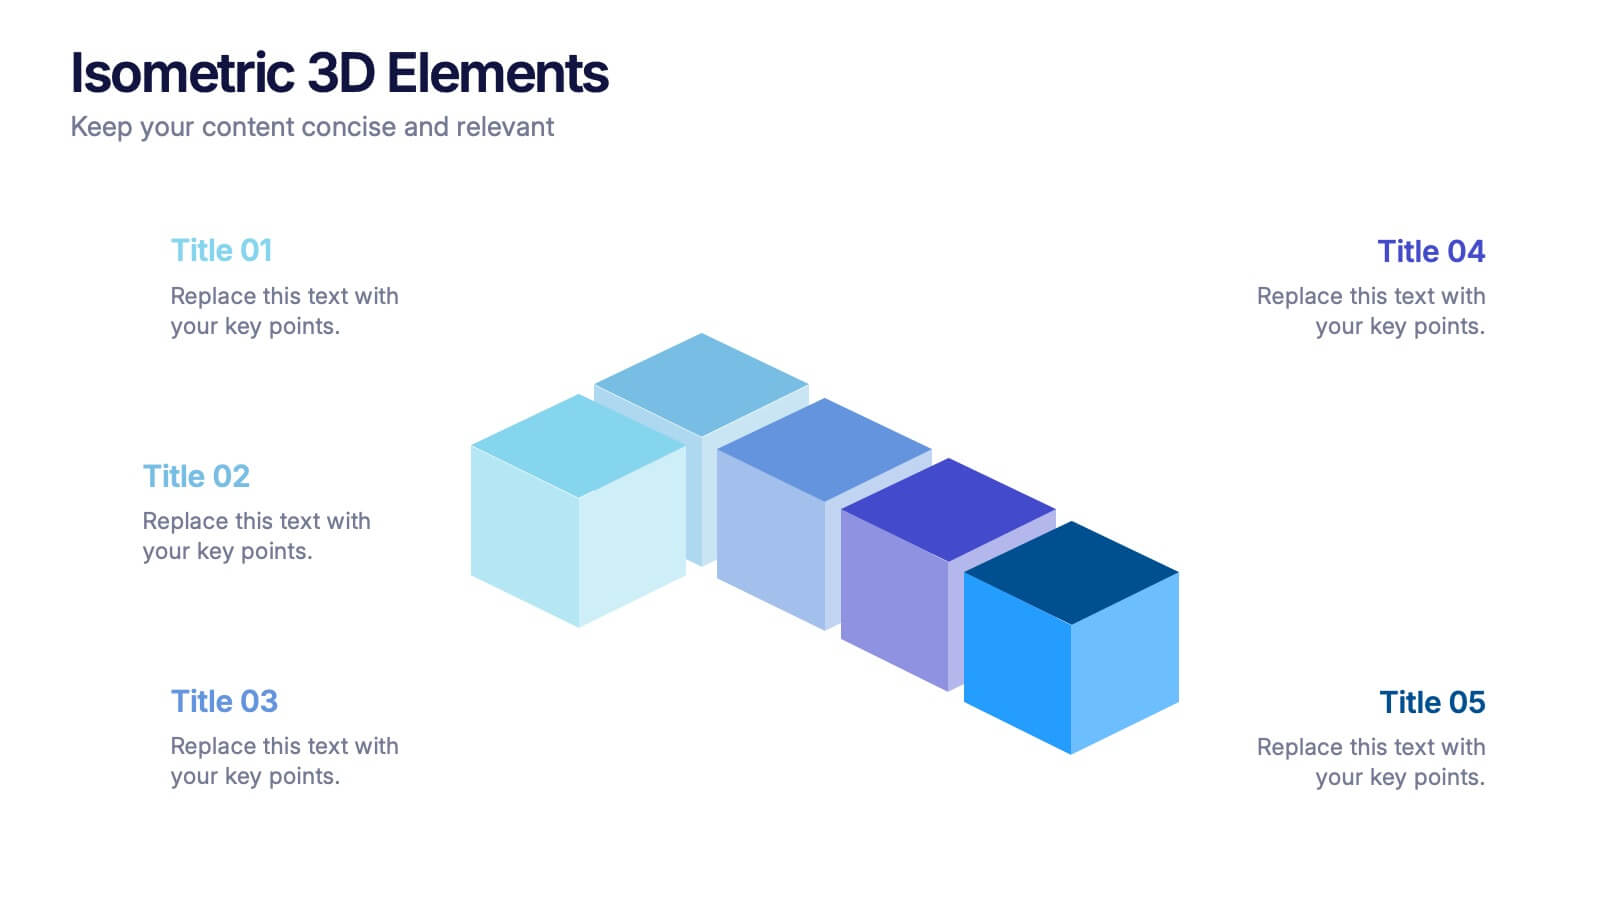
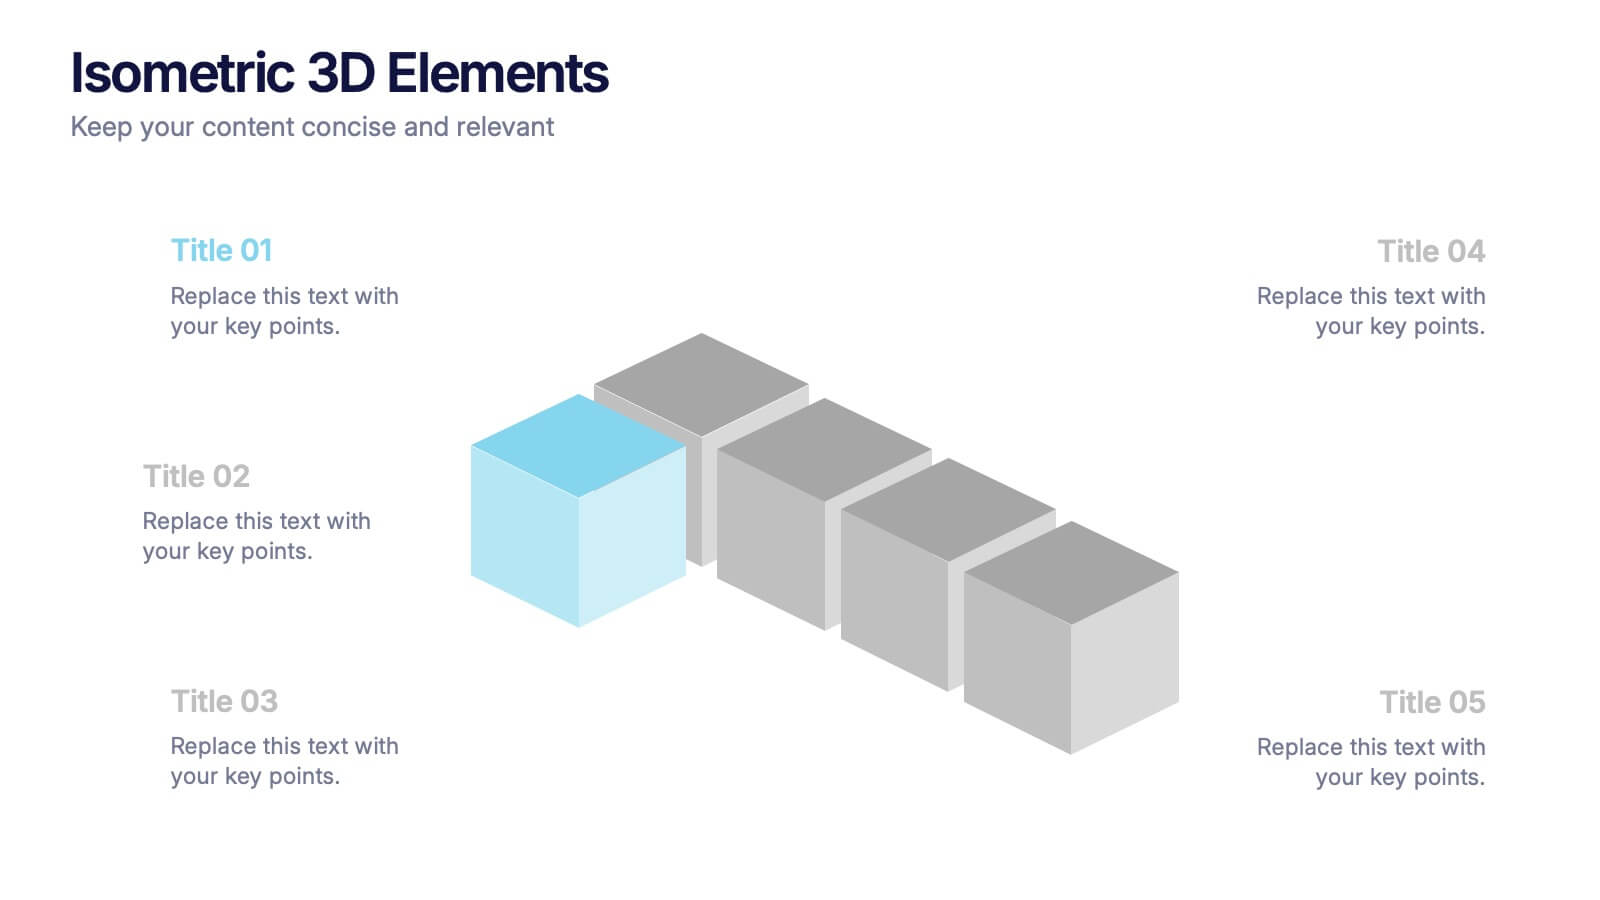
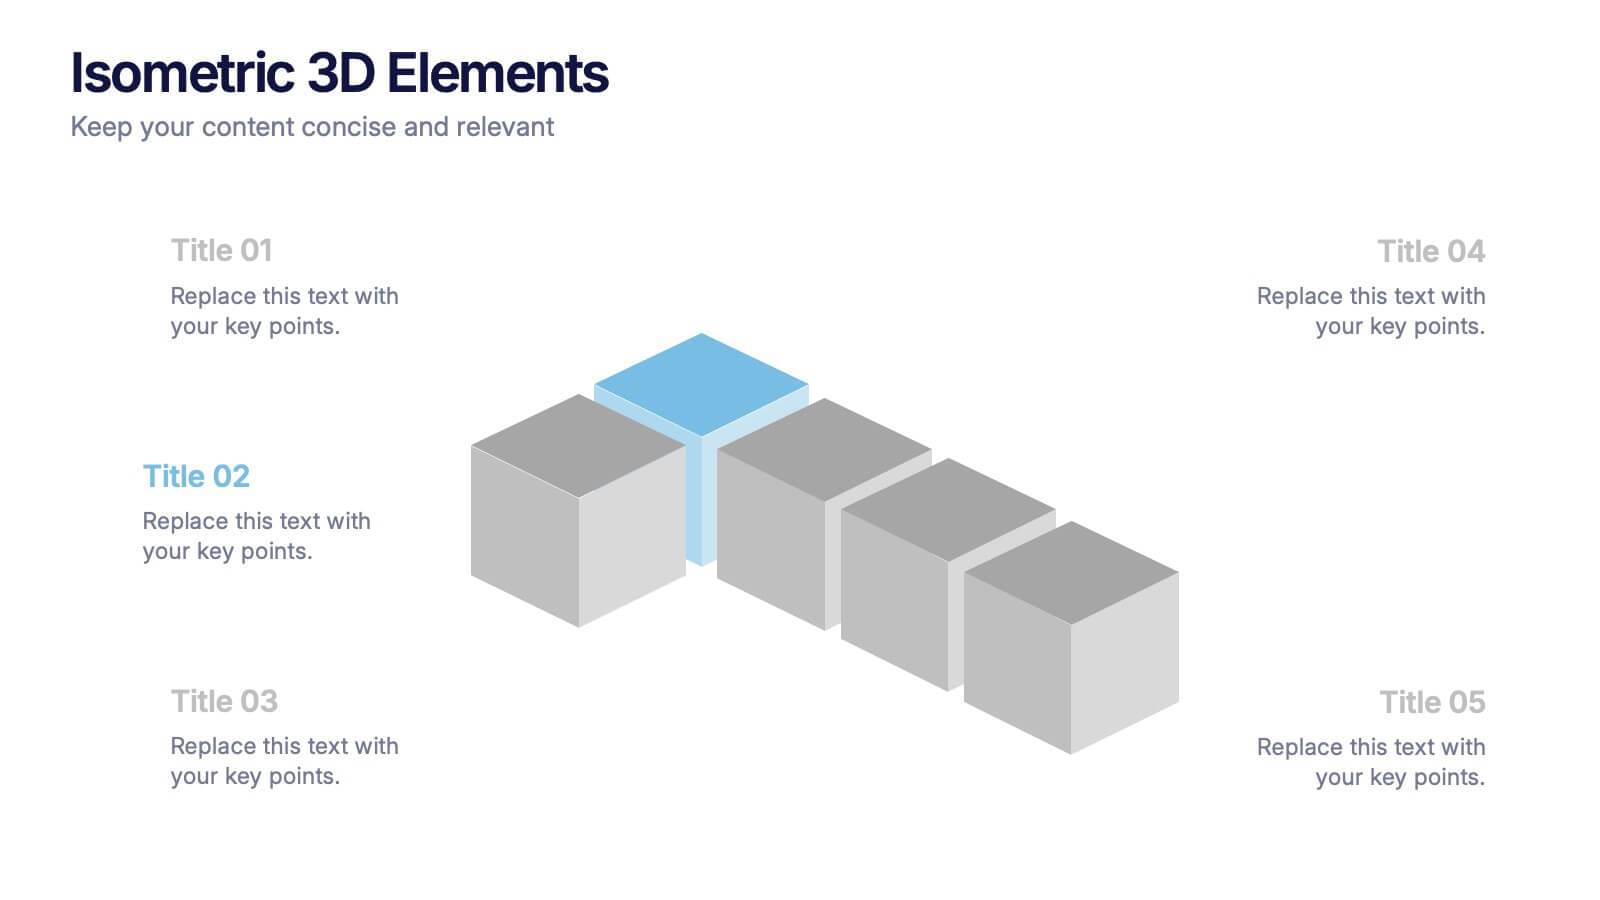
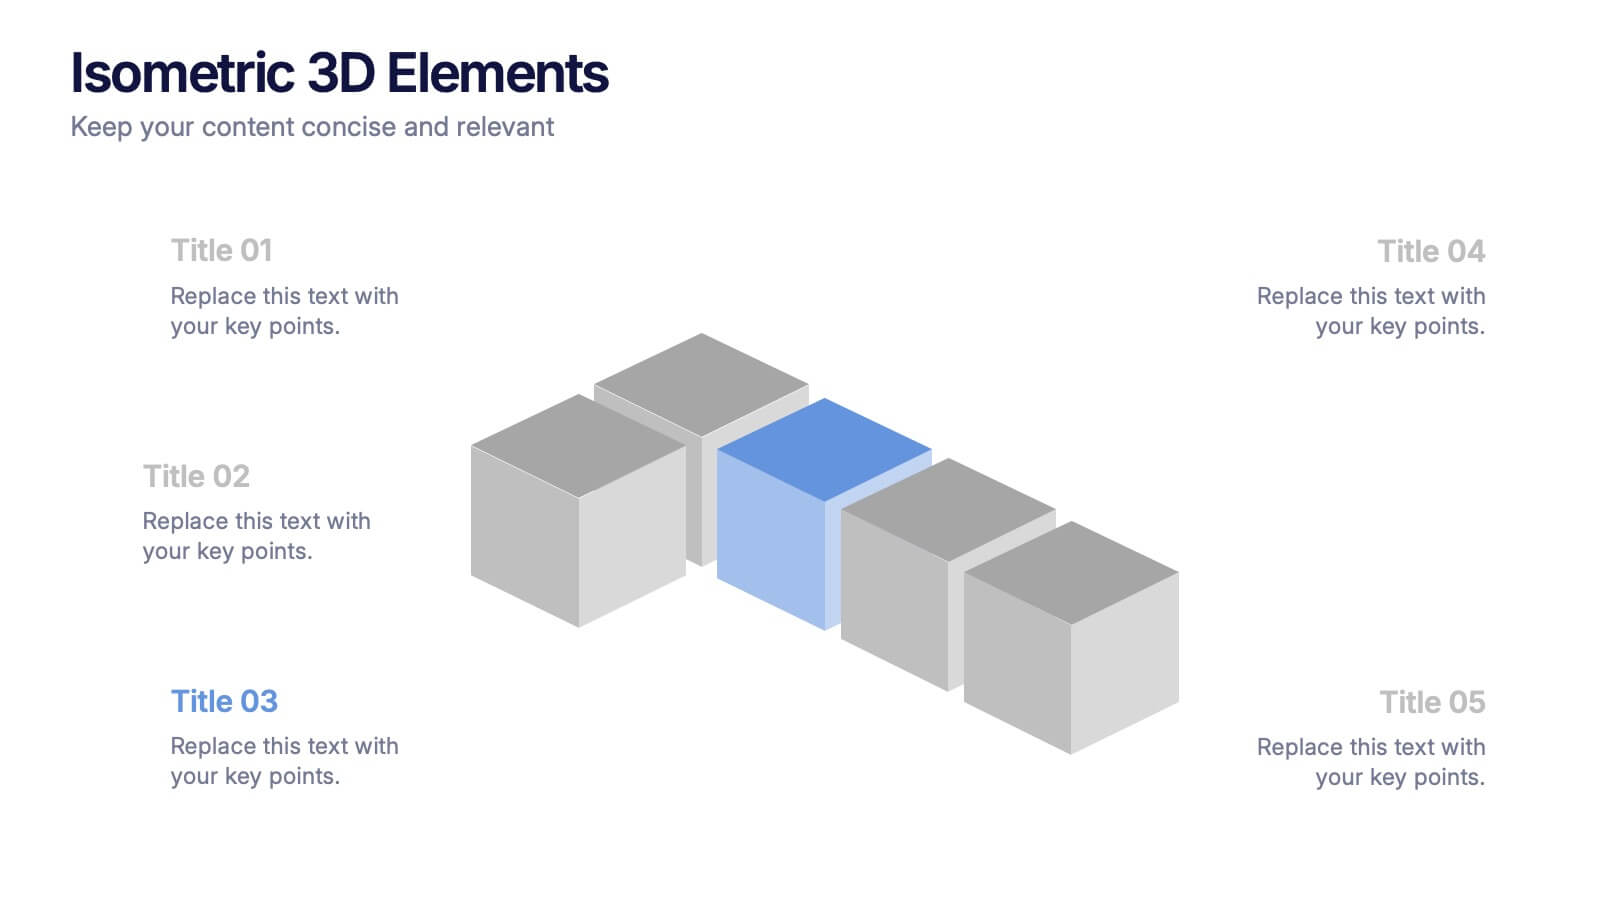
Isometric 3D Elements Presentation
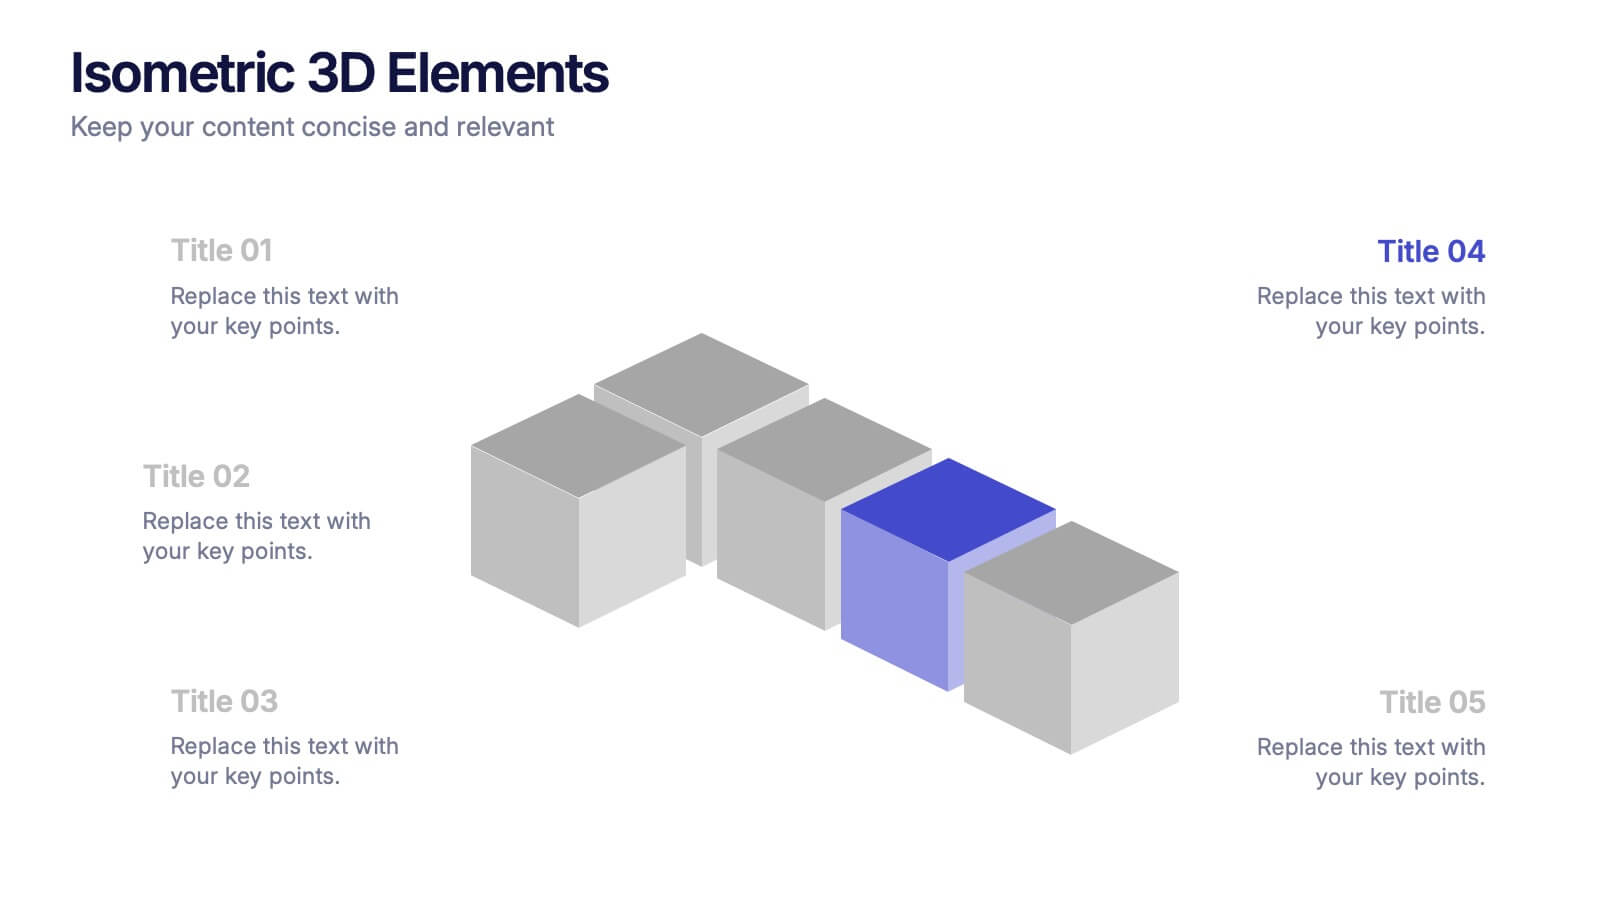
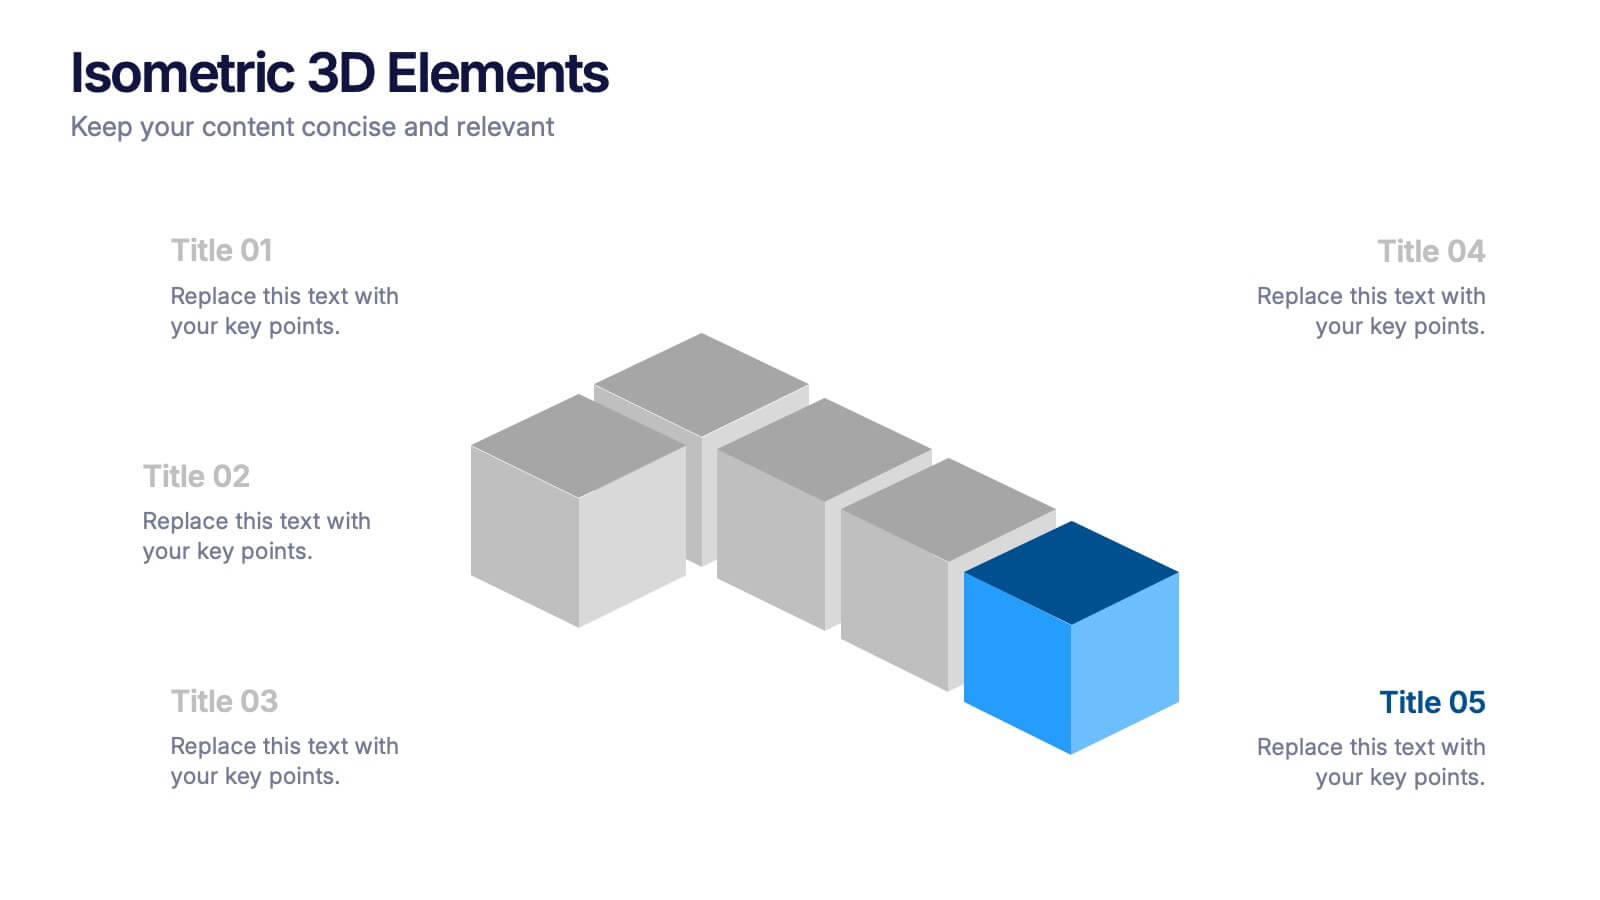
Add depth and dimension to your ideas with this sleek 3D visual layout that transforms flat concepts into engaging graphics. Perfect for showing connected processes, stages, or data structures, it balances clarity with creativity. Fully editable and compatible with PowerPoint, Keynote, and Google Slides for effortless customization.
- Eliminar de favoritos
Plantilla de PowerPoint
1 MB
Plantilla de Google Slides
Enlace externo
Plantilla de Keynote
1 MB
3 diapositivas
Designing a Loyalty Program Presentation
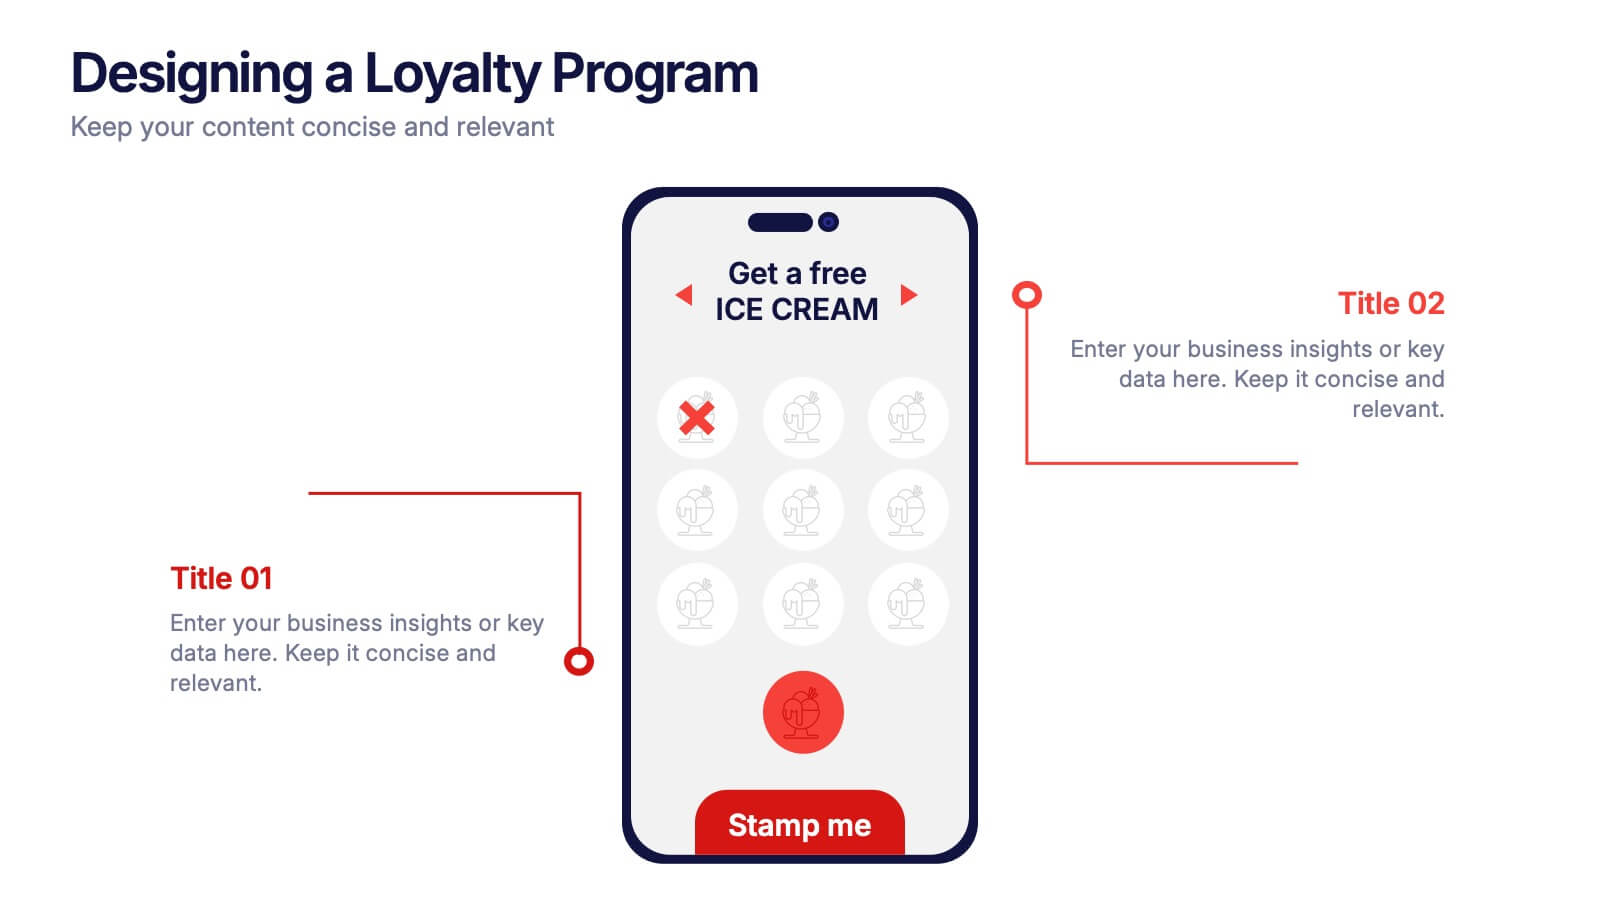
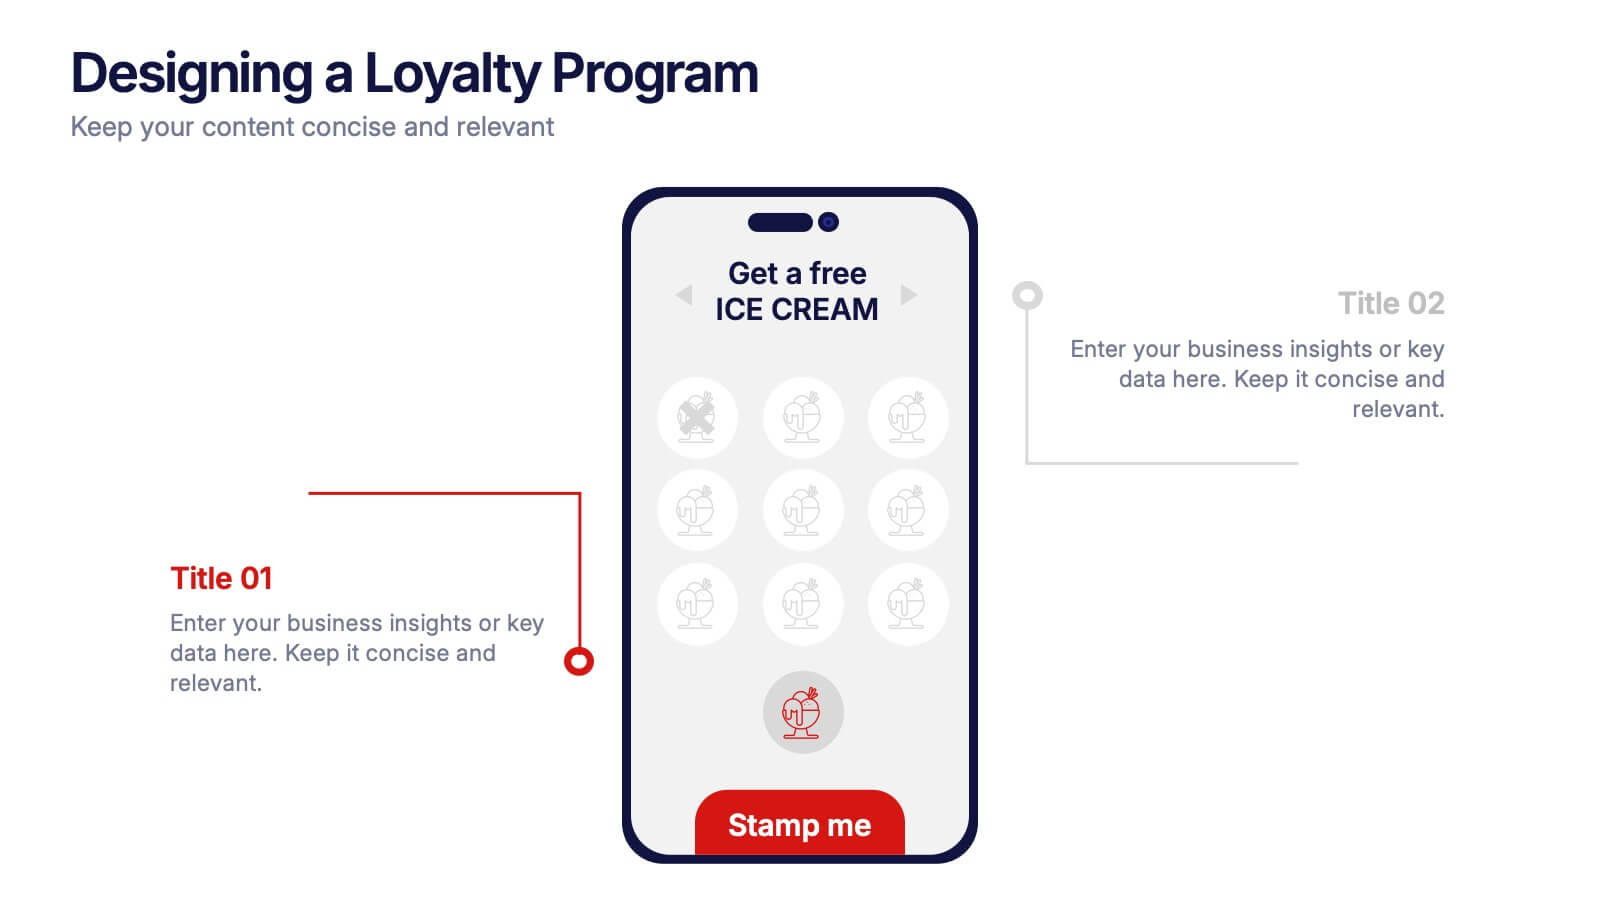
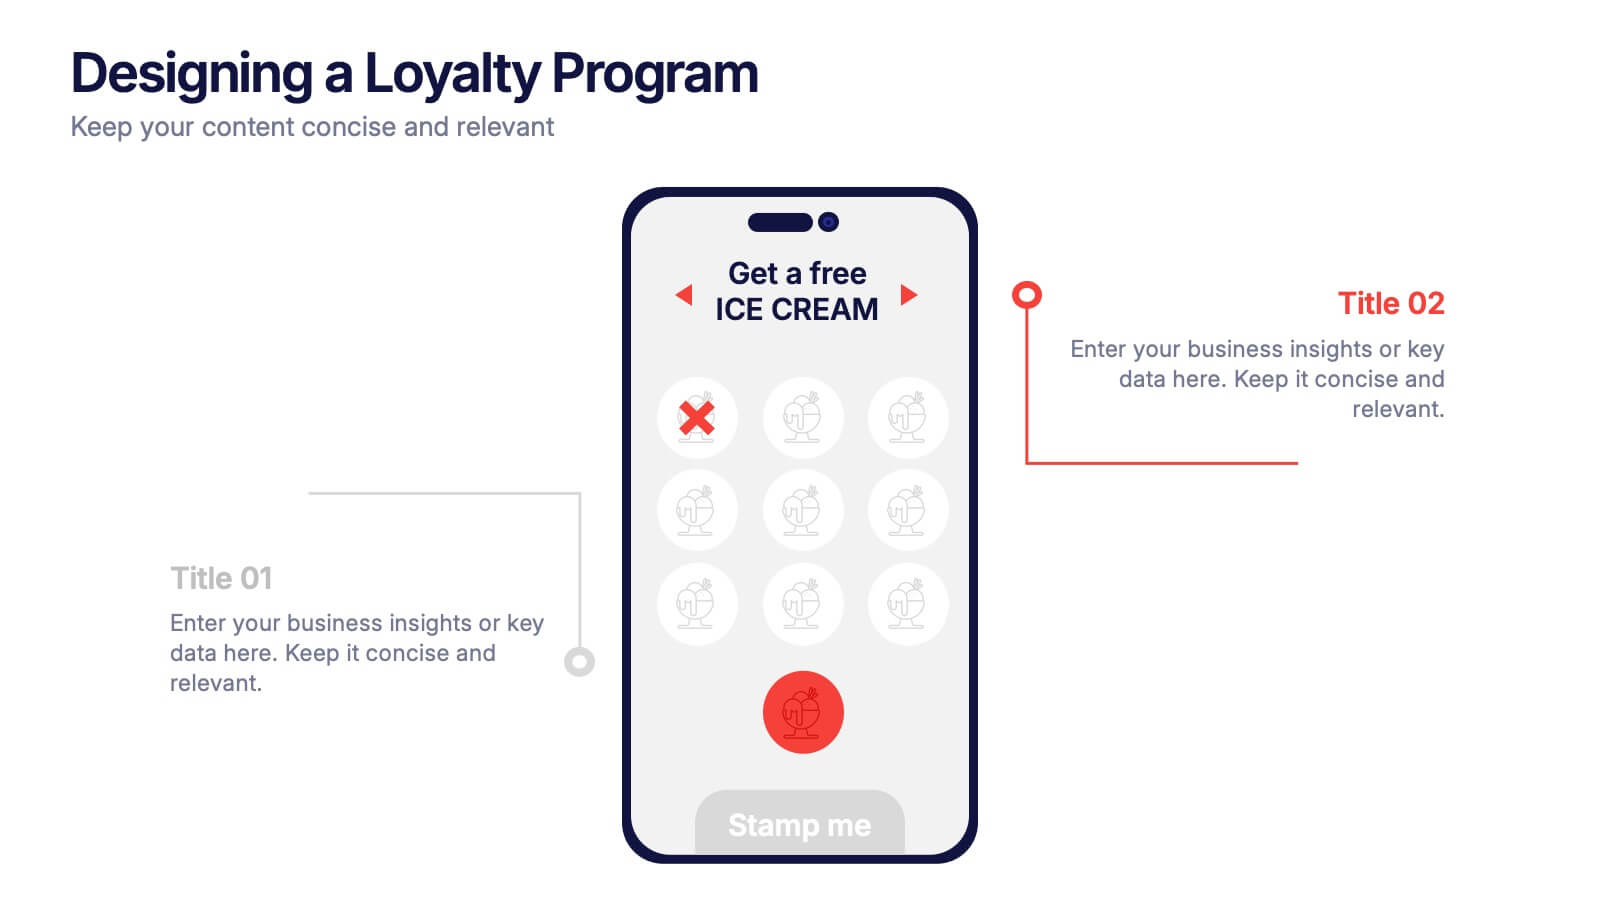
Build stronger customer connections with a sleek, modern layout that highlights how reward systems drive retention and engagement. This design is perfect for visualizing loyalty strategies, program tiers, and user benefits with clarity and style. Fully editable and compatible with PowerPoint, Keynote, and Google Slides for effortless customization.
- Eliminar de favoritos
Plantilla de PowerPoint
1 MB
Plantilla de Google Slides
Enlace externo
Plantilla de Keynote
1 MB
3 diapositivas
First 90 Days Action Strategy Plan Presentation
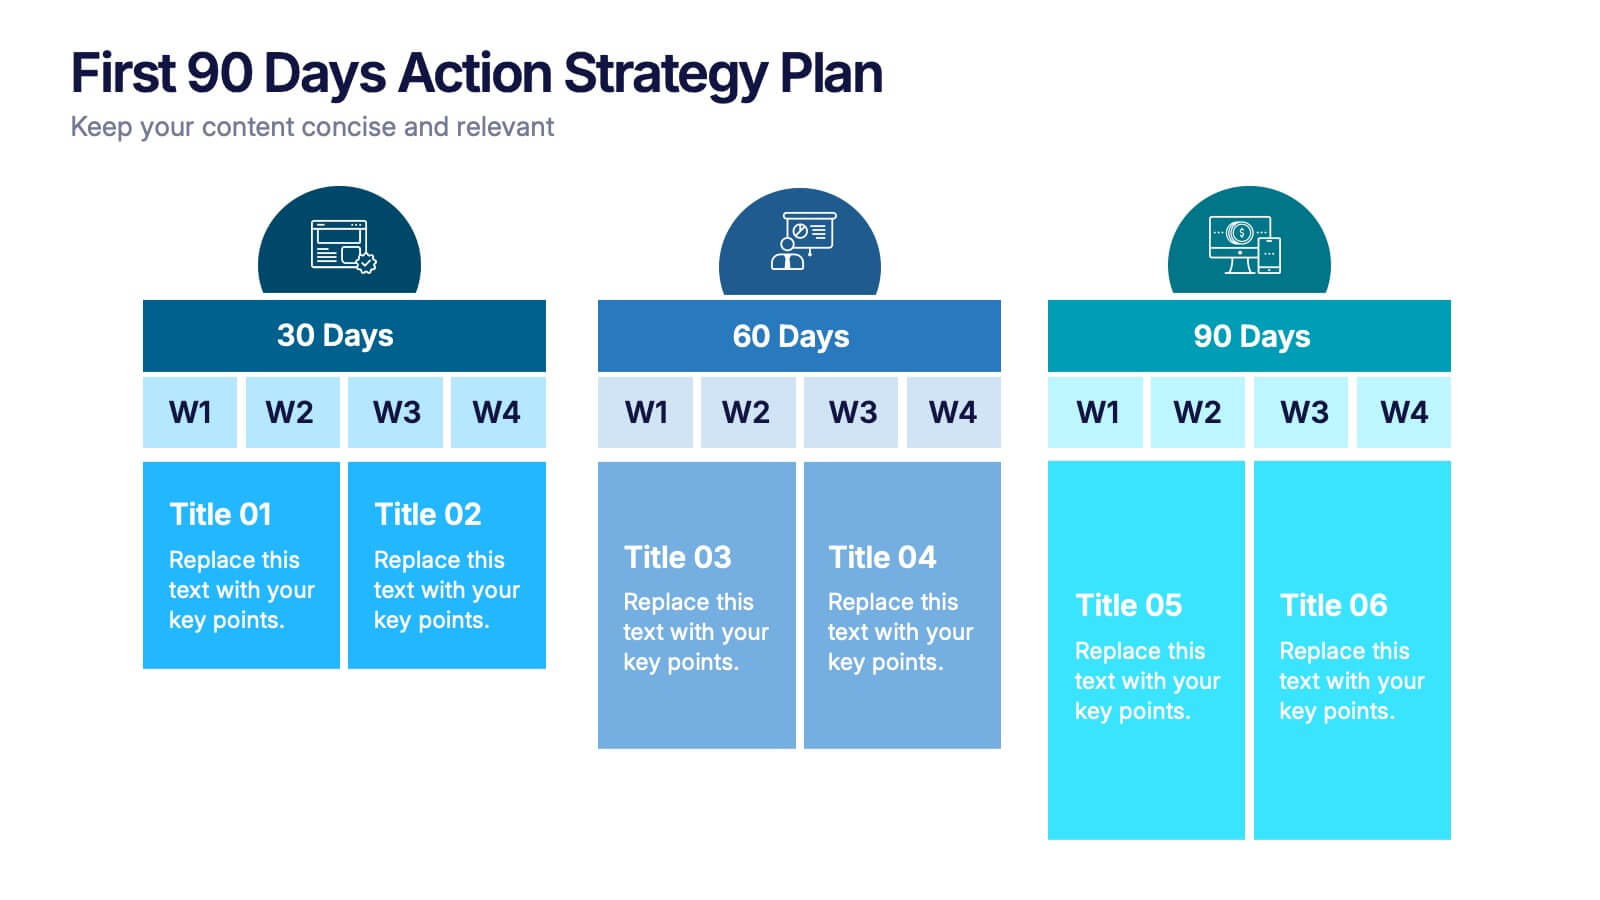
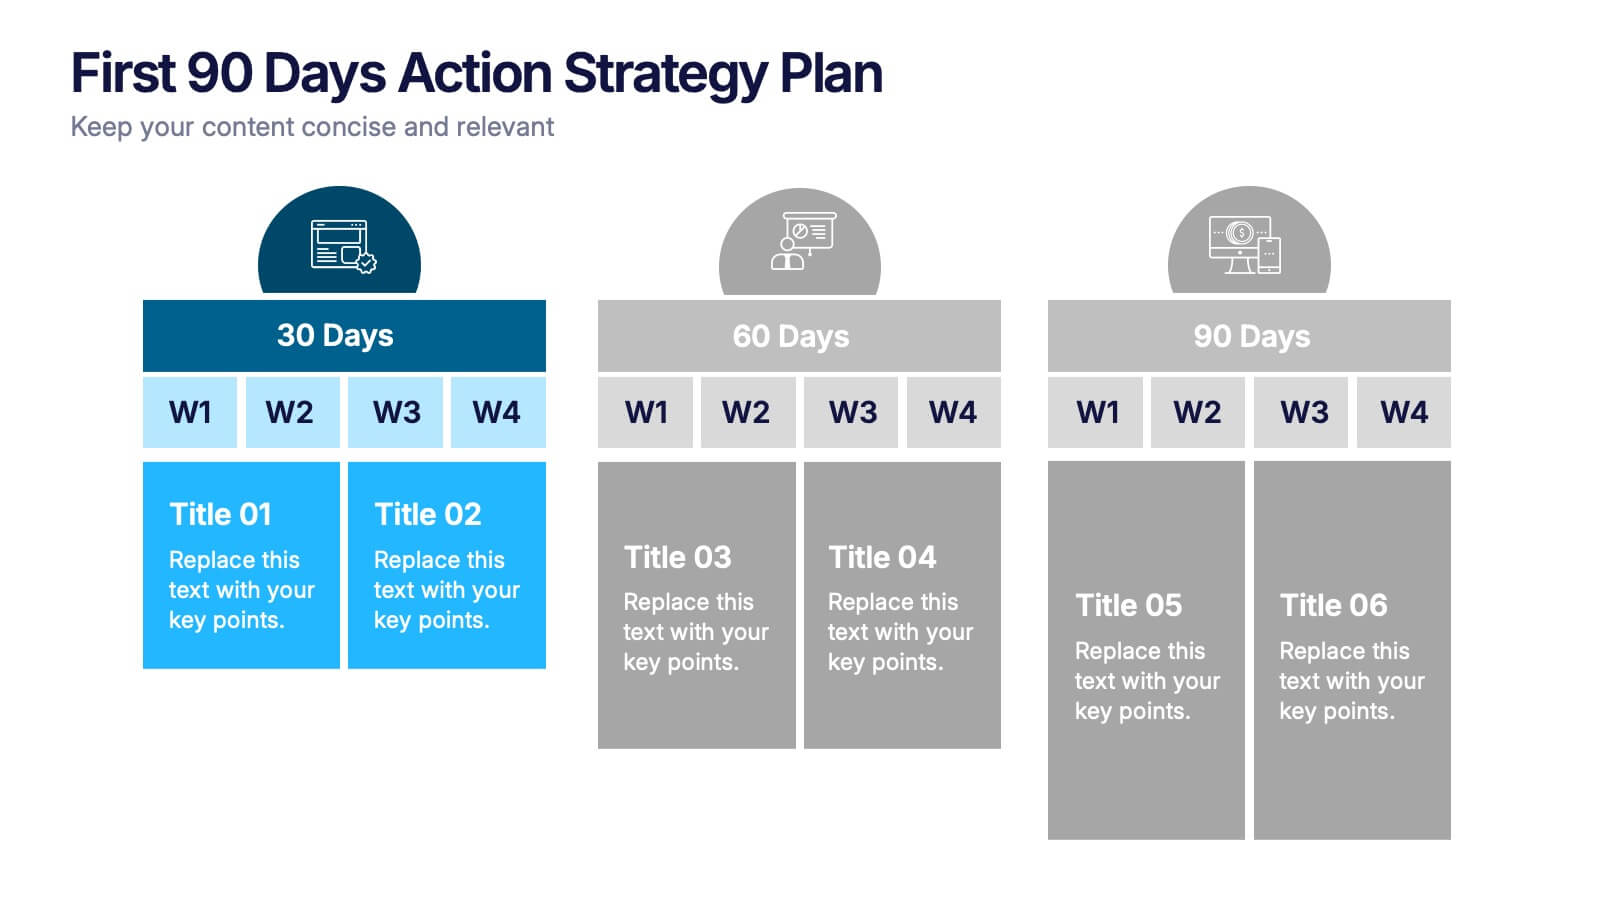
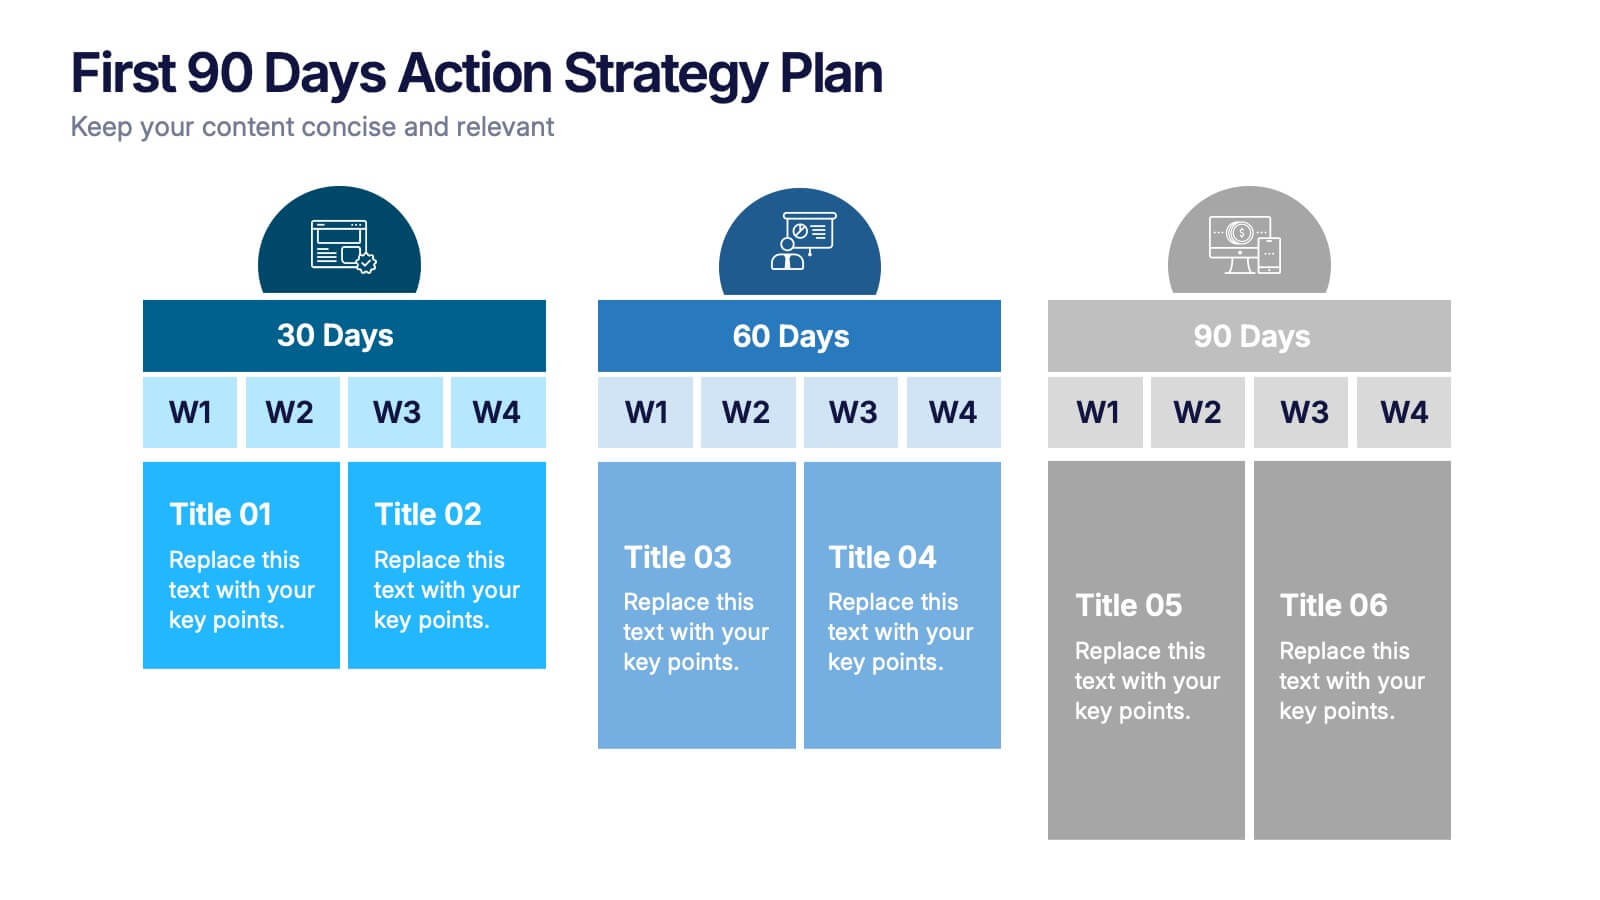
Get ready to crush your first 90 days with a strategy layout that actually makes sense. This template helps you outline clear goals, actions, and milestones to hit during your critical first quarter—perfect for managers or new hires. Fully customizable and compatible with PowerPoint, Keynote, and Google Slides for easy editing.
- Eliminar de favoritos
Plantilla de PowerPoint
1 MB
Plantilla de Google Slides
Enlace externo
Plantilla de Keynote
1 MB
6 diapositivas
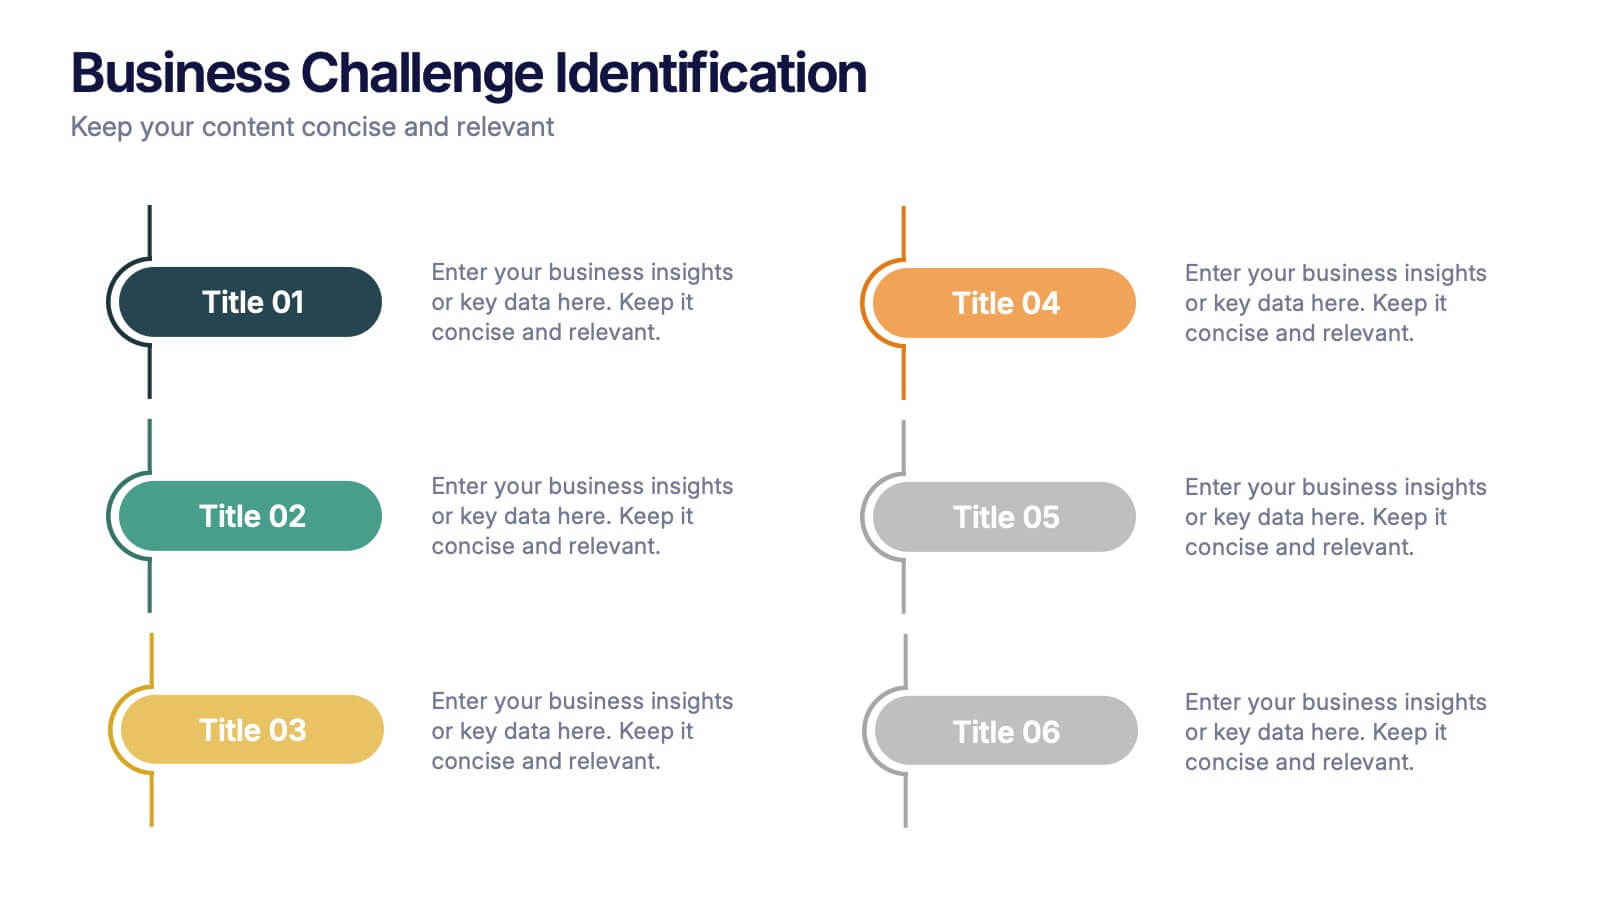
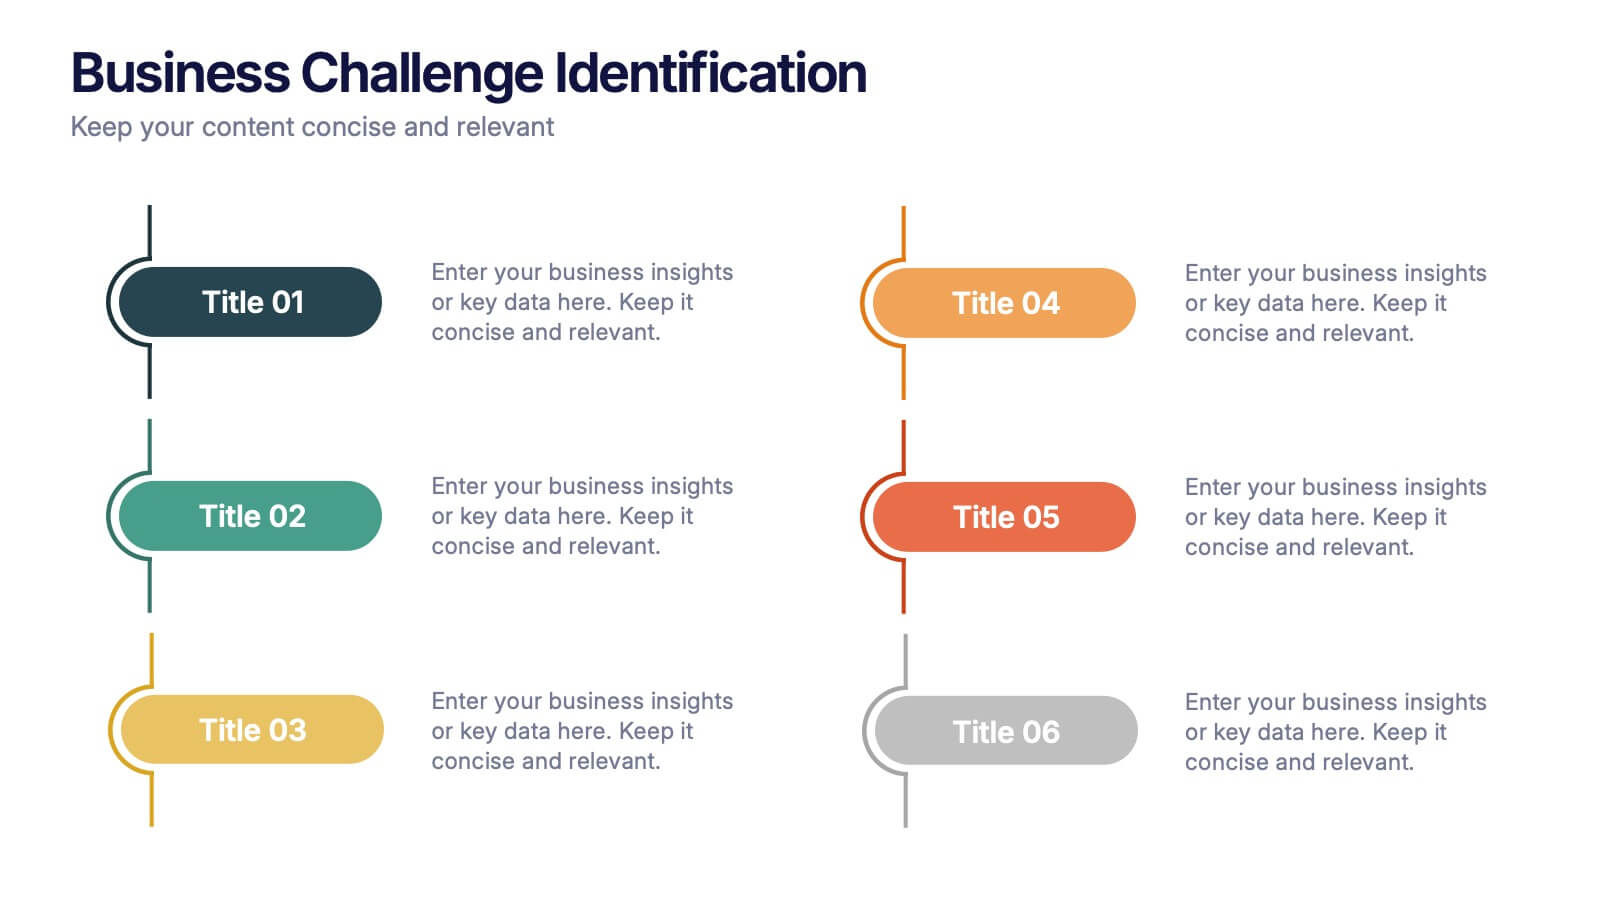
Business Challenge Identification Presentation
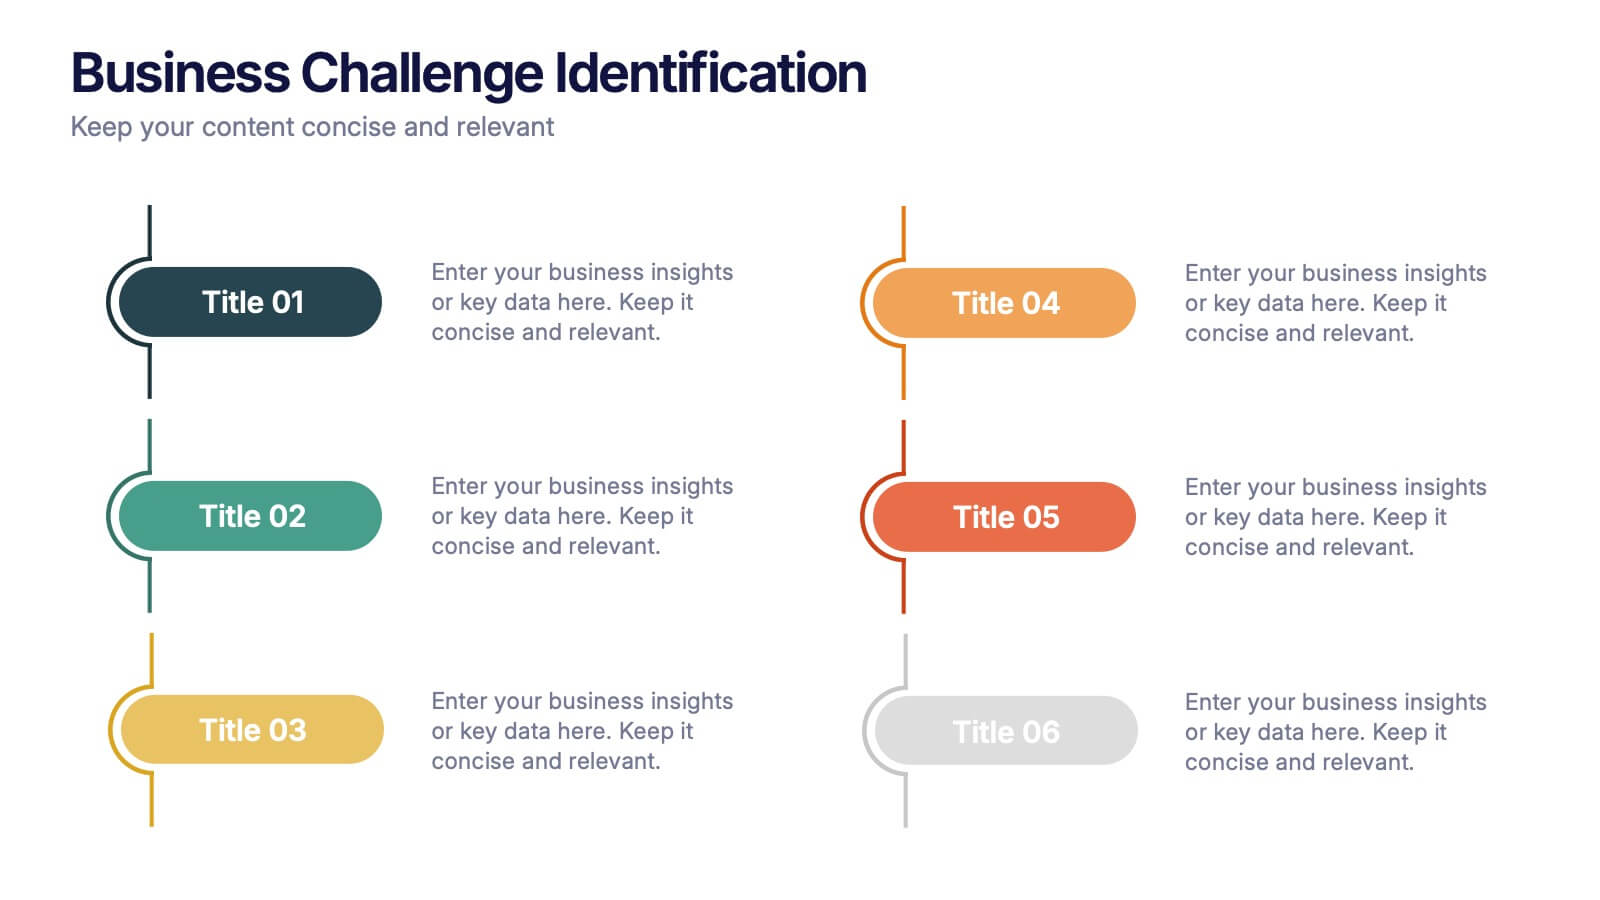
Spotting roadblocks has never looked this good! This infographic presentation template helps you map out key pain points across departments or processes, making it easier to analyze, discuss, and resolve challenges visually. It’s a perfect tool for business strategy teams and consultants. Fully compatible with PowerPoint, Keynote, and Google Slides.
- Eliminar de favoritos
Plantilla de PowerPoint
1 MB
Plantilla de Google Slides
Enlace externo
Plantilla de Keynote
1 MB
5 diapositivas
Social Myths & Facts Infographics
A Social Myth might be a certain belief, while a Social Fact would be the correct answer with data. This engaging and informative Infographics template is designed to help you dispel common misconceptions and provide accurate information on various social topics. With this template you can cover stereotypes, challenge myths, or present facts to promote understanding and awareness. The template features a modern design with vibrant colors and captivating visuals, making it visually appealing and easy to navigate. It includes a variety of design elements such as icons, illustrations and timelines that can all be customized.
- Eliminar de favoritos
Plantilla de PowerPoint
7 MB
Plantilla de Google Slides
Enlace externo
Plantilla de Keynote
9 MB
26 diapositivas
Entrepreneurship 101 Professional Presentation
This template offers a modern, professional framework for presentations about Entrepreneurship 101. It combines a clean, contemporary design with a palette of cool blues and muted reds, setting a tone that's both creative and serious—just right for the innovative spirit of entrepreneurship. Within its slides, you'll find all the tools needed to outline the essentials of starting a new business, from identifying opportunities to understanding market trends. Perfect for aspiring entrepreneurs, business school classes, or startup workshops, the template includes varied slide types: team introductions, big ideas, comparative analyses, and growth charts. The slides also feature infographics for brainstorming sessions, process flows for business operations, and timeline representations for strategic planning. Designed for adaptability, the template works seamlessly with PowerPoint, Keynote, and Google Slides, ensuring your entrepreneurial vision can be shared with clarity and impact.
- Eliminar de favoritos
Plantilla de PowerPoint
1 MB
Plantilla de Google Slides
Enlace externo
Plantilla de Keynote
1 MB
4 diapositivas
Workforce Skills Gap Analysis
Spot the gap. Bridge the skills. This Workforce Skills Gap Analysis slide helps visualize the journey from your team’s current capabilities to their desired performance level, with a clear action plan in between. Fully editable and works seamlessly in PowerPoint, Keynote, and Google Slides.


