


Características


¿Tienes alguna pregunta?
Recomendar


4 diapositivas
Cost Analysis and Budget Overview Presentation
Break down financial details with clarity using the Cost Analysis and Budget Overview Presentation. This slide helps you present cost structures, budget allocations, and key financial metrics side by side using icons and visual data blocks. Perfect for reports, planning, or investment decks. Fully editable in PowerPoint, Google Slides, Keynote, and Canva.


21 diapositivas
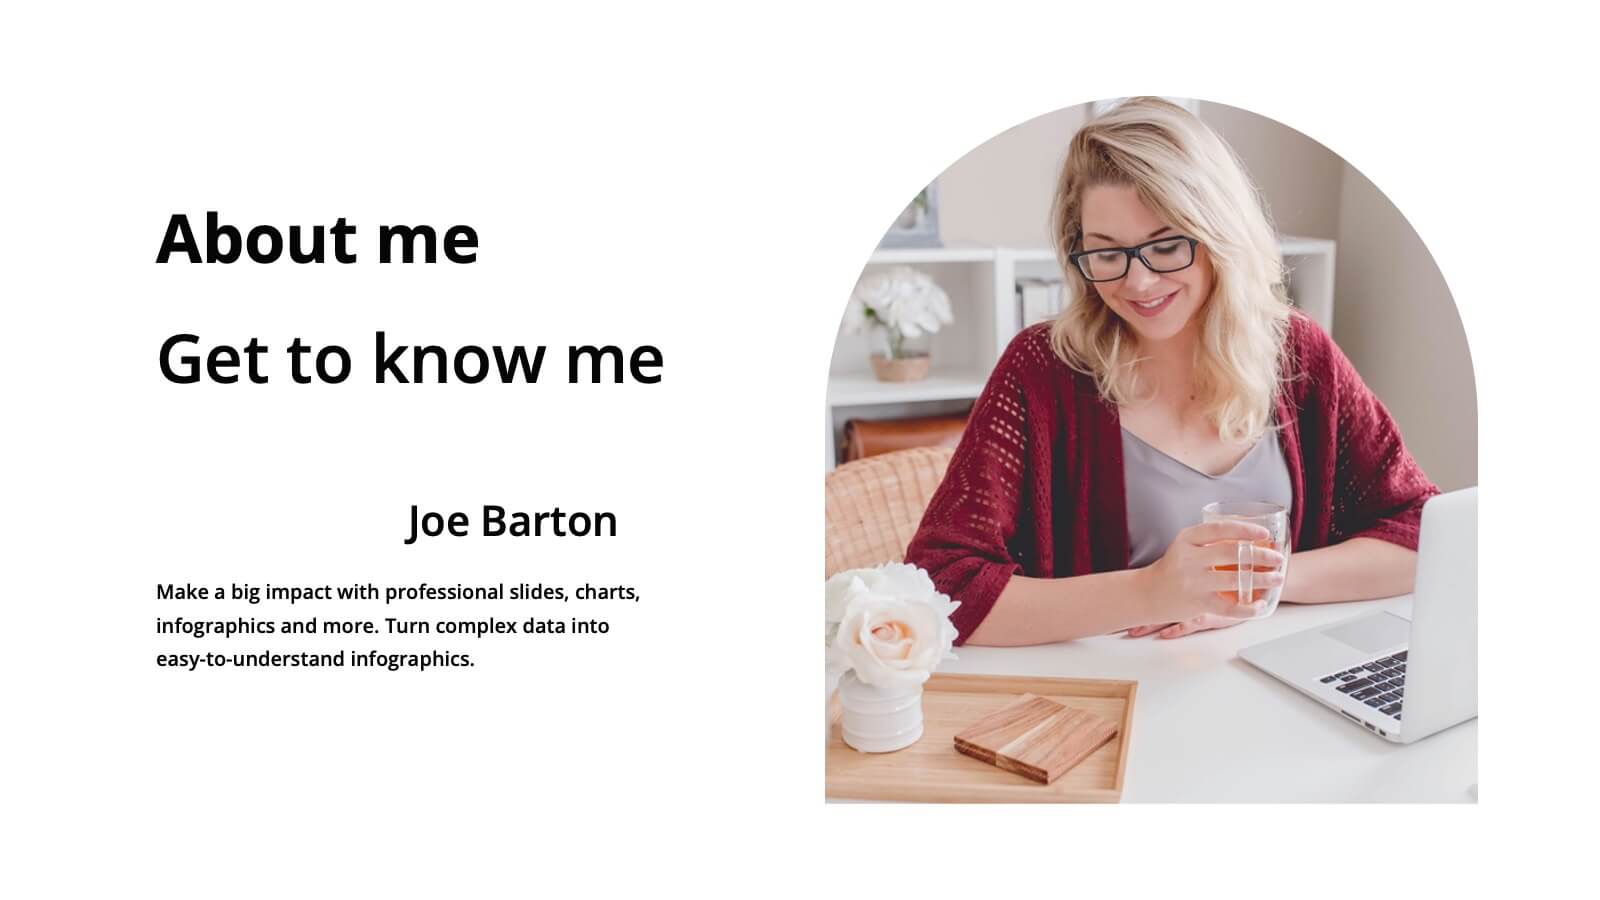
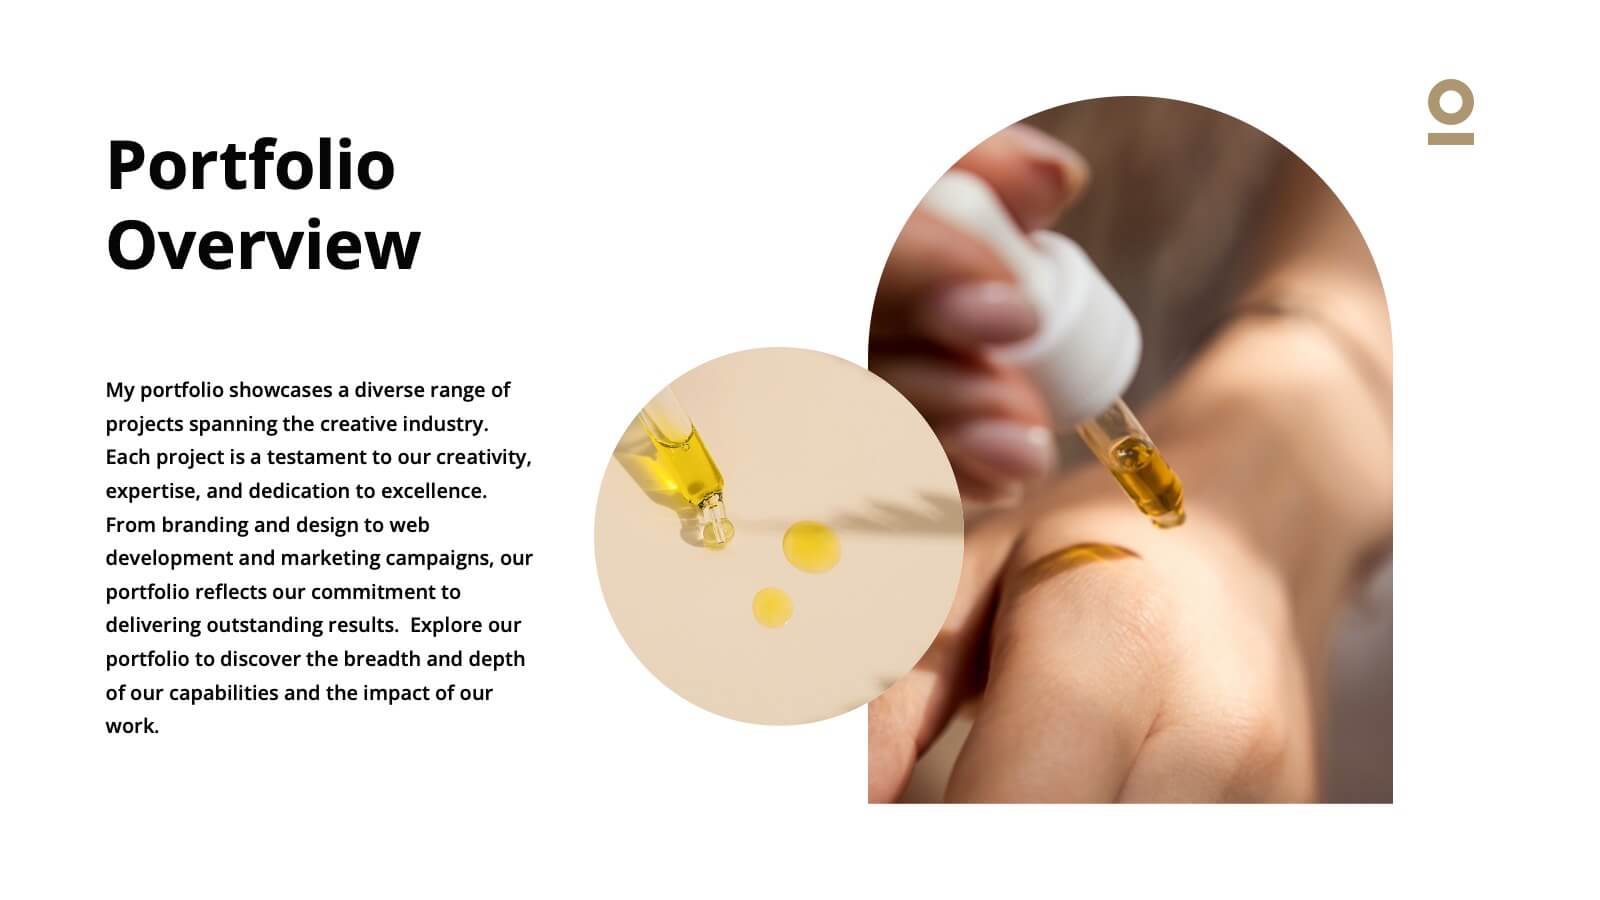
Haze Professional Portfolio Showcase Presentation
Elevate your professional presence with this stunning haze-inspired presentation template! Ideal for showcasing your portfolio, it beautifully highlights your skills, projects, and achievements with a clean and sophisticated design. This template ensures your work stands out, captivating potential clients and employers. Compatible with PowerPoint, Keynote, and Google Slides.


5 diapositivas
Scaling Operations and Team Expansion Presentation
Illustrate your company’s growth journey with the Scaling Operations and Team Expansion Presentation. This dynamic layout uses a circular sequence to showcase five key phases of business scaling, from small teams to full-scale departments. Perfect for strategy sessions, investor updates, and team meetings. Fully editable in Canva, PowerPoint, Keynote, and Google Slides.


7 diapositivas
Agenda and Sections TOC Presentation
Bring your audience in with a dynamic, story-driven overview that makes each section feel intentional and easy to follow. This presentation highlights key agenda points in a clean, structured layout, helping you introduce topics with clarity and flow. Fully compatible with PowerPoint, Keynote, and Google Slides.


21 diapositivas
Phoenix Design Portfolio Presentation
Elevate your design presentations with this stylish, contemporary template. Perfect for showcasing design portfolios, concept development, and project timelines, it features a modern layout with vibrant colors. Highlight key elements like color palettes, textures, and design processes to captivate your audience. Compatible with PowerPoint, Keynote, and Google Slides, it ensures seamless presentations on any platform.


6 diapositivas
Phased Implementation Timeline Presentation
Visualize your project rollout in clear, progressive stages using this curved, multi-phase timeline. Perfect for strategic plans, implementation roadmaps, or development cycles. Includes 6 customizable points with labels, icons, and years. Ideal for business teams and consultants. Fully editable in PowerPoint, Keynote, and Google Slides. Clean, modern, and easy to adapt.


5 diapositivas
Product Life Cycle Strategy Framework Presentation
Bring structure and clarity to your business strategy with this clean circular infographic design. Ideal for showcasing product evolution, performance metrics, and planning stages, it helps visualize complex data in a professional, easy-to-follow format. Fully editable and compatible with PowerPoint, Keynote, and Google Slides for seamless customization.


5 diapositivas
North America Business Landscape Map Presentation
Explore the business terrain with the "North America Business Landscape Map" template, which delivers a comprehensive visualization of business data across various regions. Designed for strategic presentations, it enables clear communication of market insights and data points, crucial for decision-making. This template is compatible with PowerPoint, Keynote, and Google Slides, enhancing its utility for professionals in diverse fields.


20 diapositivas
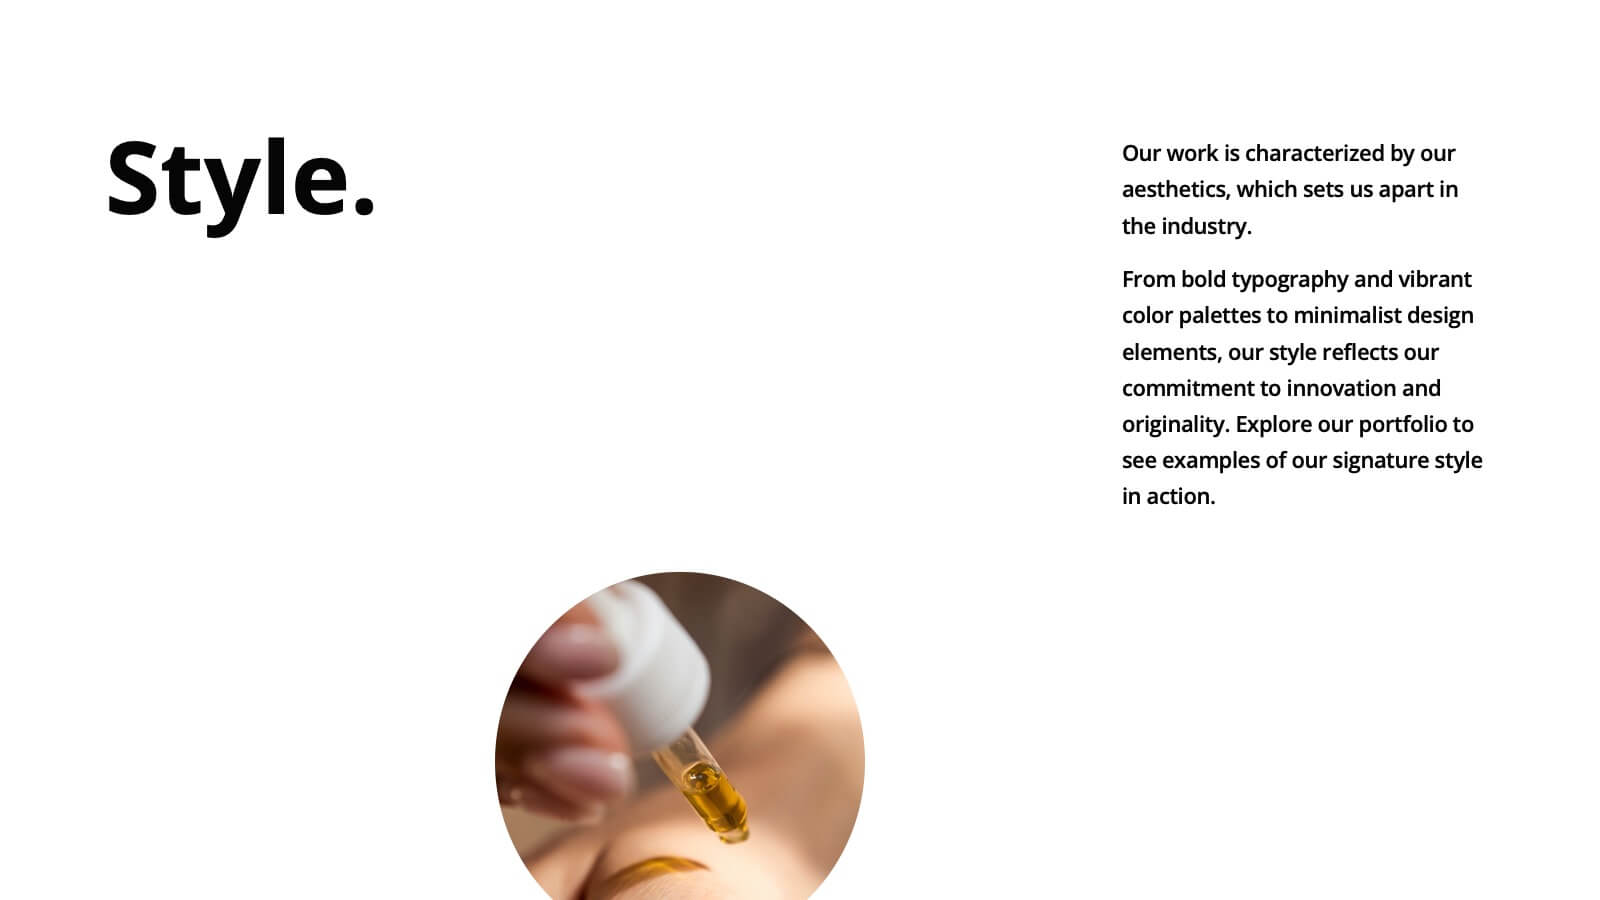
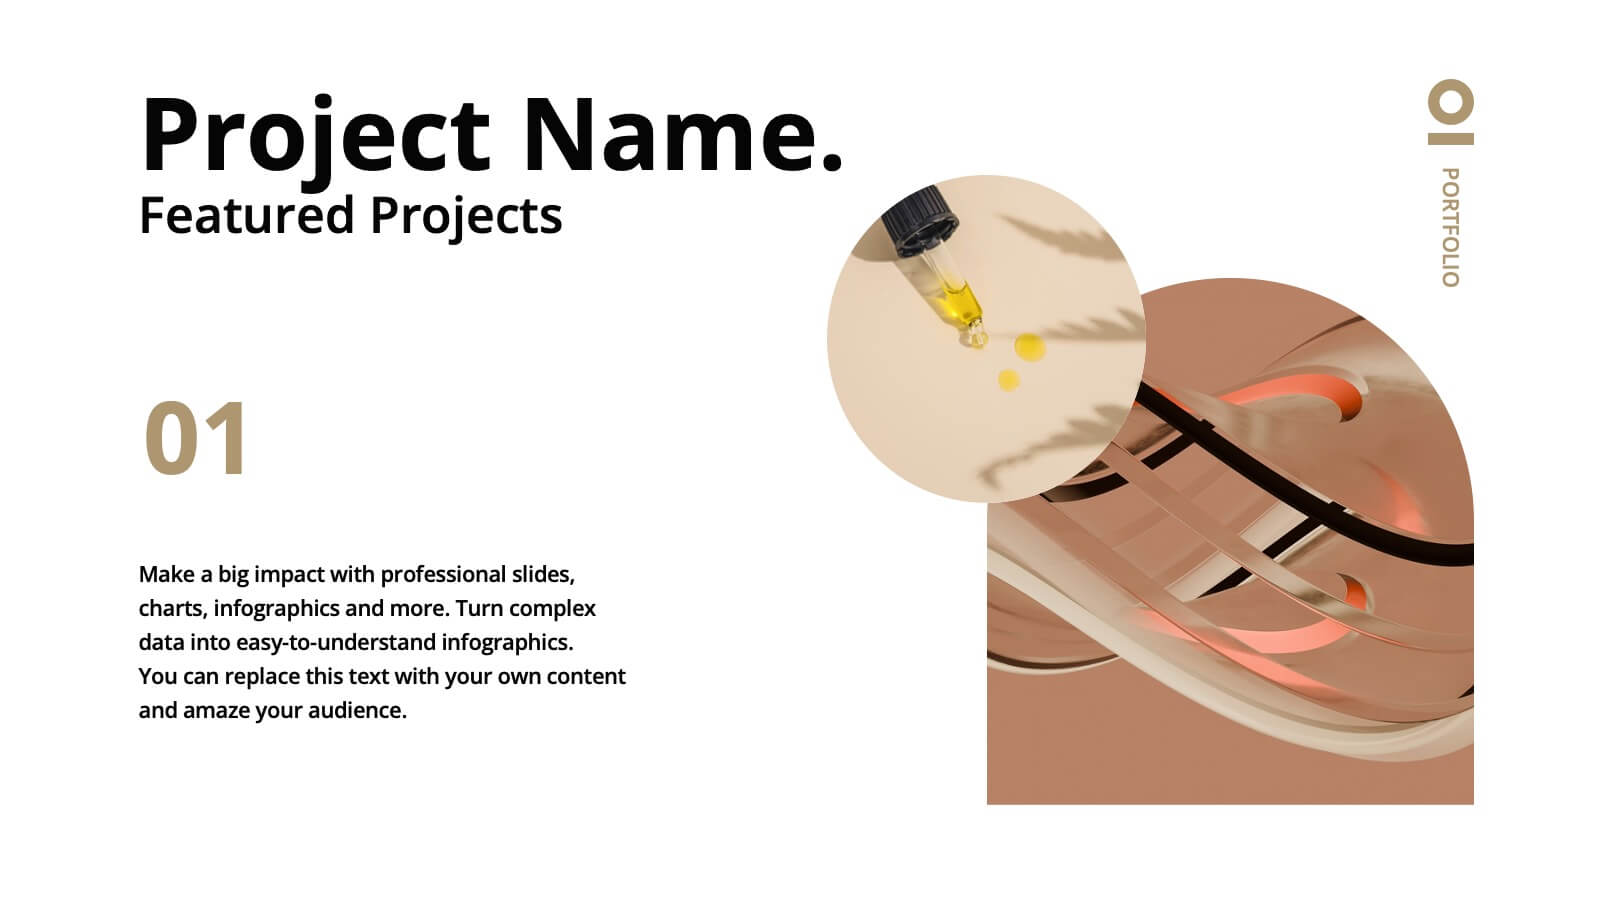
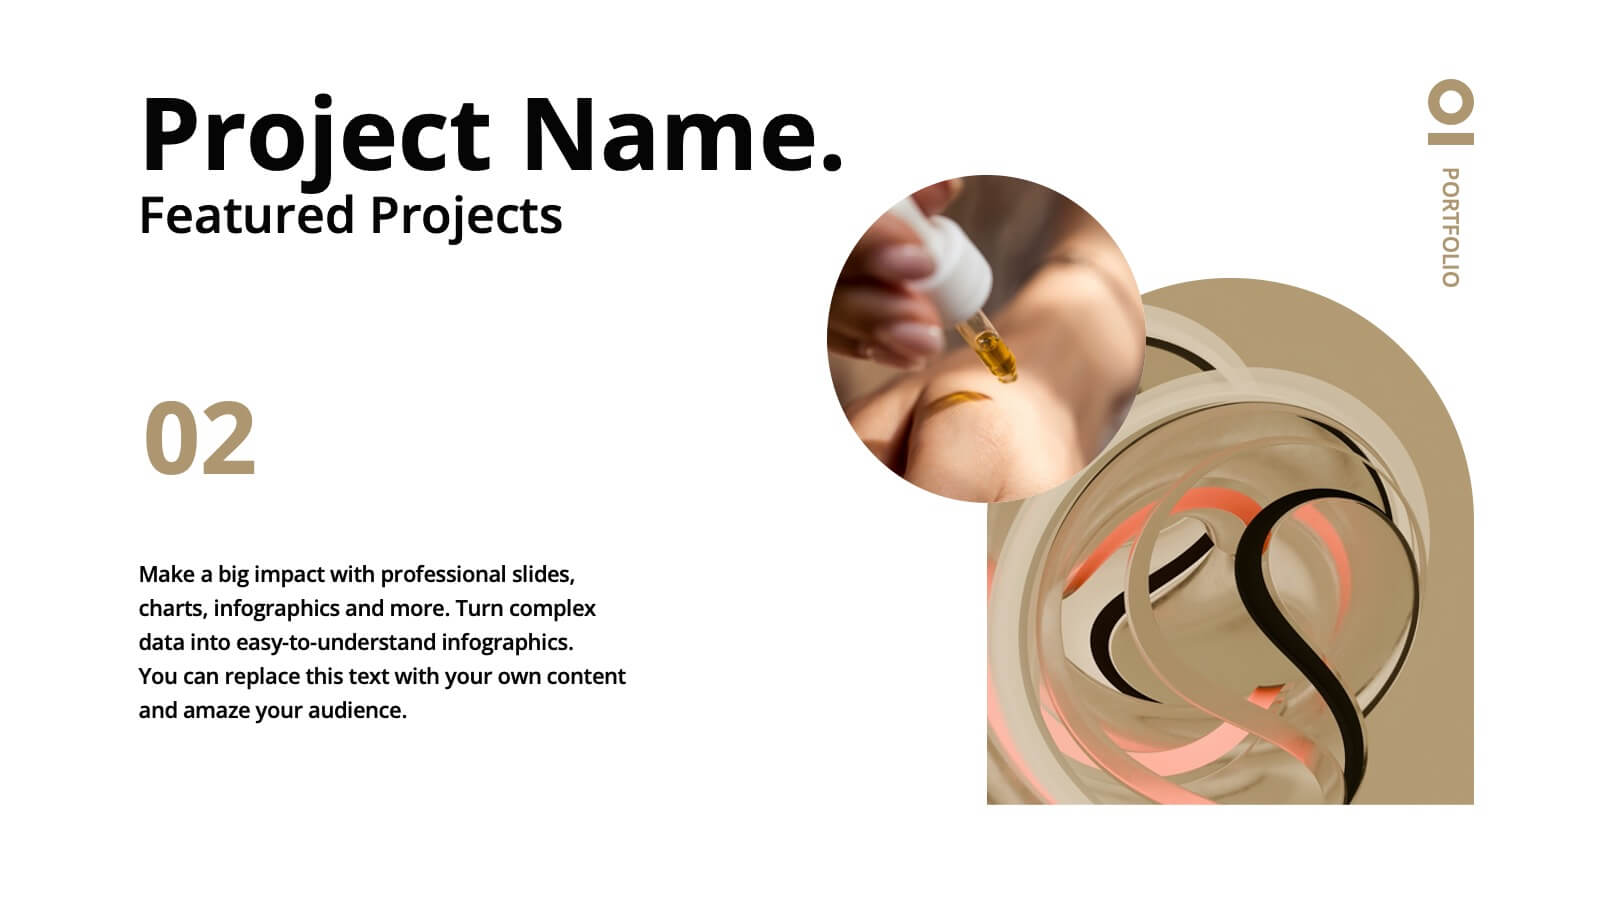
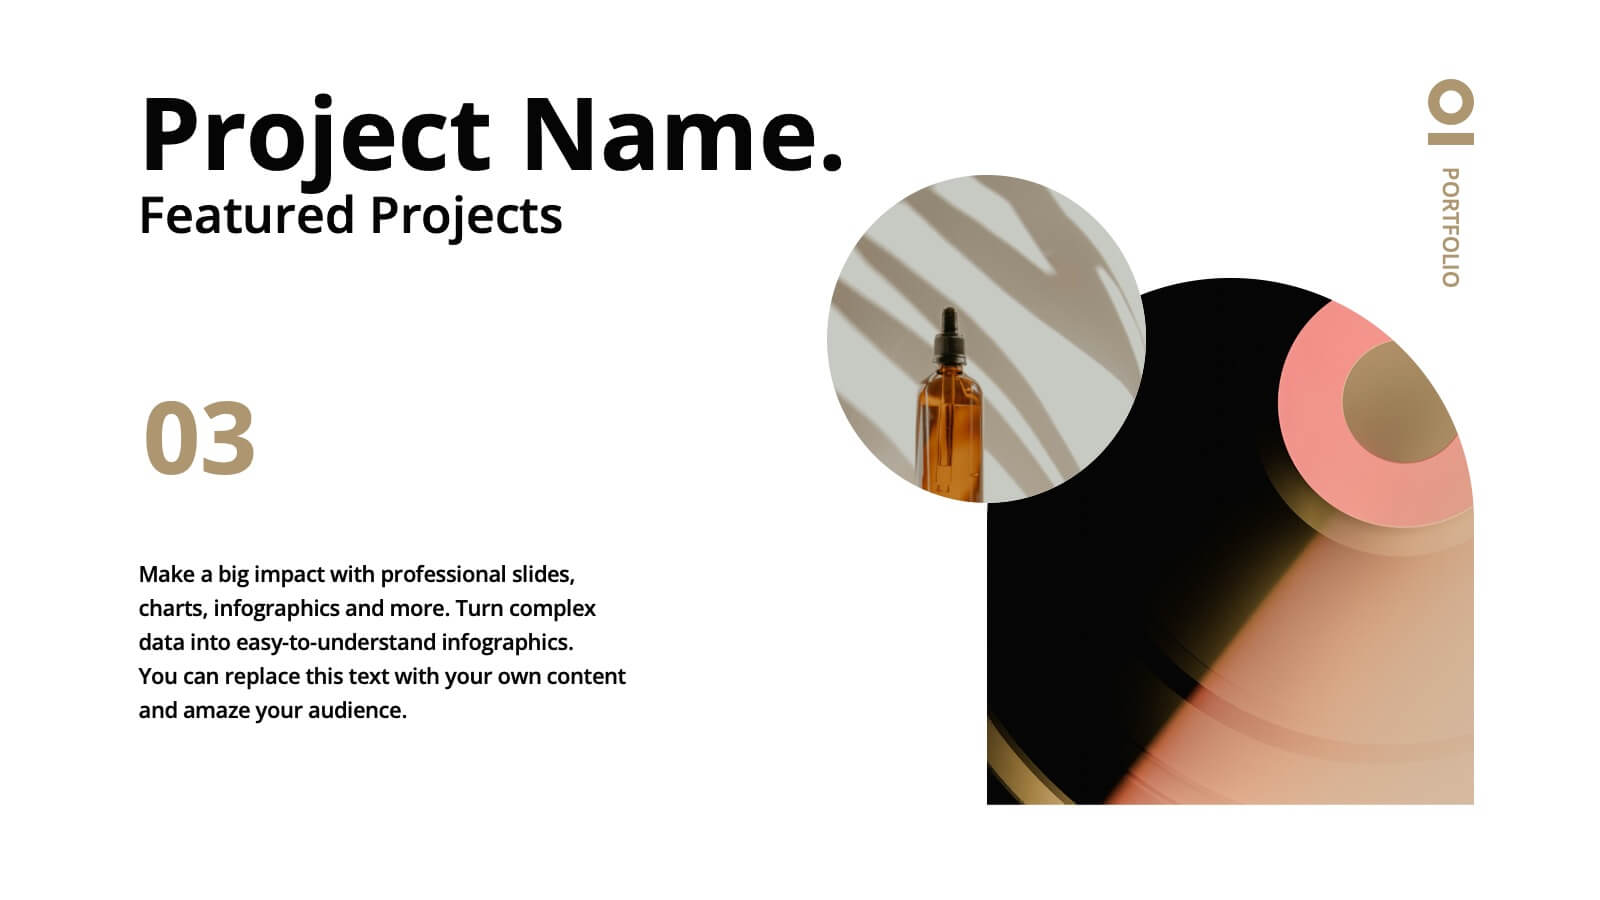
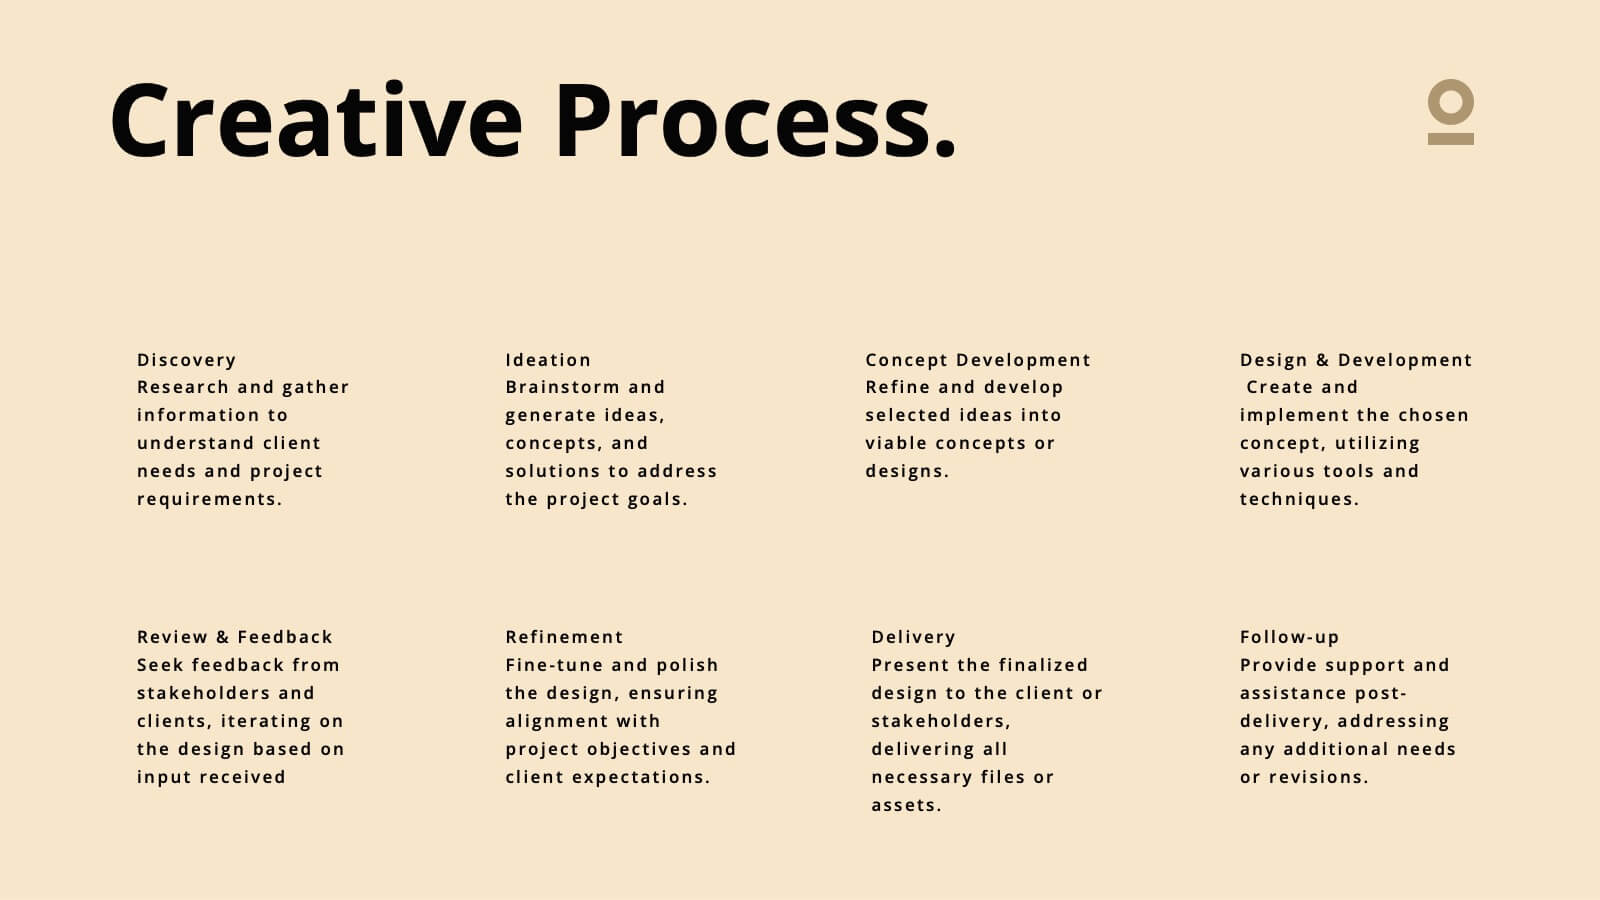
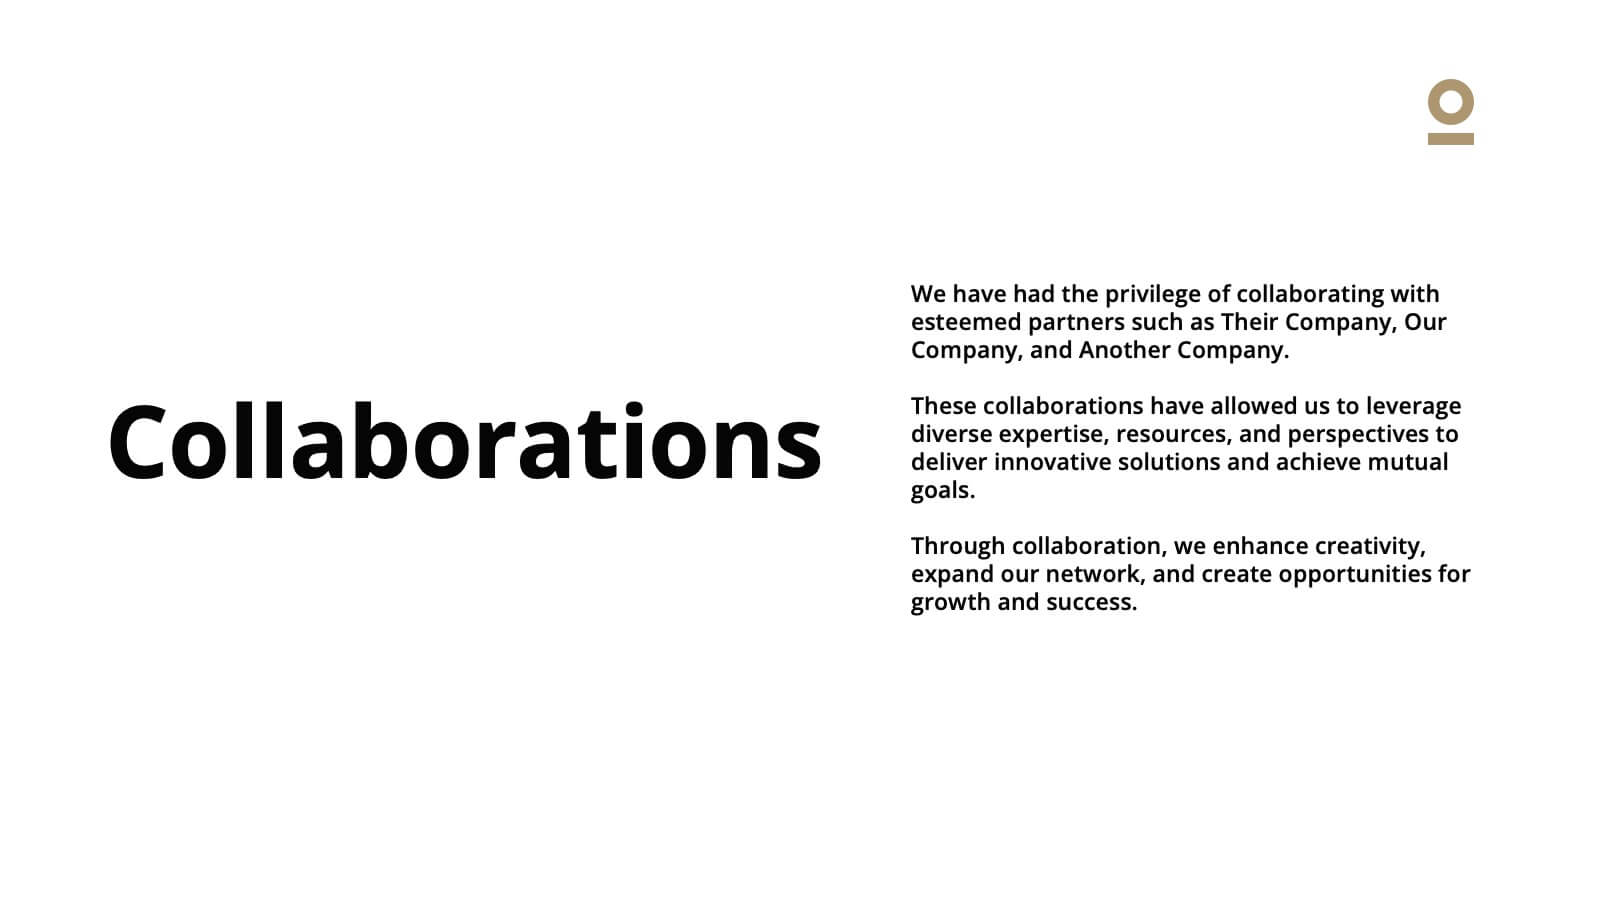
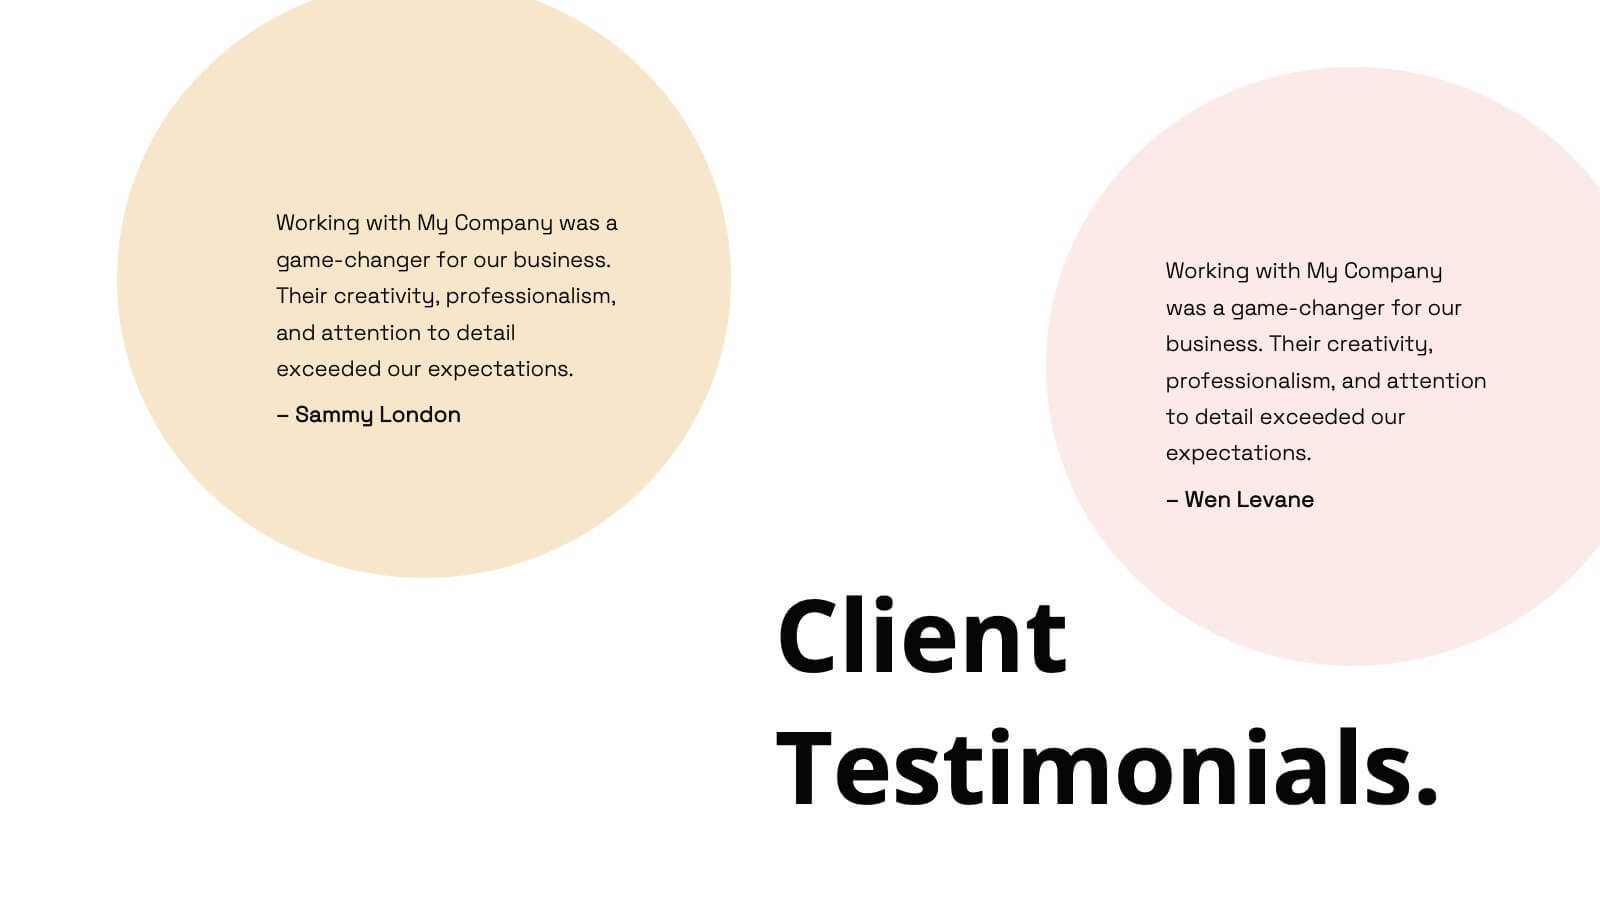
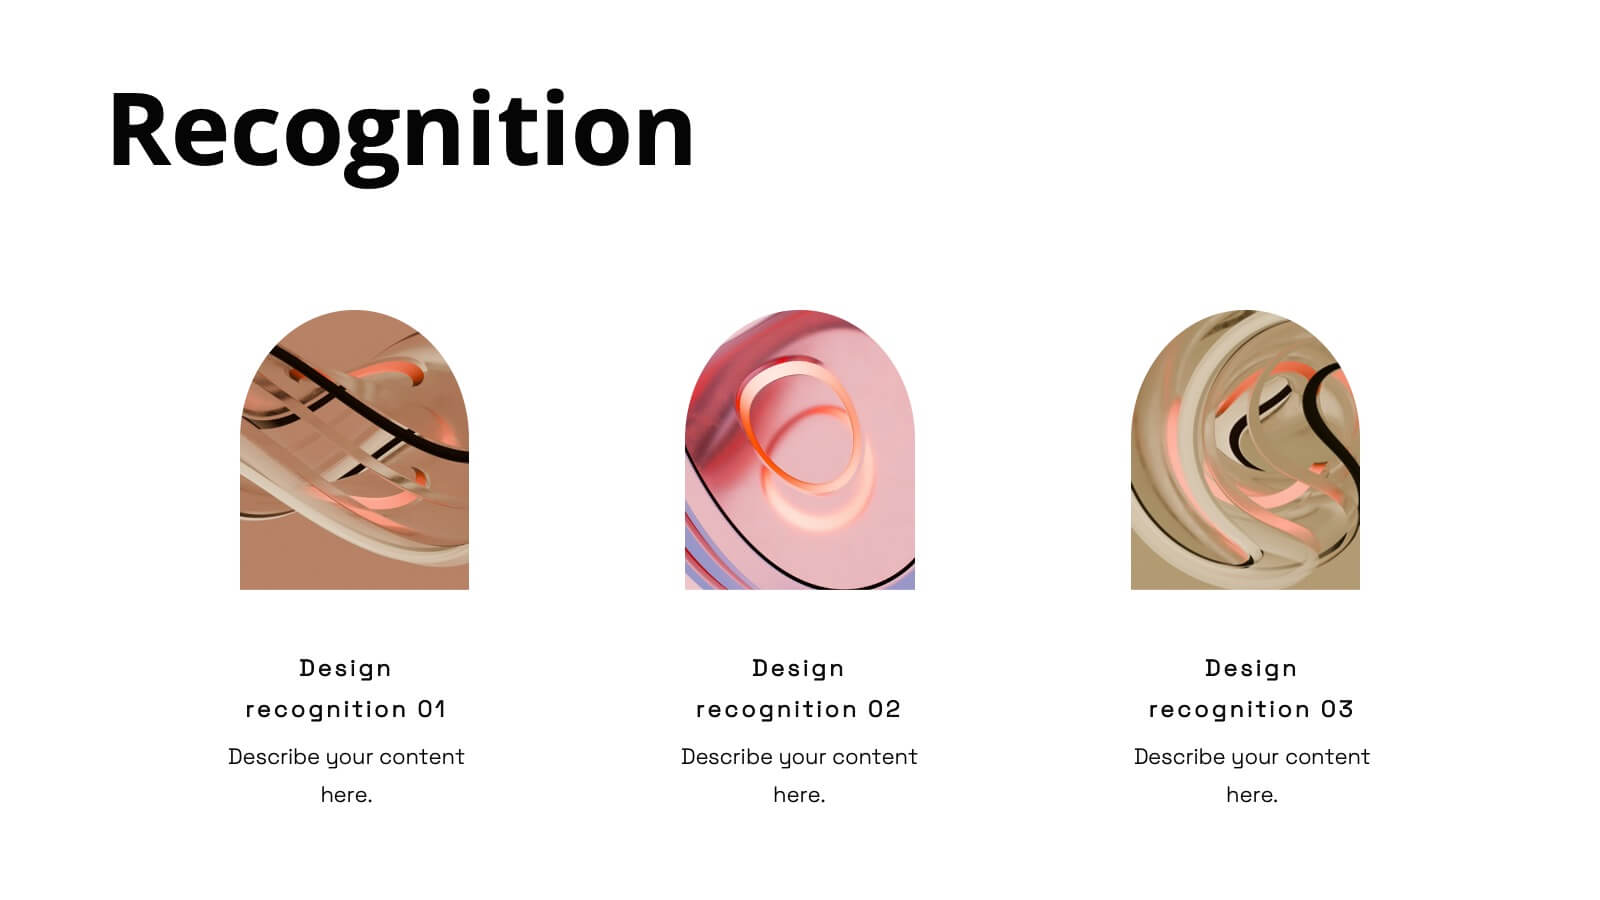
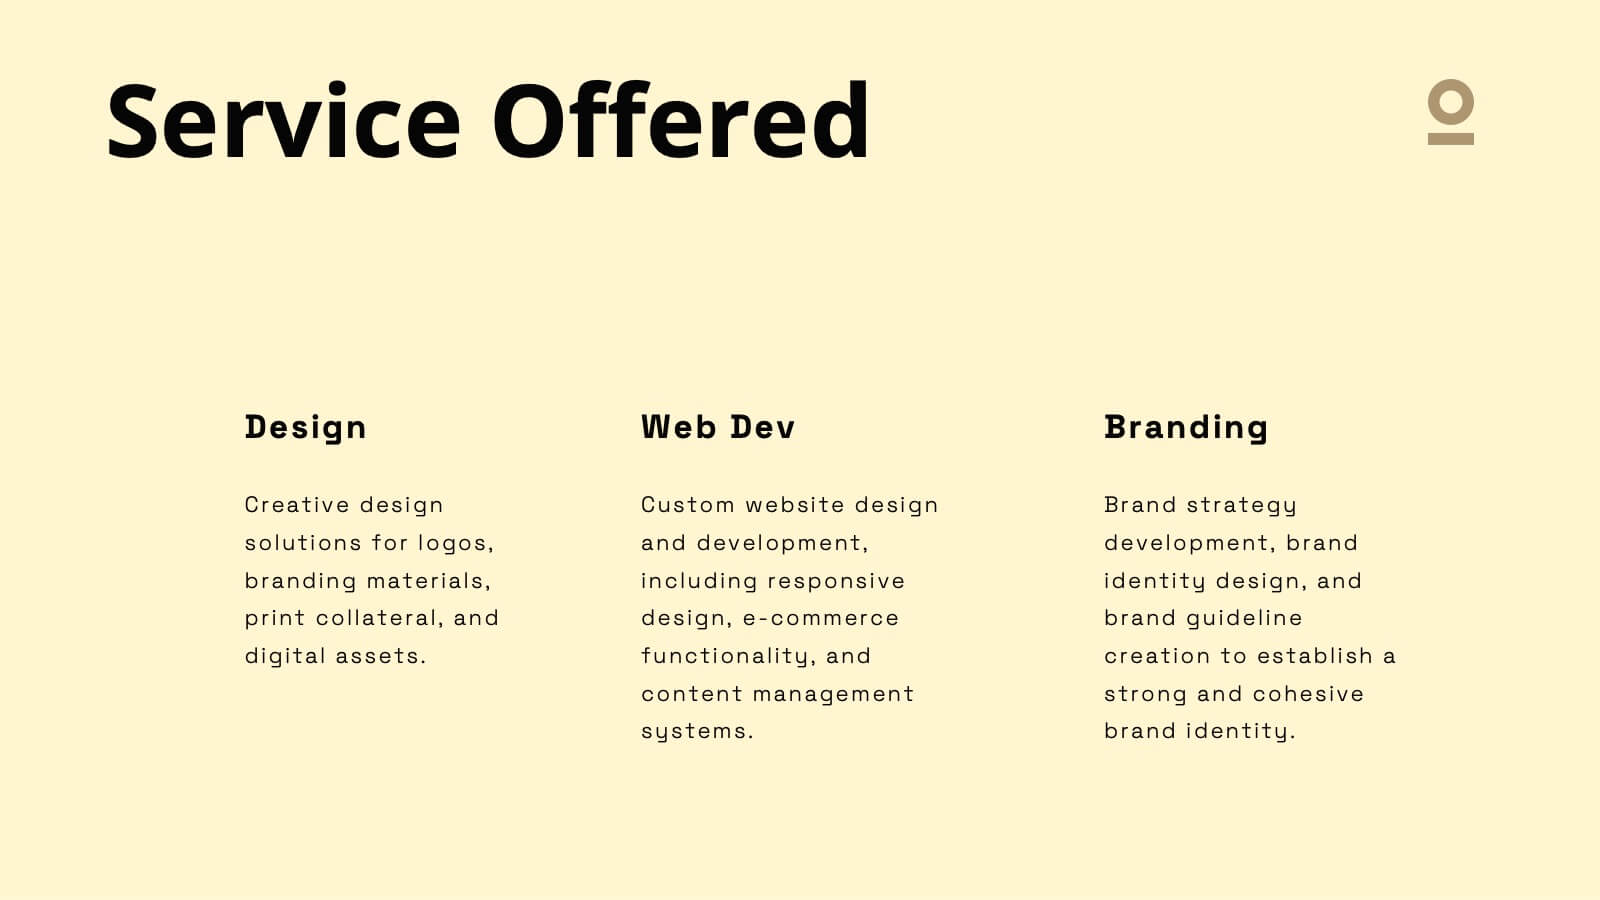
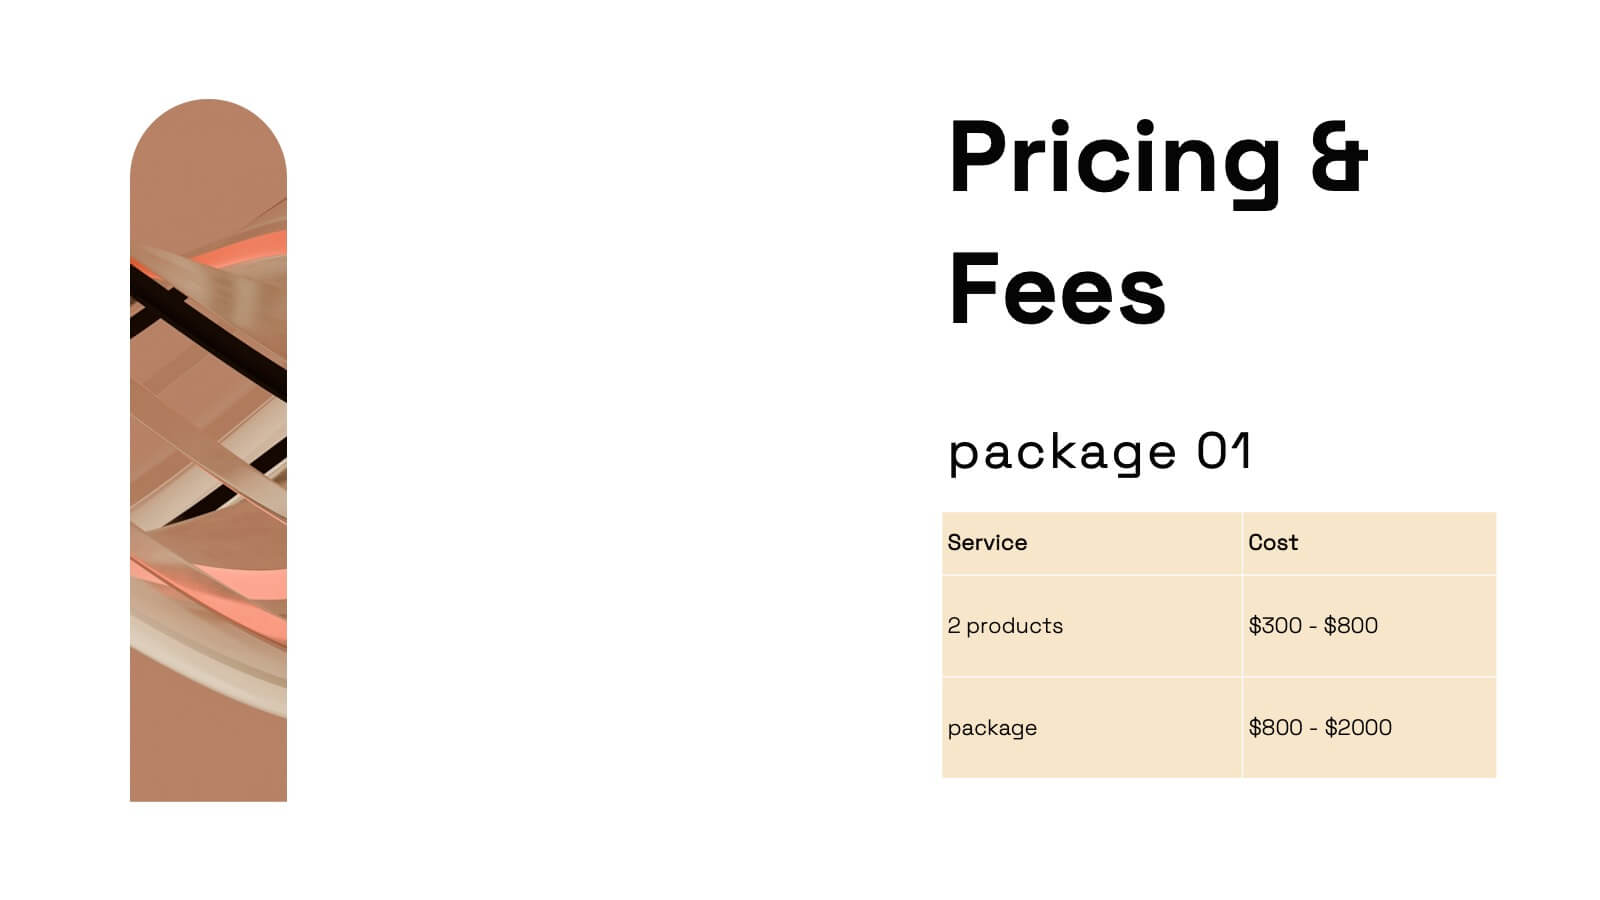
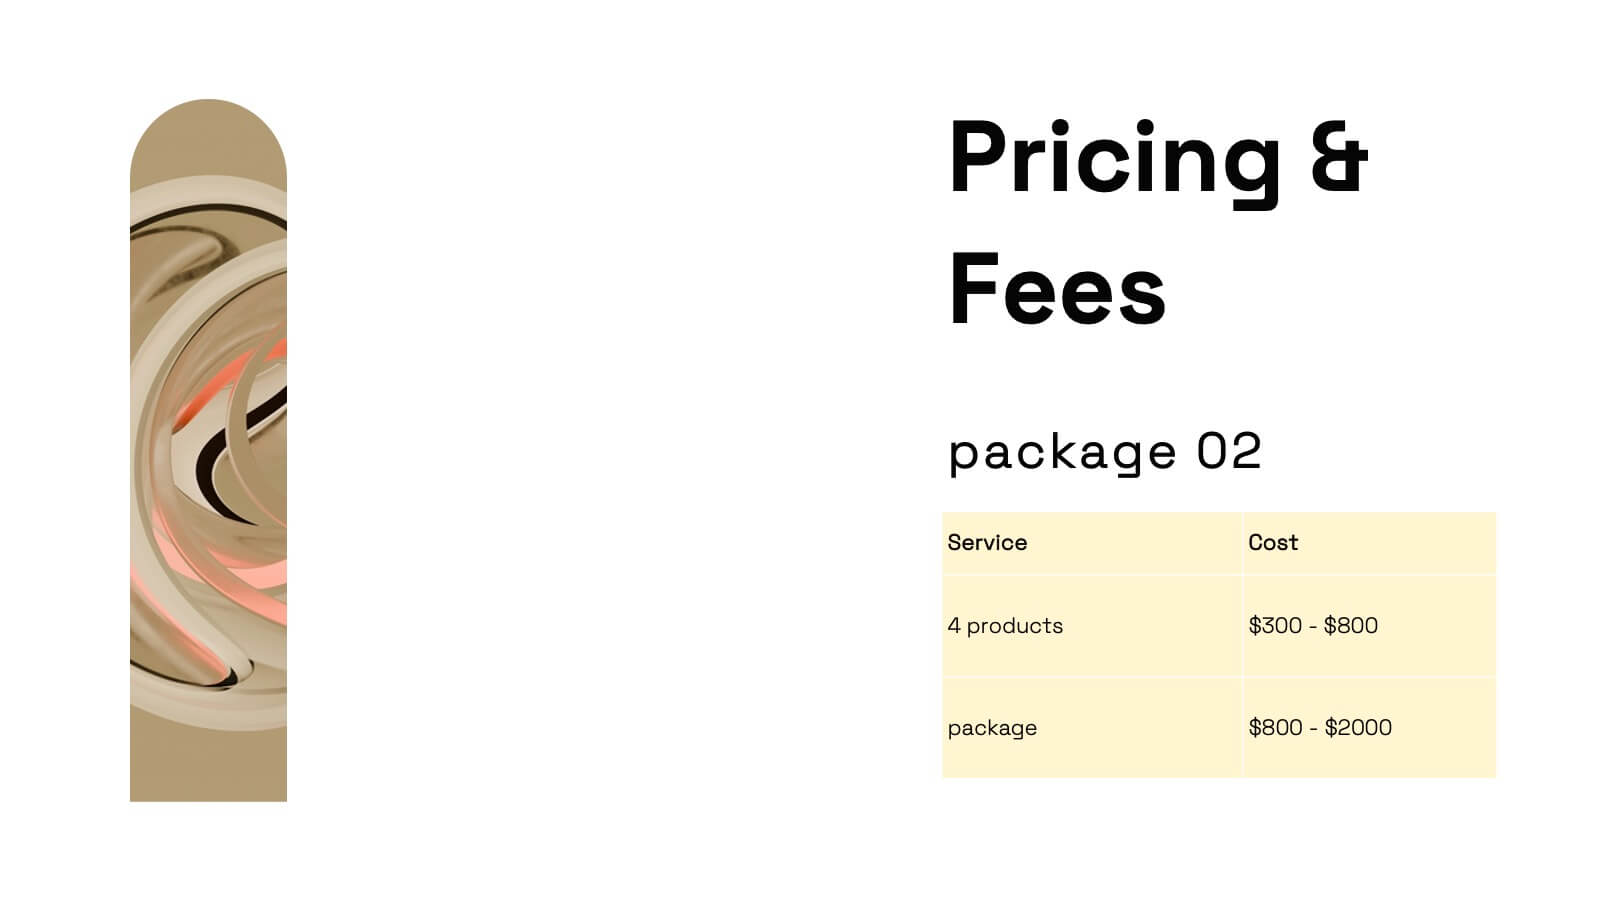
Scriptorium Design Portfolio Presentation
Showcase your creative work with a sophisticated design portfolio presentation template tailored for designers and creators. This template includes clean, minimalist slides to highlight your introduction, portfolio overview, design philosophy, and style. Showcase featured projects with dedicated project highlight slides, complete with client testimonials and awards for added credibility. With sections for your design process, services, pricing, and blog integration, this template provides a professional framework for sharing your creative journey. The editable layout ensures seamless customization to reflect your unique brand, making it suitable for freelancers, agencies, or design teams. Compatible with PowerPoint, Google Slides, and Keynote, this versatile template offers an elegant way to communicate your expertise and leave a lasting impression on clients or stakeholders. Tailor it to your needs and take your portfolio presentations to the next level!


8 diapositivas
Political, Economic, Social Analysis Presentation
Highlight key external influences with the Political, Economic, Social Analysis Presentation. This clean, hexagon-based layout offers a simple yet impactful way to break down PEST factors for strategy planning, market entry, or business reports. Fully editable in PowerPoint, Canva, and Google Slides for fast, polished presentations.


5 diapositivas
Public Health Data Presentation
Bright visuals and clean data blocks make this slide an energizing way to present key insights, instantly pulling viewers into the story behind your metrics. It helps simplify complex information while keeping everything clear, structured, and easy to follow. Fully compatible with PowerPoint, Keynote, and Google Slides.


6 diapositivas
Business Decision Flow Model Presentation
Make smarter choices with this Business Decision Flow Model presentation. Clearly map out key decisions, steps, and potential outcomes using a structured, color-coded flow. Perfect for strategy reviews, team meetings, and executive briefings. Fully editable in Canva, PowerPoint, and Google Slides for seamless customization.


4 diapositivas
Client Proposal Overview Presentation
Present your ideas with confidence using a sleek and structured layout that turns client insights into a compelling story. Ideal for outlining project goals, value propositions, or proposal summaries, this template keeps every detail polished and professional. Fully compatible with PowerPoint, Keynote, and Google Slides for effortless customization.


6 diapositivas
Budget Allocation Strategy Presentation
Break down your budget plan with this clear and modern 6-point layout. Featuring a central money bag icon and segmented categories, this slide is perfect for financial strategy, departmental budgeting, or resource distribution. Fully editable in Canva, PowerPoint, or Google Slides for easy customization to match your brand.


26 diapositivas
Remote Works Strategie Presentation
This presentation template is designed for businesses focused on remote work strategies. It features a variety of slide types, including team introductions, Gantt charts, comparison slides, and infographics. The design is clean and modern, with a mix of text, images, and icons to help communicate your message effectively. Key slides include options for showcasing your team, outlining different strategies, and presenting data visually through charts and maps. The template also includes device mockups for mobile and laptop views, making it versatile for different presentation needs. Each slide is customizable to fit your brand's colors and content.


4 diapositivas
Top Priorities and Checklist Format Presentation
Stay focused and aligned with the Top Priorities and Checklist Format Presentation. This clear, checklist-based design is ideal for highlighting action items, goals, or key project deliverables. Visually guide your team with structured sections and a checklist illustration that reinforces accountability. Fully editable in PowerPoint, Keynote, and Google Slides.


26 diapositivas
Fashion Brand Shop Aesthetic Presentation
A fashion brand shop is a retail store that exclusively sells products from a particular fashion brand. This presentation template has a stylish design that perfectly reflects the essence of a high-end fashion brand. Whether you're launching a new collection, presenting your brand's story, or showcasing your latest fashion products, this template will captivate your audience. The presentation boasts sleek and elegant slides, featuring a blend of colors and images that will resonate with your brand's aesthetic. With its customizable elements, you can easily tailor the presentation to align with your brand's unique identity and aesthetics.