


Características


¿Tienes alguna pregunta?
Recomendar


5 diapositivas
5G Technology Utilities Infographics
5G is the fifth generation of wireless technology that provides faster internet speeds, lower latency, and more reliable connectivity for connected devices. These Infographics are visual representation of the benefits and uses of 5G technology. They can be used to provide detailed explanations and highlight the benefits of 5G technology, such as faster speeds and lower latency. You can also use this template to explain how 5G technology works, including the use of small cells and beamforming. These are designed using modern and visually appealing graphics, icons, and colors to make the information easy to understand.


10 diapositivas
Environmental Sustainability Strategy
Bring your green initiatives to life with this vibrant, four-step sustainability roadmap. Ideal for visualizing eco-friendly practices, CSR programs, or environmental policy rollouts. The organic flow, icons, and plant-themed accents enhance clarity and engagement. Fully customizable in PowerPoint, Keynote, and Google Slides.


7 diapositivas
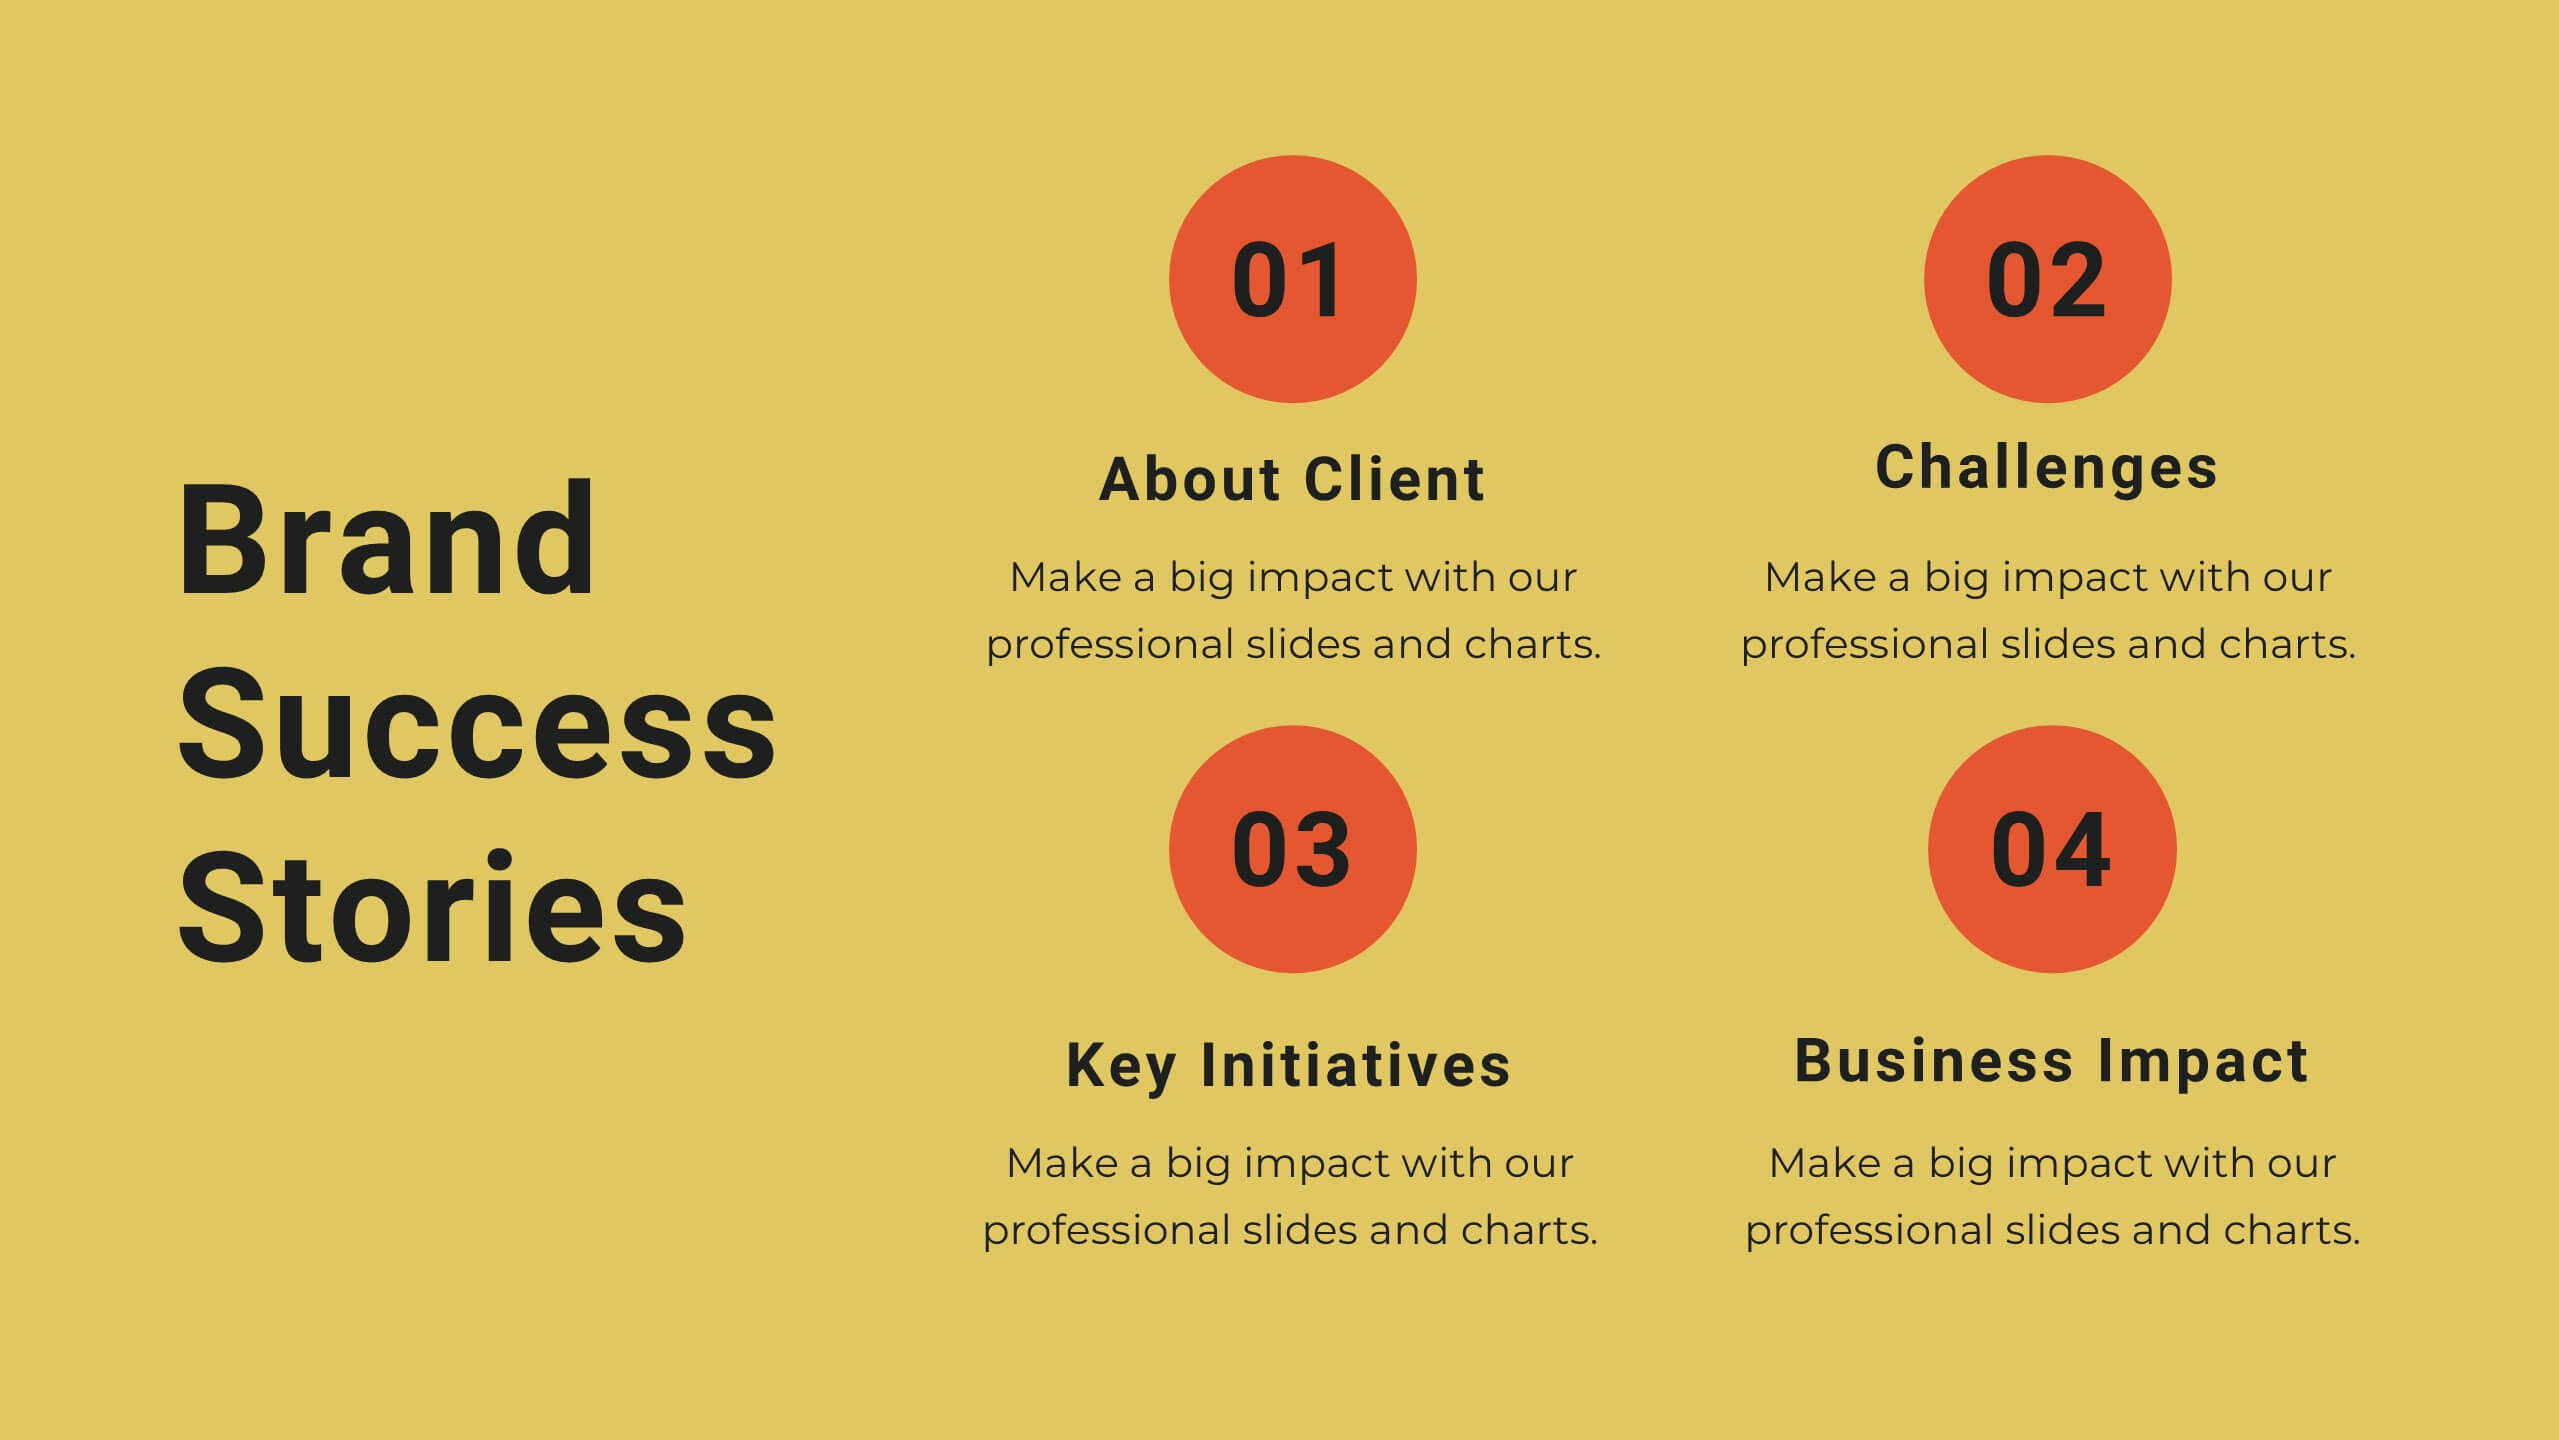
Numbers Infographic Presentation Template
This Numbers Infographic Presentation is a great resource for business and education. Designed to give you a quick and easy way to educate in an infographic presentation to use as an overview, or specific product description of what you are selling. This template features a smart object to insert text, images and logos which allow for easy customization. Each design is specially made and crafted in the highest quality possible to help bring your message to life in an exciting new way. This template is ideal for conveying statistical information in a visually stunning and engaging way.


20 diapositivas
Aether Marketing Research Report Presentation
The Marketing Research Report Presentation Template offers a sleek design with 20 fully customizable slides, ideal for presenting in-depth marketing insights. This template features sections for industry analysis, consumer behavior, emerging technologies, and marketing trends like SEO, social media, and influencer strategies. It also highlights e-commerce trends, personalization, sustainability, and storytelling techniques. The modern black-and-gold gradient aesthetic adds sophistication, making it perfect for professional reports. Compatible with PowerPoint, Keynote, and Google Slides, this template ensures a polished and engaging presentation experience.


26 diapositivas
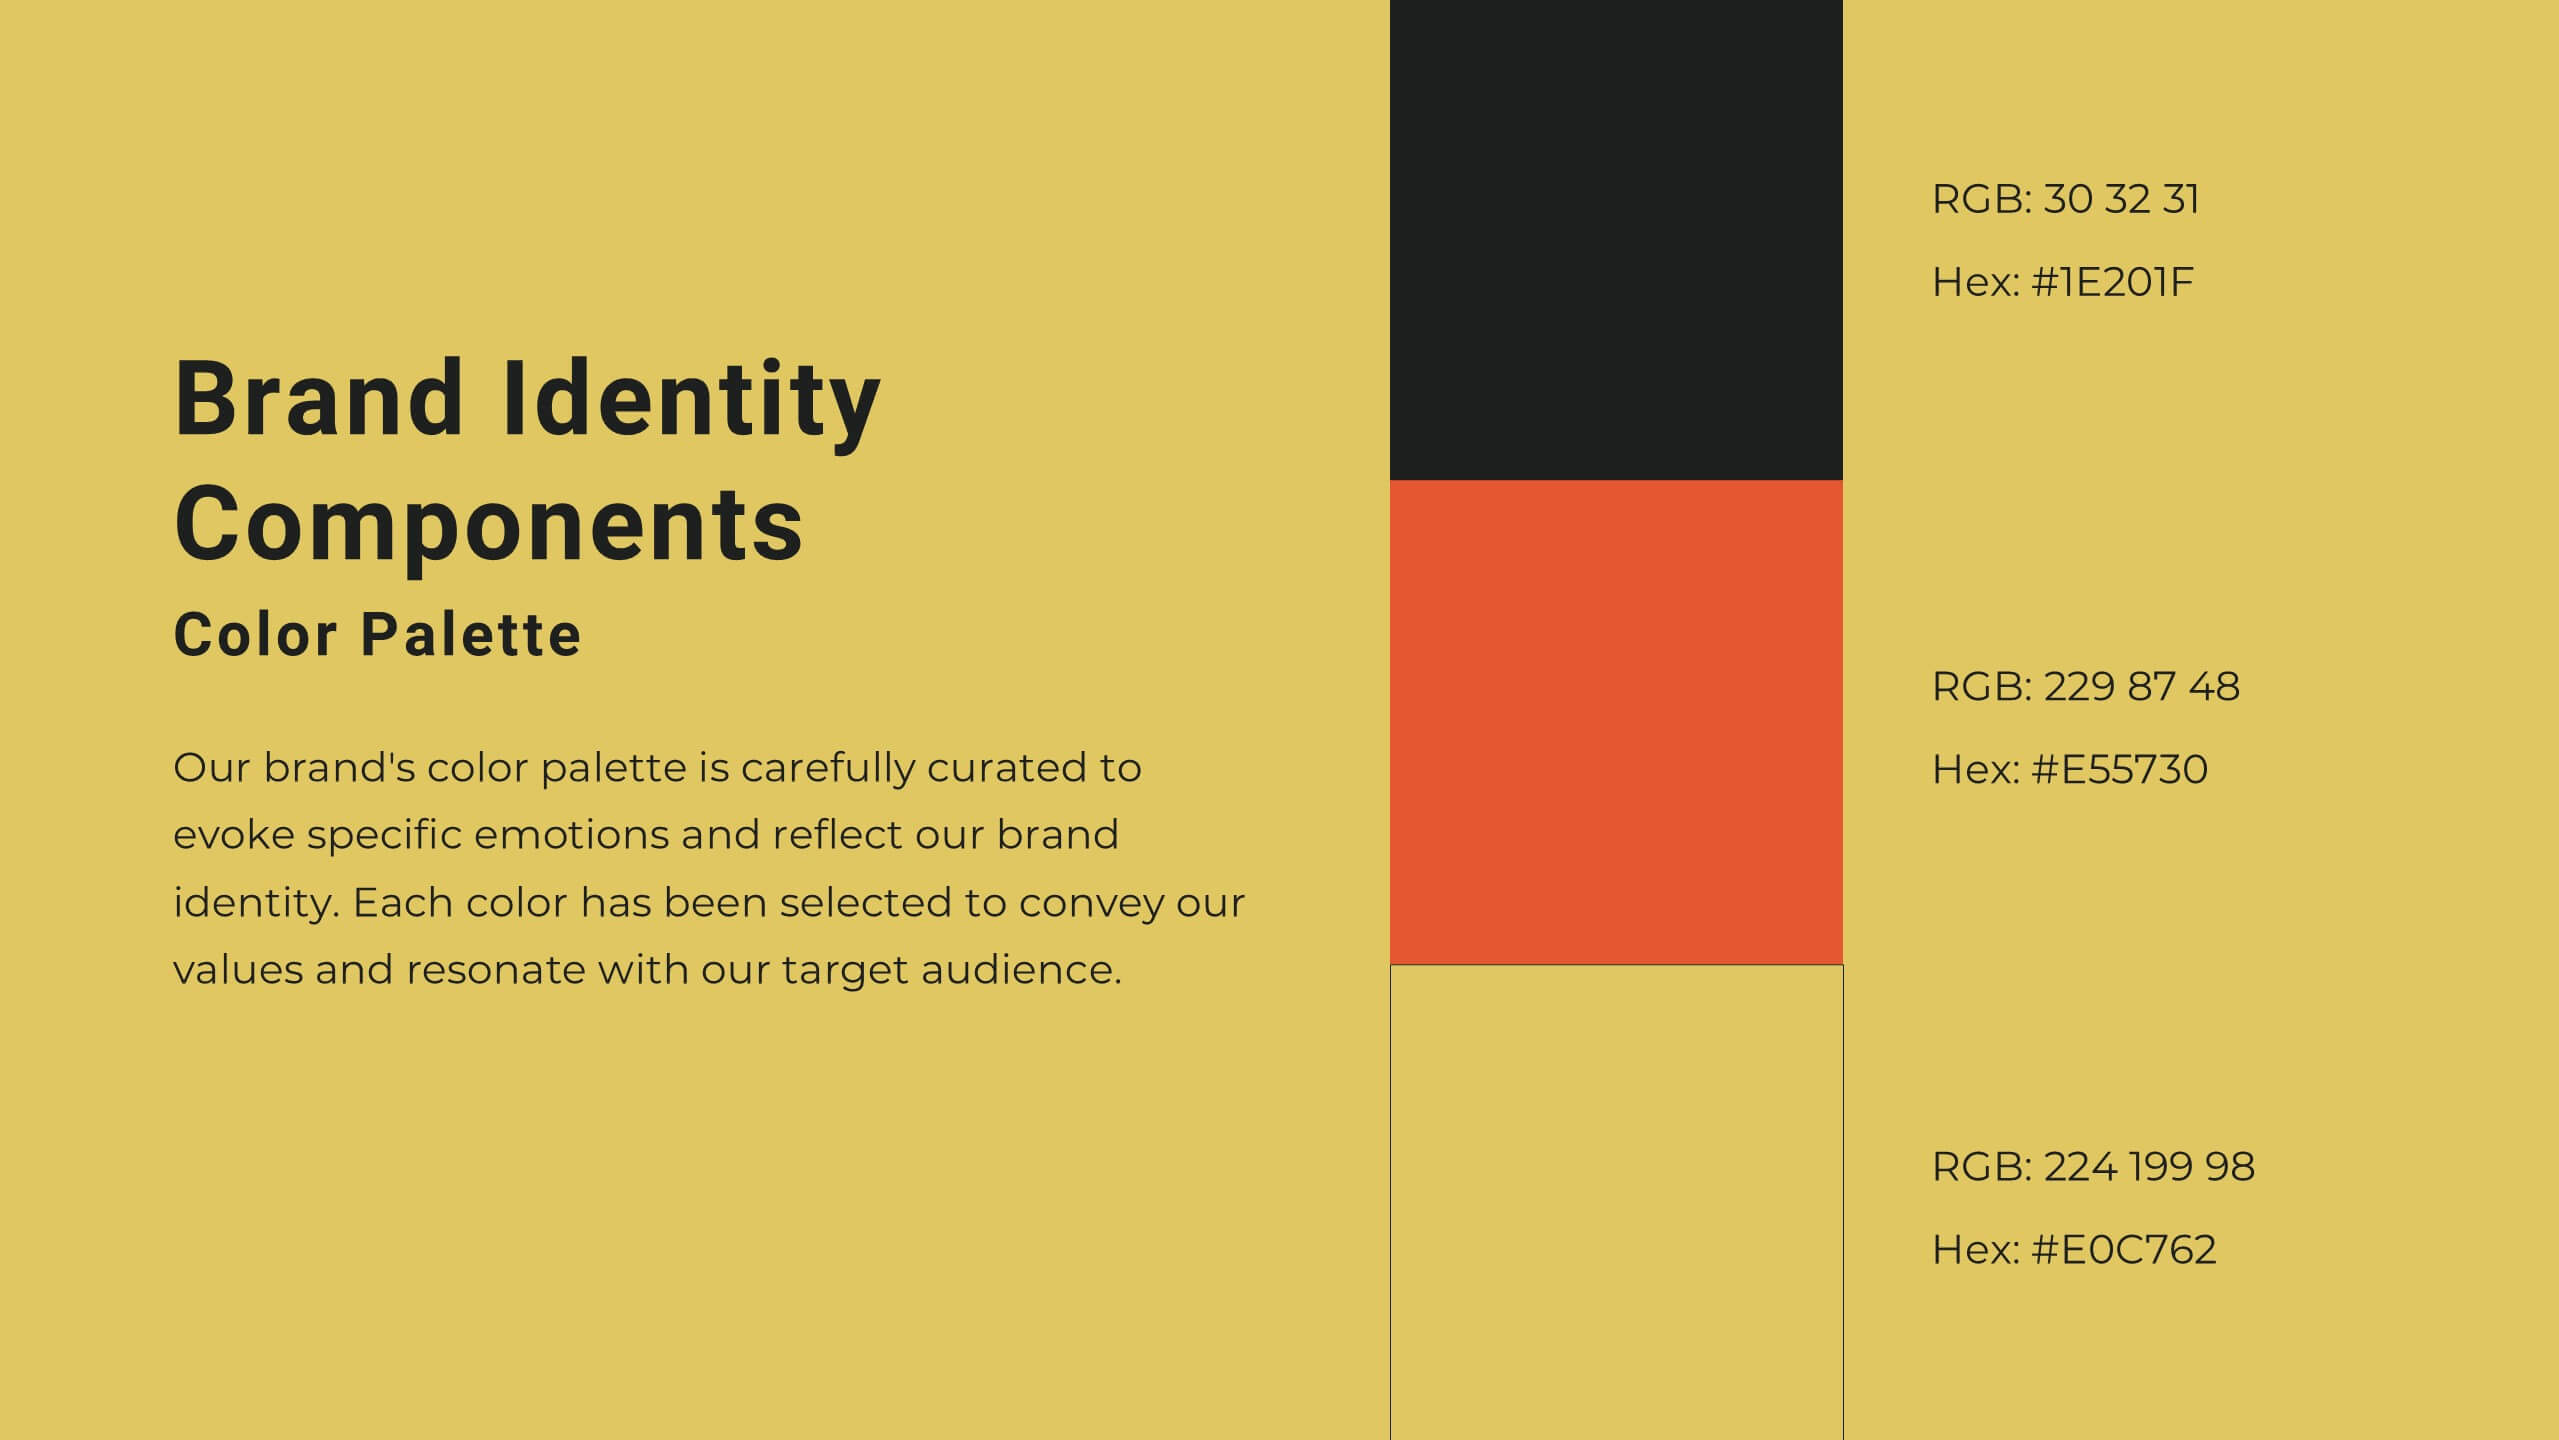
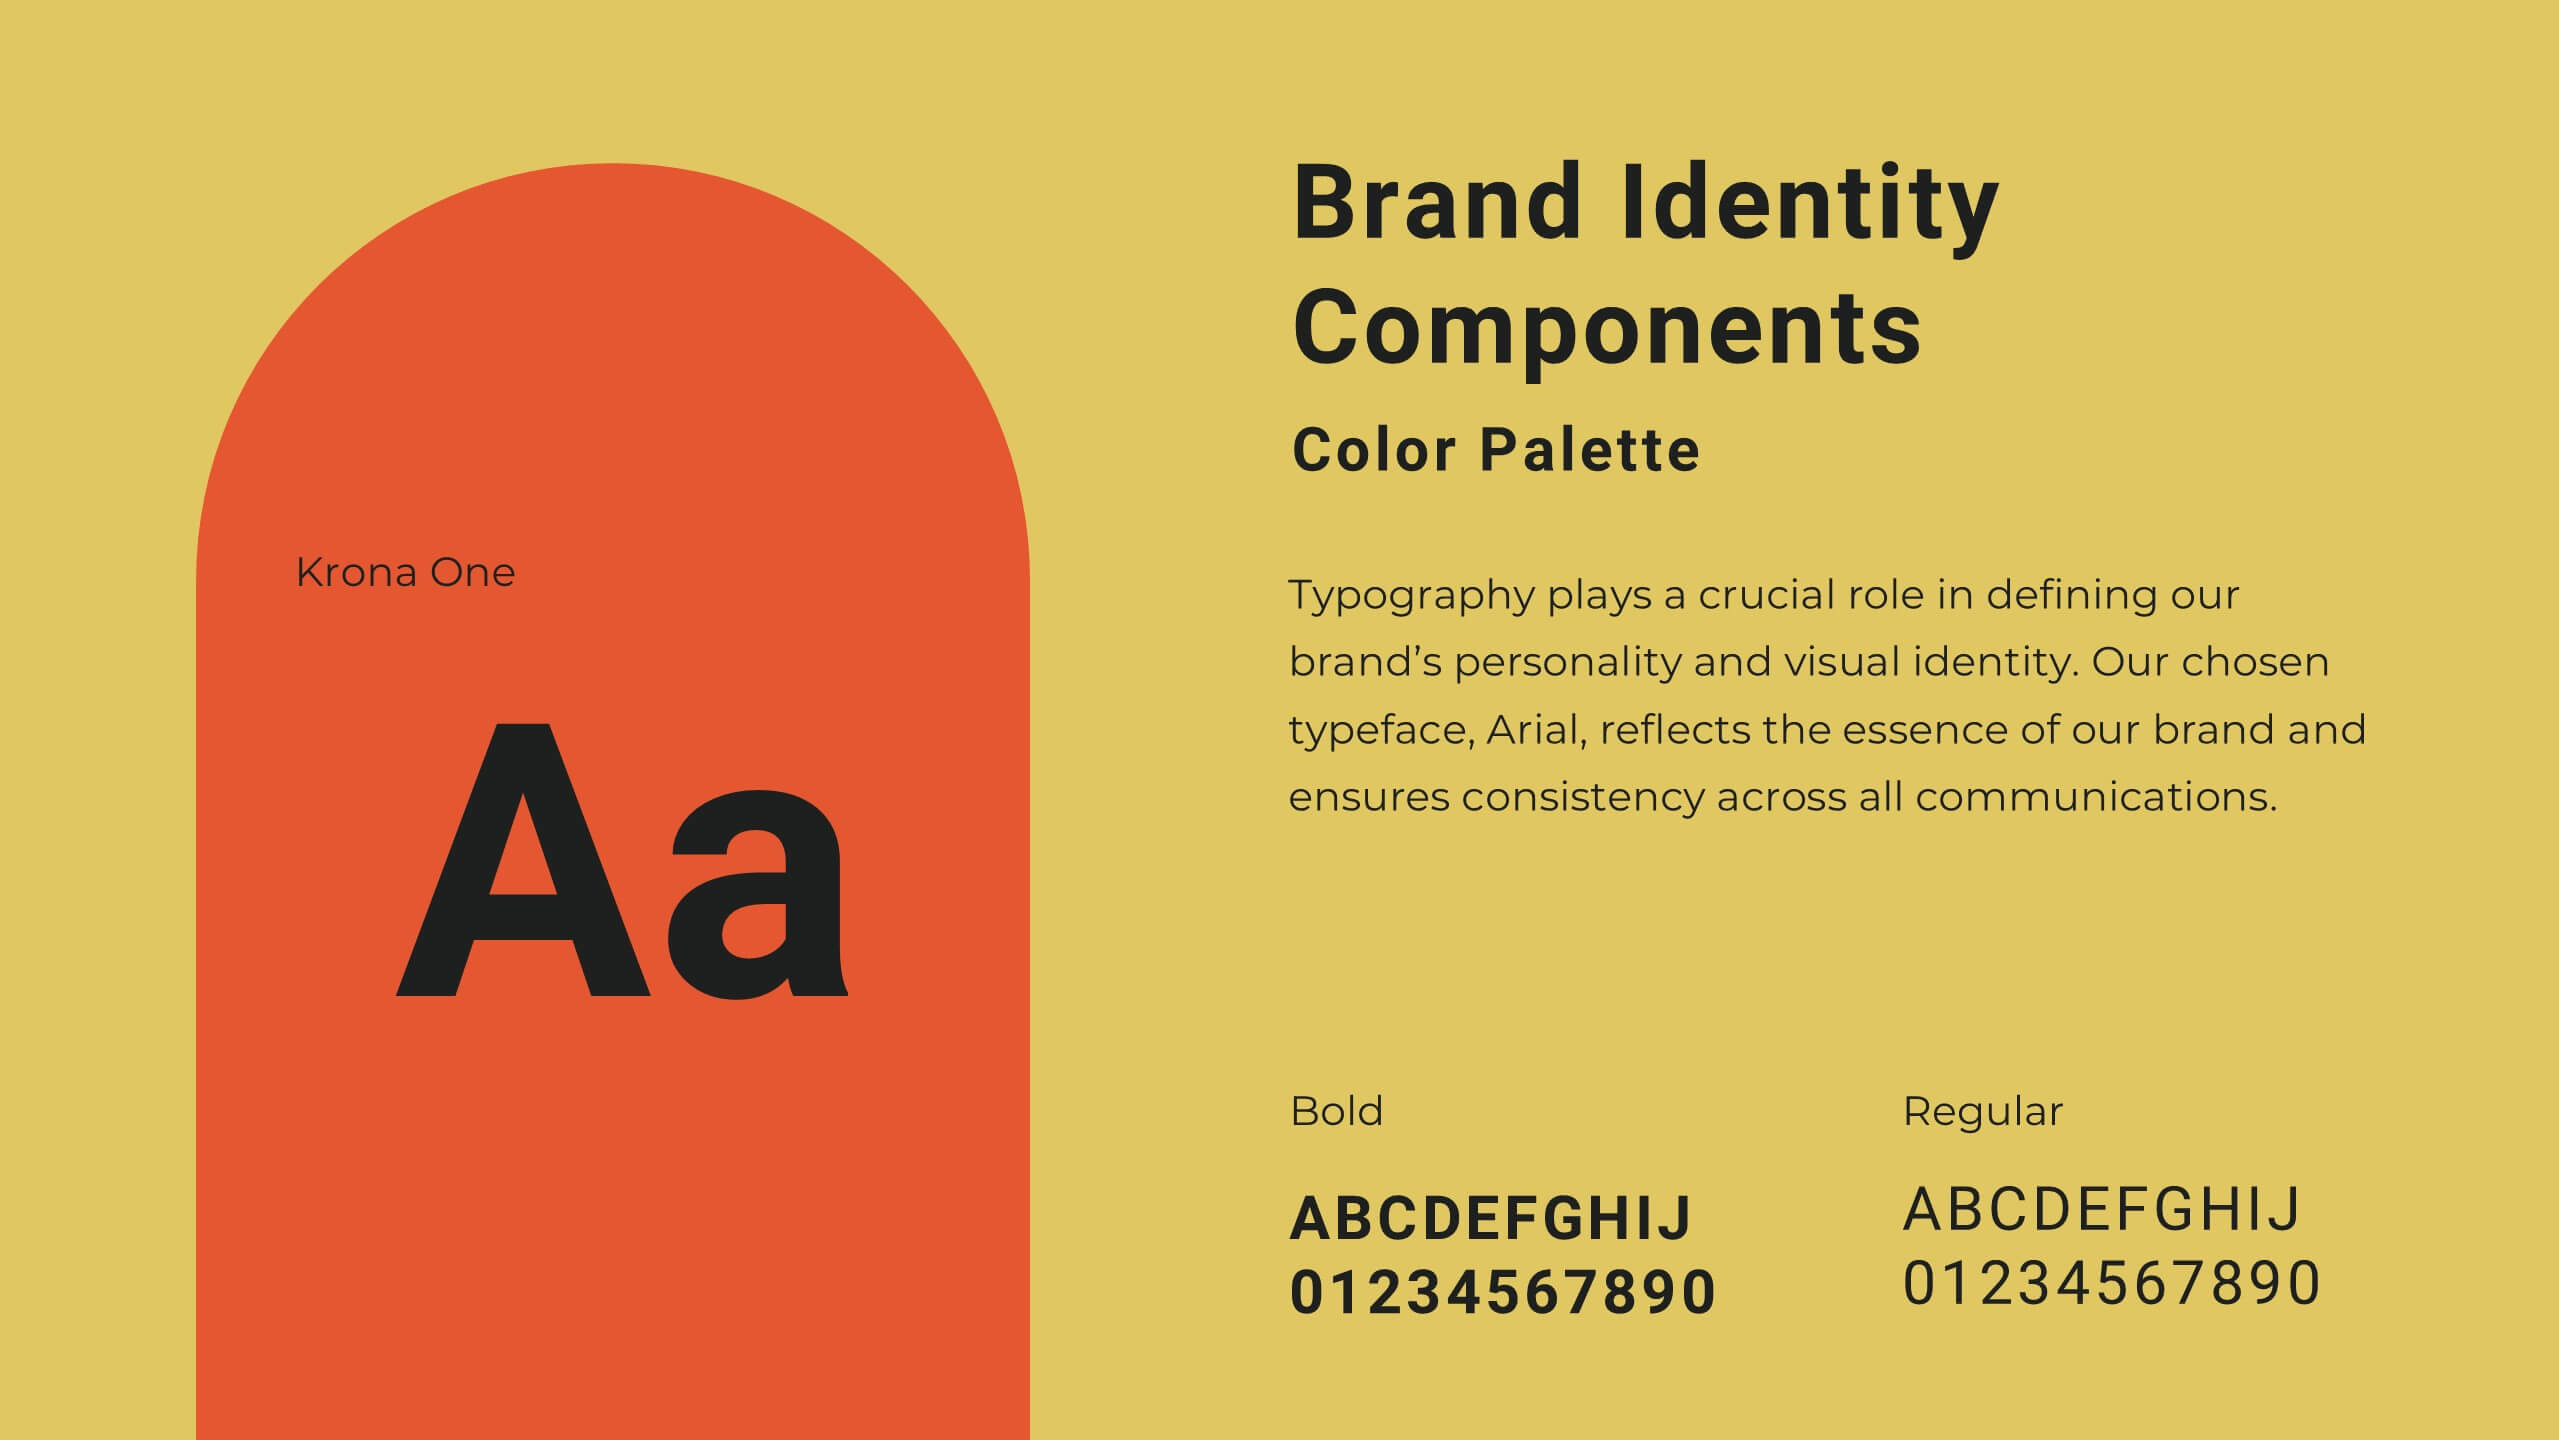
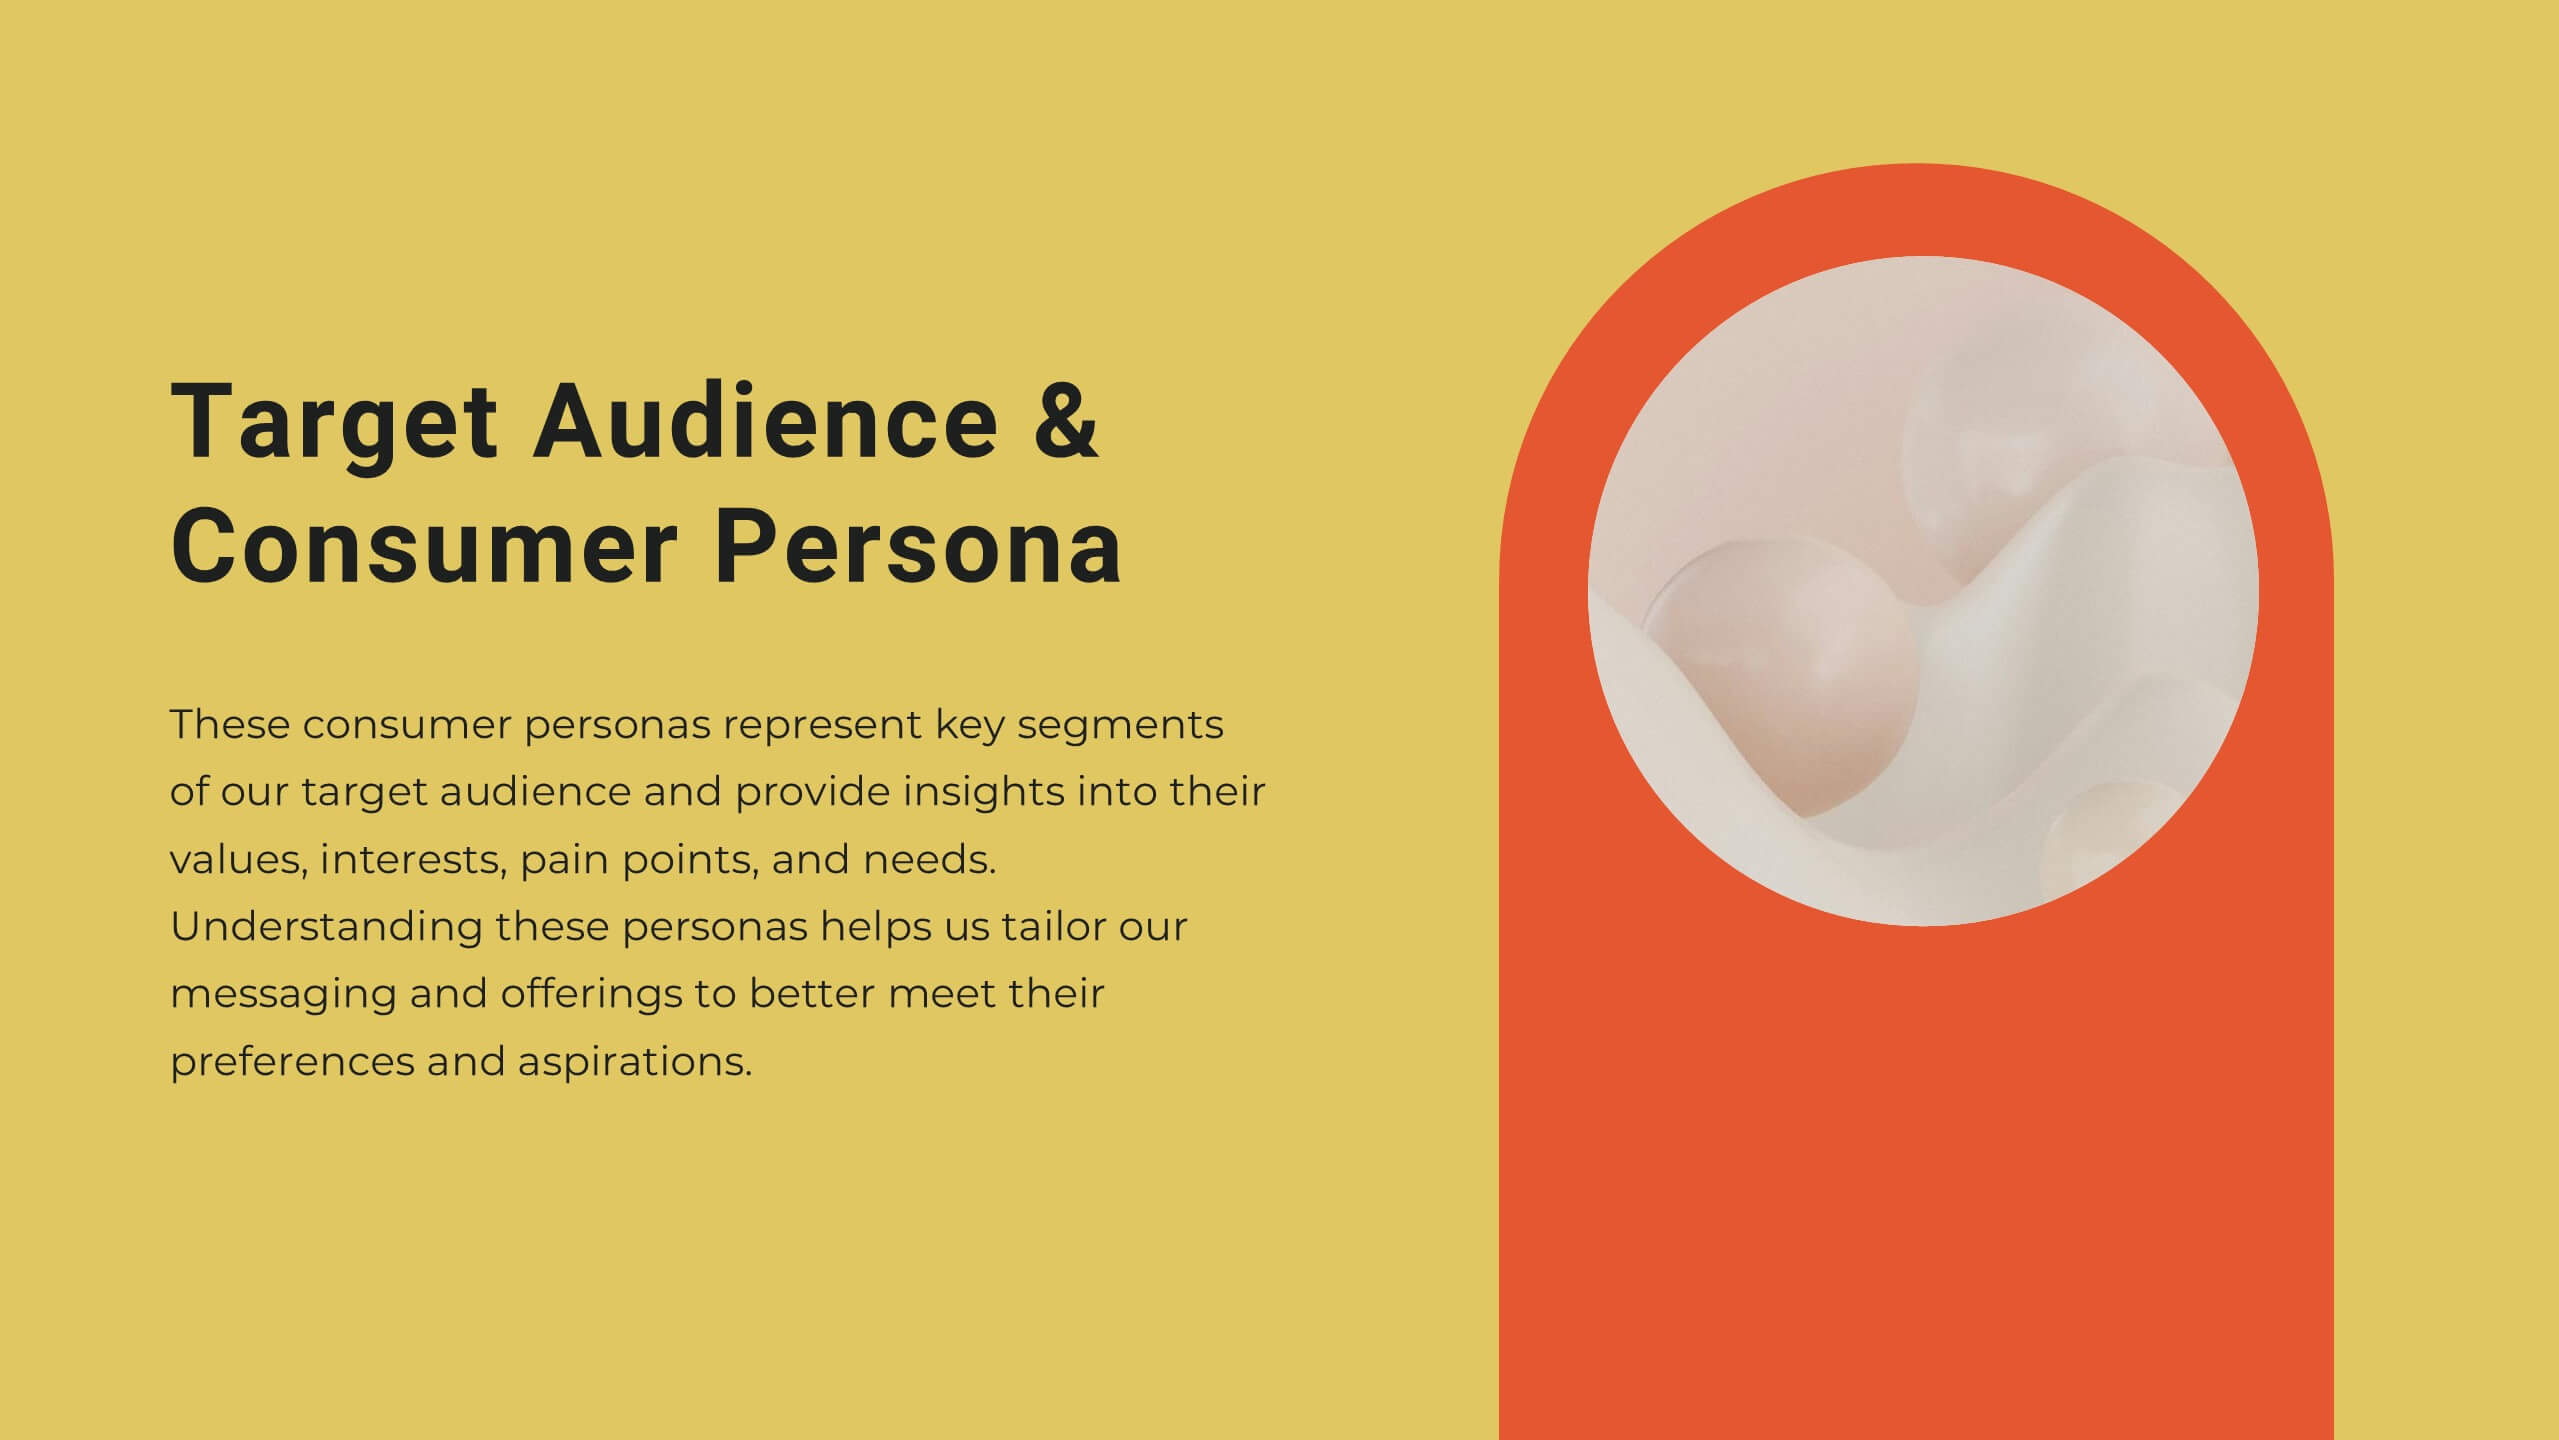
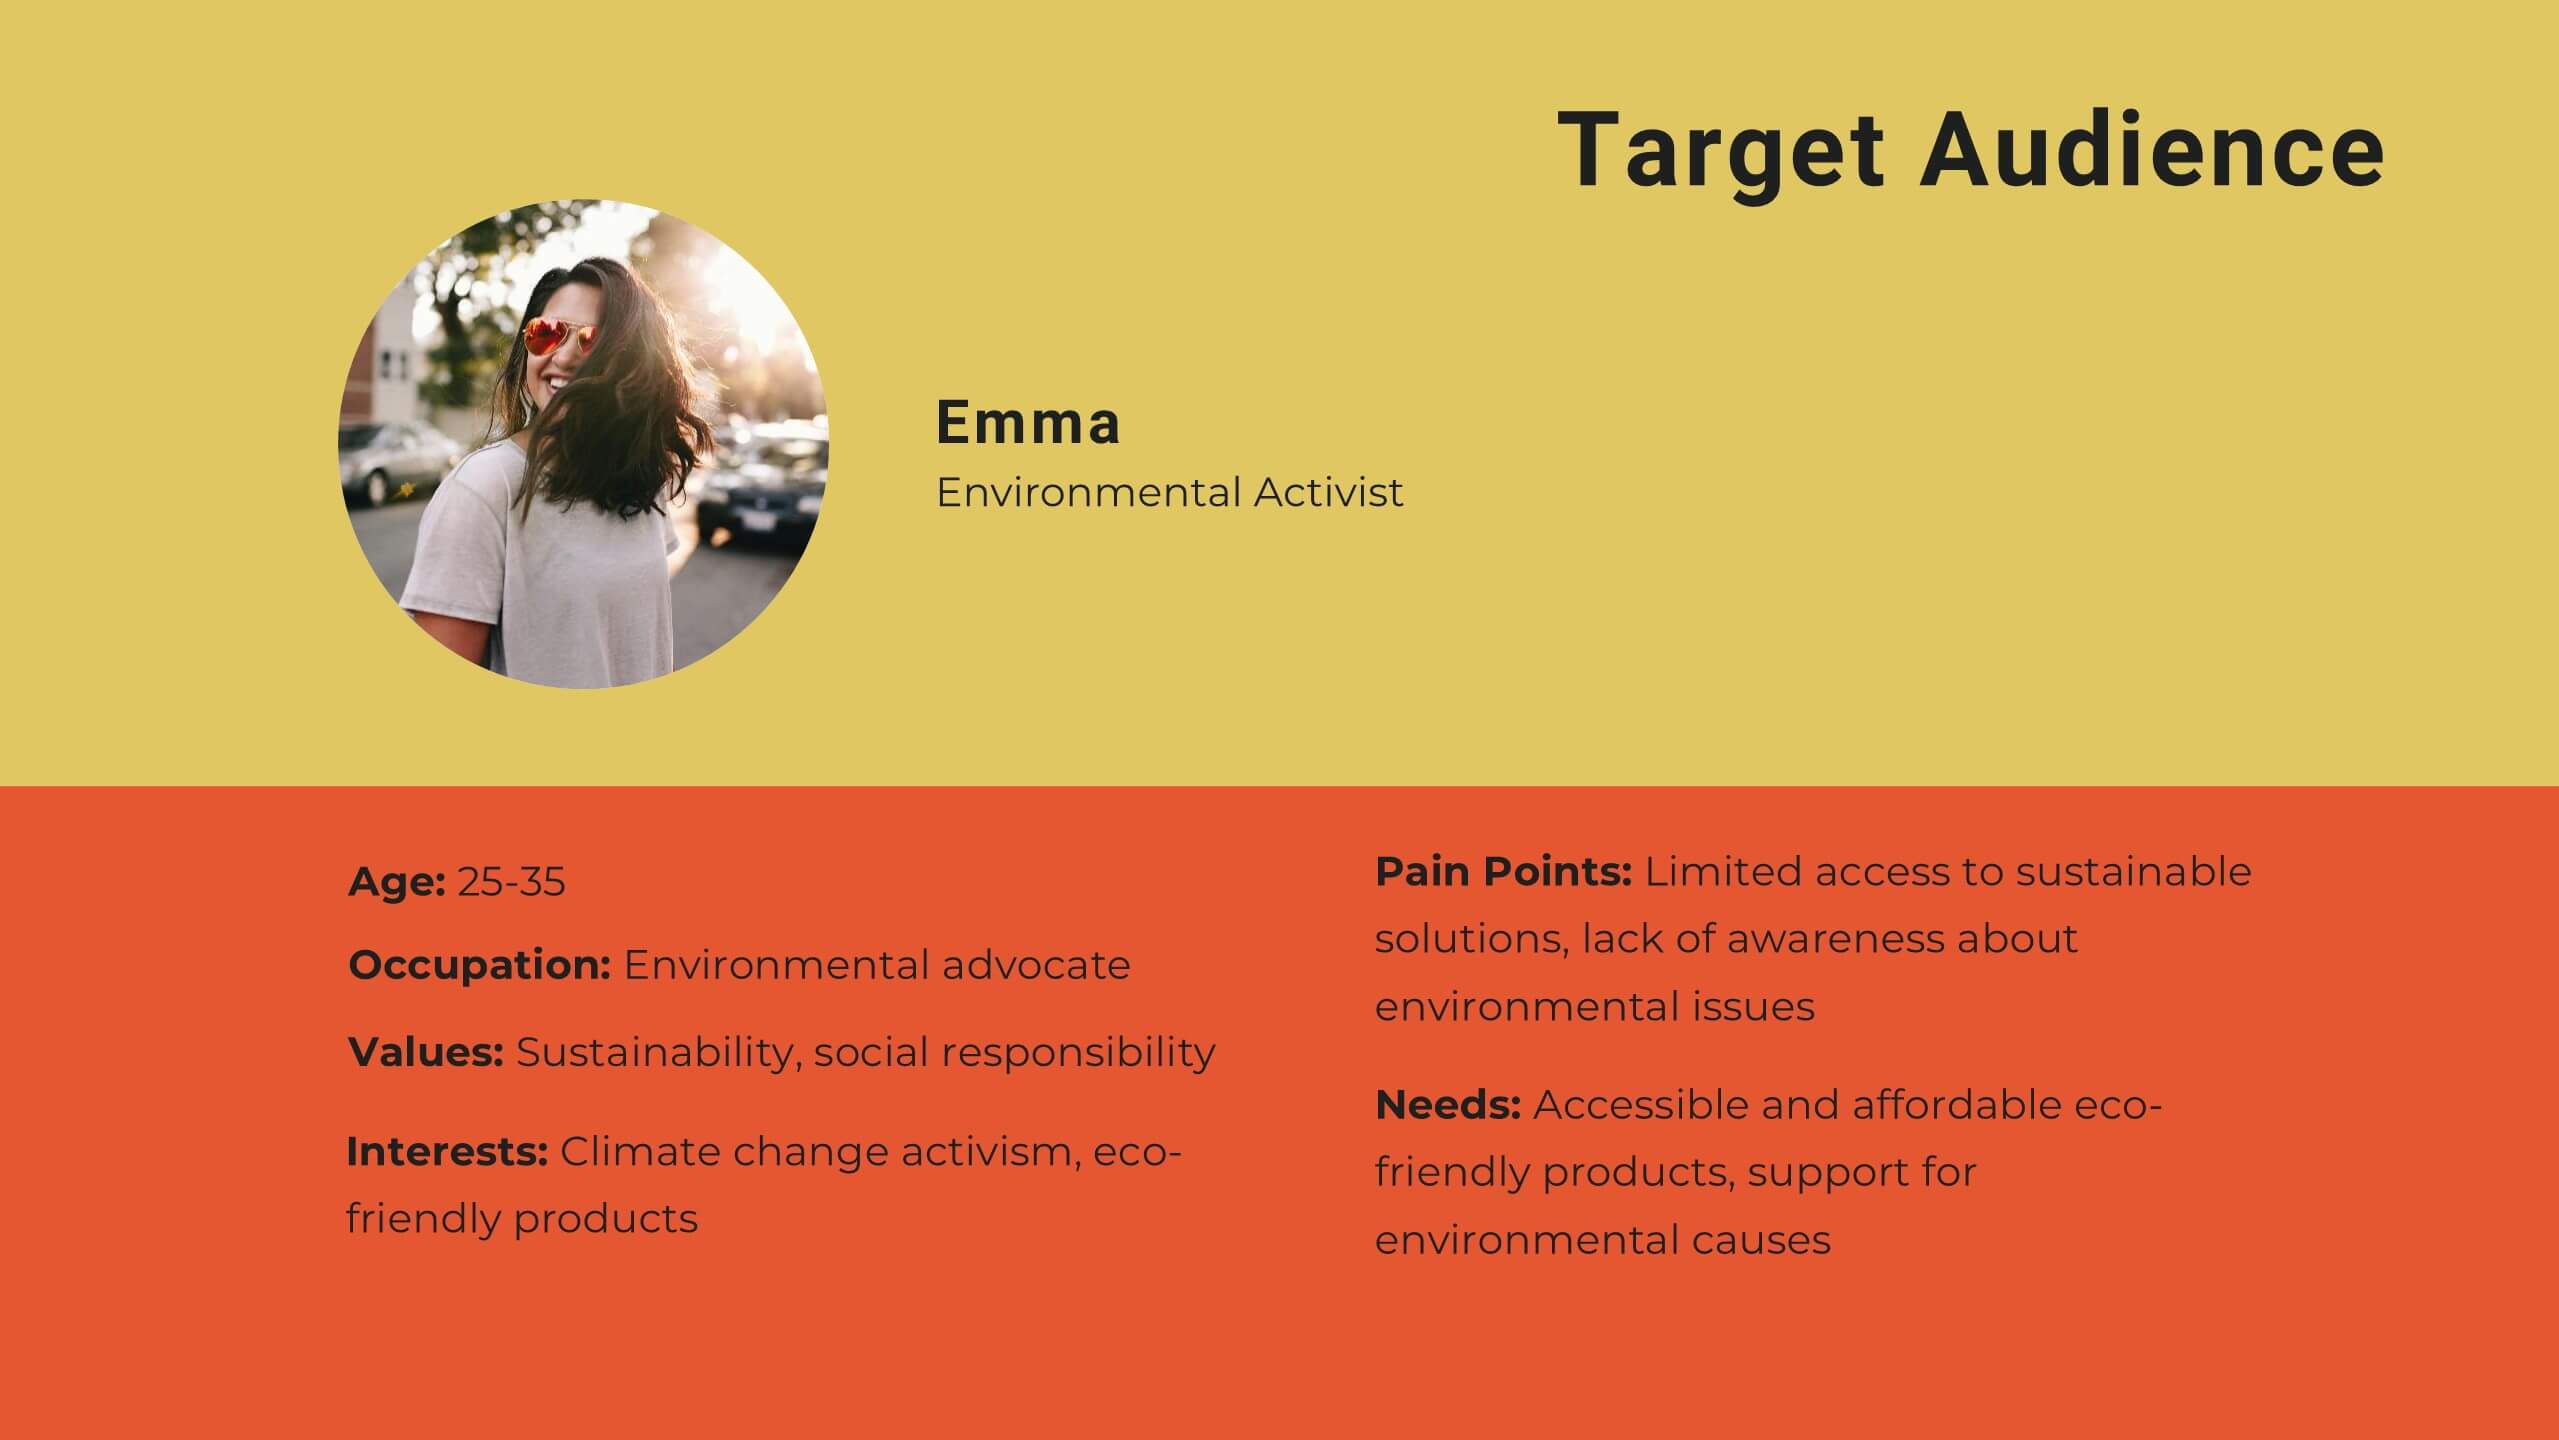
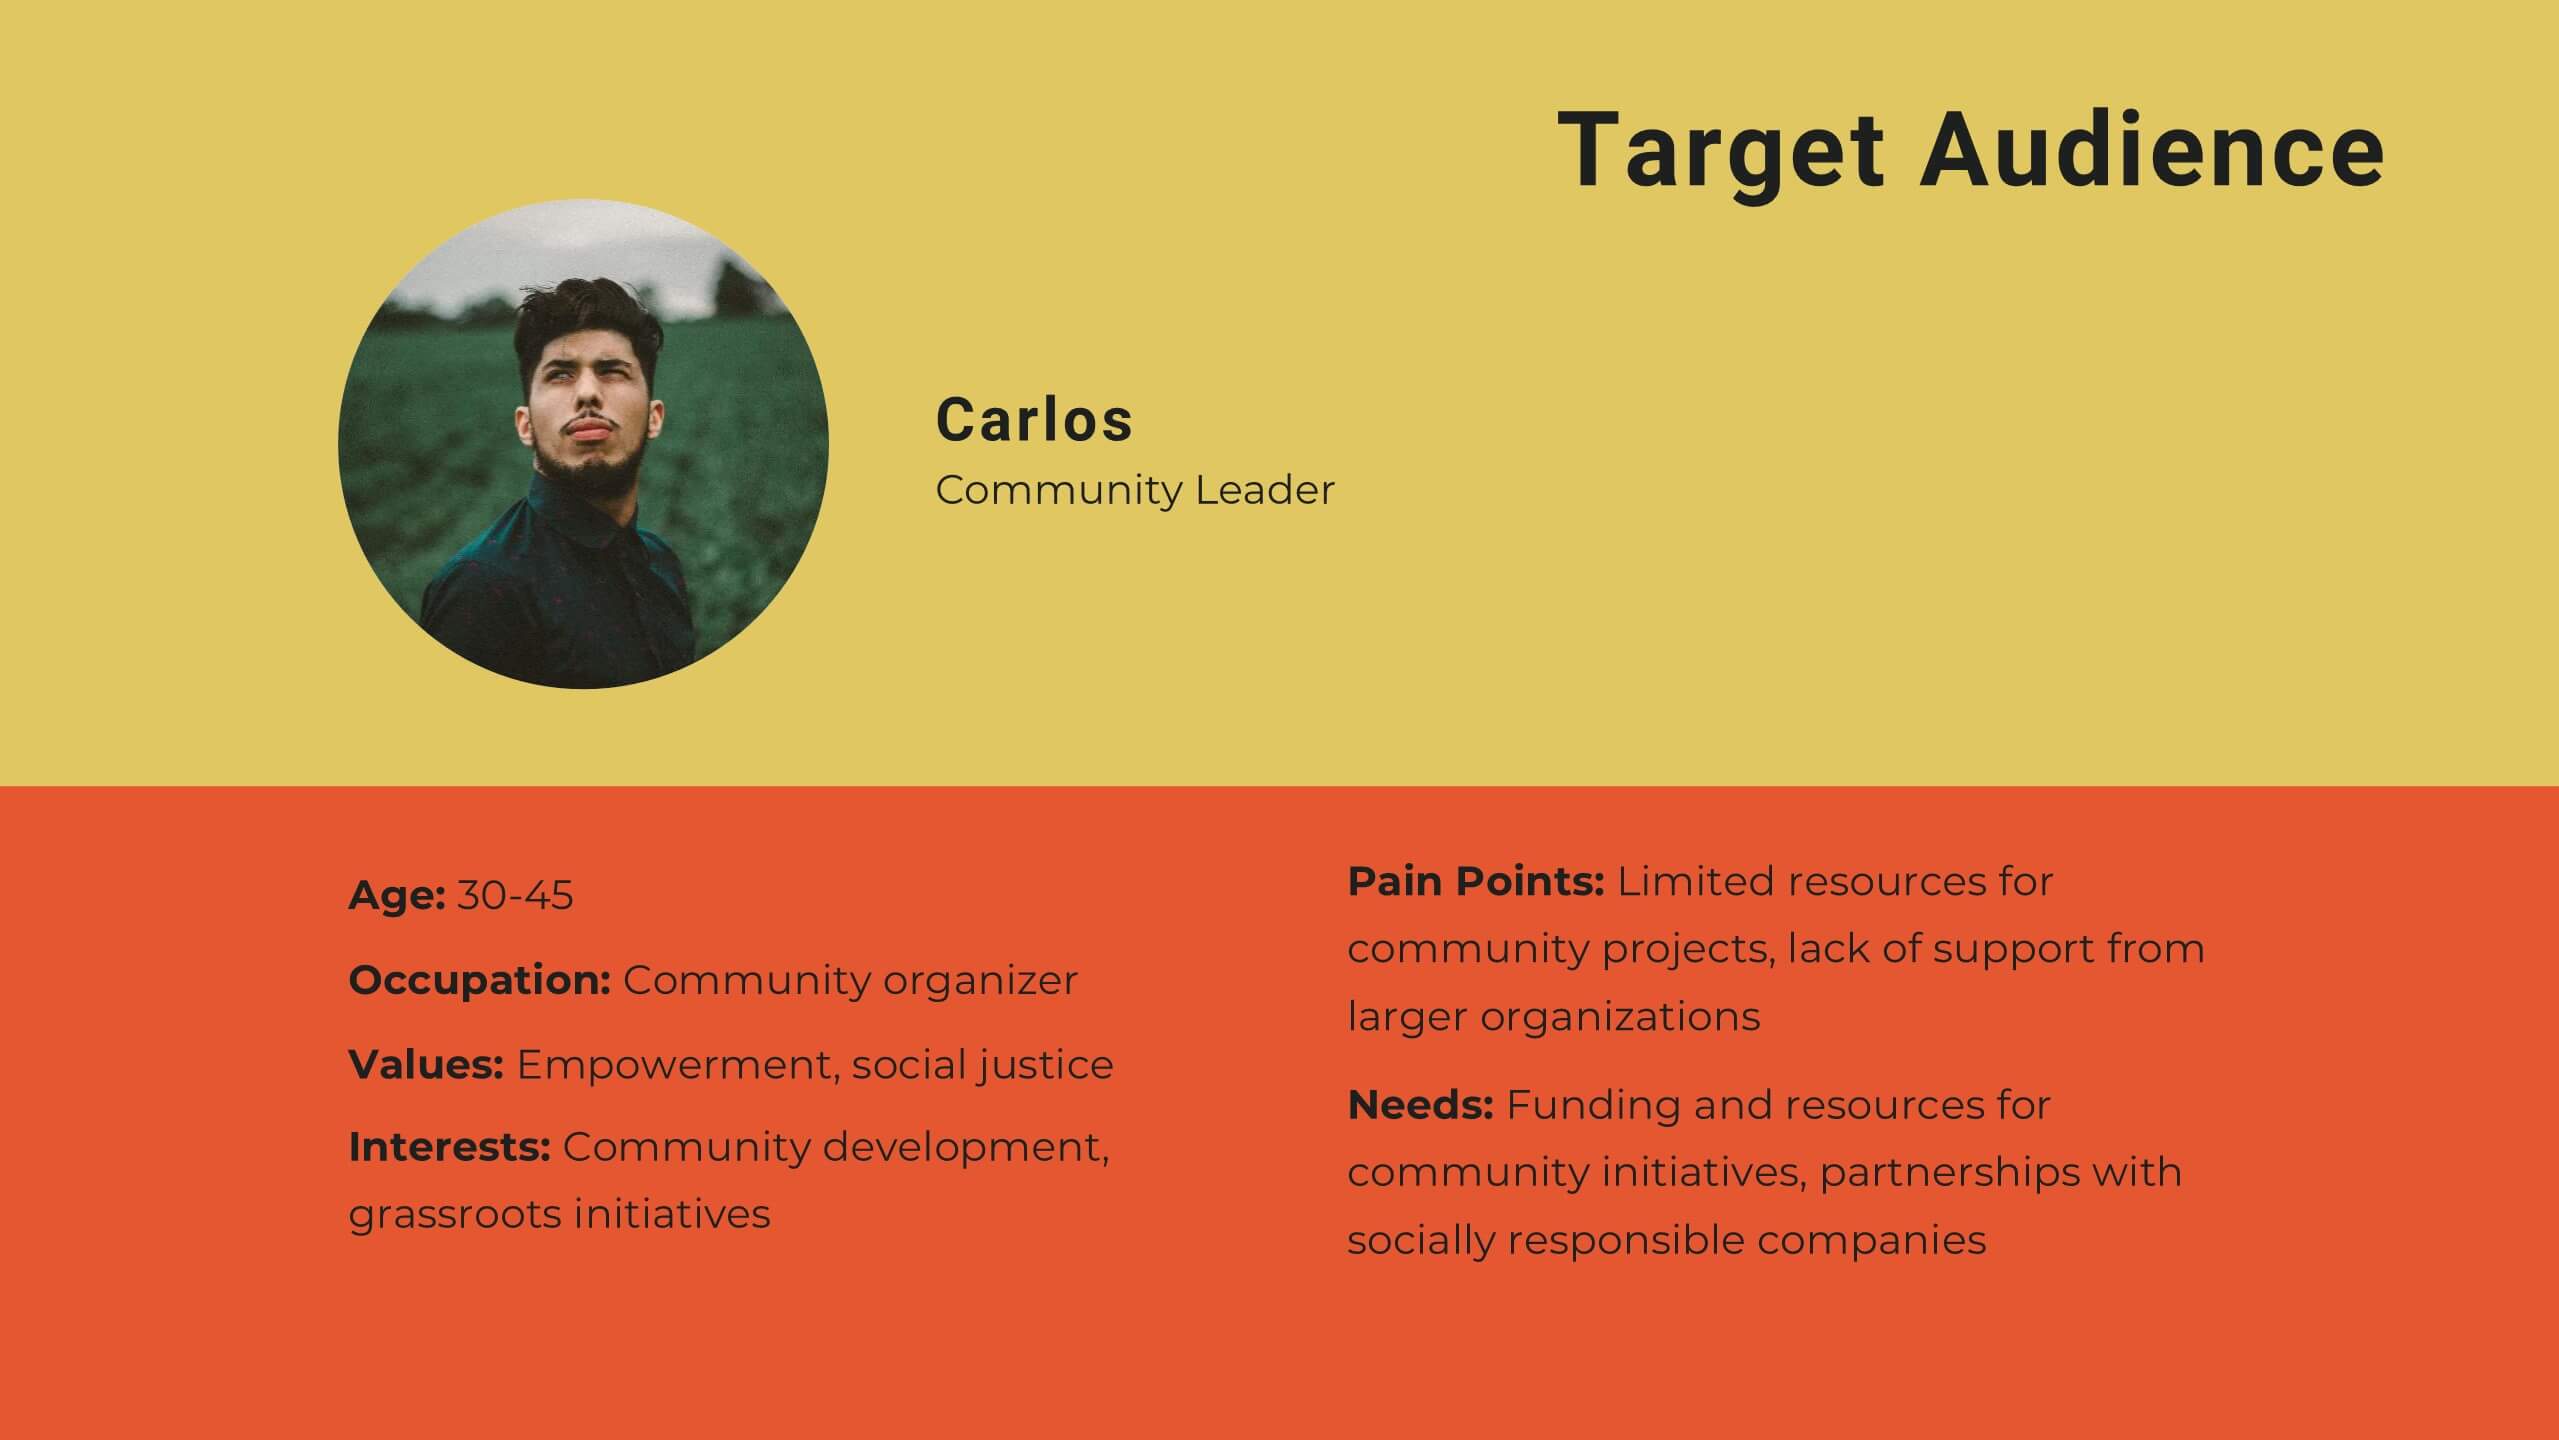
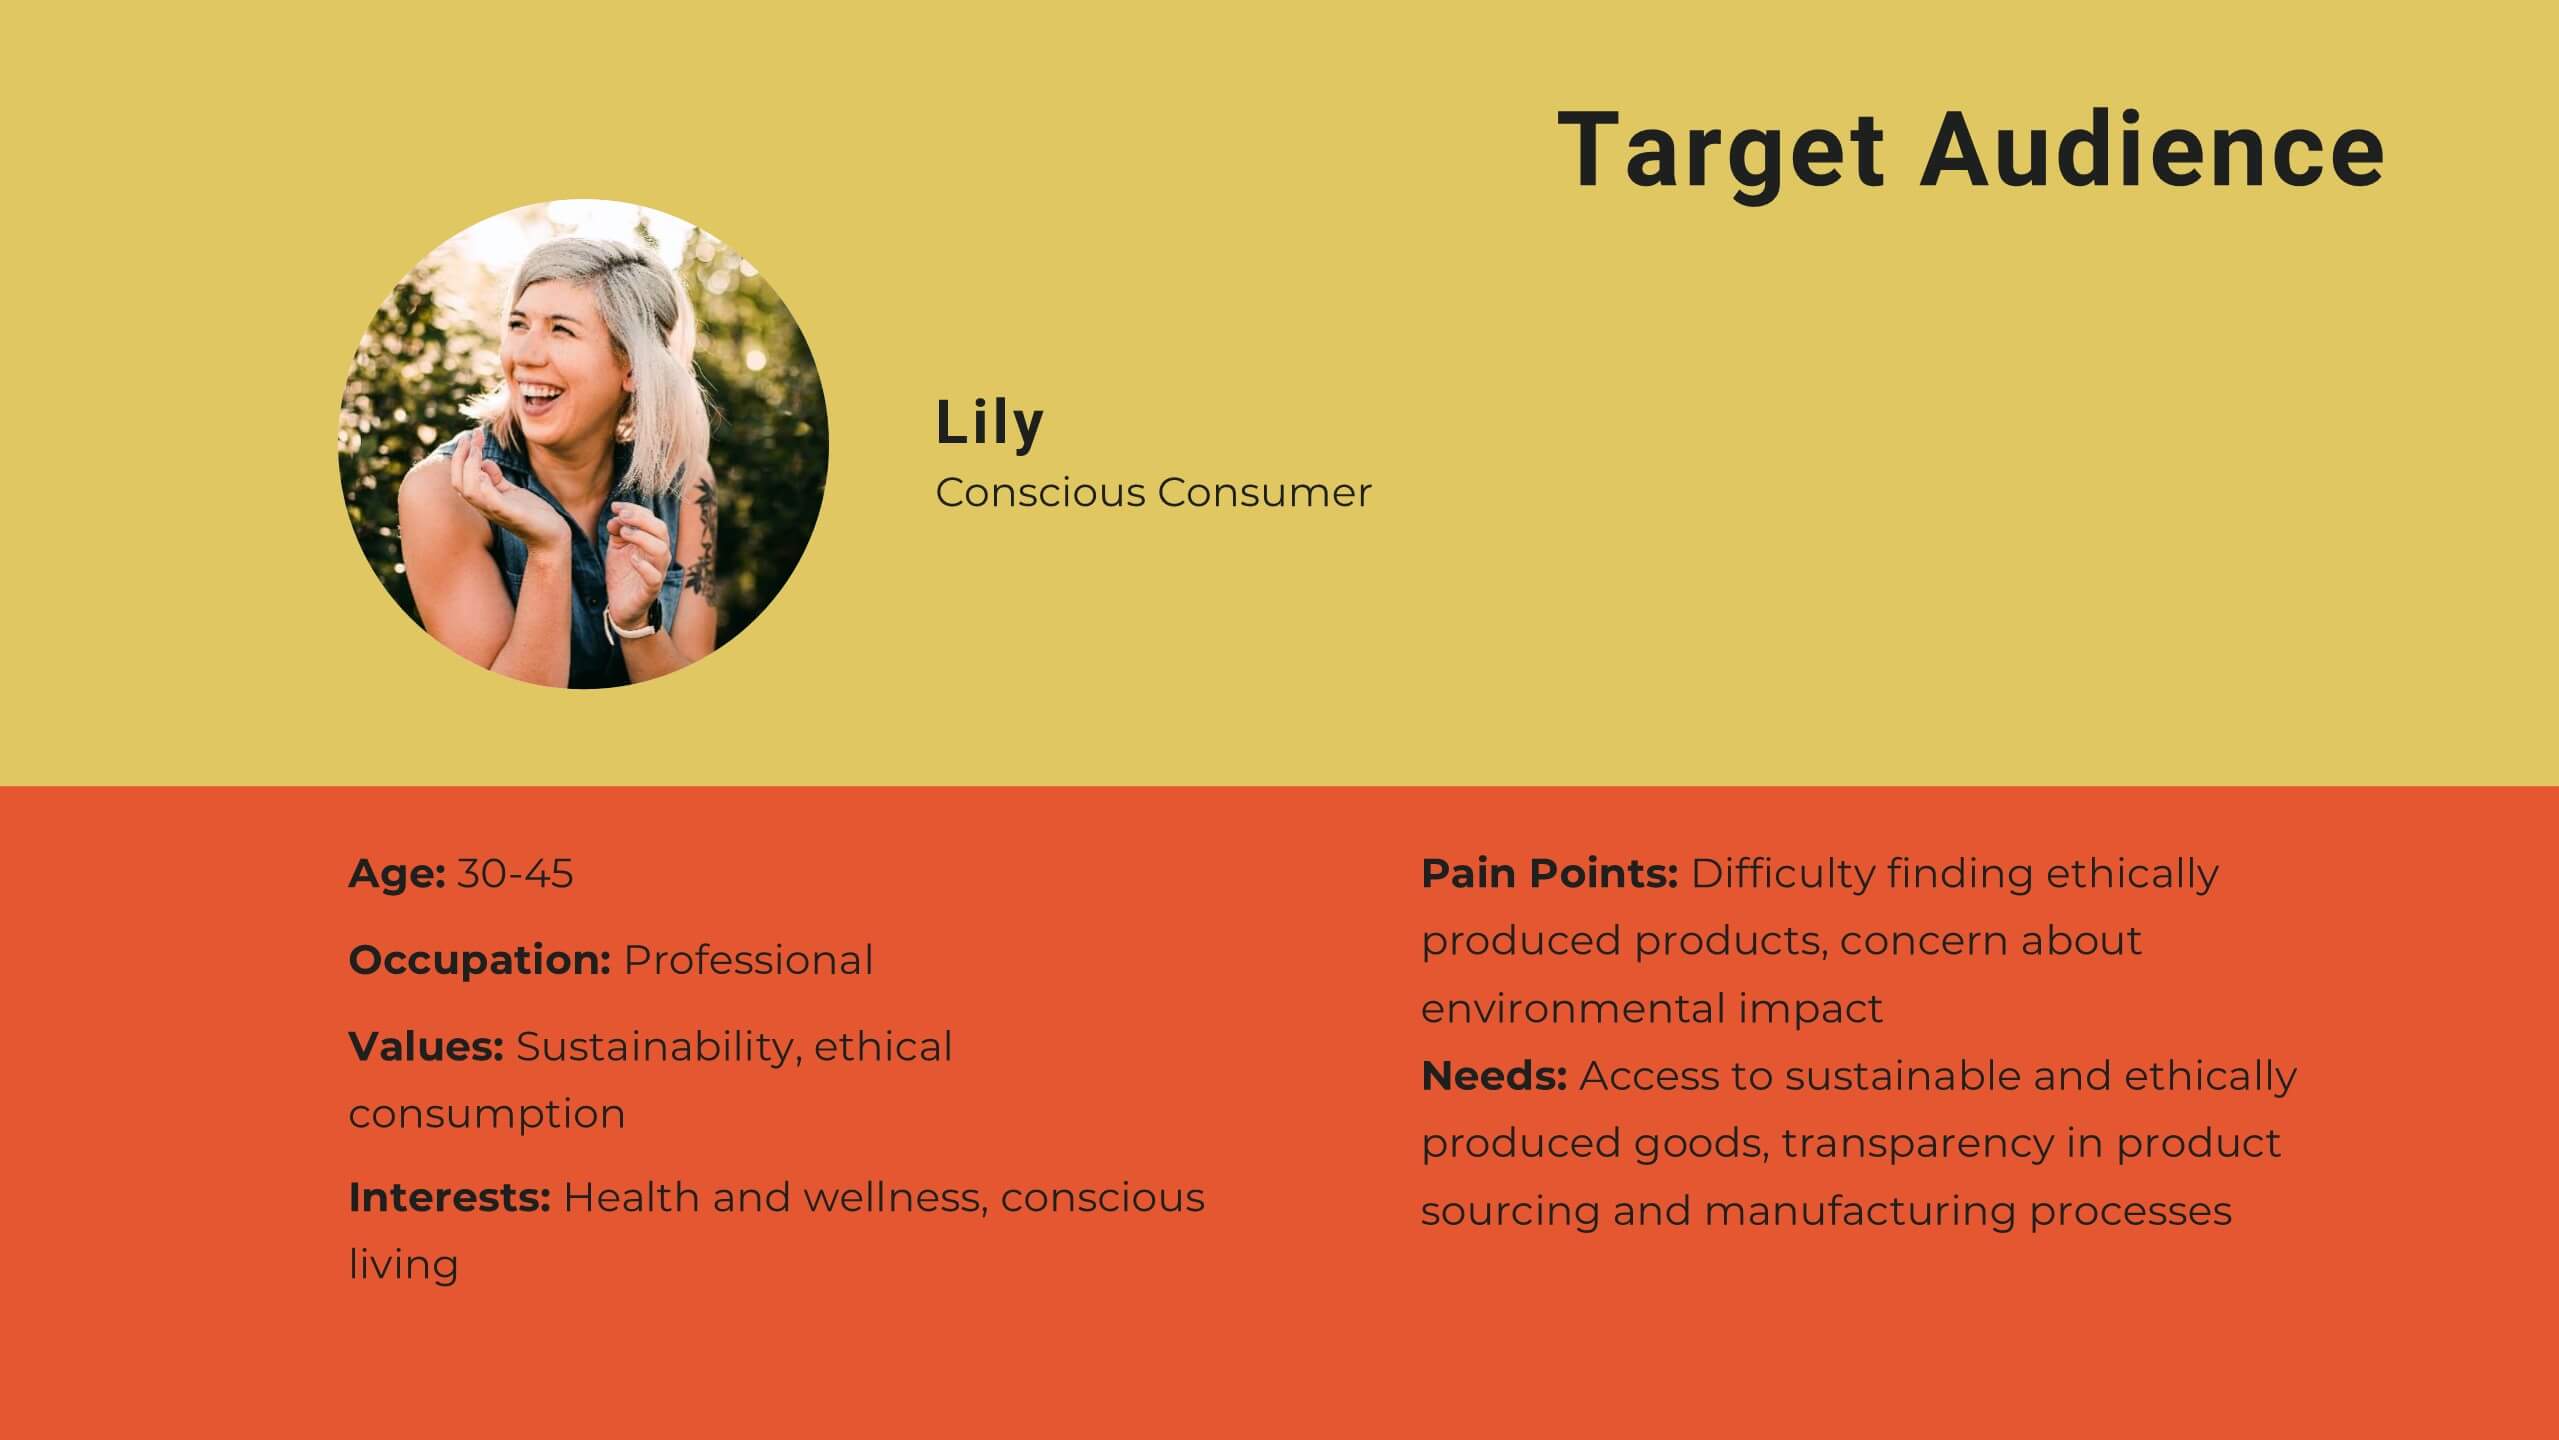
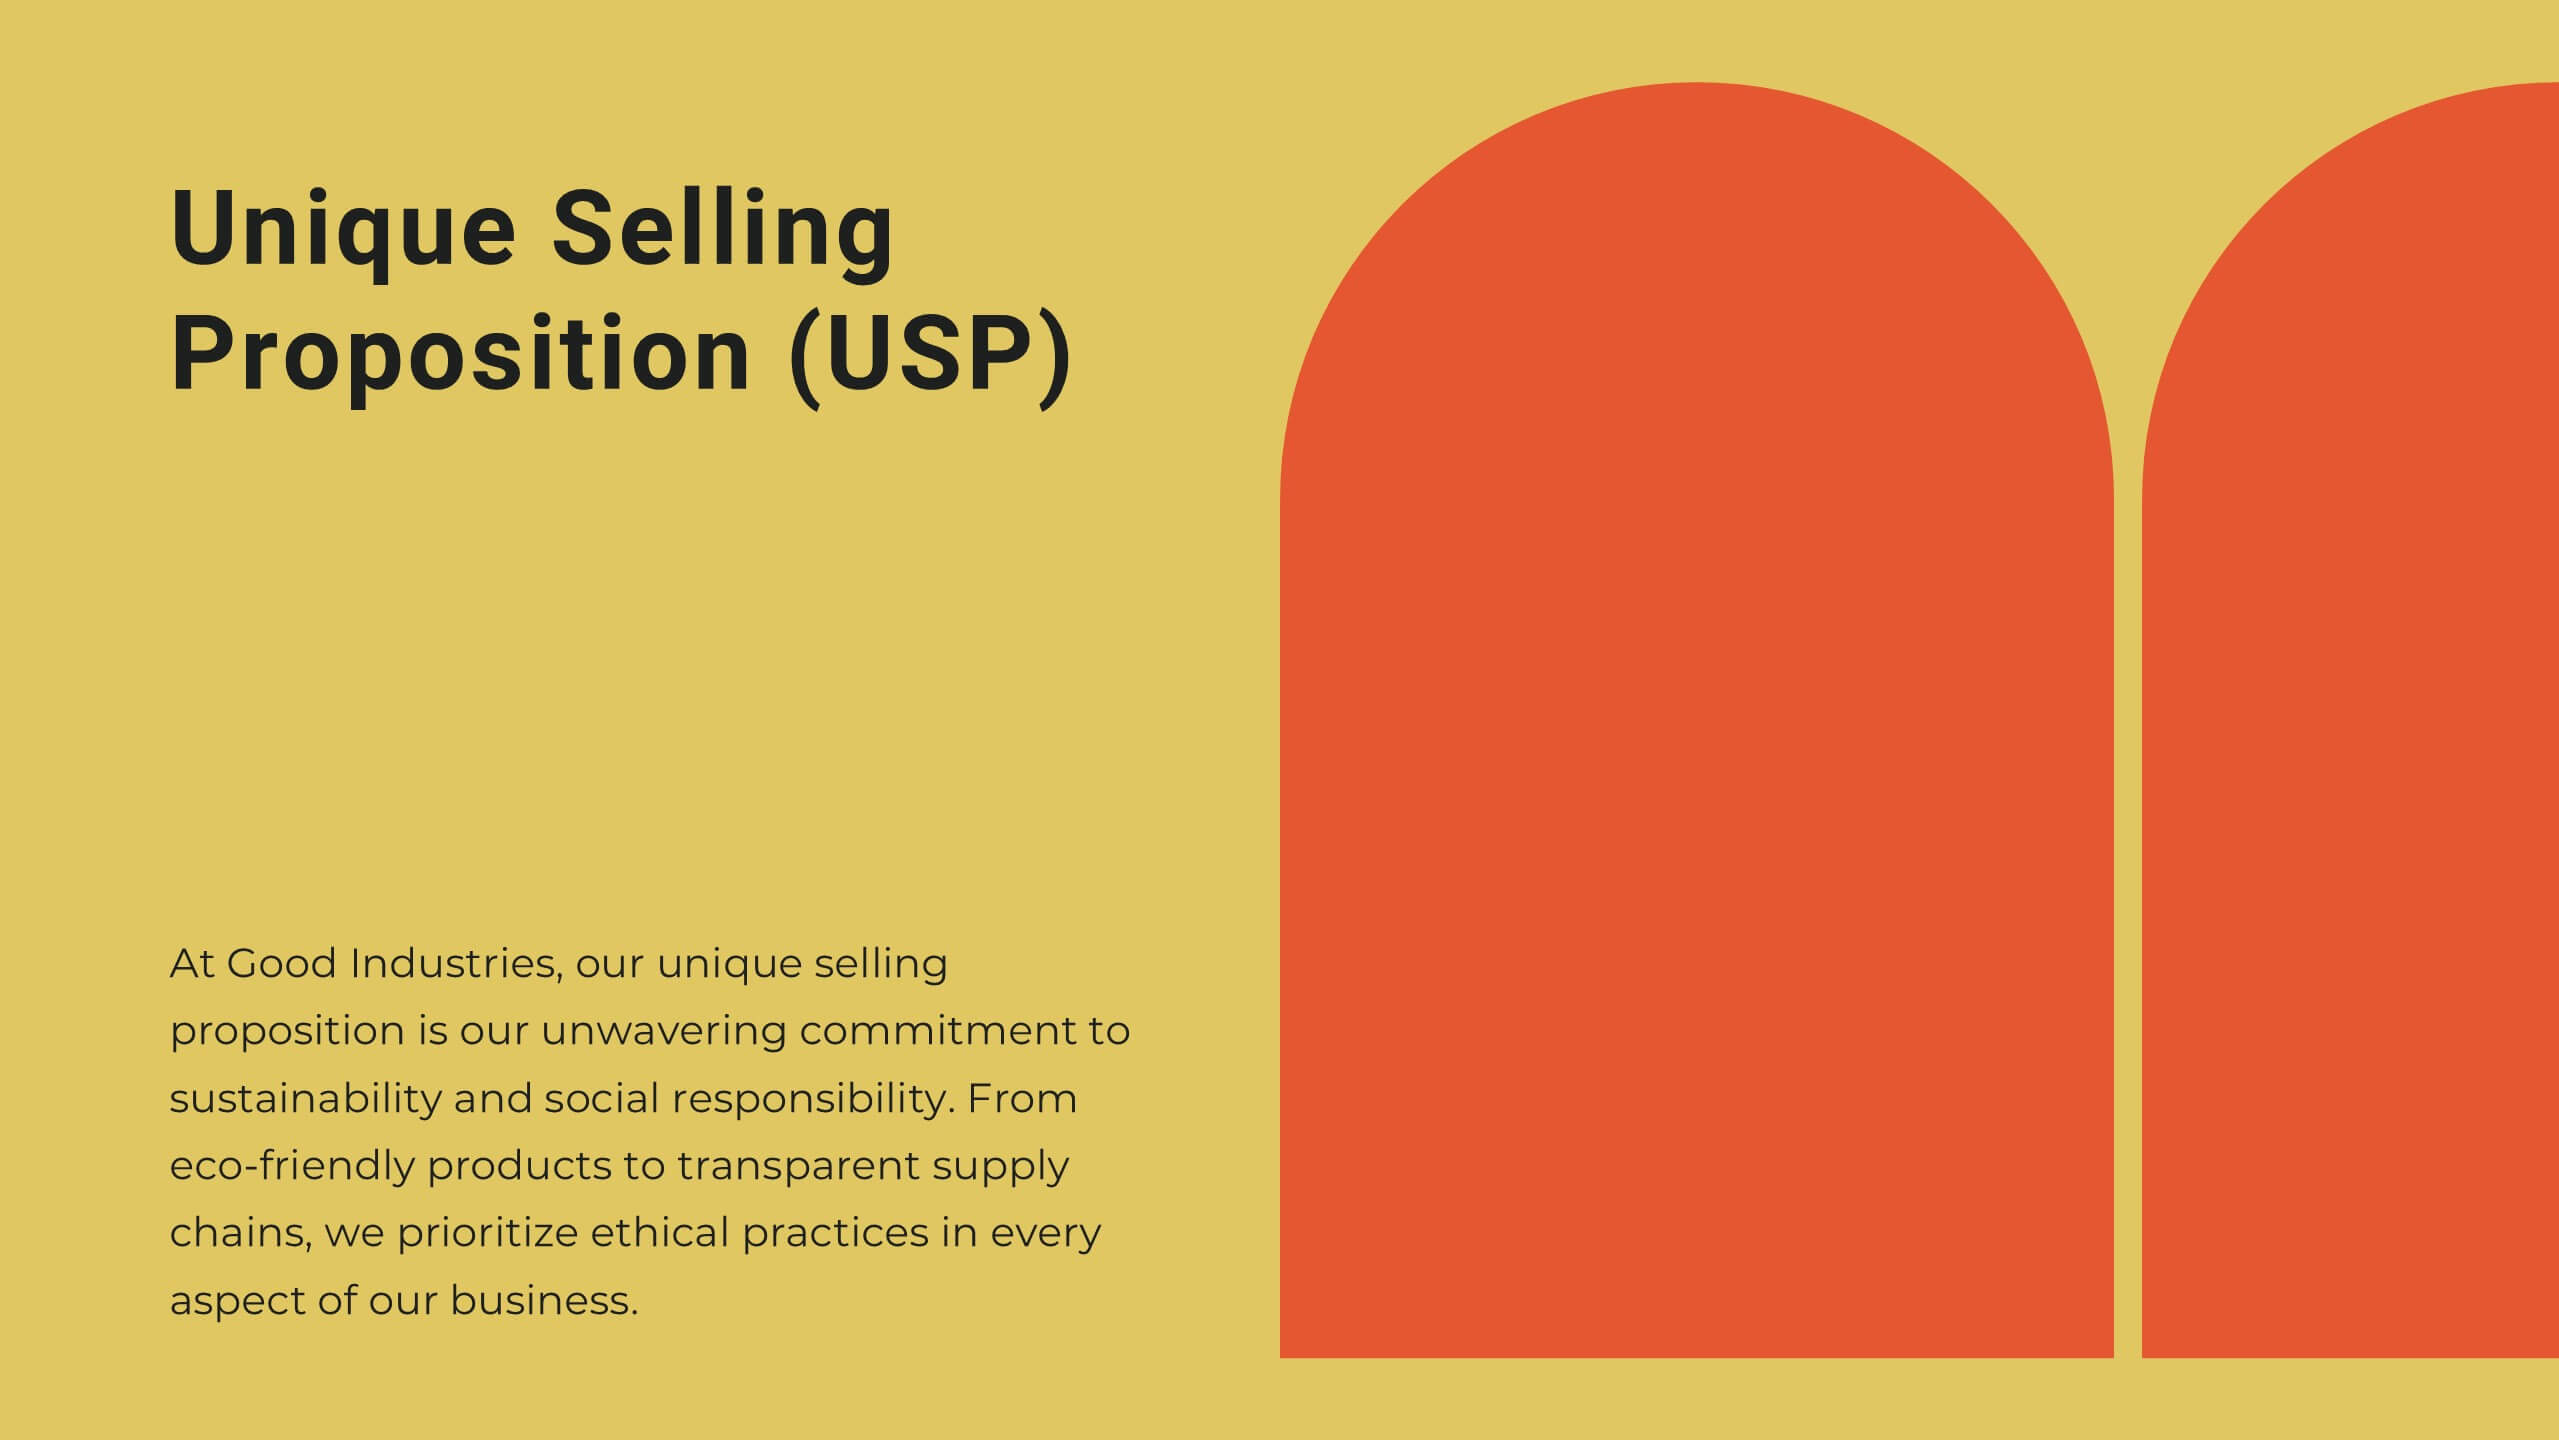
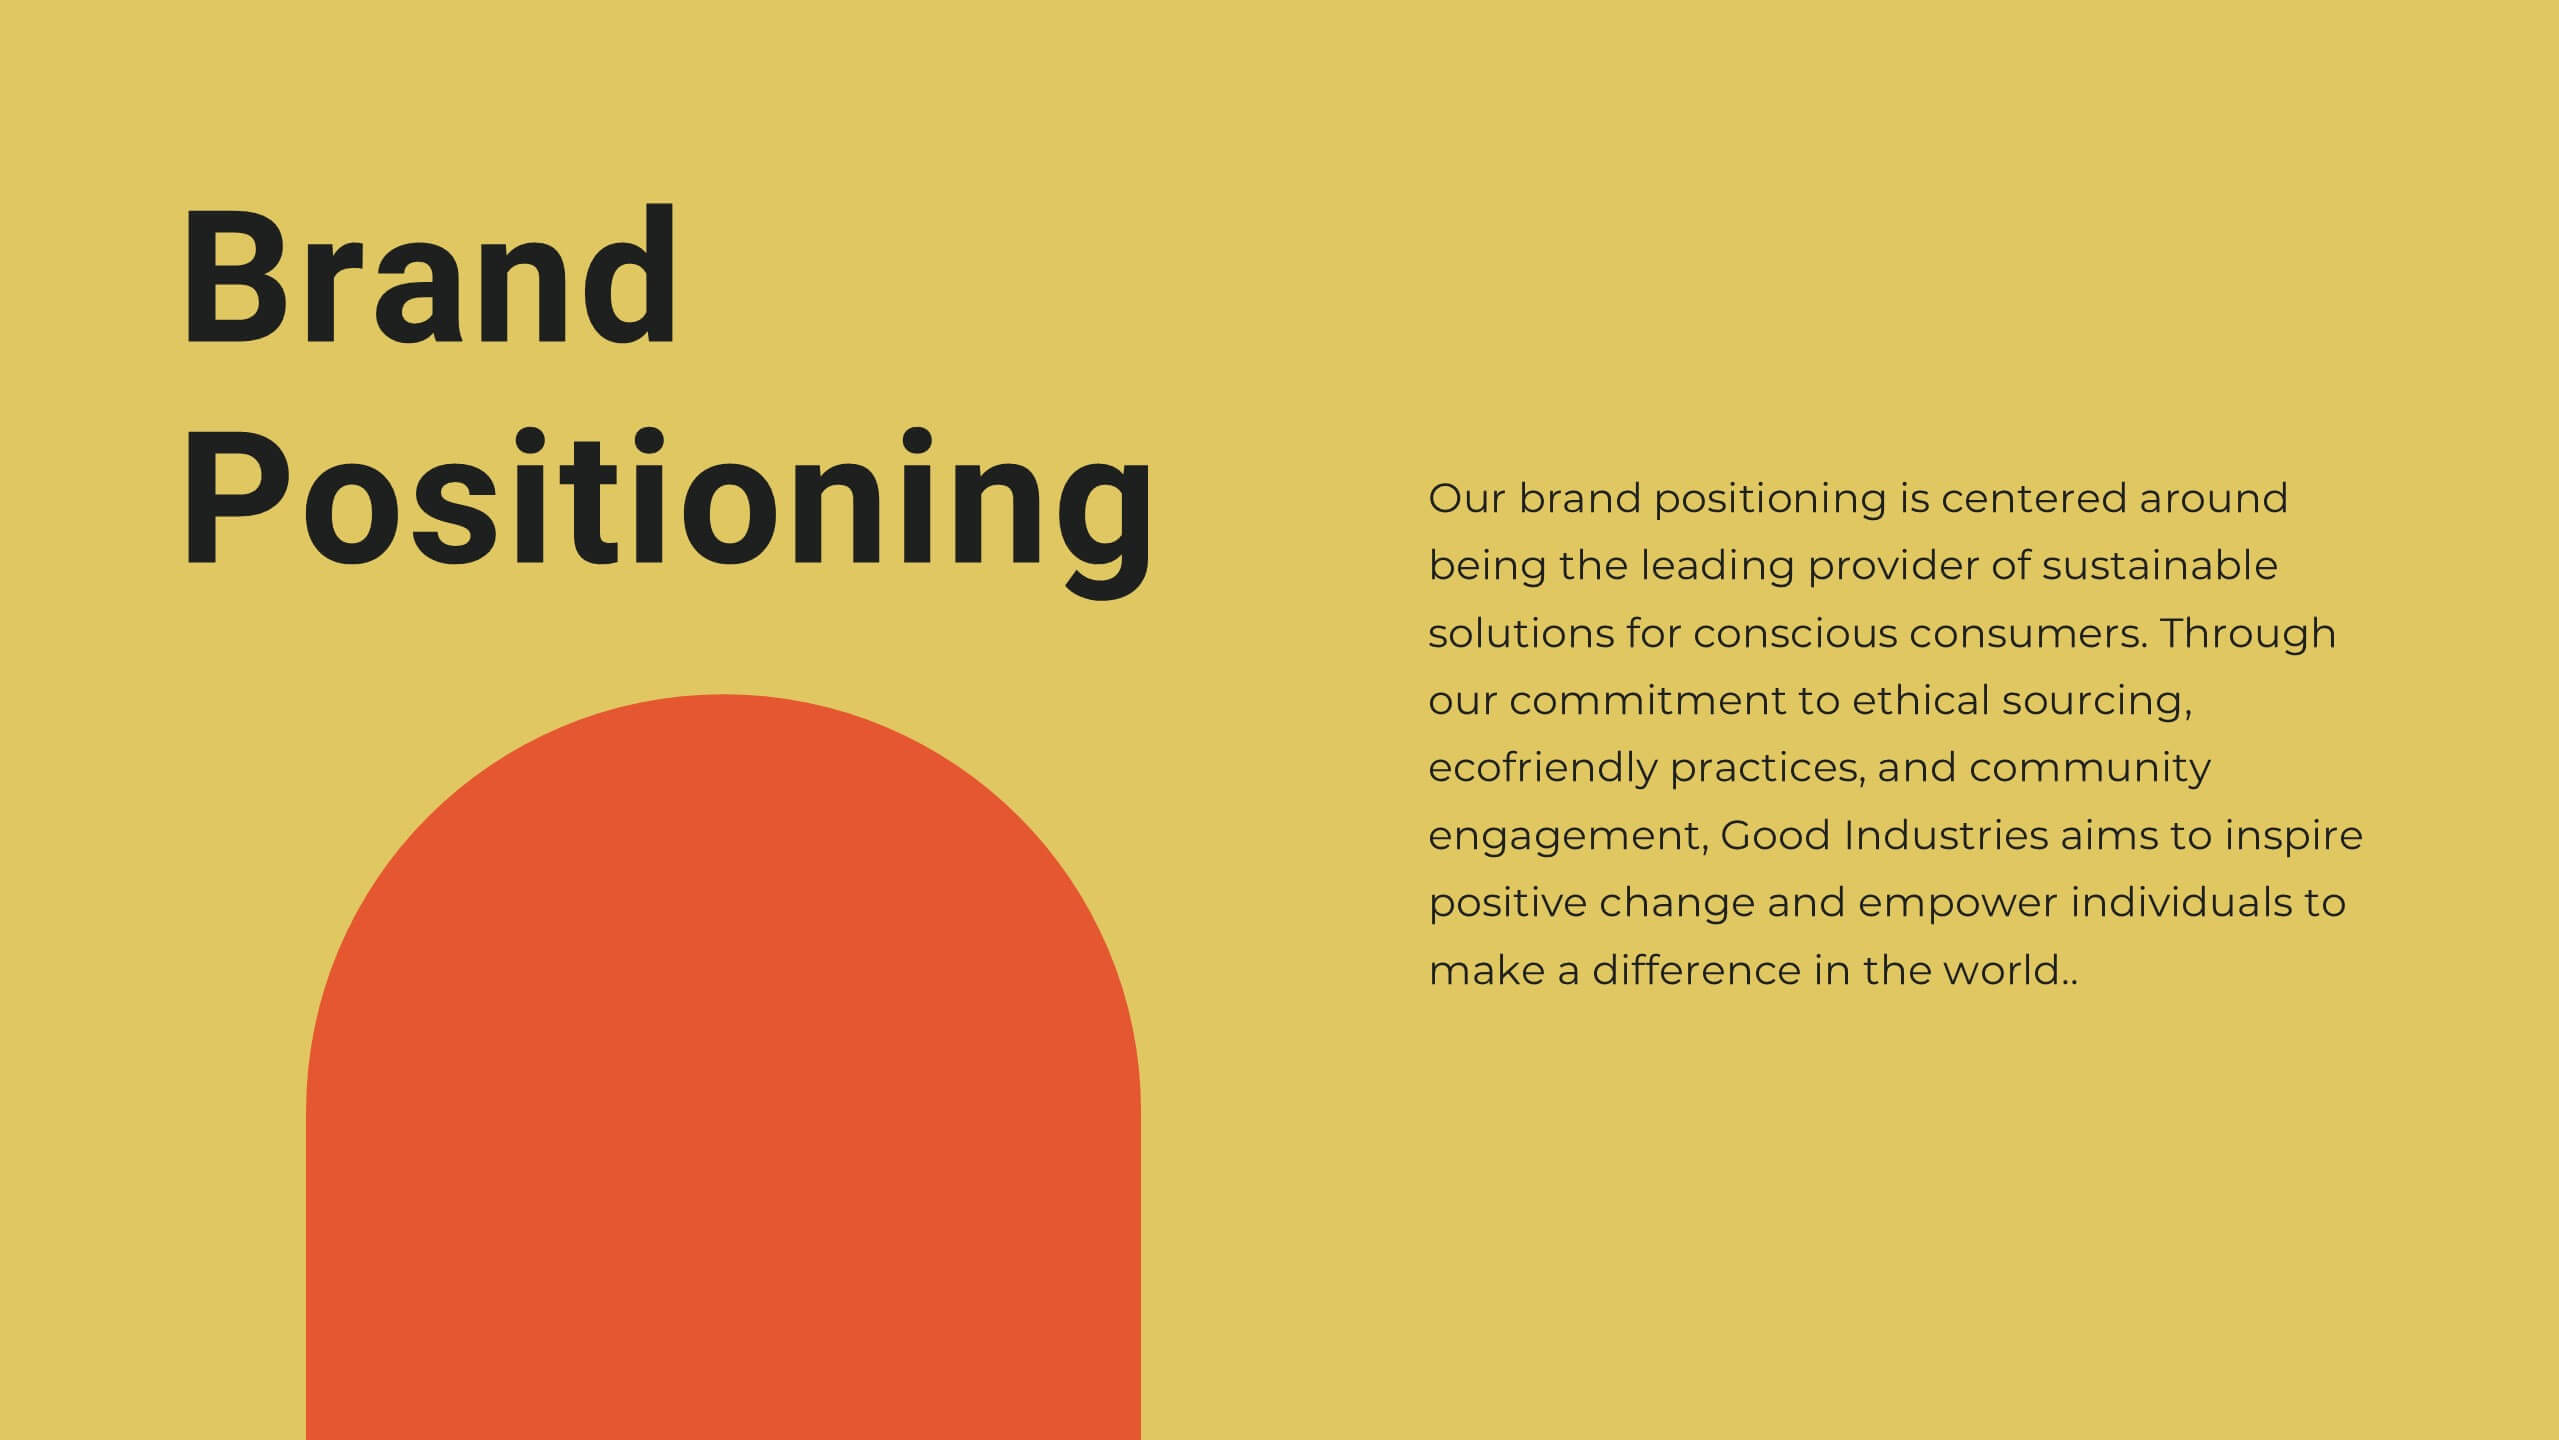
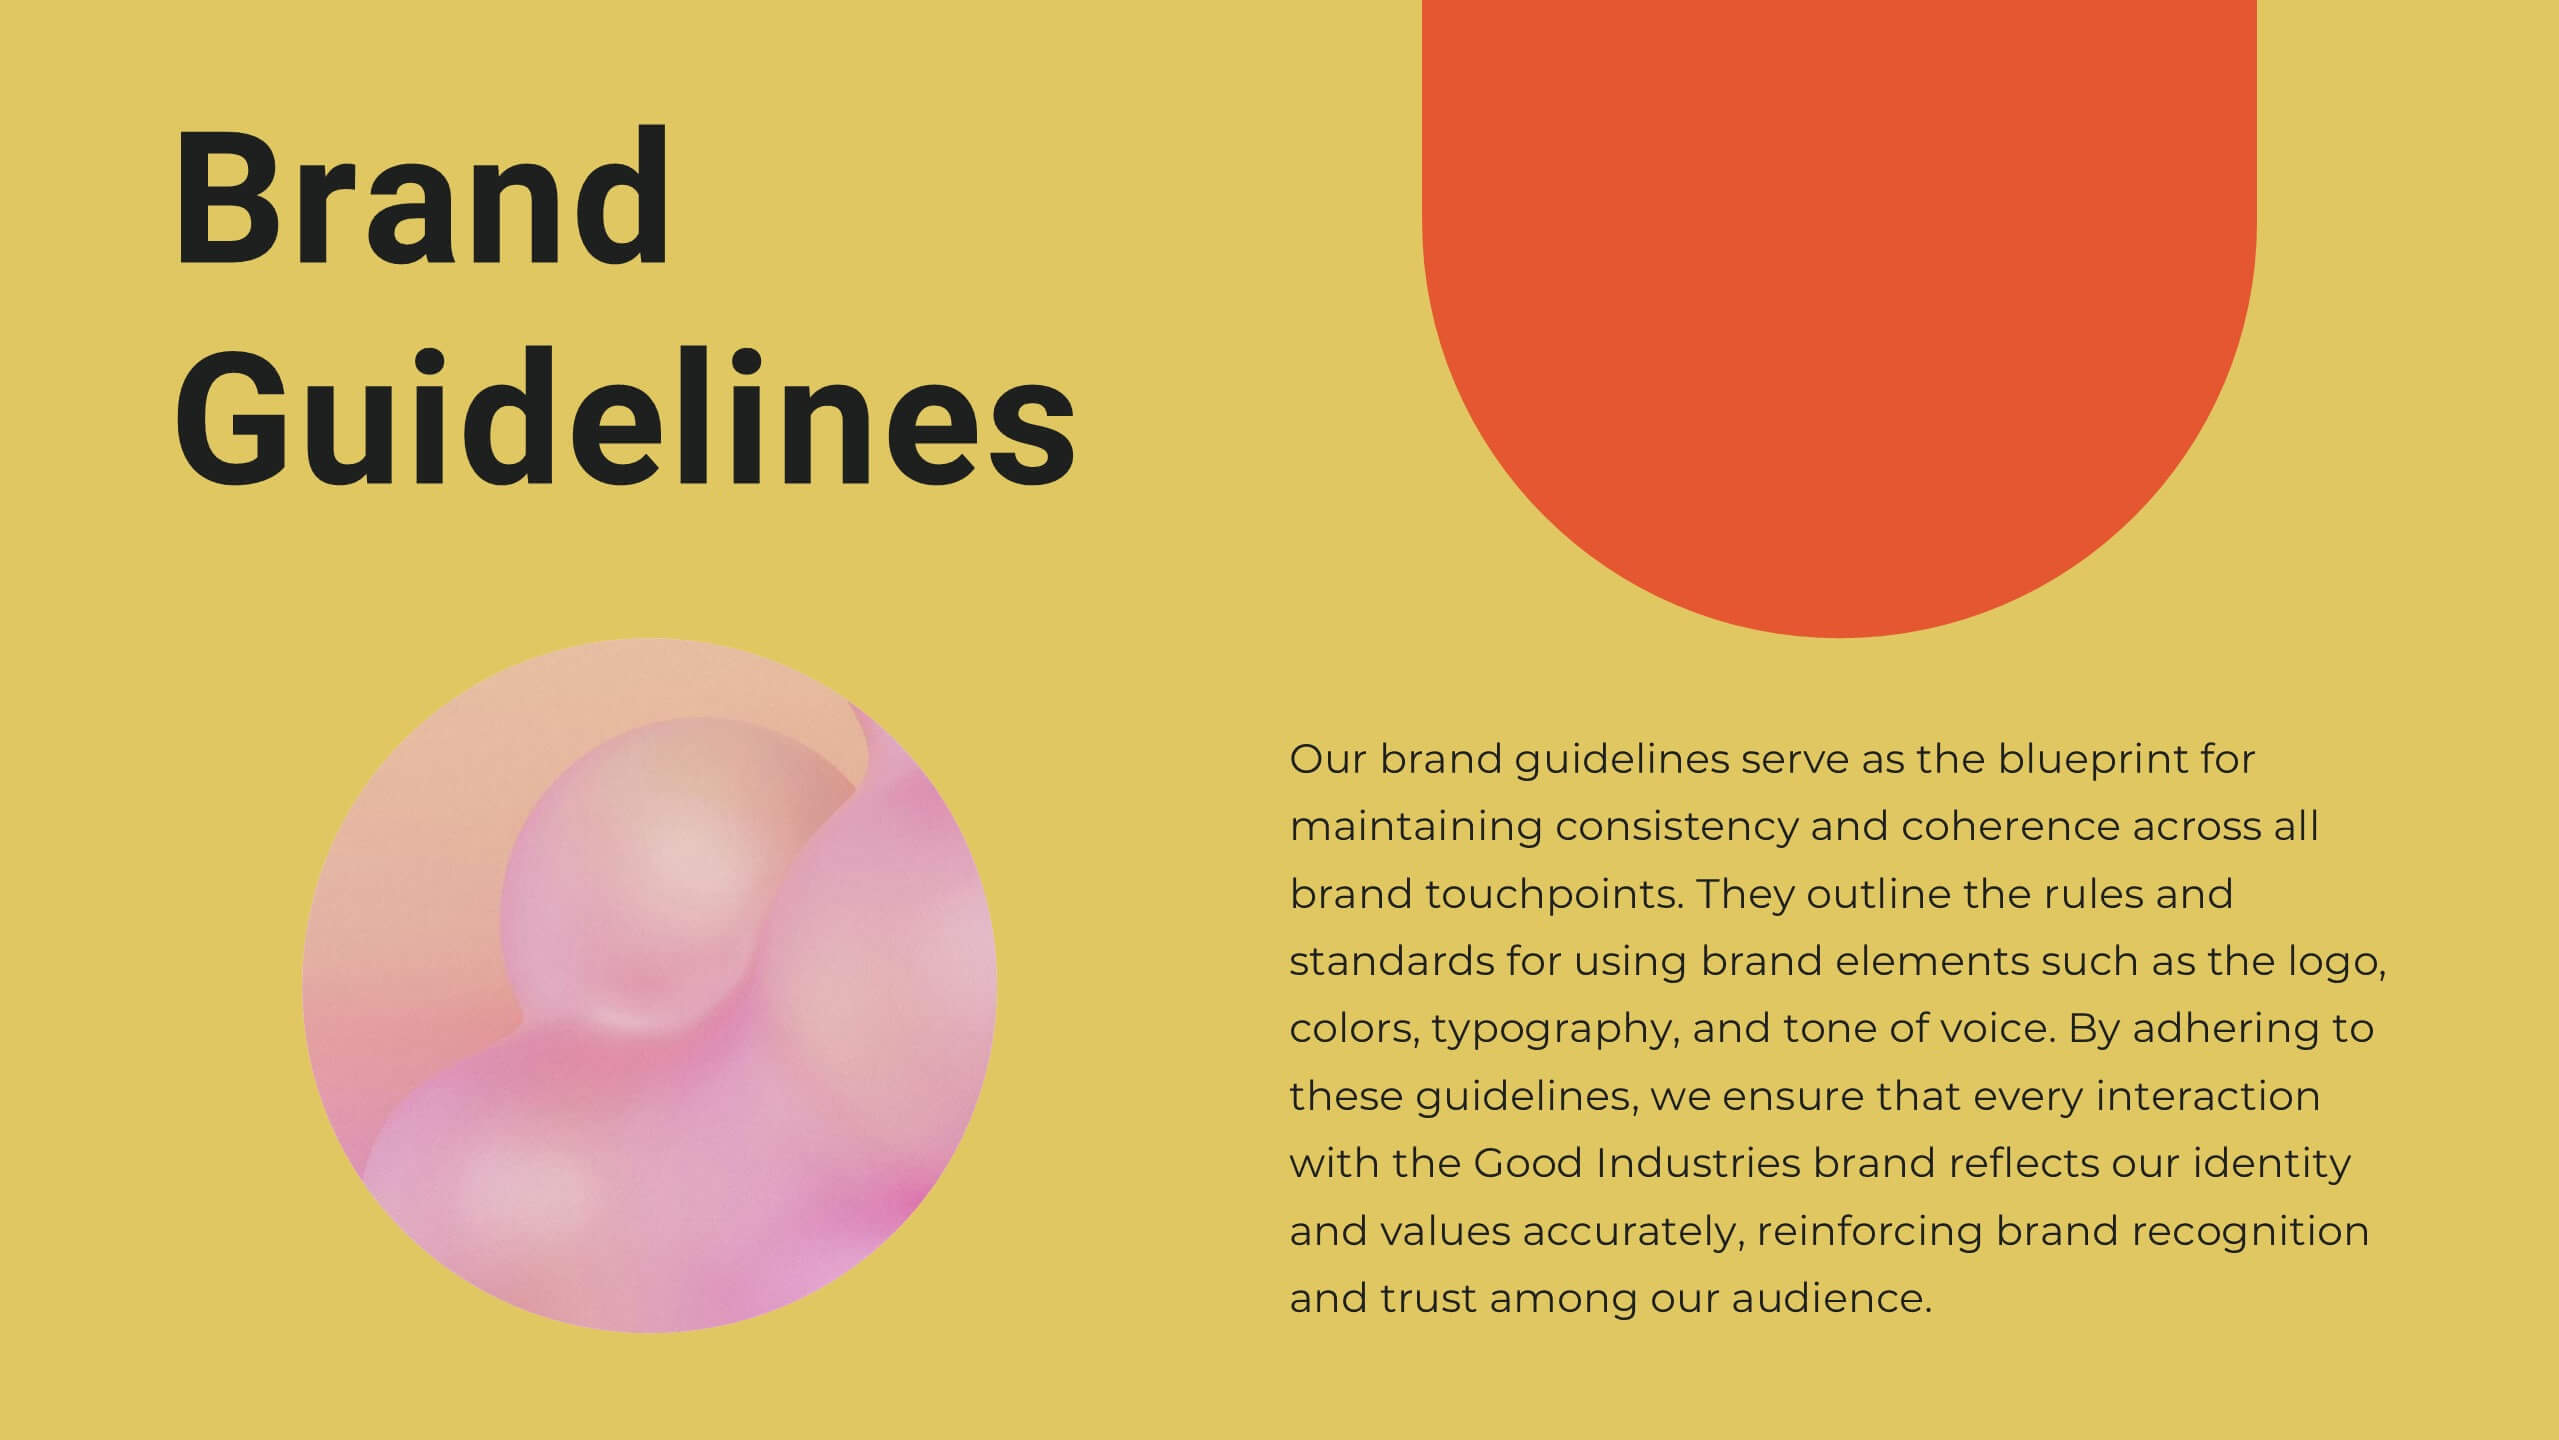
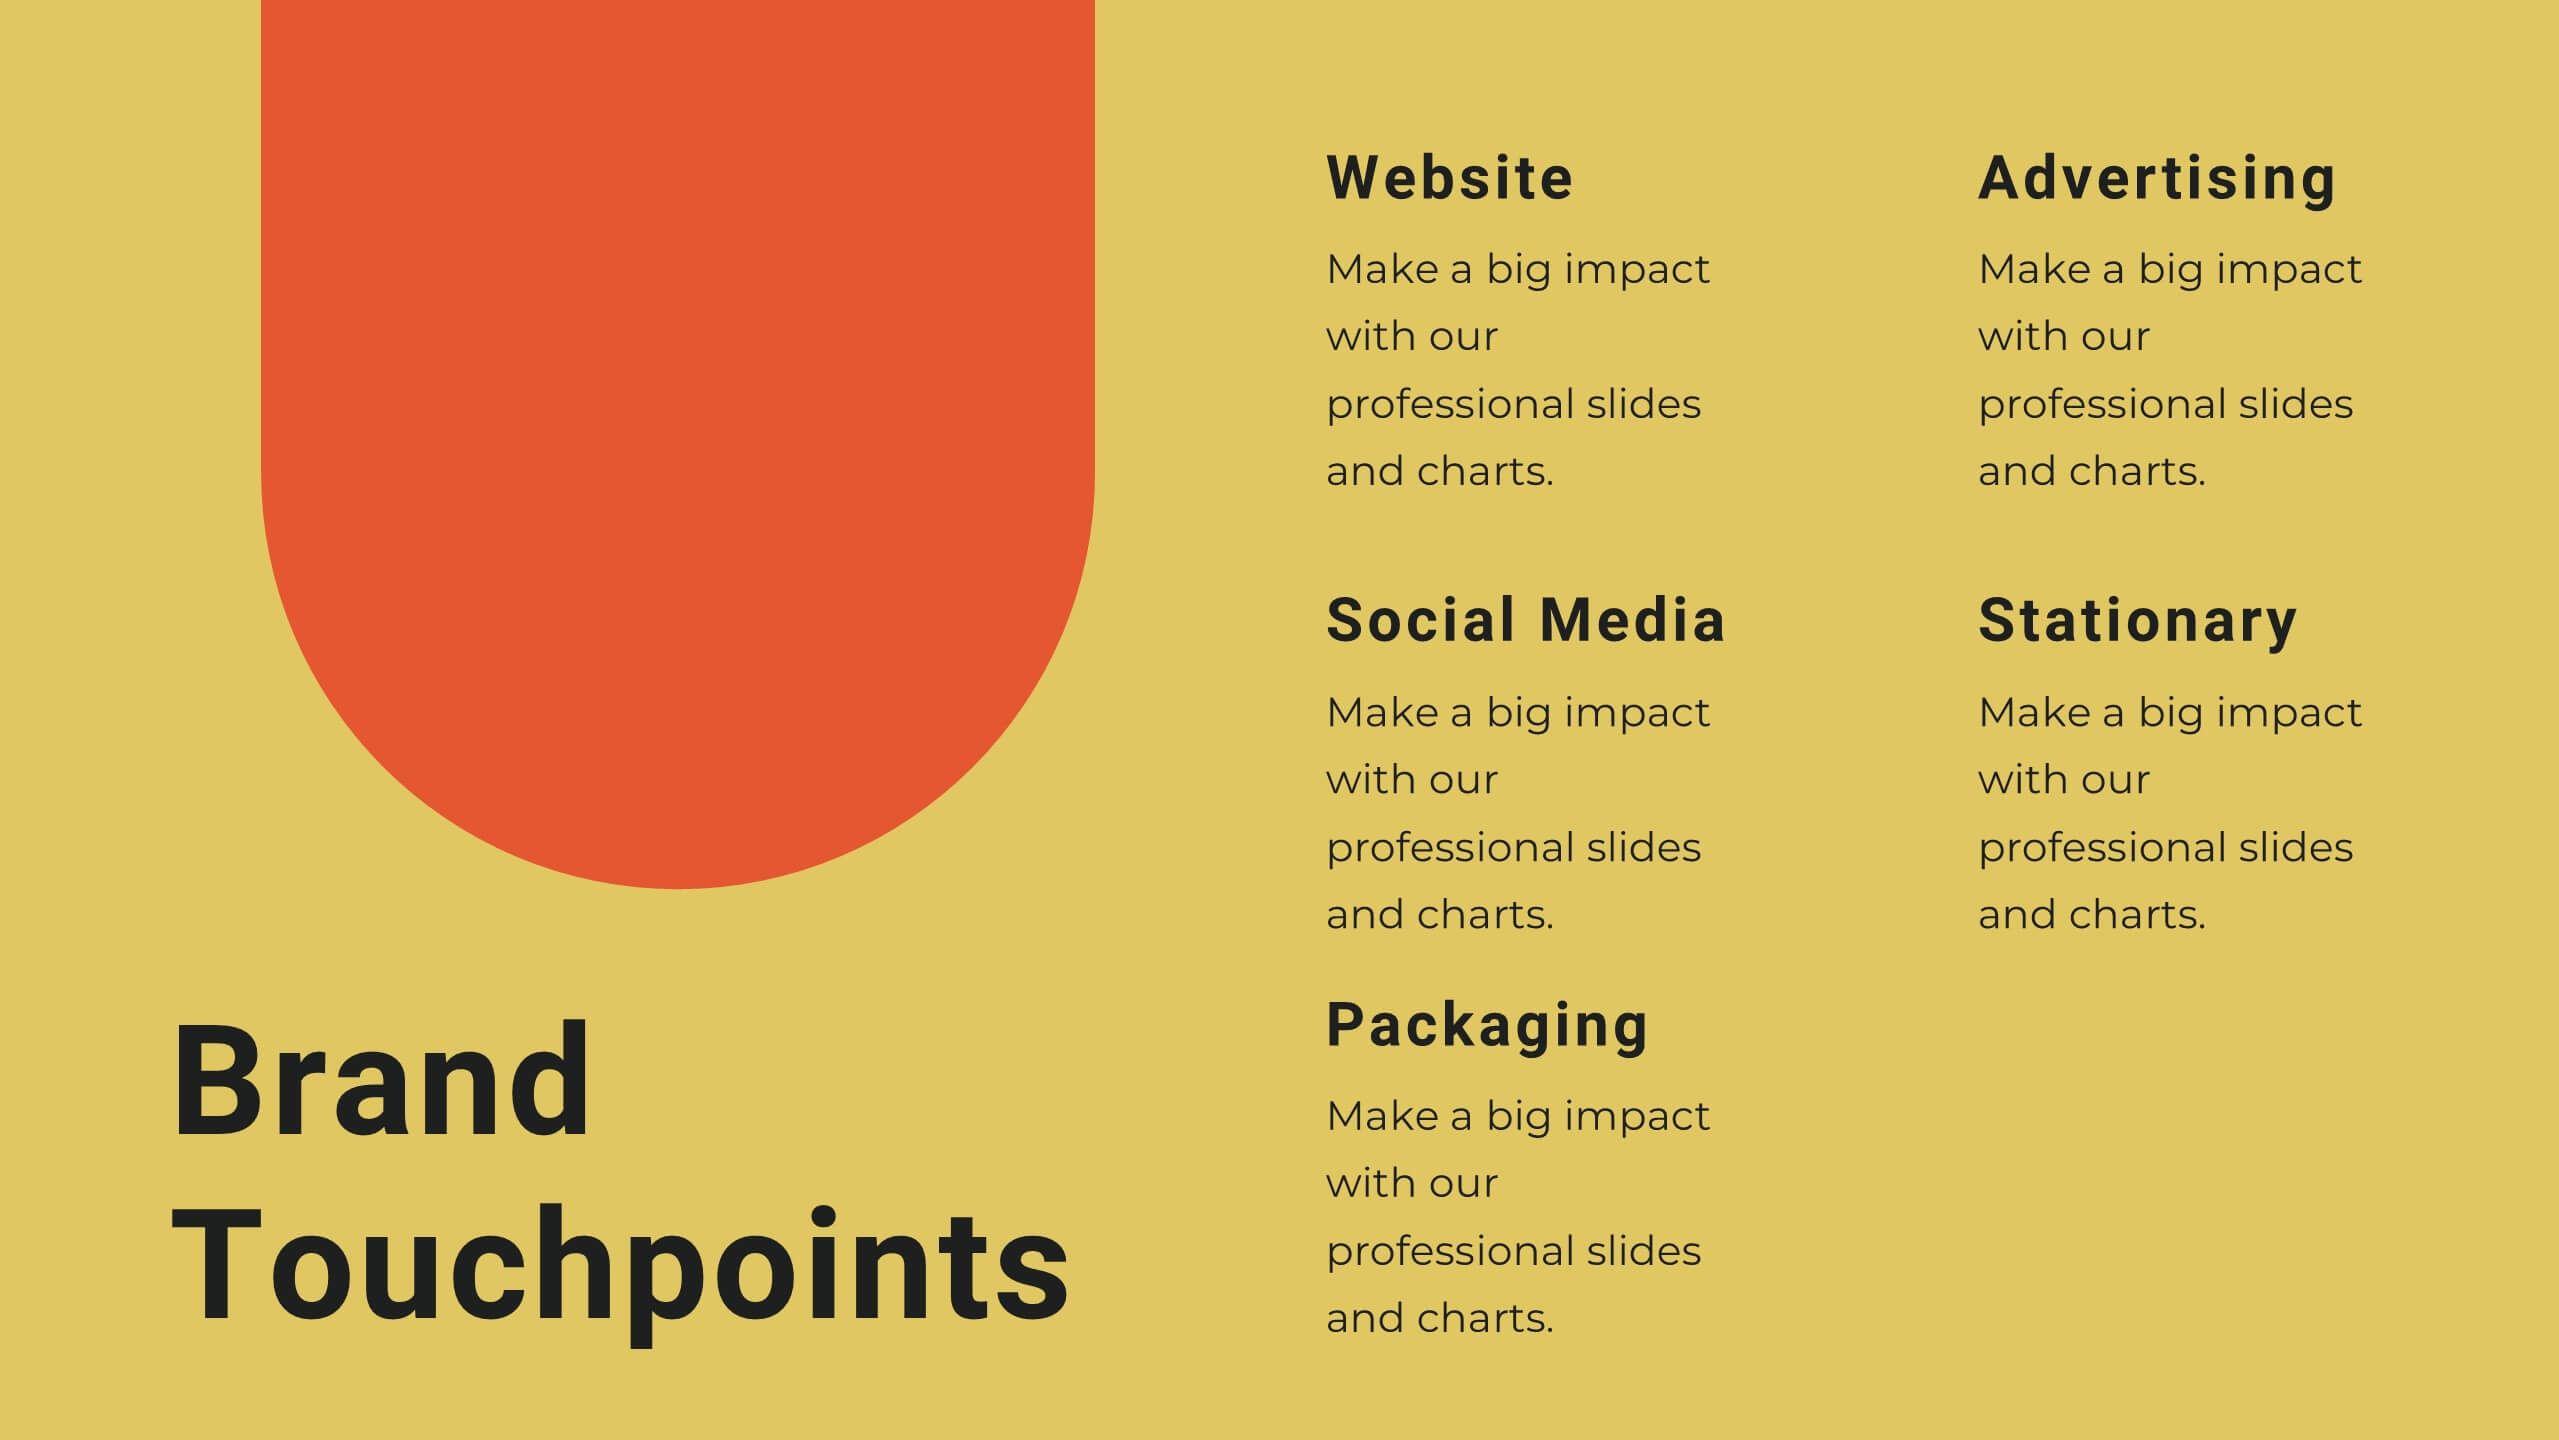
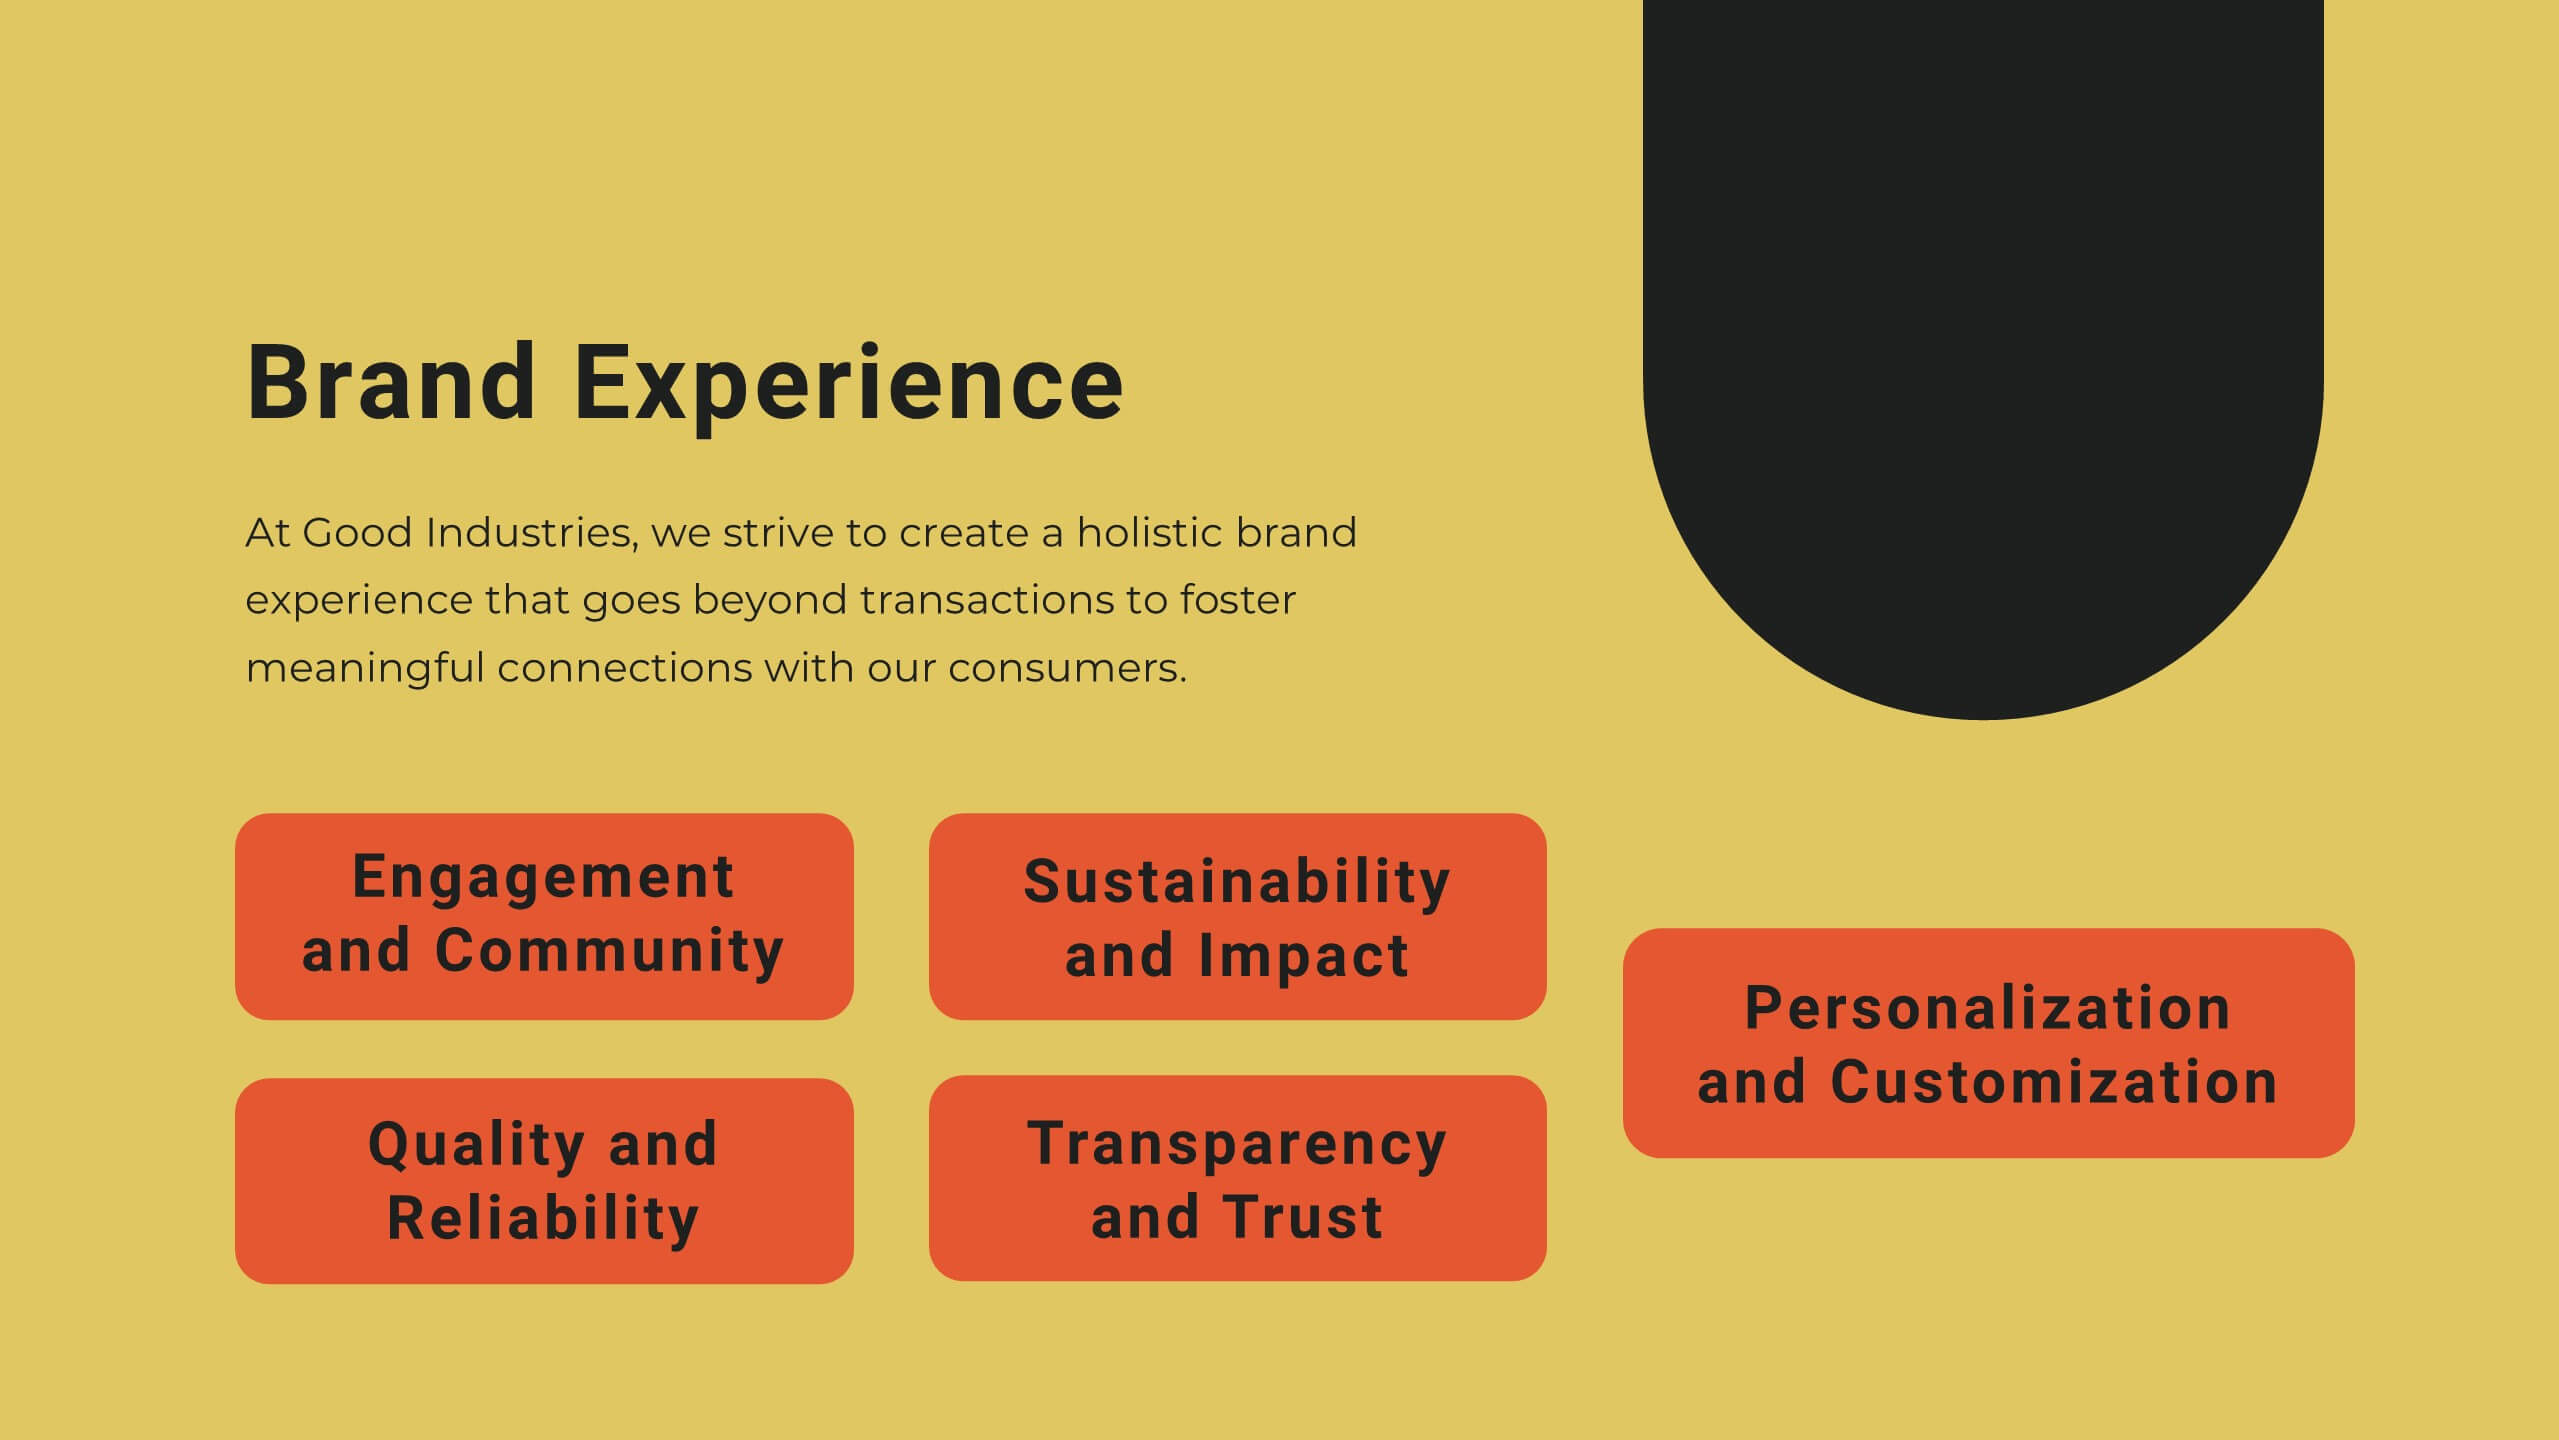
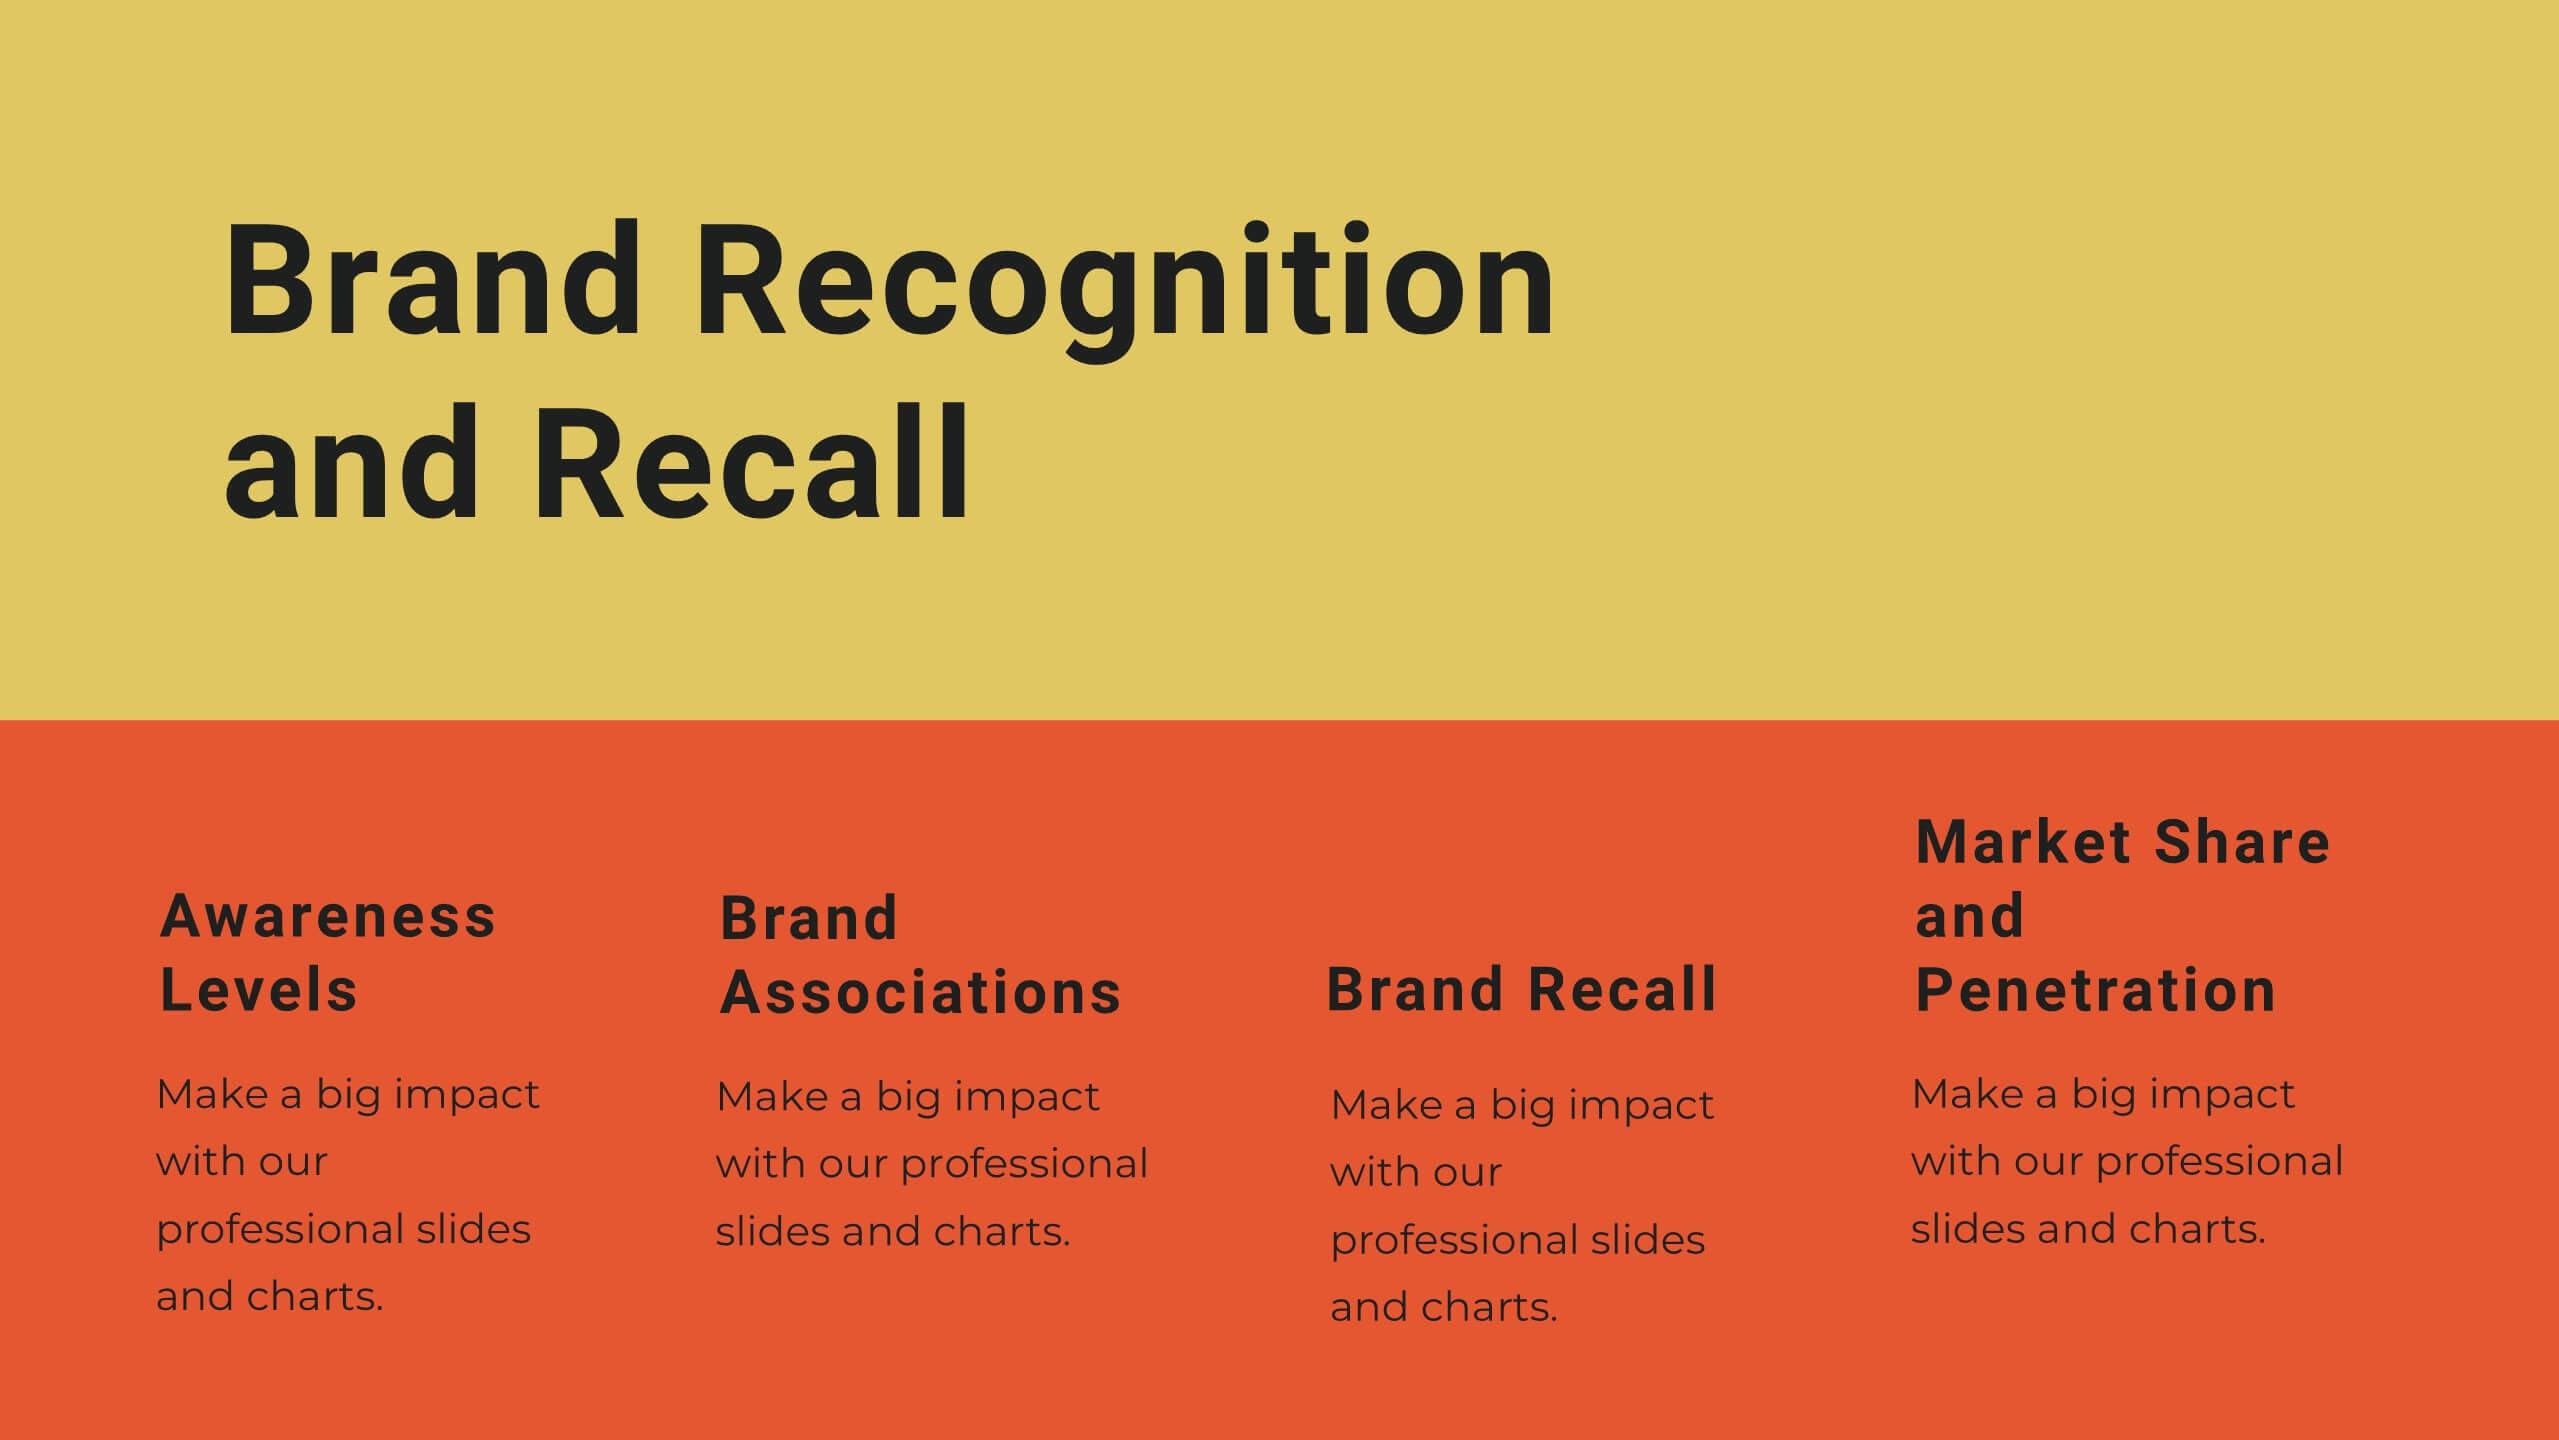
Yttrium Brand Strategy Report Presentation
Present your brand strategy with confidence using this vibrant, structured template! Covering brand identity, values, audience personas, and positioning, this template is perfect for crafting a compelling brand narrative. Fully customizable, it’s designed for seamless use in PowerPoint, Keynote, and Google Slides, making it an ideal tool for branding presentations.


7 diapositivas
Roadmap Infographic Presentation Template
A Roadmap Infographic is a visual representation of a plan or strategy for achieving a specific goal or set of goals. It includes a timeline and a series of steps or milestones that need to be accomplished in order to reach the final destination. This template is perfect for showing your plan or strategy in a fun and interactive way. This template includes lots of photo layouts and different types of charts that you can customize with your own information. Use this roadmap infographic template to show the progress of a project, the steps in a process, or the timeline for a product launch.


7 diapositivas
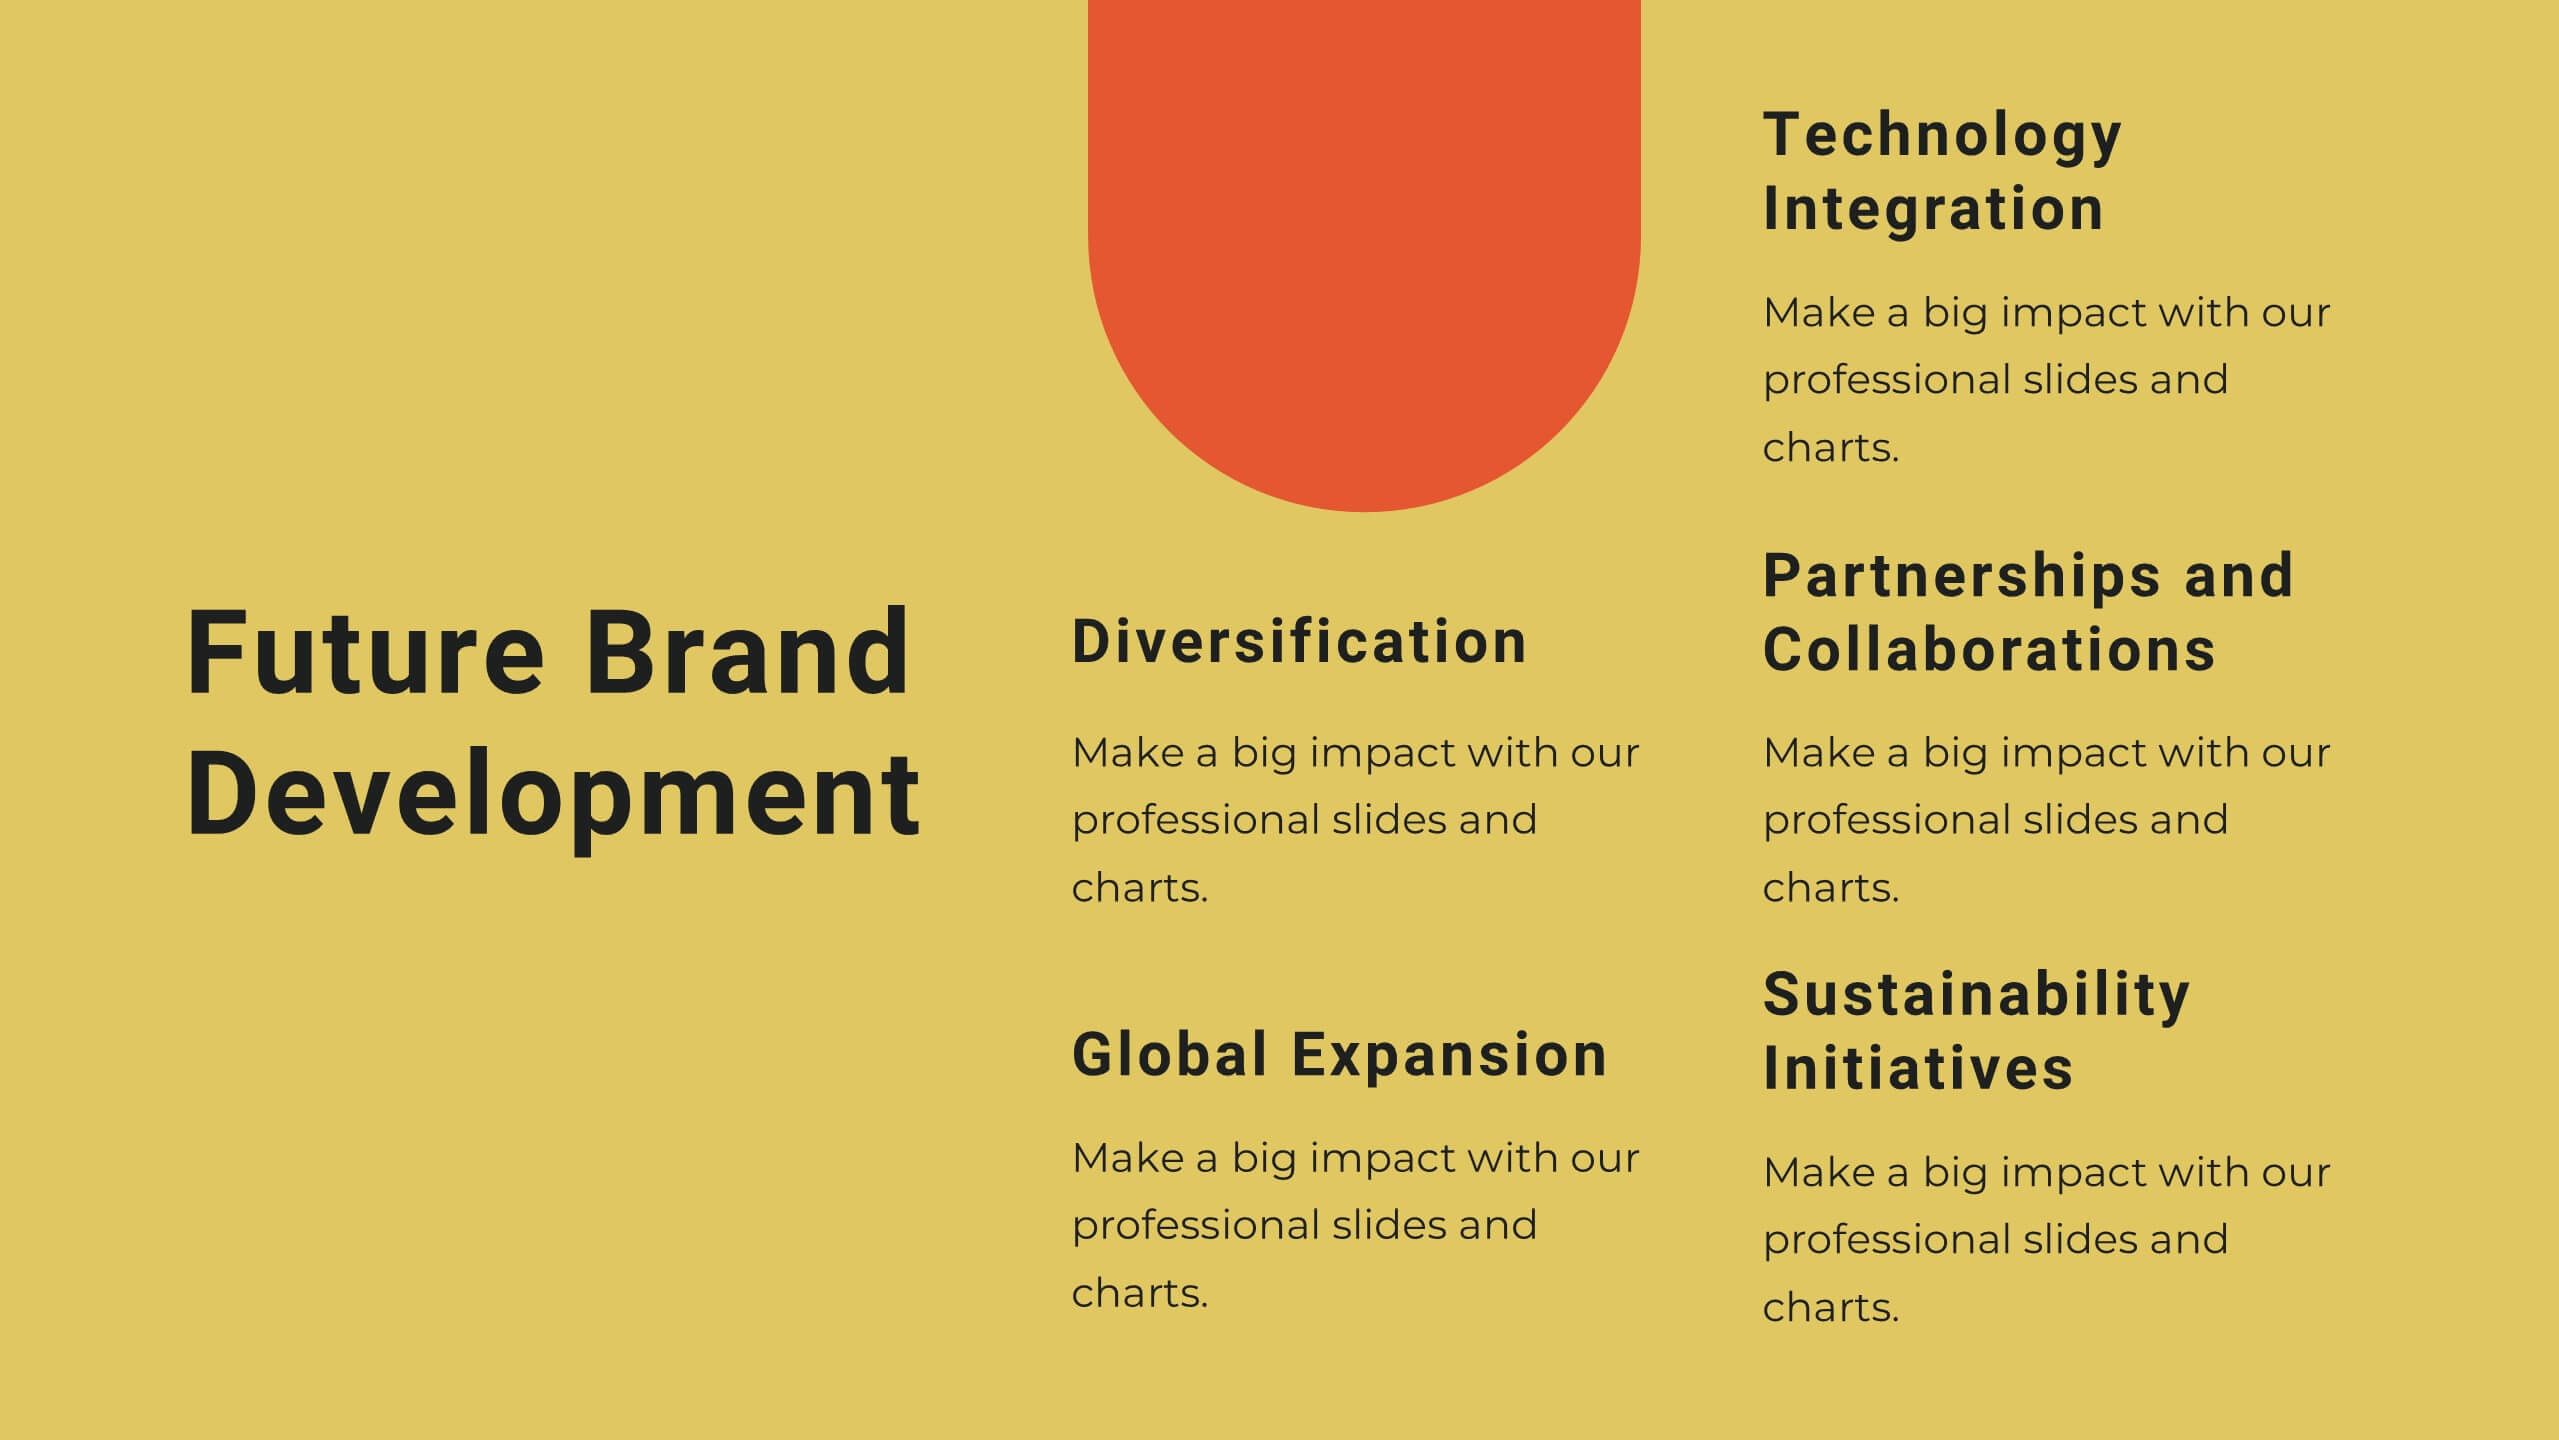
Company Vision and Future Direction
Bring your company’s future into focus with this sleek, icon-led layout designed to showcase strategic goals, values, and long-term vision. Perfect for leadership presentations, investor updates, or team briefings, this slide turns abstract direction into a clear path forward. Fully compatible with PowerPoint, Keynote, and Google Slides.


6 diapositivas
Target Market Analysis Infographics
Present your target market analysis with our vibrant and professional infographic template. Tailored for PowerPoint, Keynote, and Google Slides, this template is an ideal choice for marketers, business analysts, and entrepreneurs who aim to communicate their market insights effectively. The design of this template is focused on showcasing market demographics, consumer behaviors, and segmentation in a visually compelling manner. Its modern layout and vibrant color scheme are crafted to capture attention while maintaining a professional tone. This makes it perfect for presentations that need to convey complex market data in an understandable and engaging way. What sets this template apart is its versatility and ease of use. It allows you to highlight key aspects of your target market analysis, from demographic breakdowns to consumer preferences. Whether you're presenting to stakeholders, team members, or at a conference, this infographic template will help you deliver your message with impact and clarity.


5 diapositivas
Body System Overview Presentation
Visually explain key human body systems with this clean and modern slide. Each section highlights a different organ with labeled points (A–D) for easy reference. Ideal for health education, medical briefings, or anatomy lessons. Fully editable in PowerPoint, Keynote, or Google Slides to suit any professional or academic need.


6 diapositivas
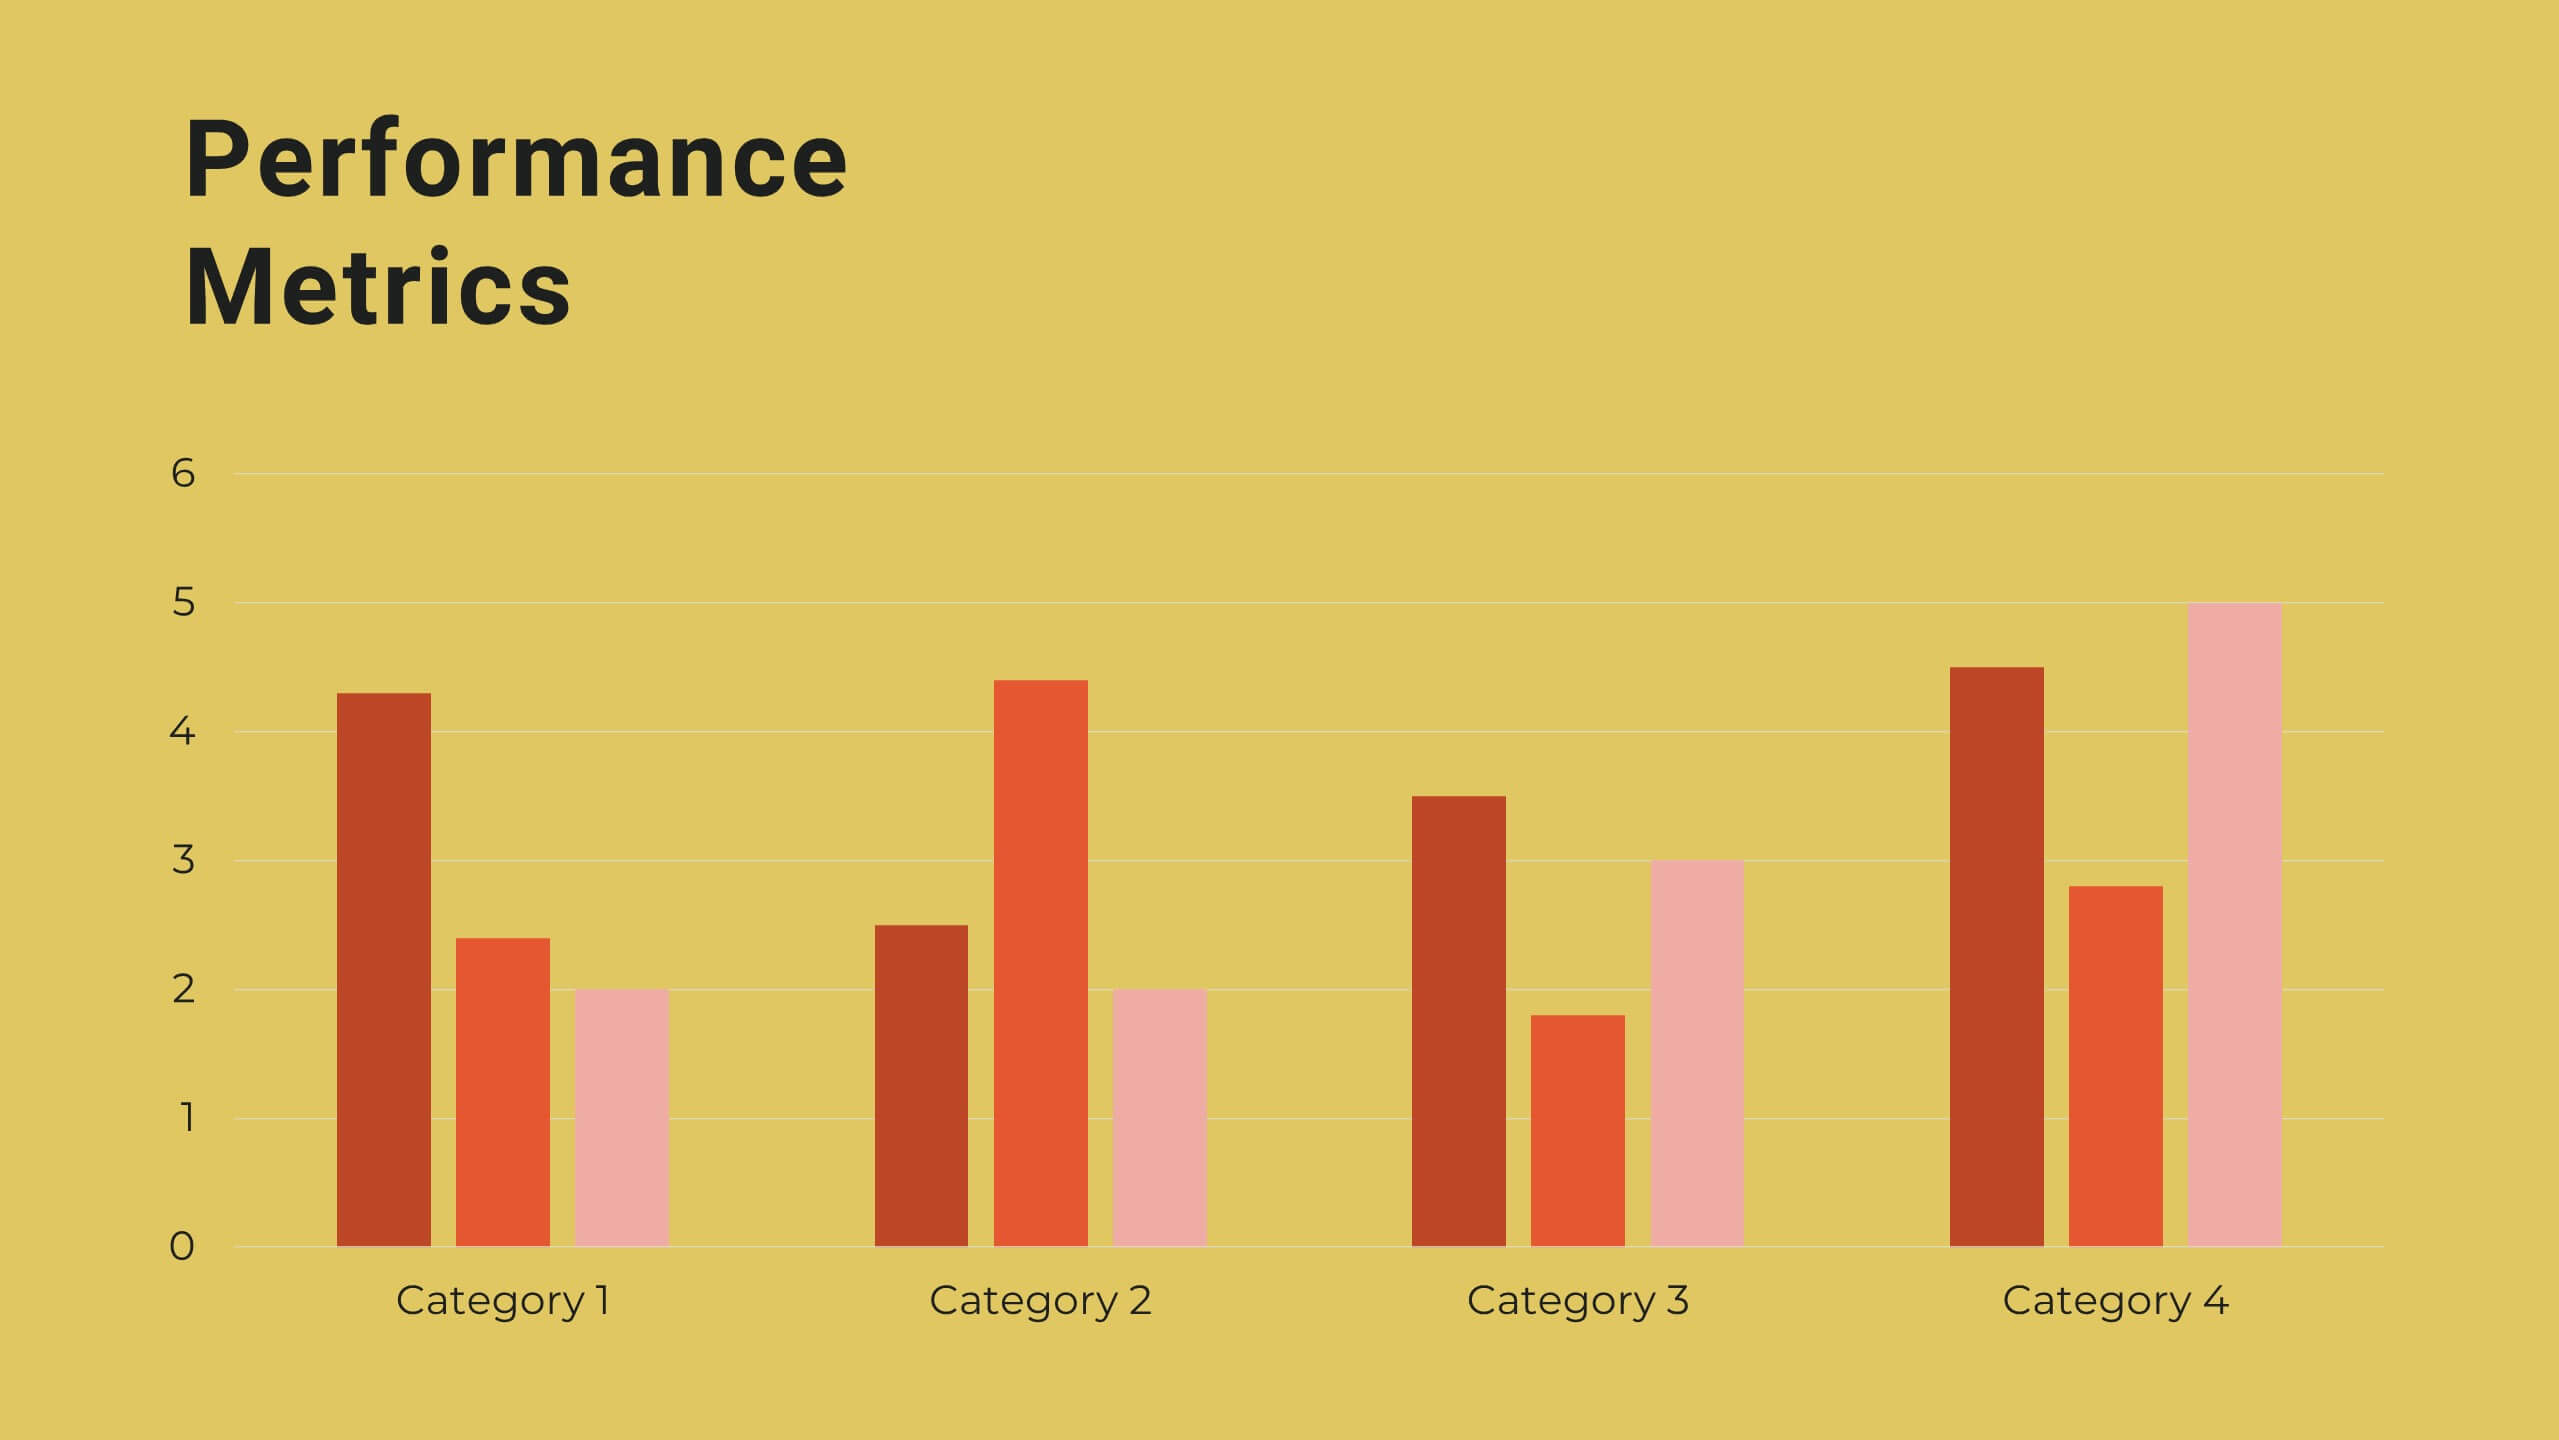
3D Infographic Design
Visualize data like never before with this bold 3D block diagram layout. Designed to break down complex figures into three key segments, it’s perfect for presenting percentages, growth areas, or metric comparisons. Easily editable in PowerPoint, Keynote, and Google Slides.


22 diapositivas
Metaphor Advertising Agency Proposal Presentation
The Advertising Agency Proposal Presentation Template offers a polished structure to present your agency's expertise. With slides covering mission, case studies, services, and market analysis, it’s designed to leave a lasting impression. Perfect for securing new clients, it’s fully editable and works seamlessly with PowerPoint, Keynote, and Google Slides.


10 diapositivas
Post-Pandemic Business Strategy Presentation
Help your team adapt to the new normal with this sleek and professional slide layout. Featuring a sanitizer bottle graphic as a central metaphor, the design visually supports your content on strategic recovery, operational safety, or workflow changes. Includes four editable text sections, each with modern icons. Ideal for HR, leadership updates, or business continuity plans. Compatible with PowerPoint, Keynote, and Google Slides.


4 diapositivas
Project Proposal Executive Summary Presentation
Optimize your project presentations with the 'Project Proposal Executive Summary' template. Crafted to clearly showcase your project’s most crucial elements, this template uses visuals and concise text to highlight objectives and deliverables effectively. Ideal for professionals preparing proposals in PowerPoint, Keynote, or Google Slides.


3 diapositivas
Transportation Services Workflow Presentation
Showcase your delivery process with clarity. This template tracks each transportation step—from port to truck to doorstep—with minimal, modern visuals and editable callouts. It’s perfect for workflow overviews, operations planning, or client onboarding. Use it in PowerPoint, Keynote, or Google Slides without losing style or structure.


4 diapositivas
Goal-Oriented 30 60 90 Plan Outline Presentation
Make your first impression unforgettable with this bold, easy-to-follow layout that breaks down goals into manageable steps. A 30-60-90 plan helps teams and new hires align on expectations, outcomes, and milestones. Perfect for onboarding or strategic planning. Fully editable in PowerPoint, Keynote, and Google Slides for maximum compatibility.


6 diapositivas
Letter Recognition and Phonics Training Presentation
Make early learning visual and interactive with this clean, A-to-F phonics layout. Each letter icon is paired with editable text for sound associations, learning milestones, or steps in a language program. Great for educators, speech therapists, or early childhood presentations. Fully editable in PowerPoint, Keynote, and Google Slides.


5 diapositivas
Fitness Trainings Infographics
Fitness Training refers to structured physical activities or exercises designed to improve and maintain physical fitness, overall health, and athletic performance. Using these infographic templates, you can effectively educate your audience about different fitness training techniques, inspire them to adopt a healthy and active lifestyle, and provide them with practical tips and guidance for their fitness journey. These are designed to showcase various fitness training concepts, techniques, and tips. Whether you're a fitness instructor, personal trainer, or fitness enthusiast, this template is a valuable resource to educate and motivate your audience about fitness training.