
Características


¿Tienes alguna pregunta?
Recomendar


6 diapositivas
Pathway and Options Framework Analysis Presentation
Navigate your business strategy with clarity using the Pathway and Options Framework Analysis Presentation. This slide features a horizontal hexagon progression that visually maps out five distinct stages or decision points. Ideal for illustrating phased development, strategic alternatives, or milestone-based planning. Each segment includes an icon and customizable title area for key data points. Use this clean, modern layout to engage stakeholders or clarify complex processes. Fully editable in PowerPoint, Keynote, and Google Slides.


6 diapositivas
Job Progress Infographics
Track and communicate job progress effectively with our Job Progress infographic template. This template is fully compatible with popular presentation software like PowerPoint, Keynote, and Google Slides, allowing you to easily customize it to illustrate and communicate key milestones, accomplishments, and the status of your projects or tasks. The Job Progress infographic template offers a visually engaging platform to depict the progress of your work, whether it's a project, assignment, or task. Whether you're a project manager, team leader, or anyone looking to showcase your achievements, this template provides a user-friendly canvas to create informative presentations and progress reports. Optimize your job progress tracking with this SEO-optimized Job Progress infographic template, thoughtfully designed for clarity and ease of use. Customize it to showcase project timelines, completion percentages, key accomplishments, and future goals, ensuring that your audience gains a comprehensive understanding of your progress and achievements. Start crafting your personalized infographic today to effectively communicate your job progress.


4 diapositivas
Customer Feedback Report Presentation
Transform audience insights into actionable strategies with this clean, data-focused presentation. Designed to highlight customer satisfaction trends, improvement areas, and feedback analysis, it helps visualize complex information with clarity and flow. Fully customizable and compatible with PowerPoint, Keynote, and Google Slides for a polished, professional, and presentation-ready report.


7 diapositivas
Simple Schedule Infographic
Effortlessly structure your time with our simple schedule infographic. Rendered in a clean white canvas, enhanced with dependable blue tones and anchored with timeless black, our template is the epitome of clarity and organization. Equipped with streamlined infographics, universal icons, and adaptable image placeholders, it facilitates easy time management and daily planning. Seamlessly tailored for Powerpoint, Keynote, or Google Slides. A fundamental tool for project managers, event planners, educators, or any professional aiming to efficiently allocate their time. Plan with ease; let every slide bring order to your daily chaos.

22 diapositivas
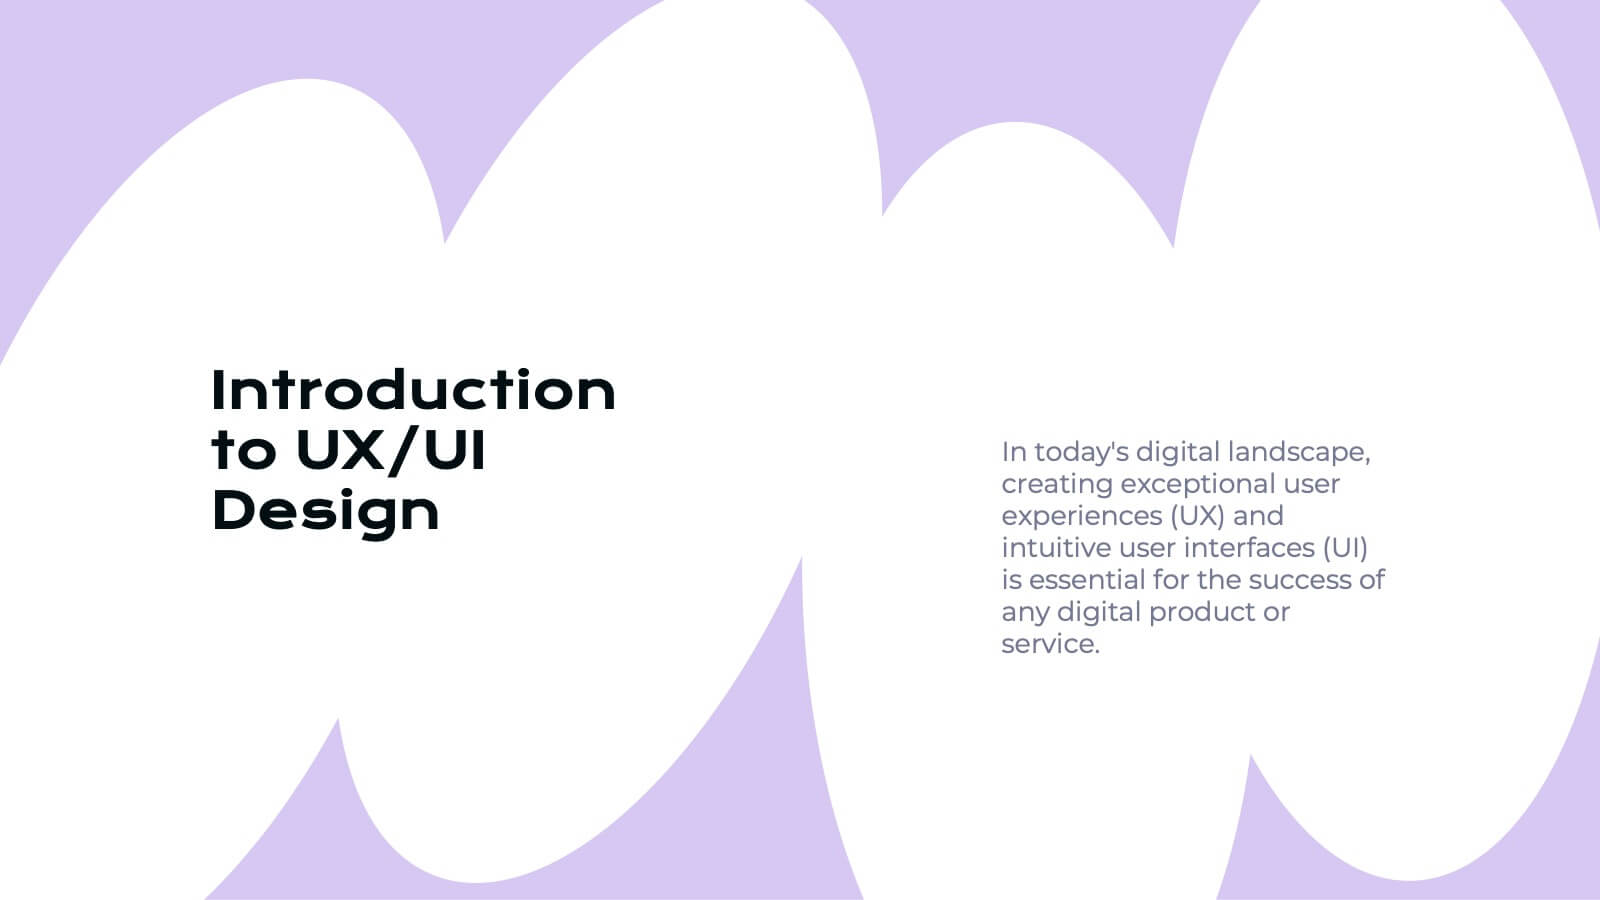
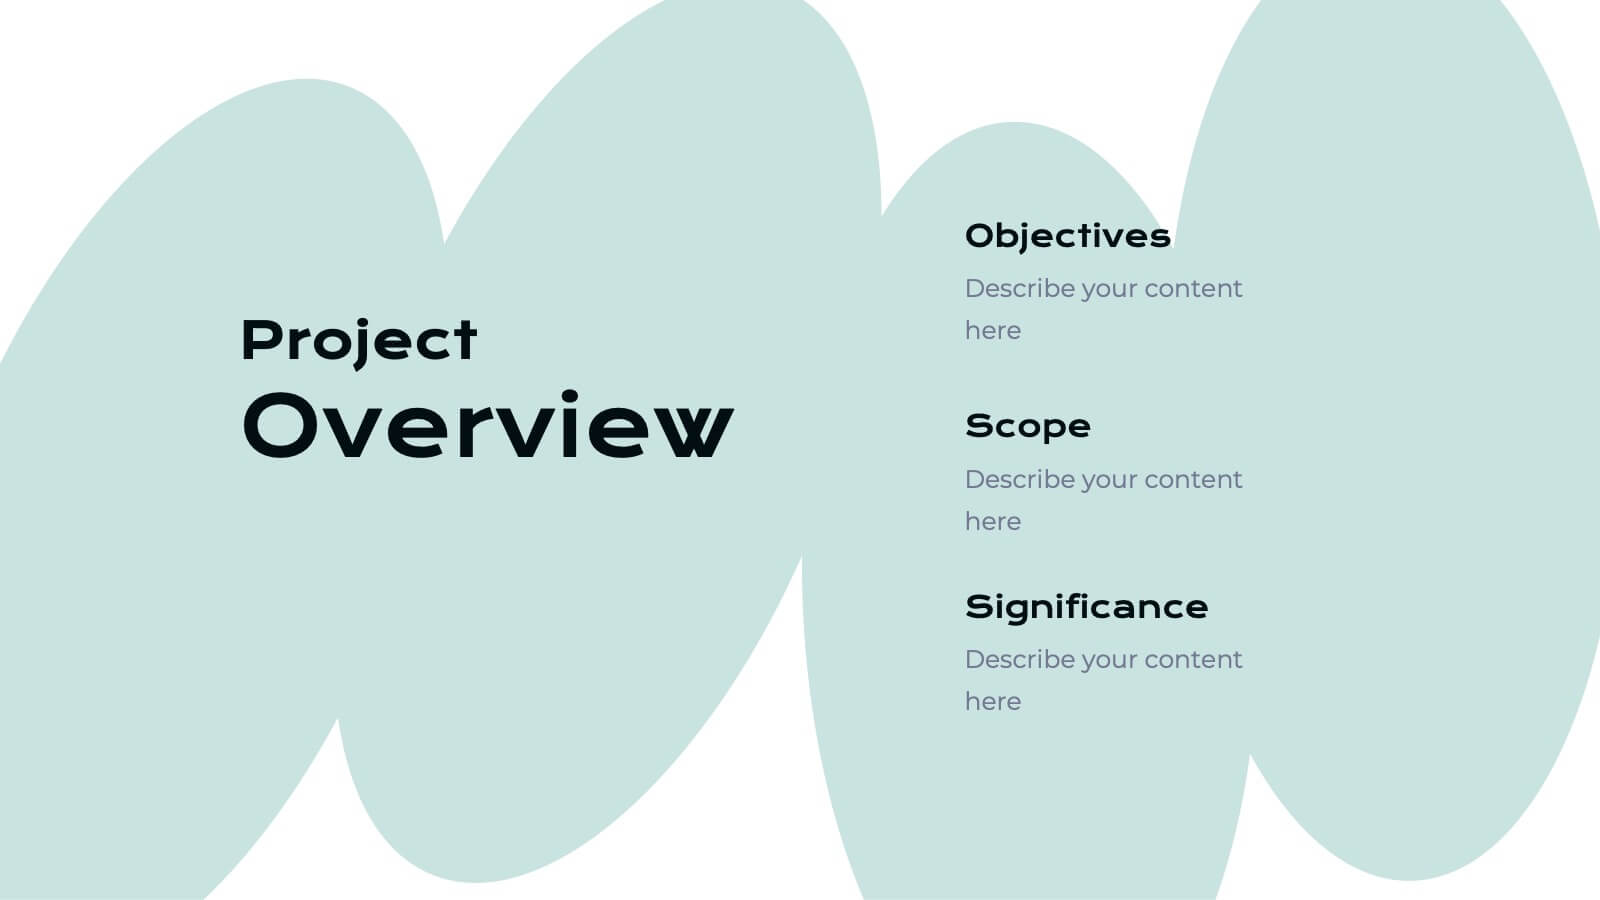
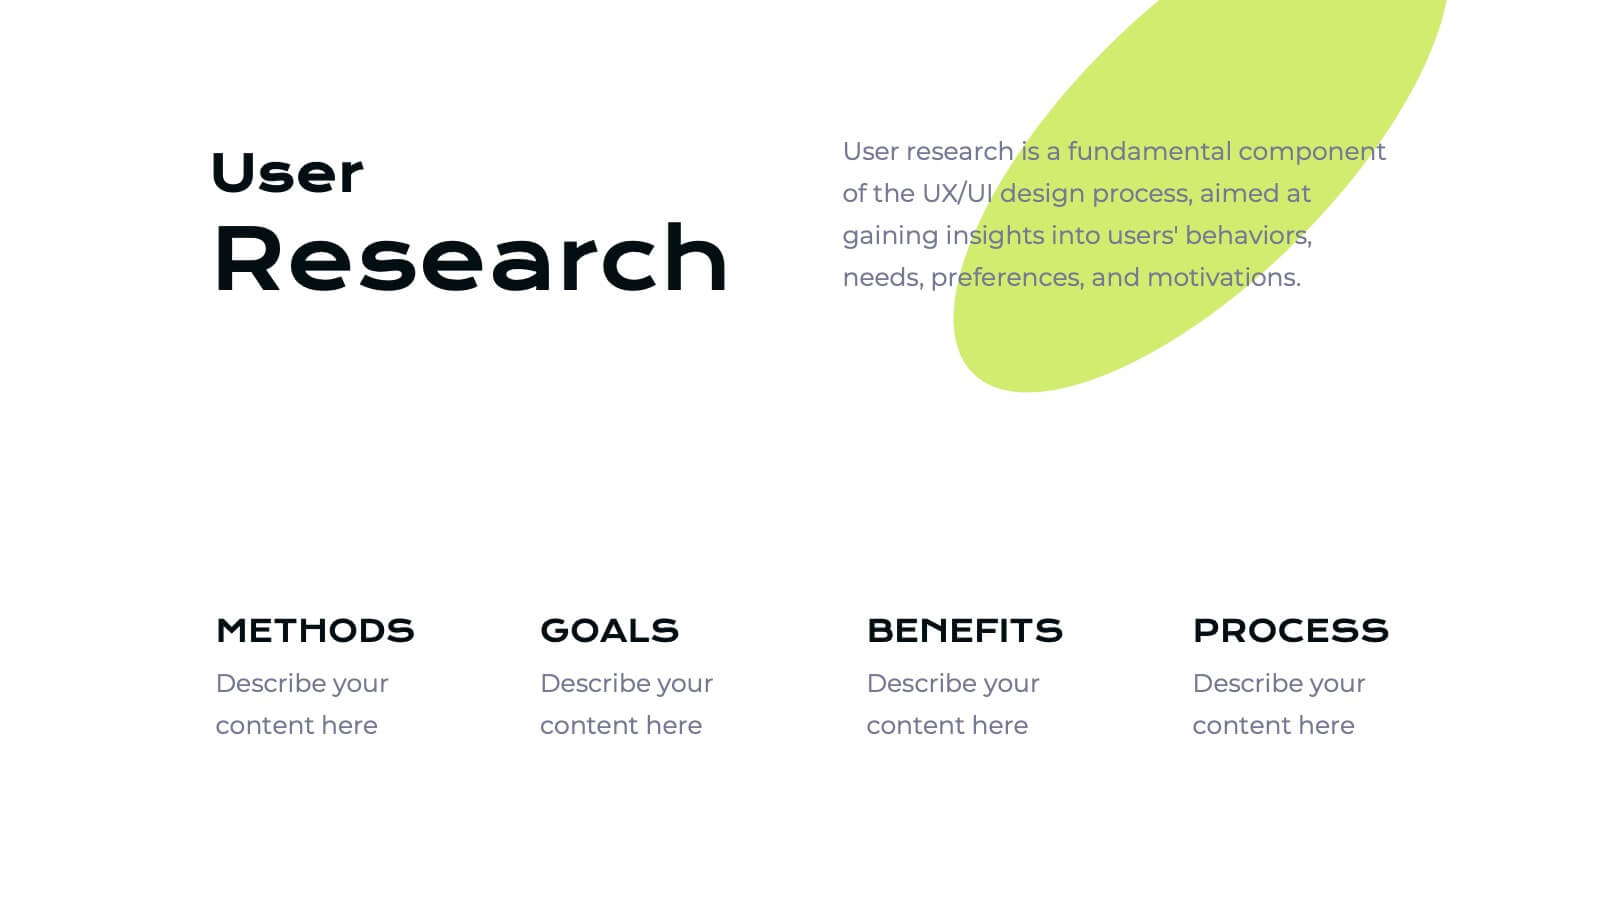
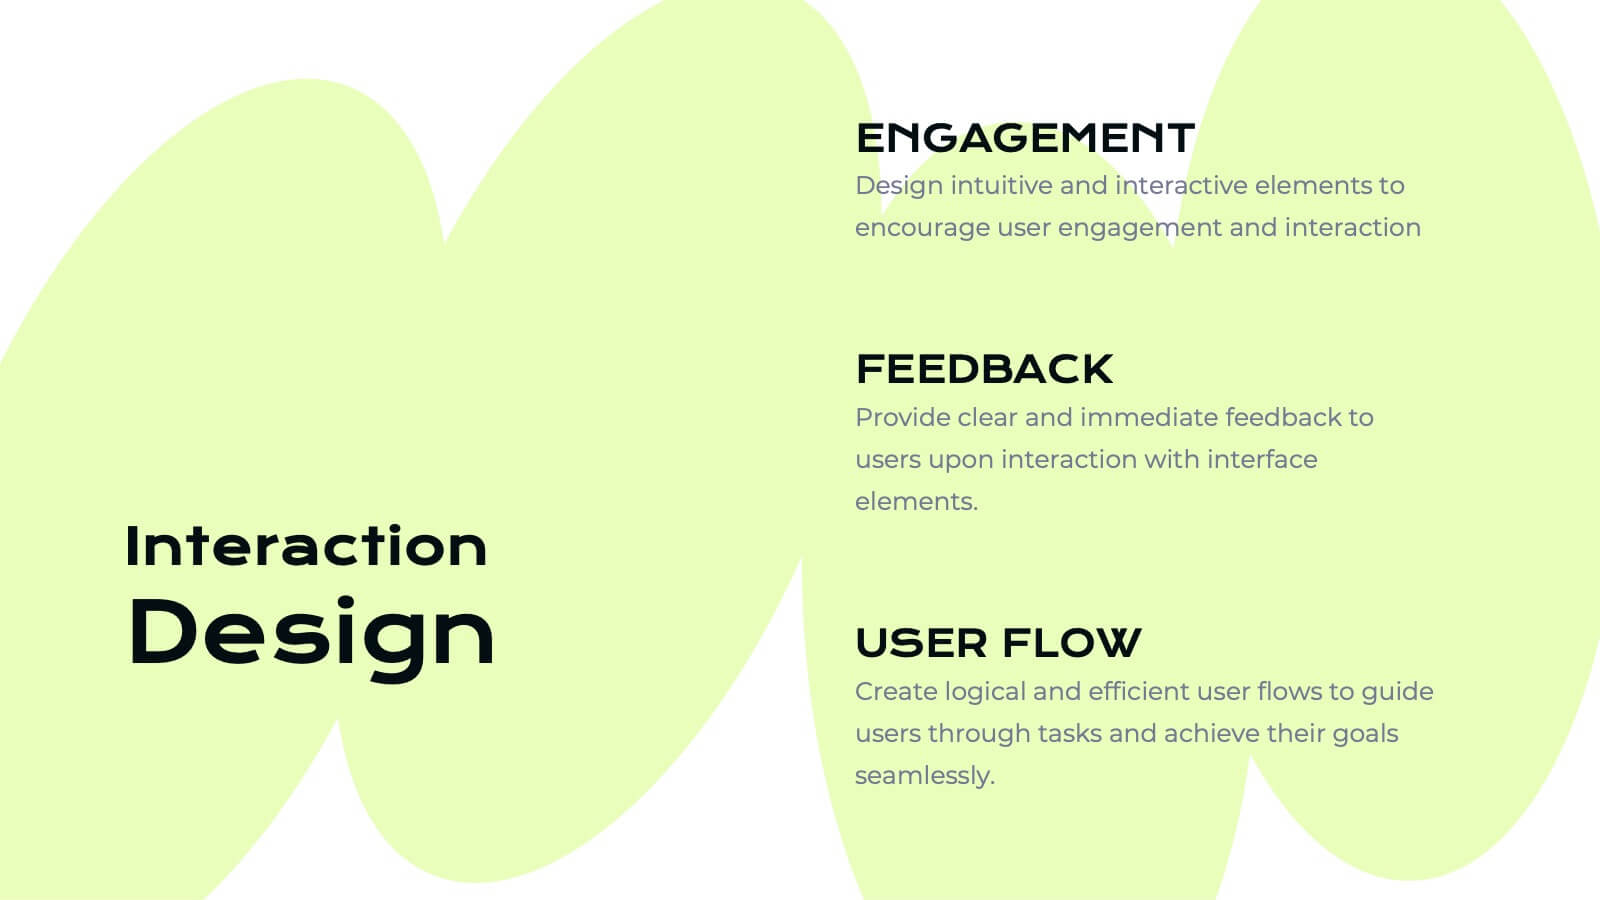
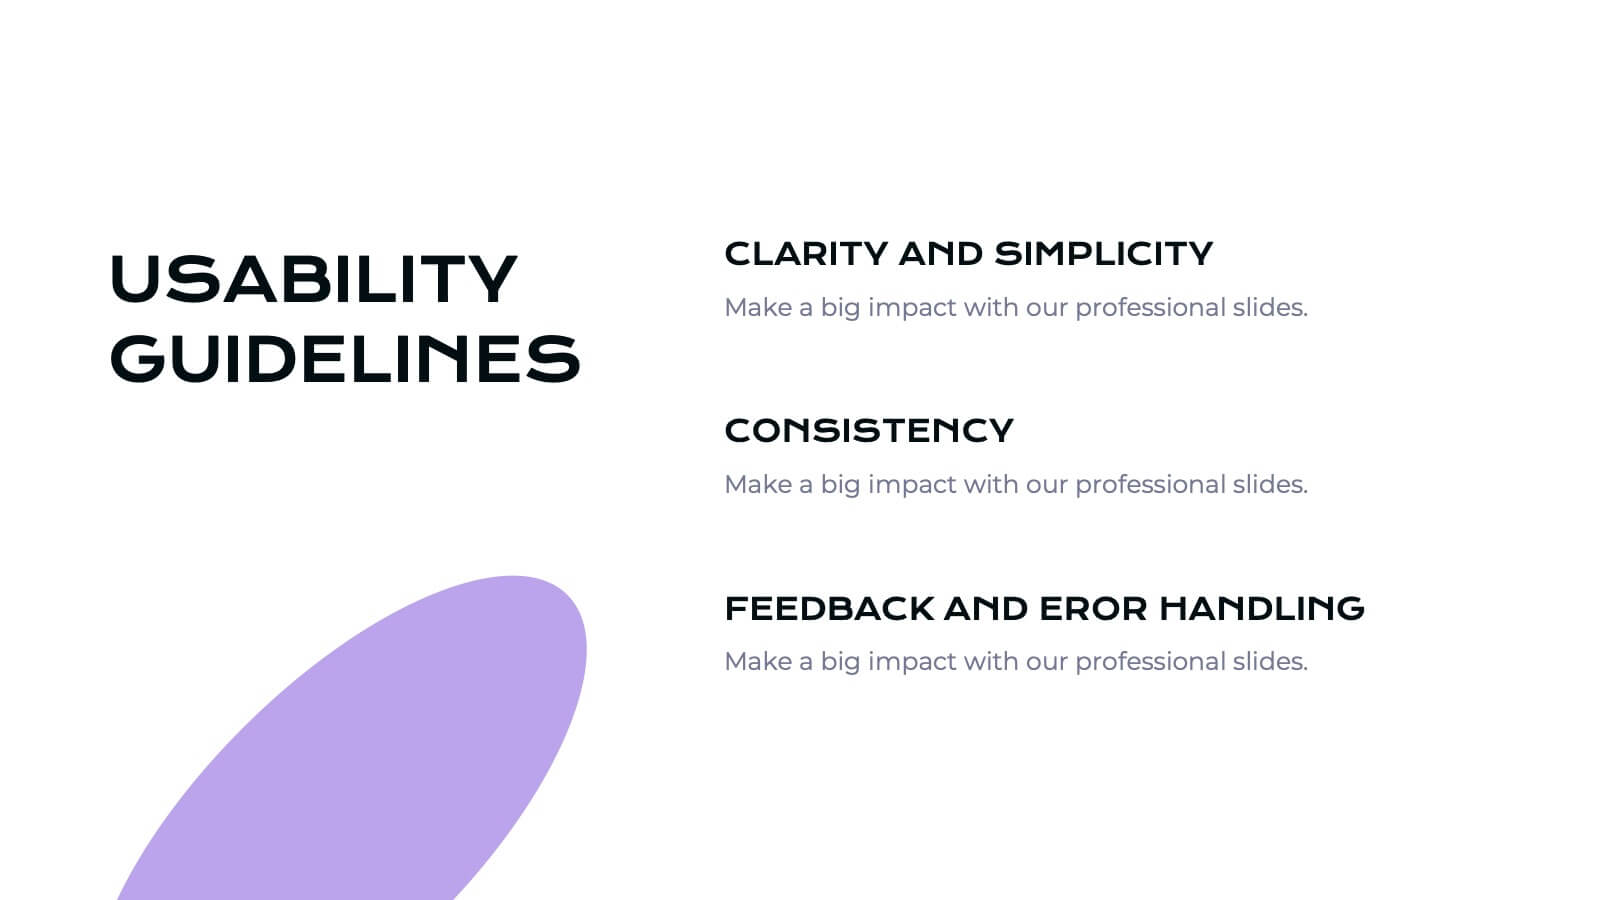
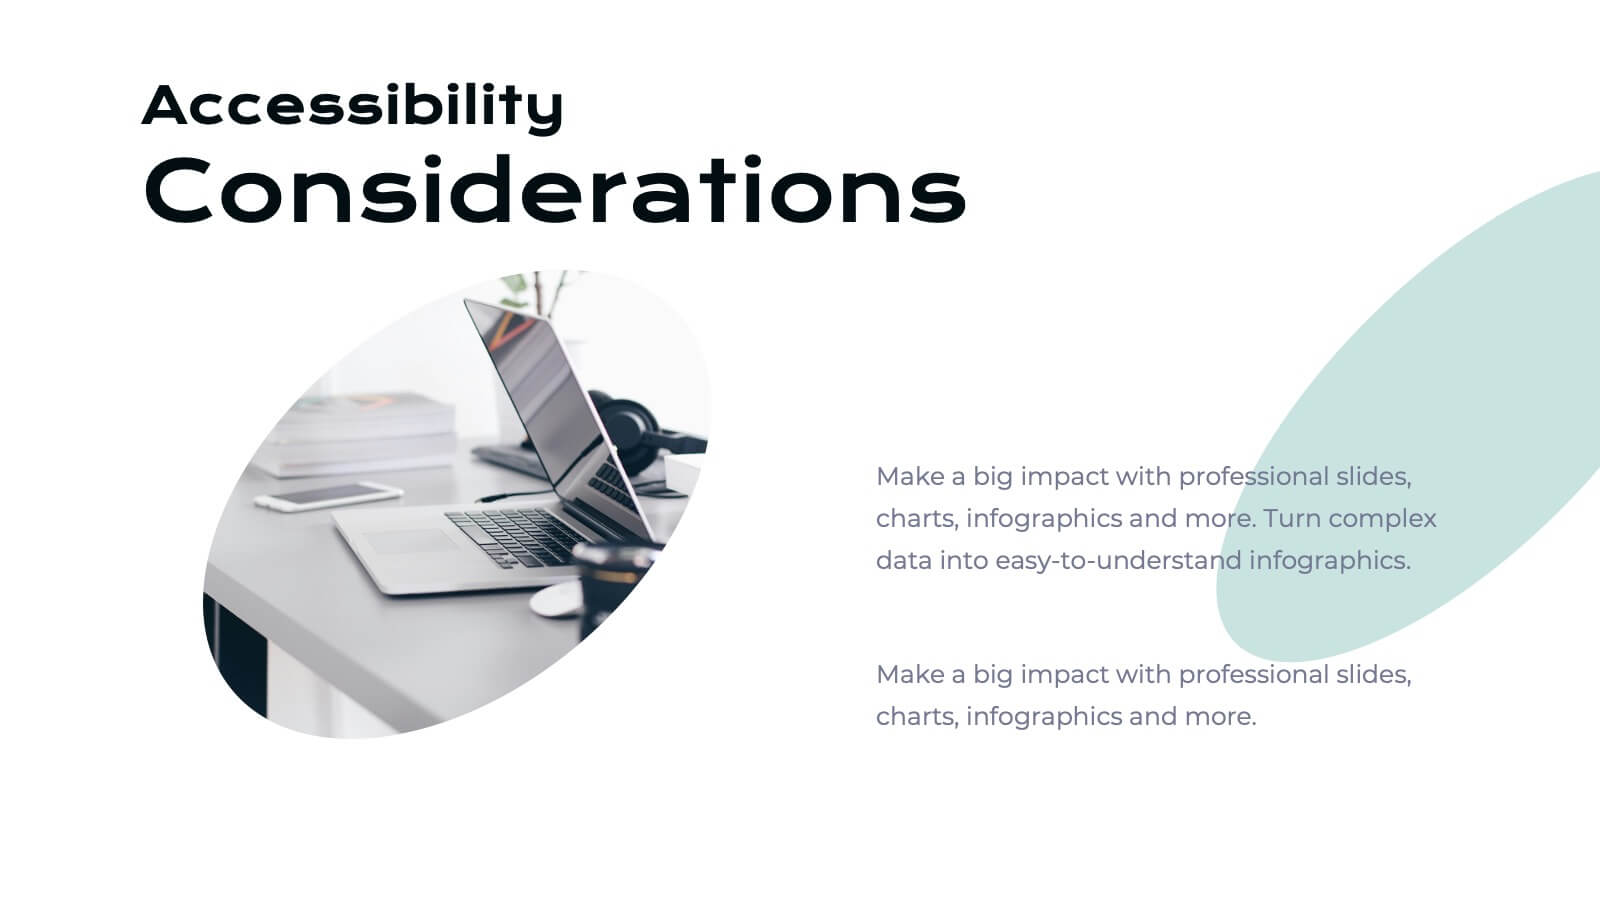
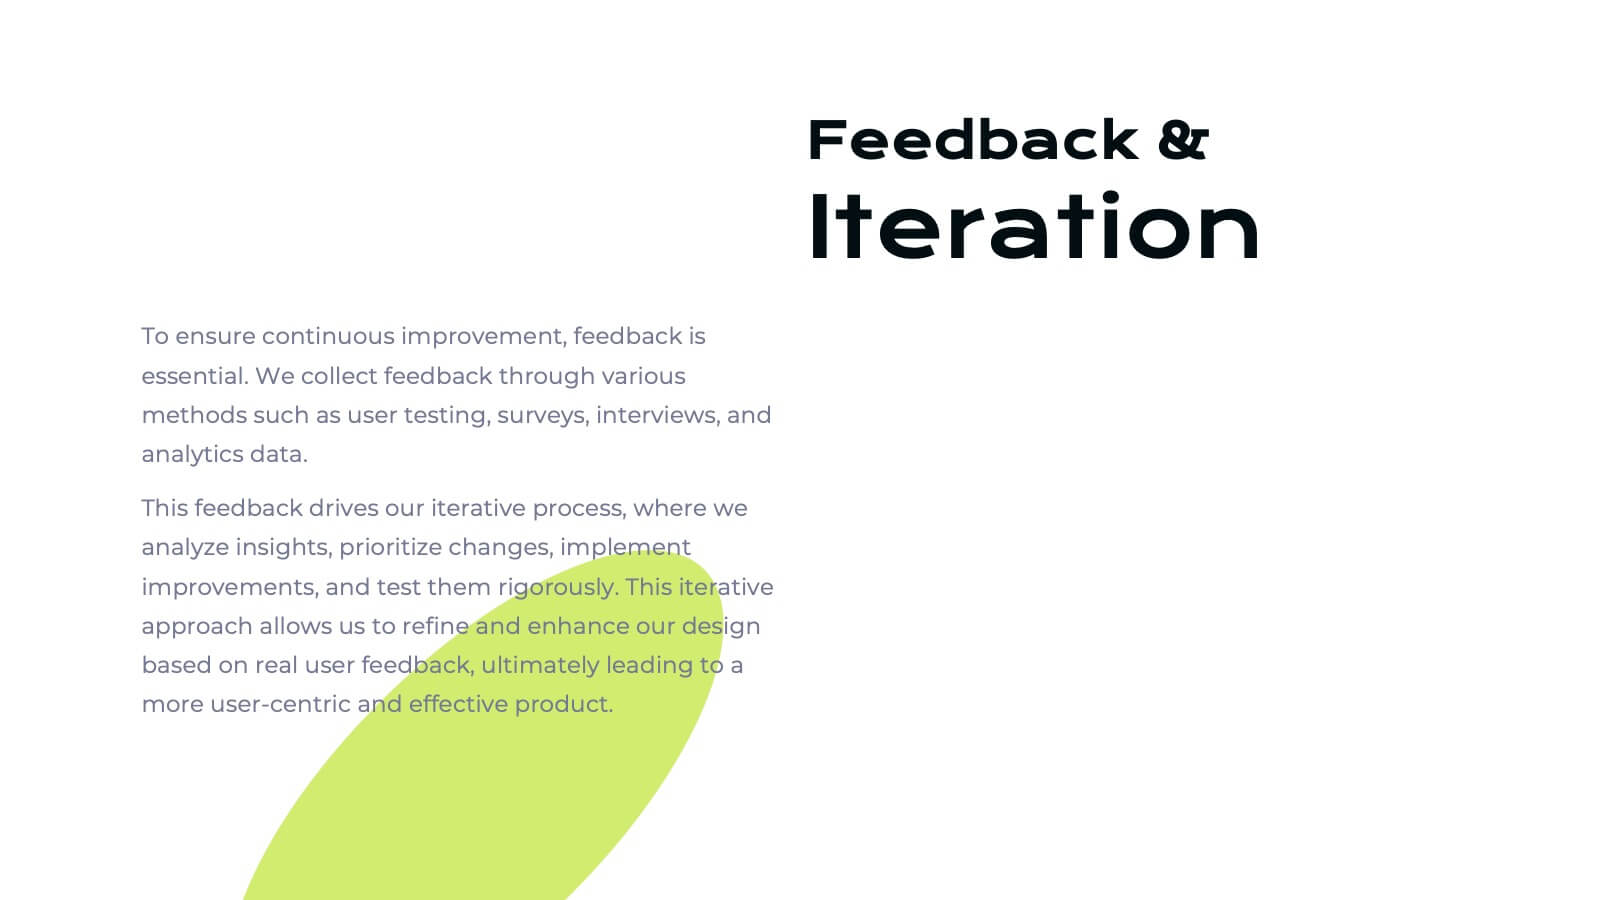
Ifrit User Experience Proposal Presentation
Unleash the power of great design with this fiery Ifrit-inspired presentation, perfect for delivering your user experience proposal! This template lets you showcase your UX strategies, research, and design process in a visually striking and well-organized format. Impress stakeholders with every slide. Compatible with PowerPoint, Keynote, and Google Slides.


4 diapositivas
Effective Team Management Presentation
Present your management insights with clarity using this puzzle-style Effective Team Management template. Ideal for breaking down leadership functions, collaboration elements, or role responsibilities across four segments. The modular puzzle format adds a creative visual touch while staying professional. Fully editable in PowerPoint, Keynote, and Google Slides.


6 diapositivas
Buyer Behavior Trends Infographic
Unlock the secrets of consumer psychology with our Buyer Behavior Trends Infographic Template. This template offers a compelling visual exploration of modern consumer trends, designed to capture and convey the nuances of buyer behavior in today’s fast-paced market. Featuring a sleek, modern design, each slide is tailored to present data effectively, from spending habits and brand loyalty to digital consumption and decision-making processes. Use this template to illustrate the underlying factors that influence consumer choices and how these trends shape the future of marketing. Perfect for marketers, researchers, and business strategists, this template allows you to customize layouts, colors, and fonts to align with your brand or study focus. It's an invaluable tool for presentations, reports, and digital content, helping you to communicate complex data in an accessible and engaging way.


7 diapositivas
Customer Profile Marketing Infographic
Illuminate your marketing strategy with our finely-tuned customer profile marketing infographic. Bathed in the clarity of white, the trust of blue, the optimism of yellow, and the zest of orange, our template provides a vibrant palette to showcase diverse customer personas. Detailed with insightful infographics, expressive icons, and adaptable image placeholders, it deciphers intricate customer data into an actionable marketing narrative. Exquisitely designed for Powerpoint, Keynote, or Google Slides. A must-have tool for marketers, sales strategists, and businesses looking to tailor their approach to different customer segments. Engage effectively; let every slide refine your audience understanding.


4 diapositivas
Step-by-Step Process Flowchart Presentation
Simplify complex workflows with this Step-by-Step Process Flowchart presentation. Designed for clarity and structure, this layout guides your audience through each phase of a process using visual arrows and color-coded stages. Ideal for operations, planning, or training. Fully editable in Canva, PowerPoint, and Google Slides.


2 diapositivas
Creative Business Presentation
Showcase your ideas with energy and style using this bold, contemporary presentation layout. Featuring dynamic visuals and clean typography, this template is ideal for business proposals, portfolios, and startup pitches. Easily customizable in PowerPoint, Keynote, and Google Slides to suit your brand's identity.


5 diapositivas
Corporate Teamwork Presentation
The "Corporate Teamwork" presentation template visually captures the interconnectivity of team roles and tasks. Each slide features a circular flow diagram with icons representing different aspects of business teamwork. The dynamic arrangement of the icons around the central circle helps illustrate the cyclical nature of team processes and collaboration. This template allows for customization with text and color coding, making it easy to adapt to specific corporate environments or team structures. It's a great tool for presentations aimed at enhancing teamwork strategies or demonstrating the flow of tasks within team settings.


26 diapositivas
The Rise of Smart Cities Presentation
This presentation template is dedicated to urban developers, technology enthusiasts, and policy makers interested in the advancement of smart cities. The template serves as a deep dive into the integration of technology within urban settings to boost sustainability, efficiency, and quality of life. It is designed with a sleek, modern aesthetic, using a color palette that reflects innovation and modernity, which makes it visually appealing and easy to navigate. The content is structured to demystify complex concepts about smart cities, featuring sections on IoT implementations, eco-friendly urban development, and smart public services. It includes varied slide types such as diagrams, infographics, and statistical displays to showcase data and case studies from cities that are pioneers in this domain. The template is compatible with multiple presentation platforms like PowerPoint, Google Slides, and Keynote, ensuring it can be utilized across different devices and settings. This makes it a versatile tool for presentations in educational, professional, and conference contexts, aiming to inspire and educate on the transformative power of smart urban planning.


26 diapositivas
Human Resources Colorful Vectors
Dive into the dynamic realm of human resources, where talent thrives and organizations find their heartbeat. Radiating with a playful palette of sunny yellow, refreshing green, blush pink, and crisp white, our template captures the vibrancy and diversity of the HR world. Adorned with colorful graphics, relatable icons, and insightful image placeholders, it's a testament to the human touch in every organization. Expertly tailored for Powerpoint, Keynote, or Google Slides. An invaluable tool for HR professionals, recruitment agencies, corporate trainers, or anyone focused on building and nurturing talent. Engage, empower, and elevate; let your HR endeavors shine.


5 diapositivas
Organ Structure Breakdown Slide Presentation
Bring your anatomy data to life with this clear and engaging organ breakdown slide. Designed to visually map out key organ functions or statistics, this layout makes complex info feel simple. Whether you're teaching biology or sharing medical research, it's editable and works with PowerPoint, Keynote, and Google Slides.


22 diapositivas
Tempest Product Strategy Report Presentation
Accelerate your product strategy with this bold presentation template! Ideal for outlining your product's market opportunity, unique selling proposition, and revenue model, it includes slides for competitive analysis, marketing strategy, and financials. Impress stakeholders with dynamic visuals and clear, structured content. Compatible with PowerPoint, Keynote, and Google Slides for seamless presentations on any platform.


5 diapositivas
Construction Sector and Careers Infographics
Construction Infographics provide information and data related to the construction industry. This template is a visually appealing and informative design that allows you to present key information about the construction industry and various career opportunities within it. This template provides a comprehensive platform to showcase the different aspects of the industry and the diverse career paths available. Compatible with Powerpoint, Keynote, and Google Slides, ensuring easy customization and flexibility. The infographics feature construction-themed illustrations and icons, to captures the attention of your audience and add visual interest.


7 diapositivas
SCRUM Roles Infographic
Dive into the agile world with our SCRUM roles infographic. This template is designed to depict the various roles within the SCRUM framework, offering clarity and insight into the collaborative heart of agile methodologies. With a clean white canvas set against hues of blue, it provides a modern yet comprehensive overview of the roles. Ideal for agile coaches, trainers, and organizations transitioning to agile methodologies, this infographic is tailored to showcase the importance of each role. With its compatibility, spanning PowerPoint, Keynote, and Google Slides, presentations are bound to be a breeze, regardless of the platform you favor.