


Características


¿Tienes alguna pregunta?
Recomendar


3 diapositivas
Key Stats and Market Figures Slide Presentation
Communicate comparisons clearly with the Key Stats and Market Figures Slide presentation. This template uses a balanced scale graphic to visually contrast two data sets—ideal for weighing pros and cons, competitor benchmarks, or before-and-after scenarios. Fully customizable in PowerPoint, Keynote, and Google Slides.


10 diapositivas
Abstract Geometric Pattern Presentation
Energize your message with a bold, modern pattern that instantly grabs attention and gives your content a polished creative edge. This presentation transforms abstract shapes into a clean visual structure that supports clear talking points and smooth storytelling. Fully editable and compatible with PowerPoint, Keynote, and Google Slides.


6 diapositivas
Project Milestone and Status Update Presentation
Clearly communicate progress at every project phase with the Project Milestone and Status Update presentation slide. This table-style layout visually breaks down percentage completion across five key stages—Initiation, Planning, Execution, Monitoring, and Closing—making it ideal for status meetings, project reviews, or executive reports. Color-coded for easy reference and fully customizable in PowerPoint, Keynote, and Google Slides.


4 diapositivas
Key Performance Indicators Presentation
Hit every target with a bold, visual layout that helps you present performance insights with clarity and impact. This presentation makes it easy to highlight goals, measure progress, and showcase meaningful data in a clean, modern design. Fully editable and compatible with PowerPoint, Keynote, and Google Slides.


26 diapositivas
Jewelry Elegant Company Profile Presentation
Immerse yourself in the dazzling world of jewelry, where gems and craftsmanship create timeless elegance. Our template, exuding luxury in shades of brown and orange, embodies the modern elegance and aesthetic charm of fine jewelry. Enhanced with chic graphics, bespoke icons, and evocative image placeholders, it mirrors the allure of precious metals and stones. Seamlessly adapted for Powerpoint, Keynote, or Google Slides. A shimmering choice for jewelry brands, boutique owners, designers, or anyone seeking to showcase the sparkle and artistry of jewelry. Illuminate your brand; let each jewel tell its story.


20 diapositivas
Sylph Design Portfolio Presentation
Dive into a creative journey with this visually striking design portfolio presentation template! Ideal for showcasing design processes, mood boards, and final outcomes, it’s perfect for impressing clients or stakeholders. Highlight your design skills and methodology with this modern, sleek format. Compatible with PowerPoint, Keynote, and Google Slides for seamless integration into your workflow.

22 diapositivas
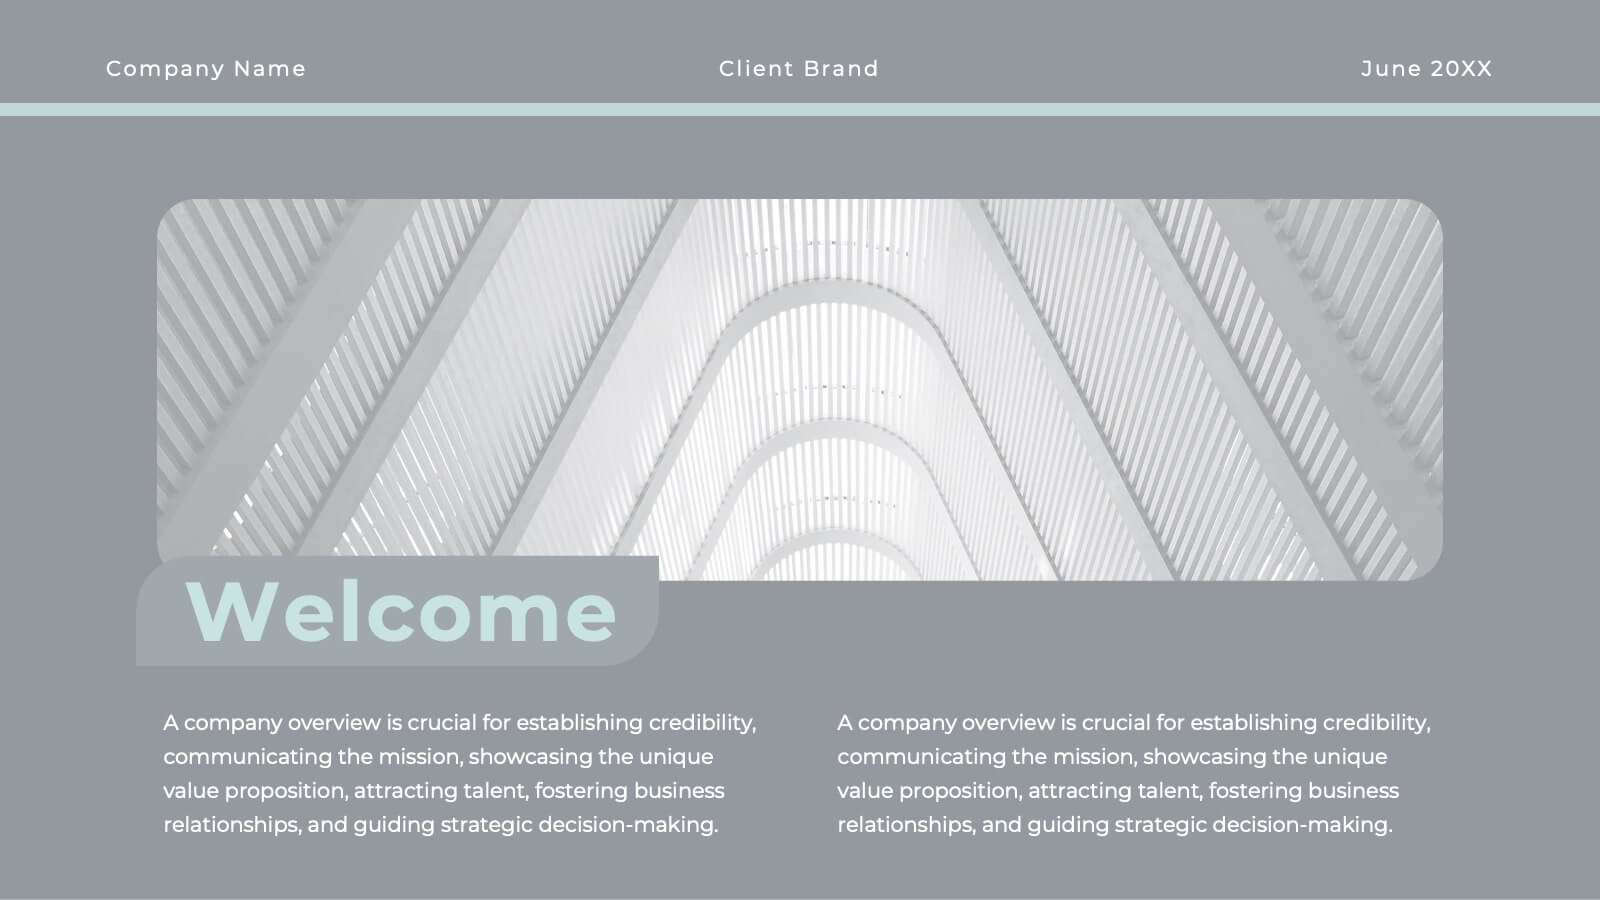
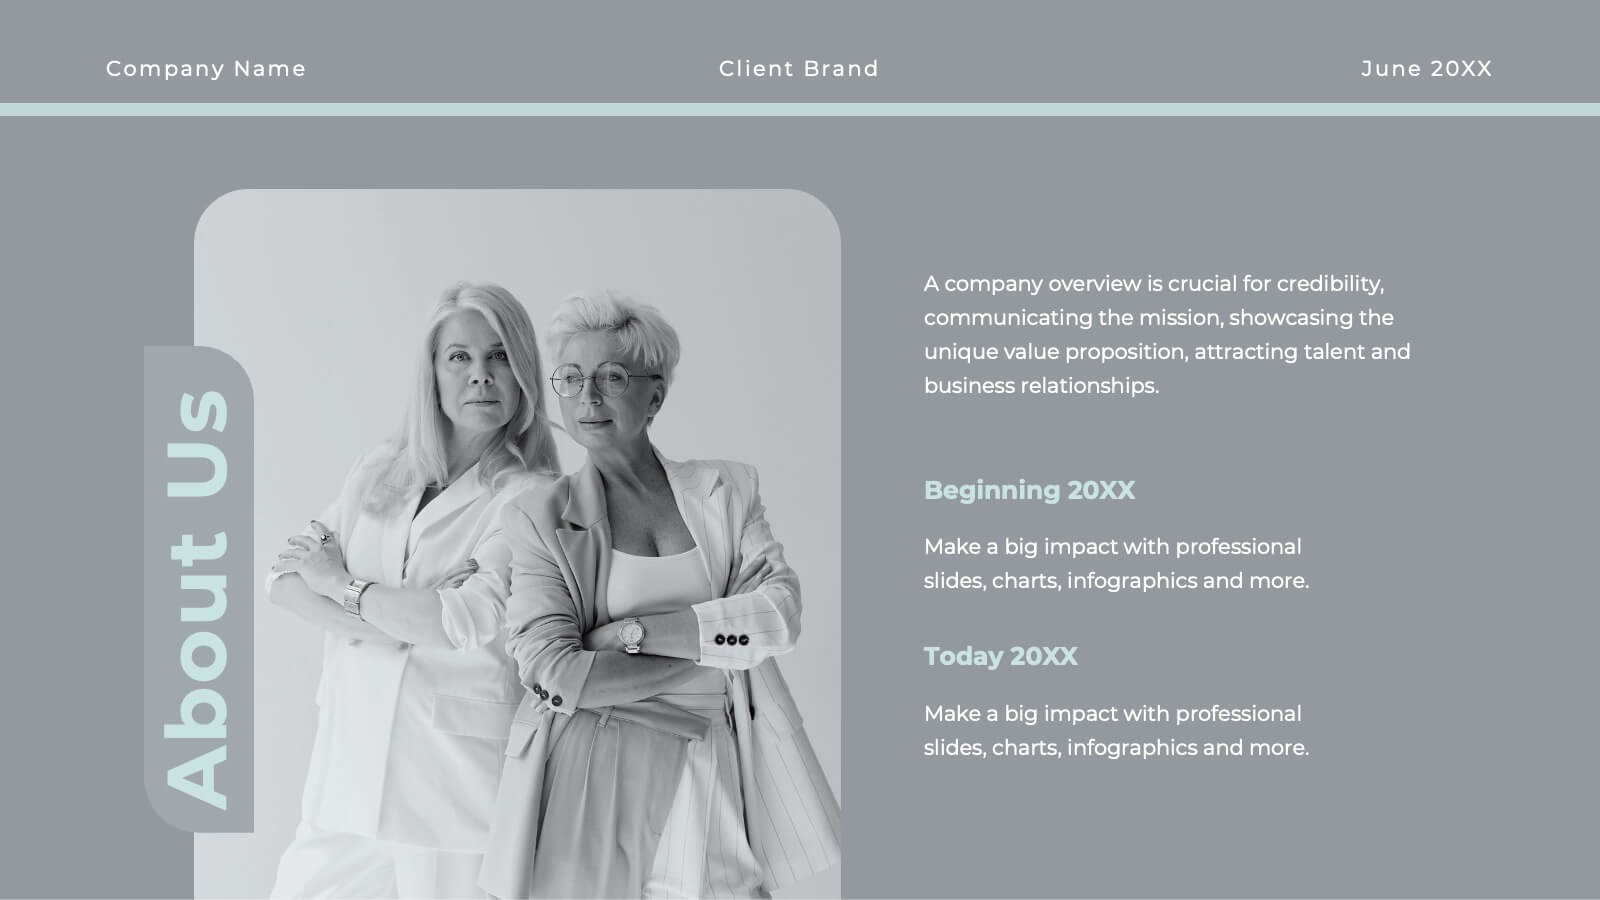
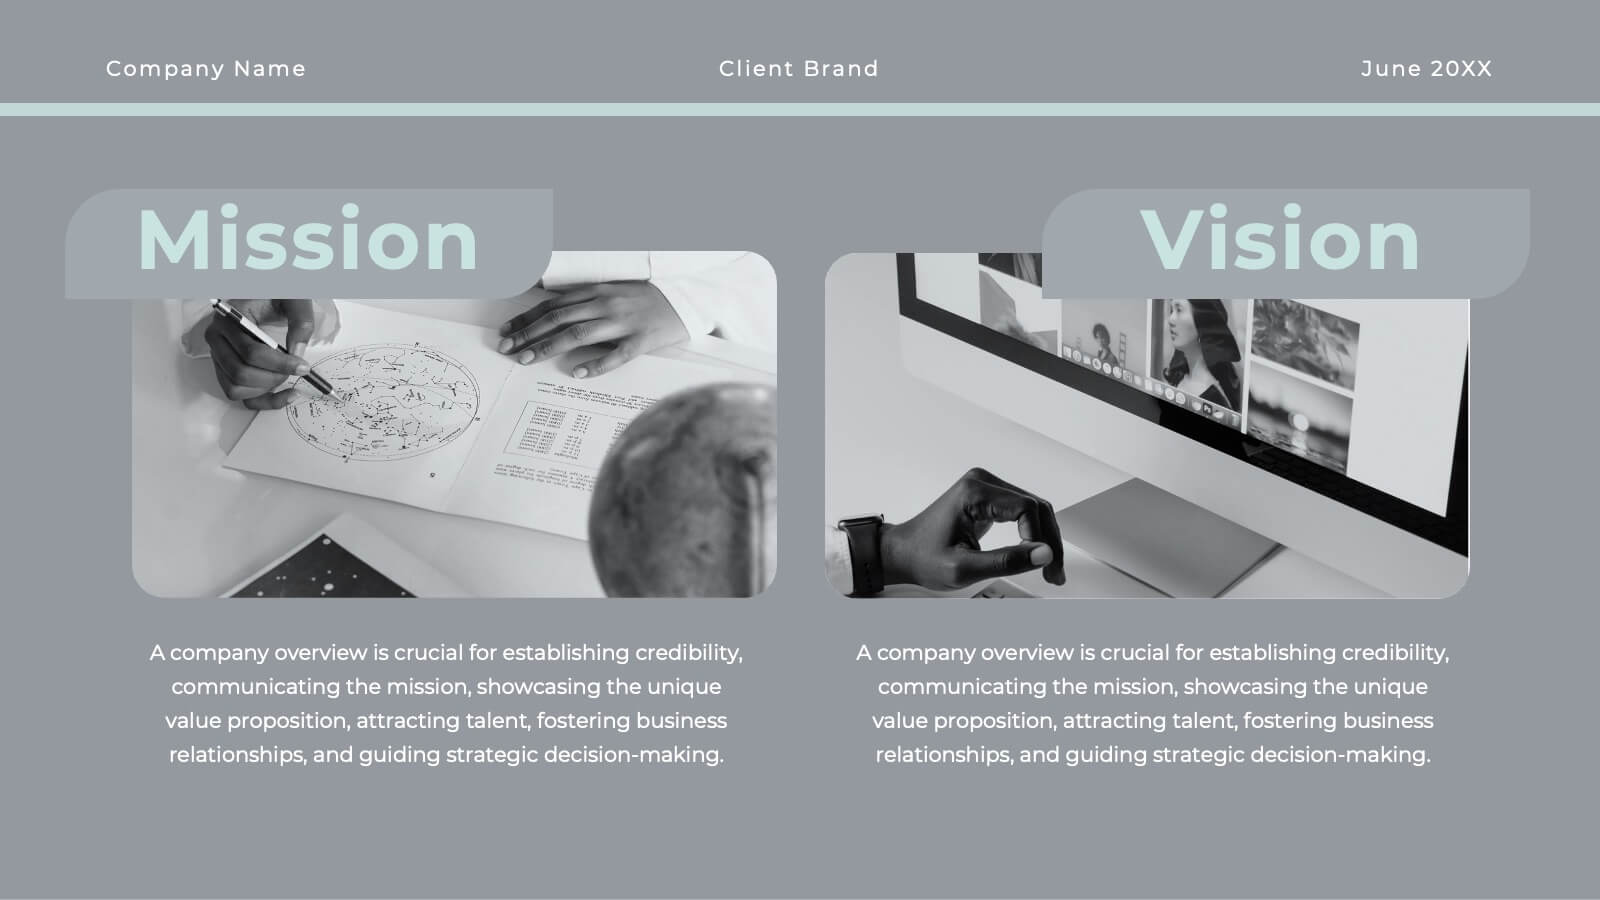
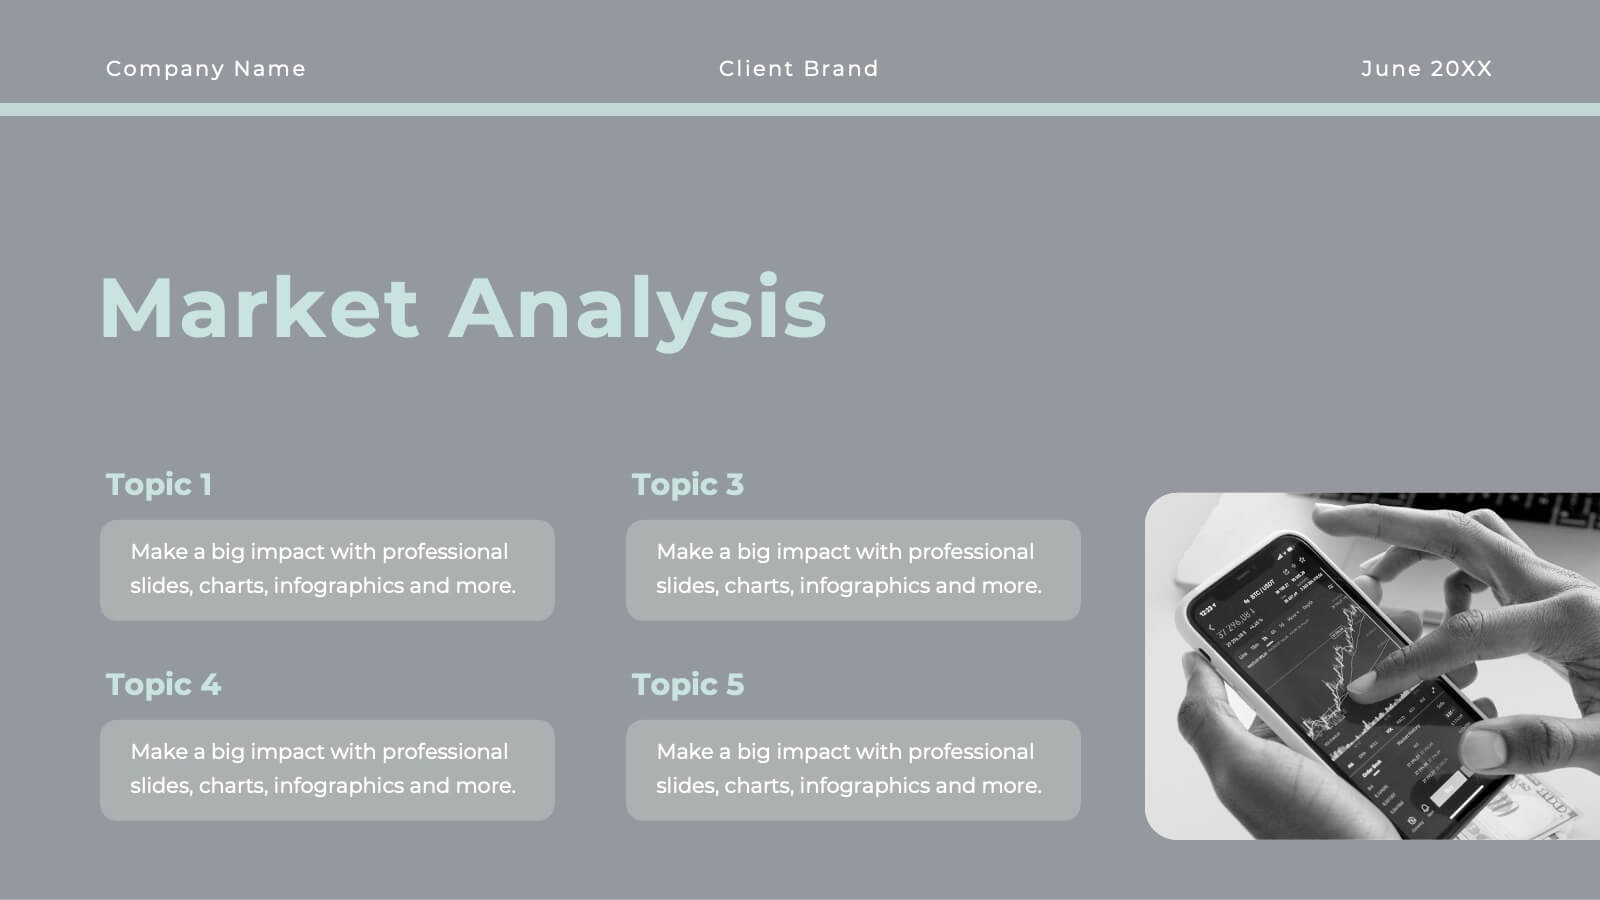
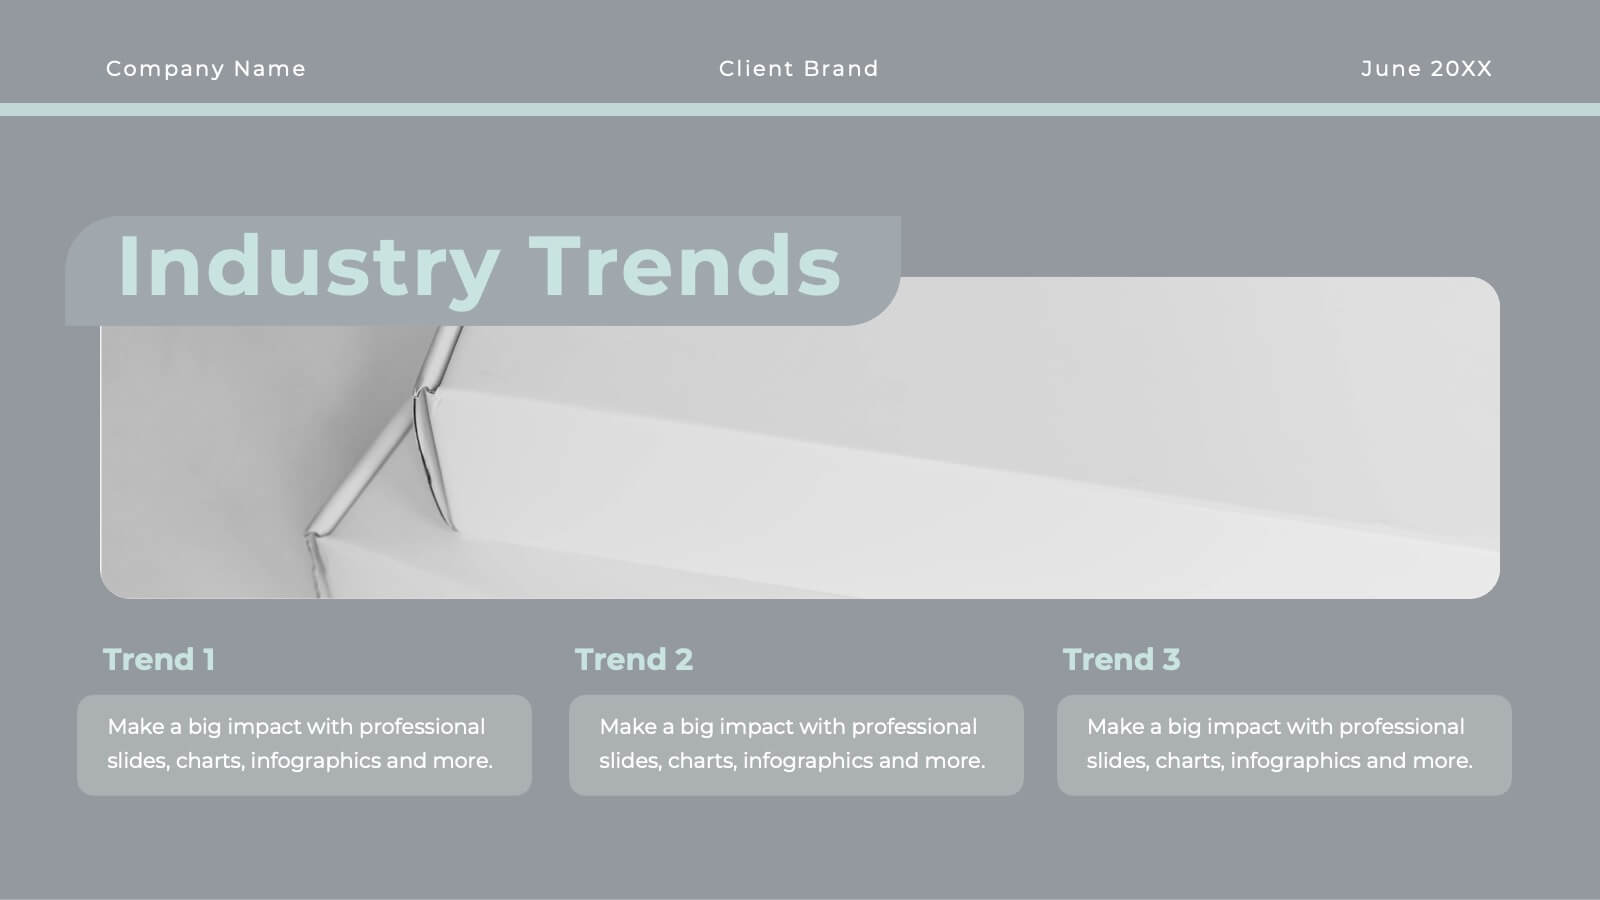
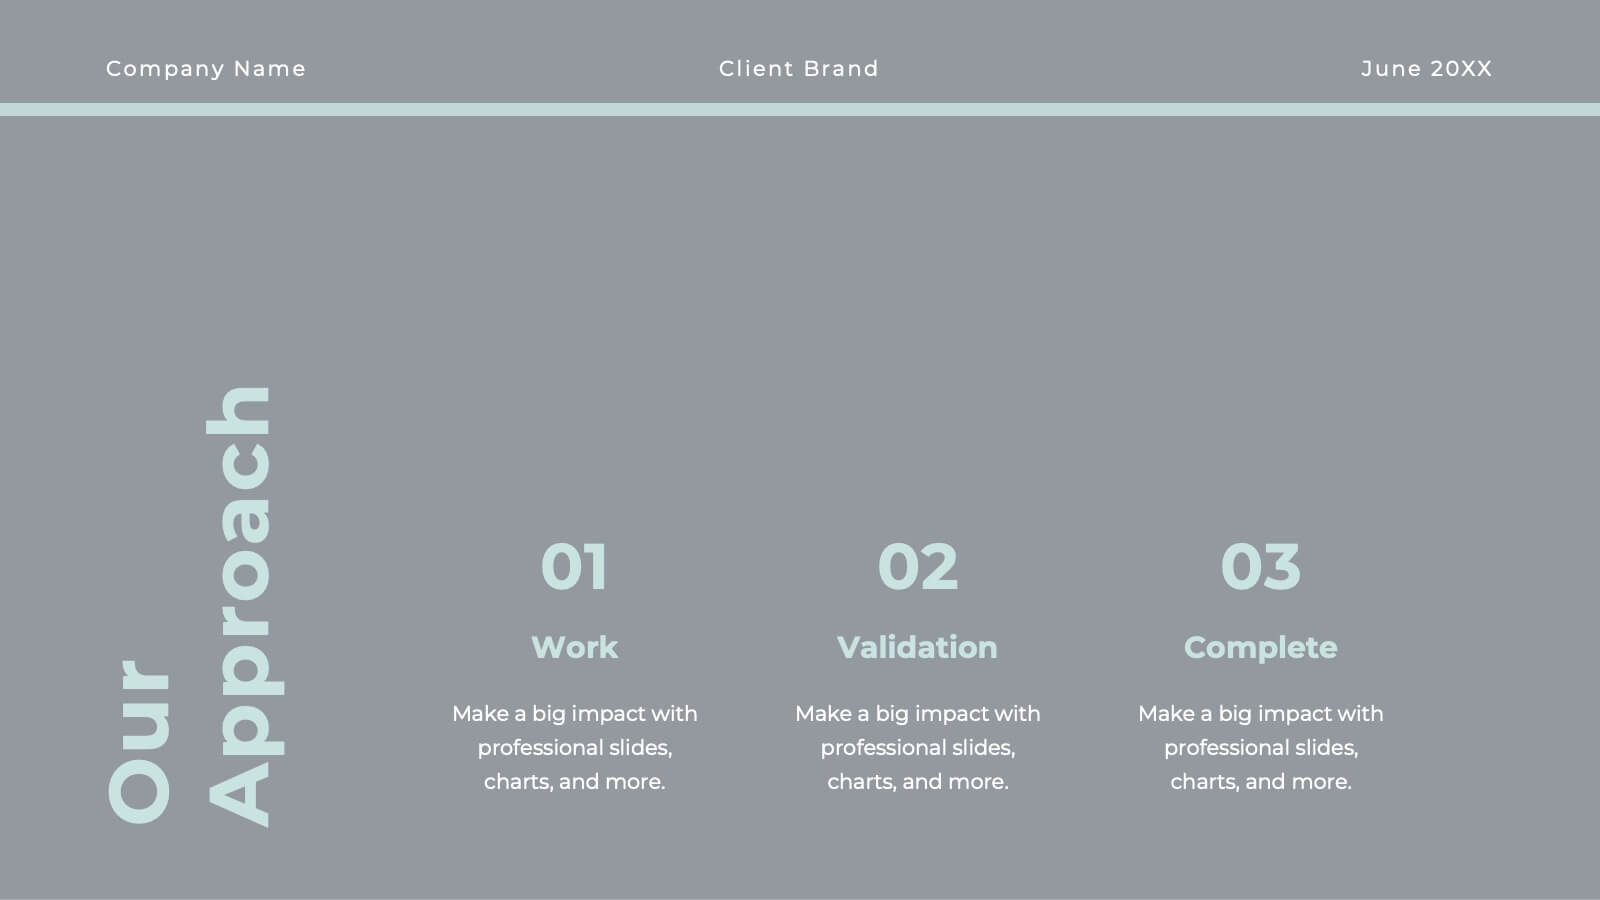
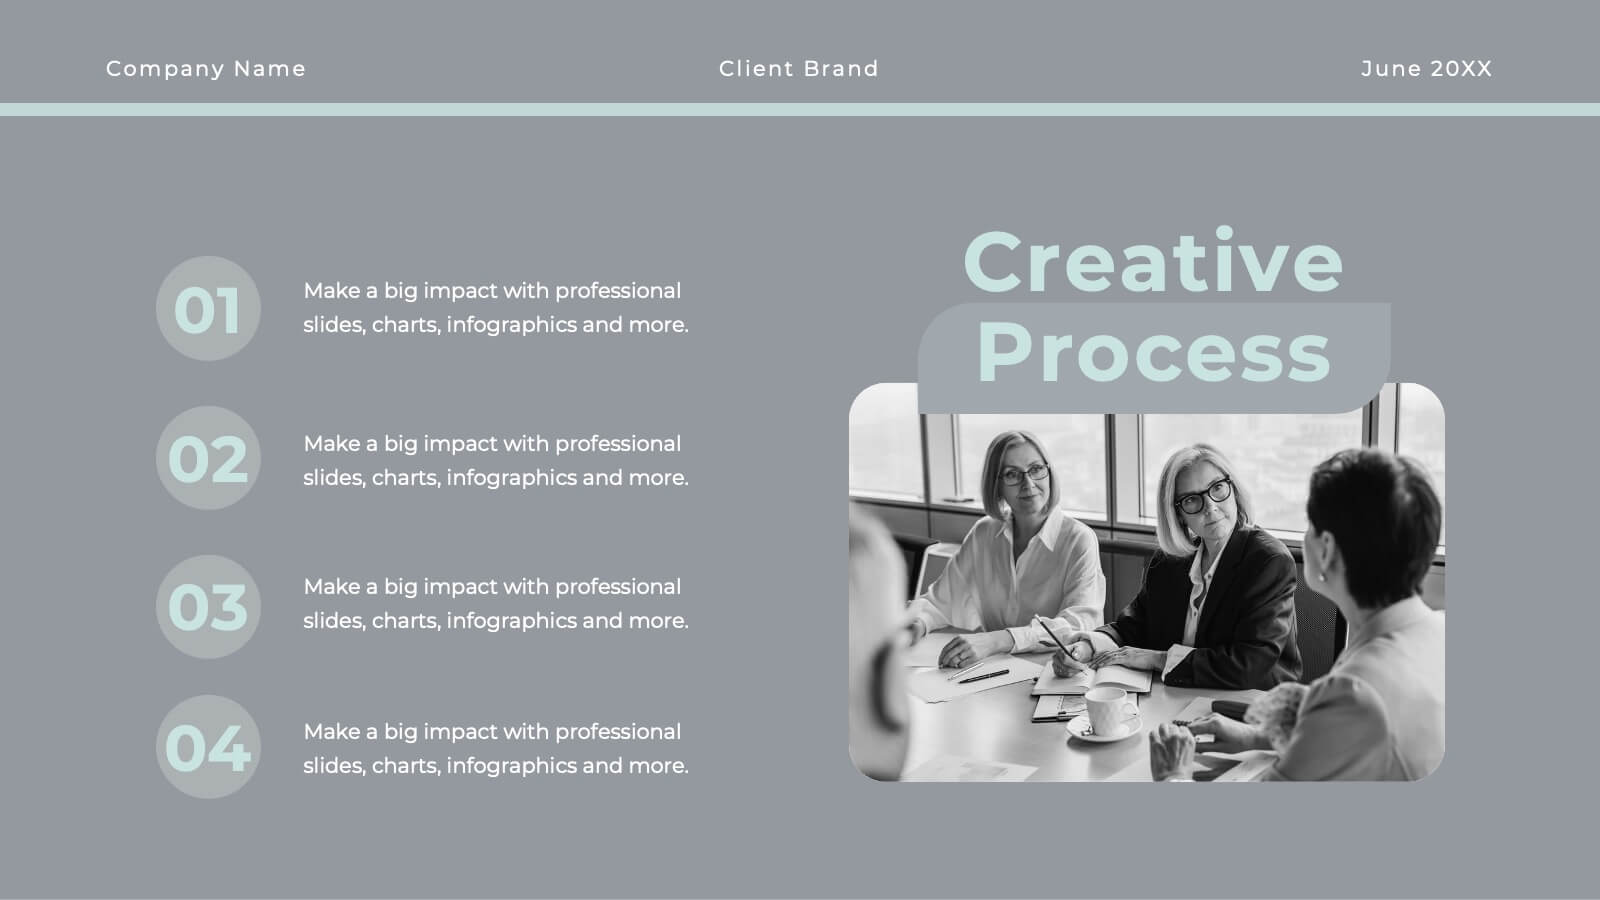
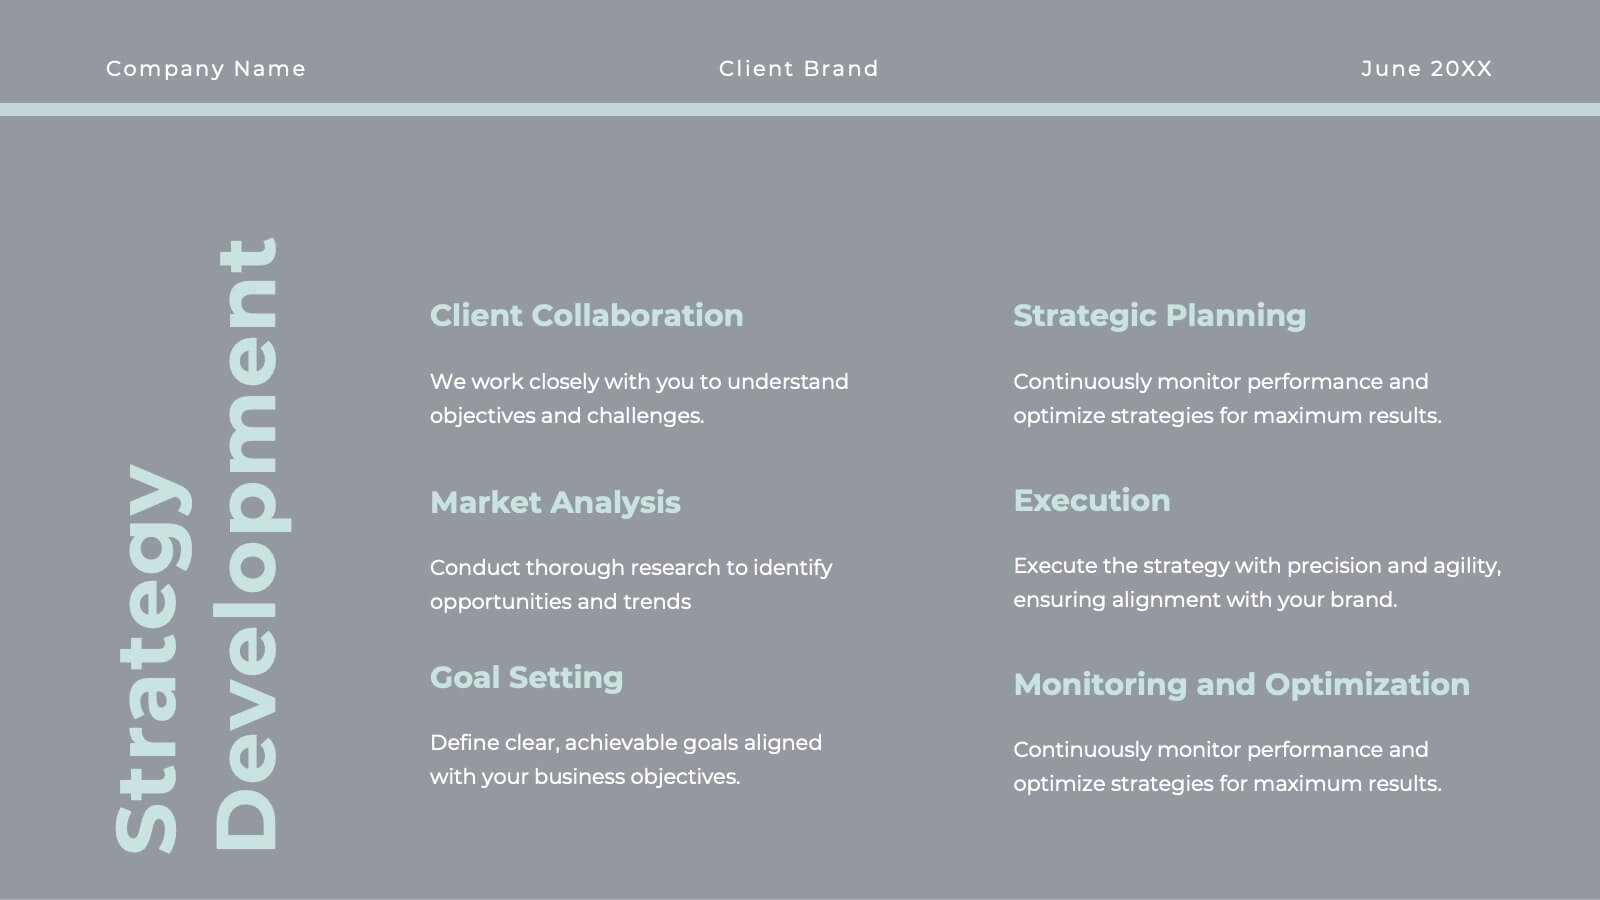
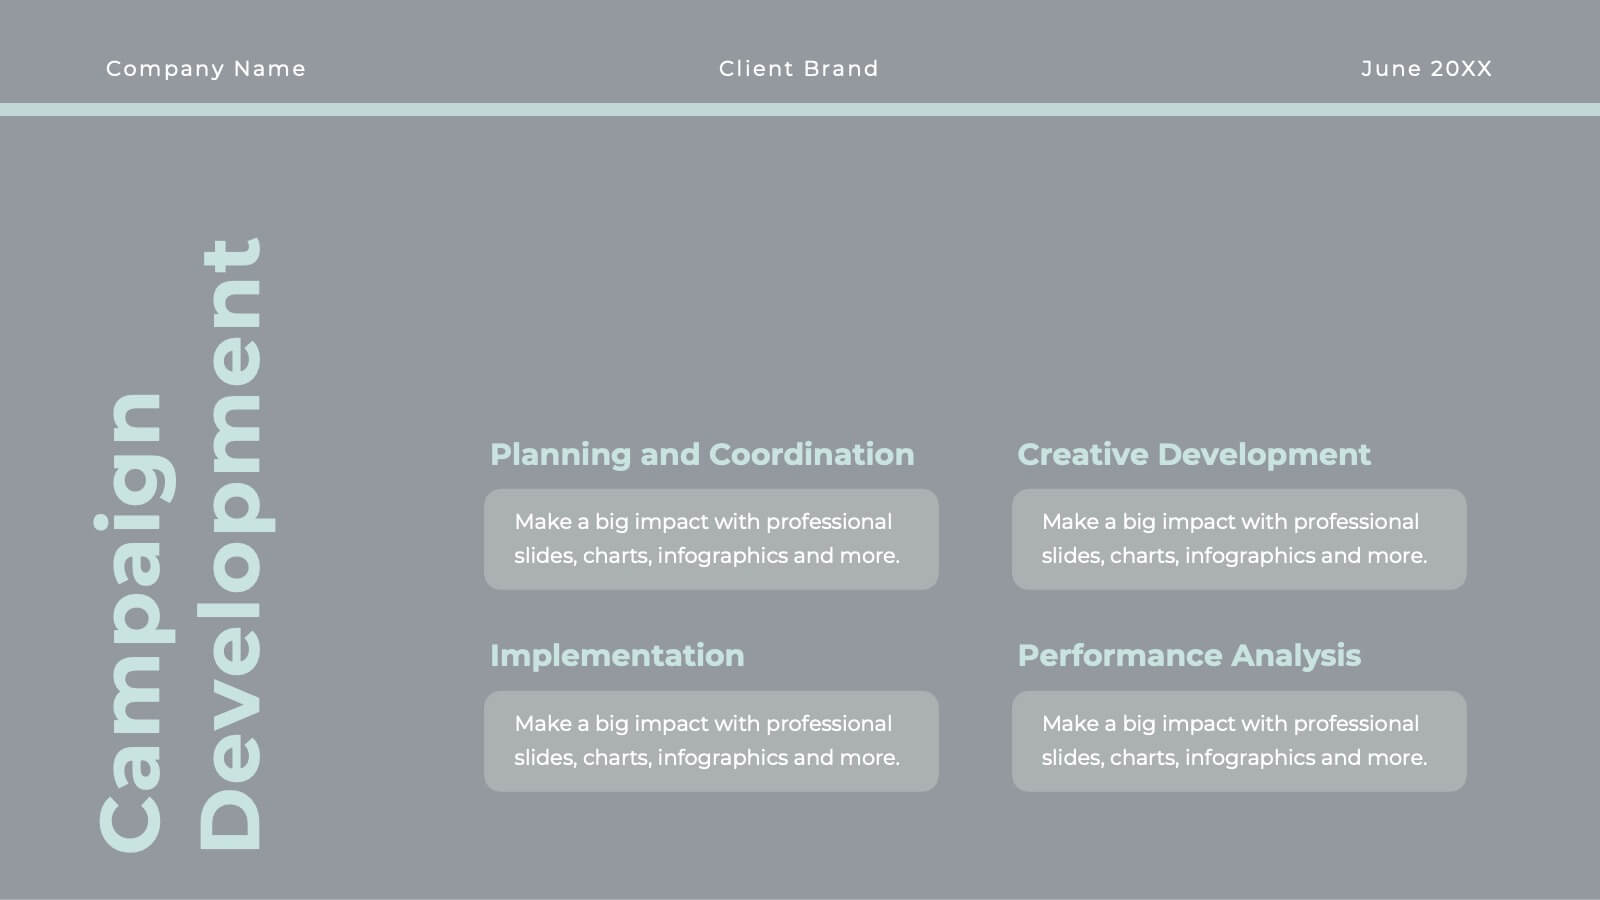
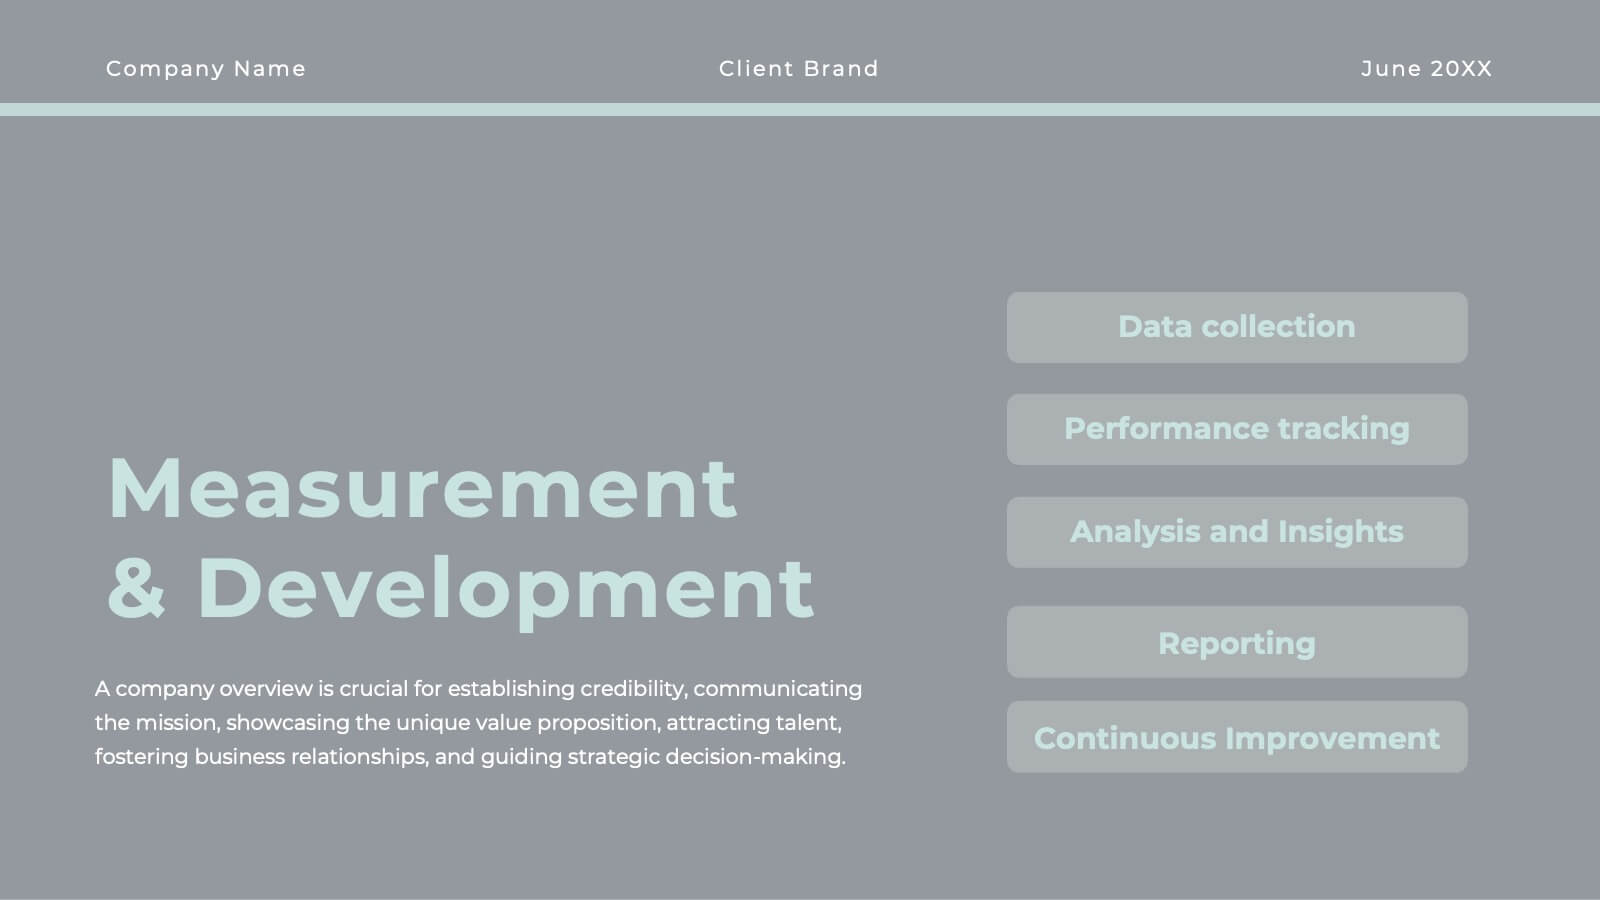
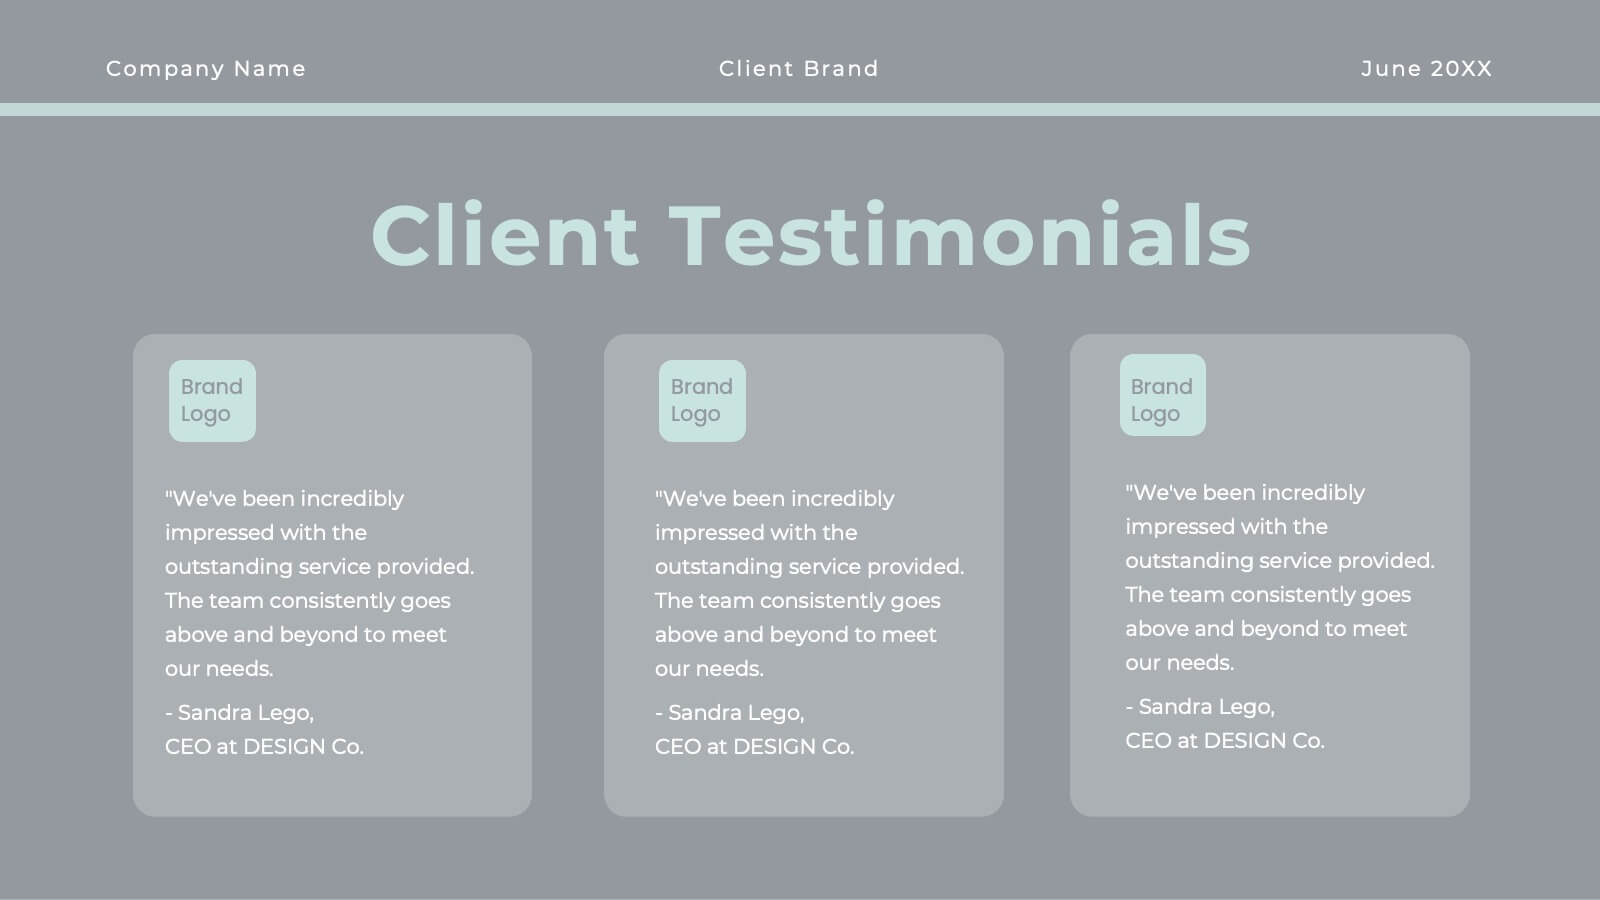
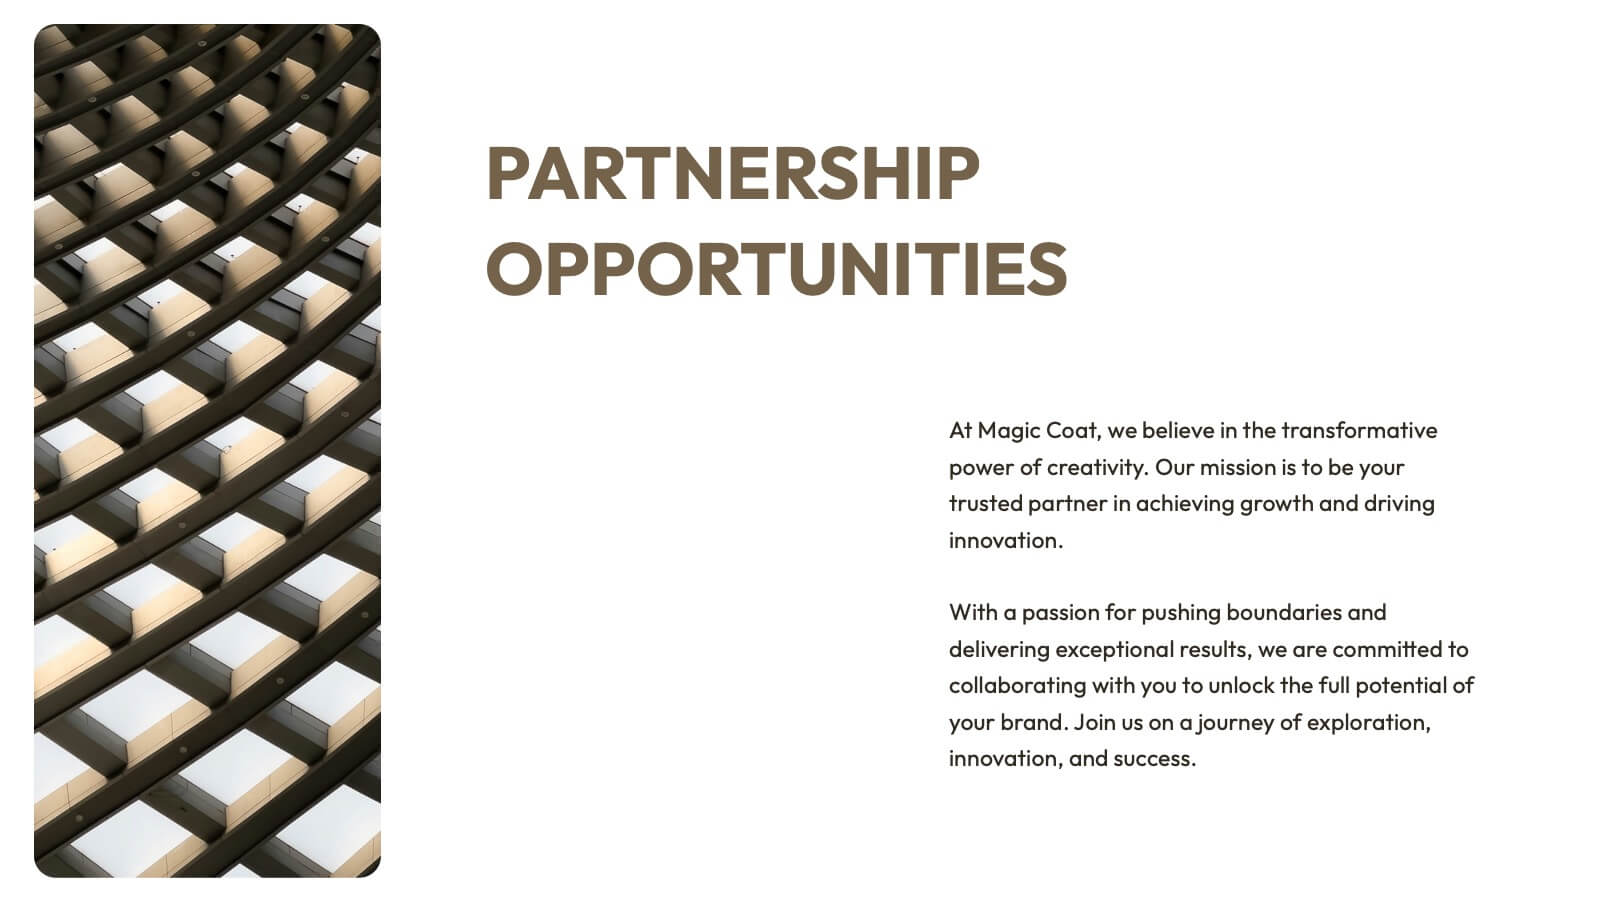
Whirlwind Advertising Agency Proposal Presentation
Get ready to elevate your agency’s game with a proposal template that’s as polished as your services! This sleek and sophisticated design is crafted to make a lasting impression on your clients and partners. From introducing your team’s expertise to showcasing successful case studies, every slide is meticulously designed to reflect professionalism and creativity. The clean, modern layout helps you present your market analysis, industry trends, and strategic approach with clarity and impact. With dedicated sections for client testimonials, campaign development, and partnership opportunities, this template ensures your agency’s value proposition is communicated with confidence and style. Perfectly adaptable to PowerPoint, Keynote, and Google Slides, this proposal template is your go-to tool for sealing deals and building lasting relationships. Your agency’s vision and mission will shine through in a presentation that’s both powerful and persuasive, making your proposals truly unforgettable!


8 diapositivas
Environmental Impact Reporting Presentation
Showcase sustainability data with clarity using the Environmental Impact Reporting Presentation. Perfect for tracking plastic usage, waste trends, and eco-initiatives. The infographic-style visuals highlight four distinct data points with bold icons and labeled callouts. Fully editable in PowerPoint, Keynote, and Google Slides—ideal for ESG reports, audits, or environmental awareness campaigns.


5 diapositivas
Visual Gap Analysis Between Goals and Results Presentation
Hit the bullseye by clearly showing the gap between what was planned and what was achieved. This sleek, target-based presentation design helps visualize discrepancies between goals and results in a way that's easy to grasp and great for decision-making. Fully compatible with PowerPoint, Keynote, and Google Slides.


5 diapositivas
Side-by-Side Features Comparison Presentation
Clearly compare product or service features with the Side-by-Side Feature Comparison Presentation. This layout is perfect for showcasing pros and cons, plan differences, or feature breakdowns across two options. With a clean visual structure and customizable labels, it's ideal for decision-making slides. Compatible with Canva, PowerPoint, Keynote, and Google Slides.


6 diapositivas
Lean Business Canvas Framework
Simplify your business strategy with the Lean Business Canvas Framework Presentation. This slide offers a structured layout to map out key elements like partners, activities, value propositions, customer segments, and revenue streams—all in one view. Ideal for startups, business plans, or internal strategy sessions. Fully editable in PowerPoint, Keynote, and Google Slides.


6 diapositivas
Project Summary Report Presentation
Enhance your project reviews with our "Project Summary Report Presentation" template. This slide is expertly designed to summarize key project aspects such as objectives, milestones, and outcomes, structured into sections labeled A, B, and C. Featuring an image of a collaborative team setting, the template underscores the essence of teamwork and productivity in project management. Each section is organized to clearly communicate your project’s progress and results to stakeholders. Ideal for project managers and teams, this template supports effective storytelling in project updates. Compatible with PowerPoint, Keynote, and Google Slides, it’s an essential tool for delivering impactful and organized project presentations.


22 diapositivas
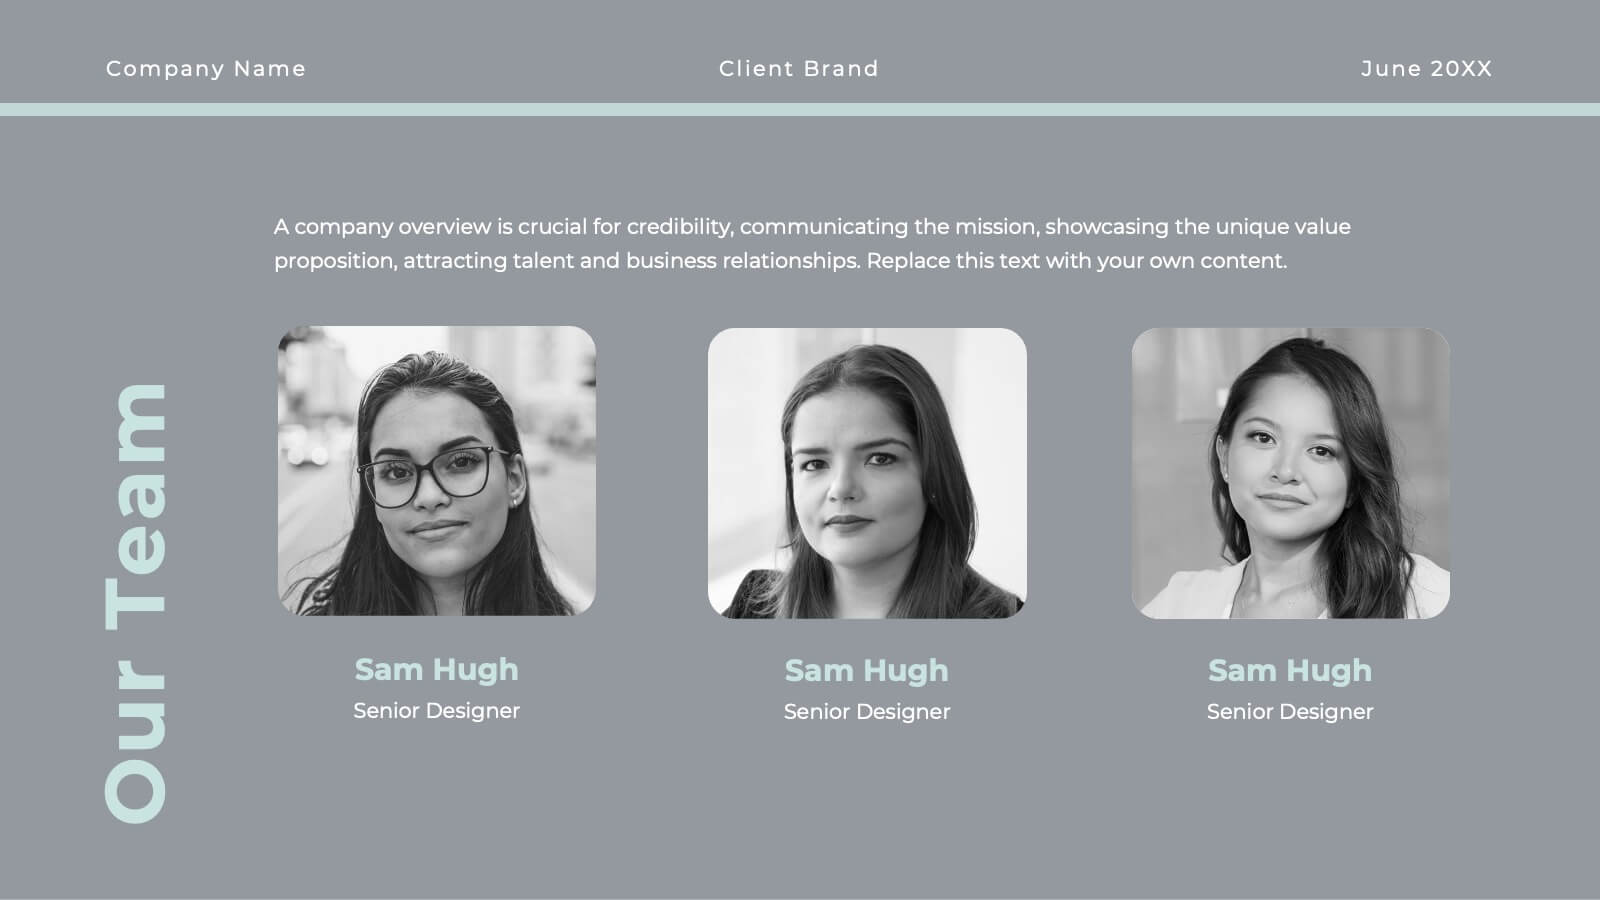
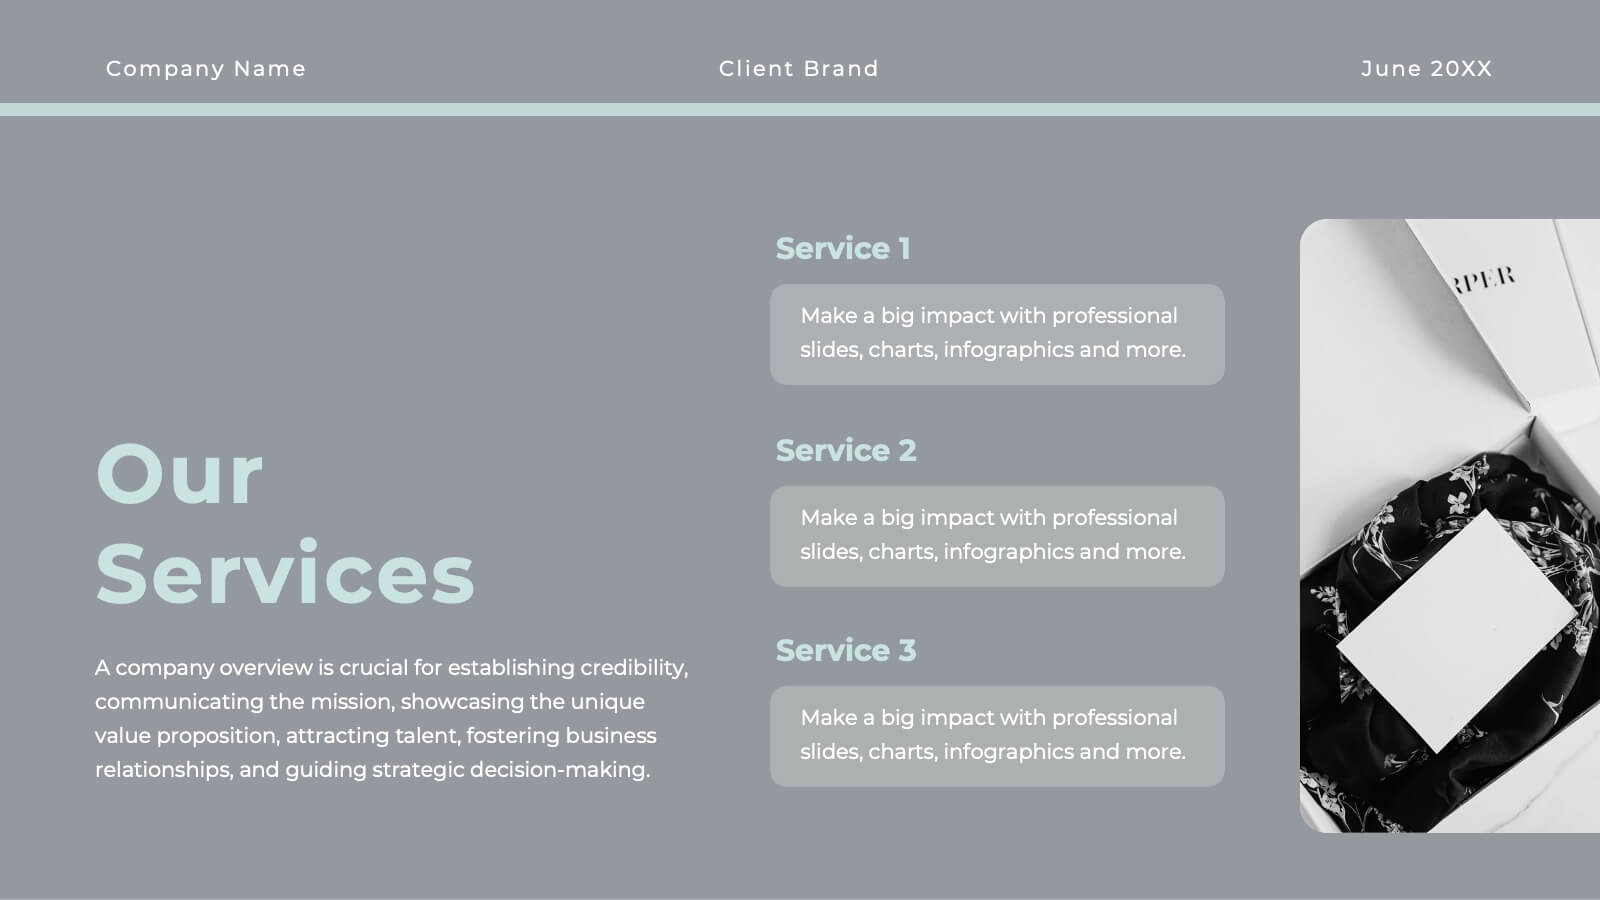
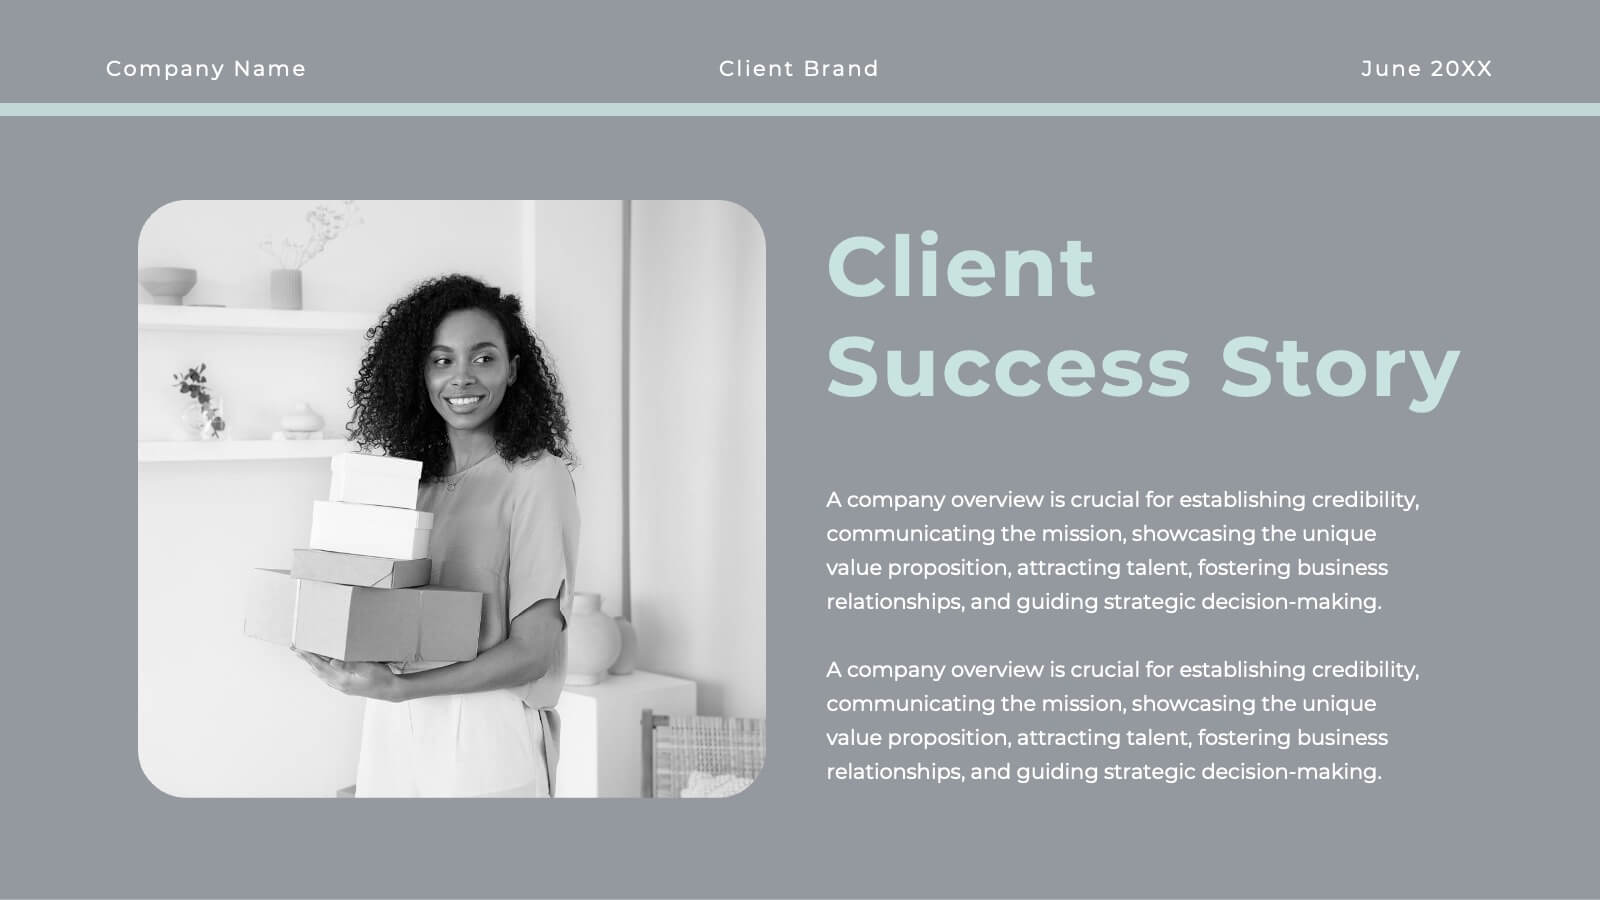
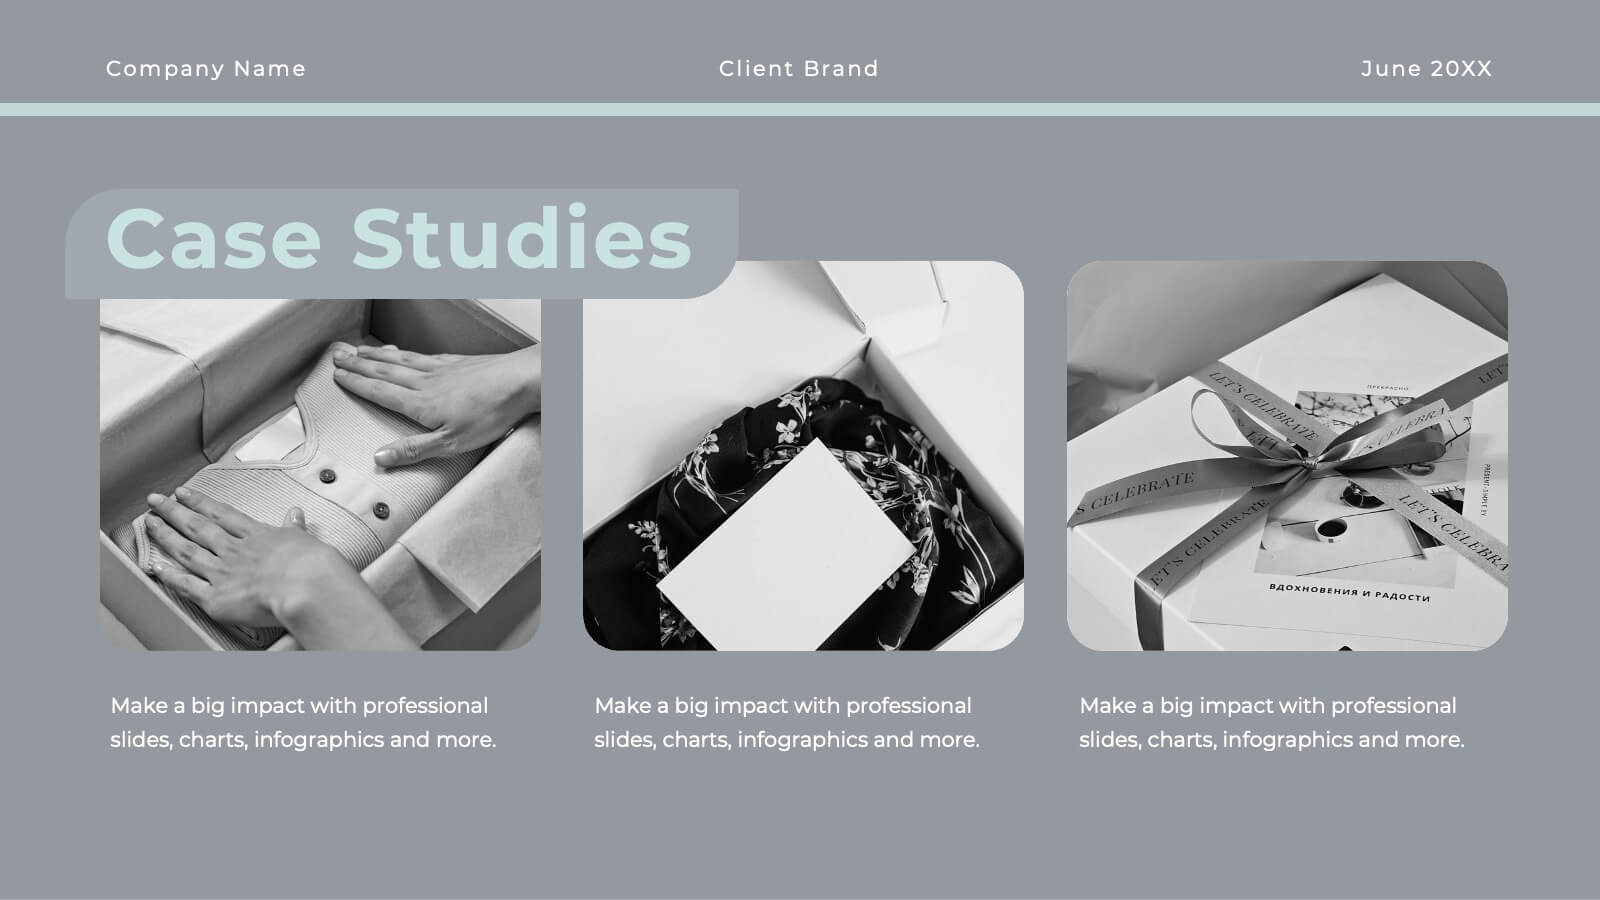
Vivid Creative Agency Pitch Deck Presentation
This sleek creative agency template is ideal for presenting your company's mission, services, and success stories. With a minimalist design, it offers a professional yet stylish approach to showcase case studies, industry trends, and partnership opportunities. It’s perfect for PowerPoint, Keynote, and Google Slides, making your agency stand out with every slide.


6 diapositivas
Project Timeline Calendar Presentation
Kick your planning into high gear with a clean, colorful layout that makes tracking progress feel effortless. This presentation helps you map tasks across the week, visualize timelines, and communicate project schedules with absolute clarity. It’s fully editable and works seamlessly in PowerPoint, Keynote, and Google Slides.


7 diapositivas
Structure Diagram Infographics
Structure is important because it provides a framework for organization and order, which helps to facilitate efficiency, productivity, and success in many different areas of life. This template is a powerful tool that can help you organize, visualize, and present your data in a compelling way. This infographic template is designed to illustrate the structure and workings of a company or organization. It includes a variety of customizable photo layouts and charts so you can edit the look to suit your needs. This presentation is designed for use in Powerpoint, Keynote and Google Slides.


26 diapositivas
Natlea Presentation Template
Need help presenting your next travel destination? This template is a unique and sophisticated way to present your travel destination. The Natlea travel template is a fun, surprisingly sophisticated and easy to use template that allows you to list all the details of your trip. With bold colors, charts, budget slides and venn diagrams this template has it all. It's simple yet fun design makes it stand out and at the same time keep your audience engaged. This is the perfect choice for marketers, tourism professionals or anyone who needs to make a great looking presentation on their next trip.


6 diapositivas
Tables of Content Analysis Infographic
Table of Contents analysis refers to the examination and evaluation of the structure and content of a document's table of contents. It is commonly used as a preliminary step to understand the flow of information within a longer document, such as a book, report, thesis, or research paper. This infographic template provides insights into the document's structure and can help readers determine whether the document is relevant to their needs. This infographic is designed to provide a quick overview of the topics covered in the document and their distribution, helping readers understand the organization of the content at a glance.