


Características


¿Tienes alguna pregunta?
Recomendar
7 diapositivas
Arrow Process Flow Presentation
Illustrate step-by-step processes with the Arrow Process Flow Presentation. This dynamic template visually maps out sequential steps, making it ideal for workflow diagrams, business strategies, and project planning. Customize colors, text, and icons to align with your brand. Compatible with PowerPoint, Keynote, and Google Slides for effortless editing.


6 diapositivas
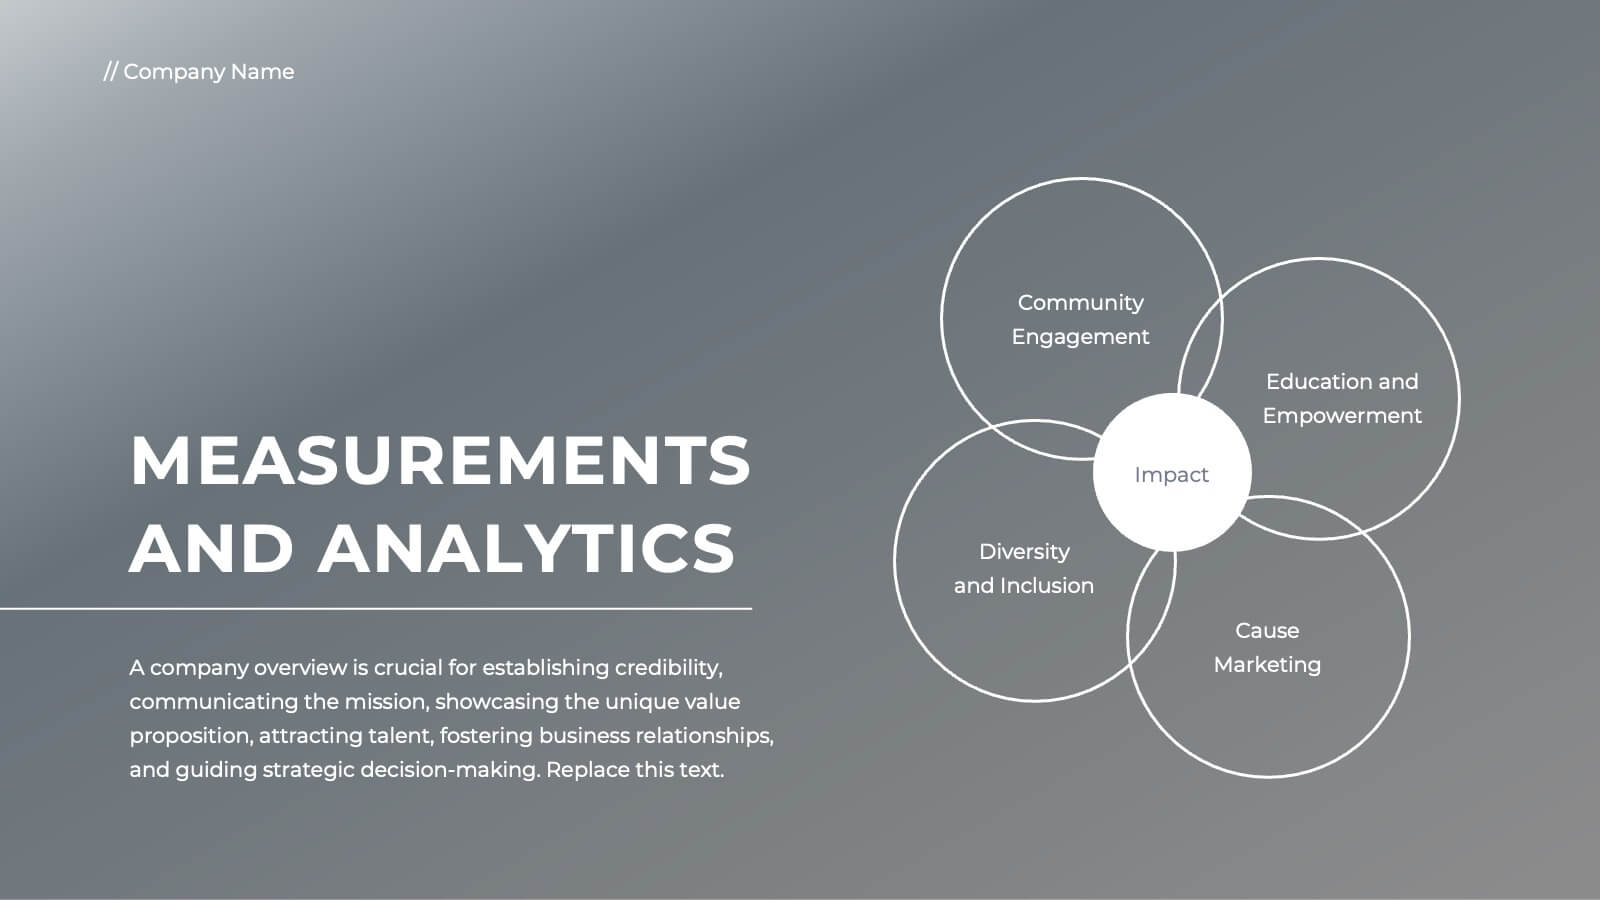
Team Leadership and Management
Foster stronger collaboration with this team-focused circular diagram. Designed to showcase six key areas of team leadership, this template is perfect for outlining communication, goal-setting, delegation, performance, feedback, and development strategies. Ideal for managers, trainers, and HR professionals. Fully customizable in PowerPoint, Keynote, and Google Slides.


6 diapositivas
Six Sigma Process Improvement Presentation
Dive into efficiency with our Six Sigma Process Improvement template! This presentation guide maps out each step from Define to Control, ensuring your project targets are met with precision. Ideal for quality assurance and process optimization, it's compatible with PowerPoint, Keynote, and Google Slides. Perfect for professionals keen on streamlining operations and enhancing productivity.


5 diapositivas
Diabetes Treatments & Symptoms Infographics
Diabetes is a chronic medical condition that affects how the body processes glucose in the blood. There are three main types of diabetes: type 1 diabetes, type 2 diabetes, and gestational diabetes. These infographic templates are comprehensive and visually appealing tools designed to educate and create awareness about diabetes symptoms and treatment options. With its attractive design, concise information, and visually appealing graphics, this template will help individuals understand the importance of diabetes management and make informed decisions regarding their health. This template is completely customizable and compatible with Powerpoint, Keynote, and Google Slides.


7 diapositivas
Positive Feedback Infographic Presentation
A Feedback Infographic presents information related to feedback, including what it is, why it is important, and how to provide and receive it effectively. Feedback is important to help understand performance or behavior and make improvements. This template is designed to help you effectively communicate the importance of feedback and provide tips and strategies for giving and receiving it. This template is compatible with Powerpoint, Keynote, and Google Slides, allowing you to easily add your images and data to illustrate your points, and customize content to fit your specific needs.


20 diapositivas
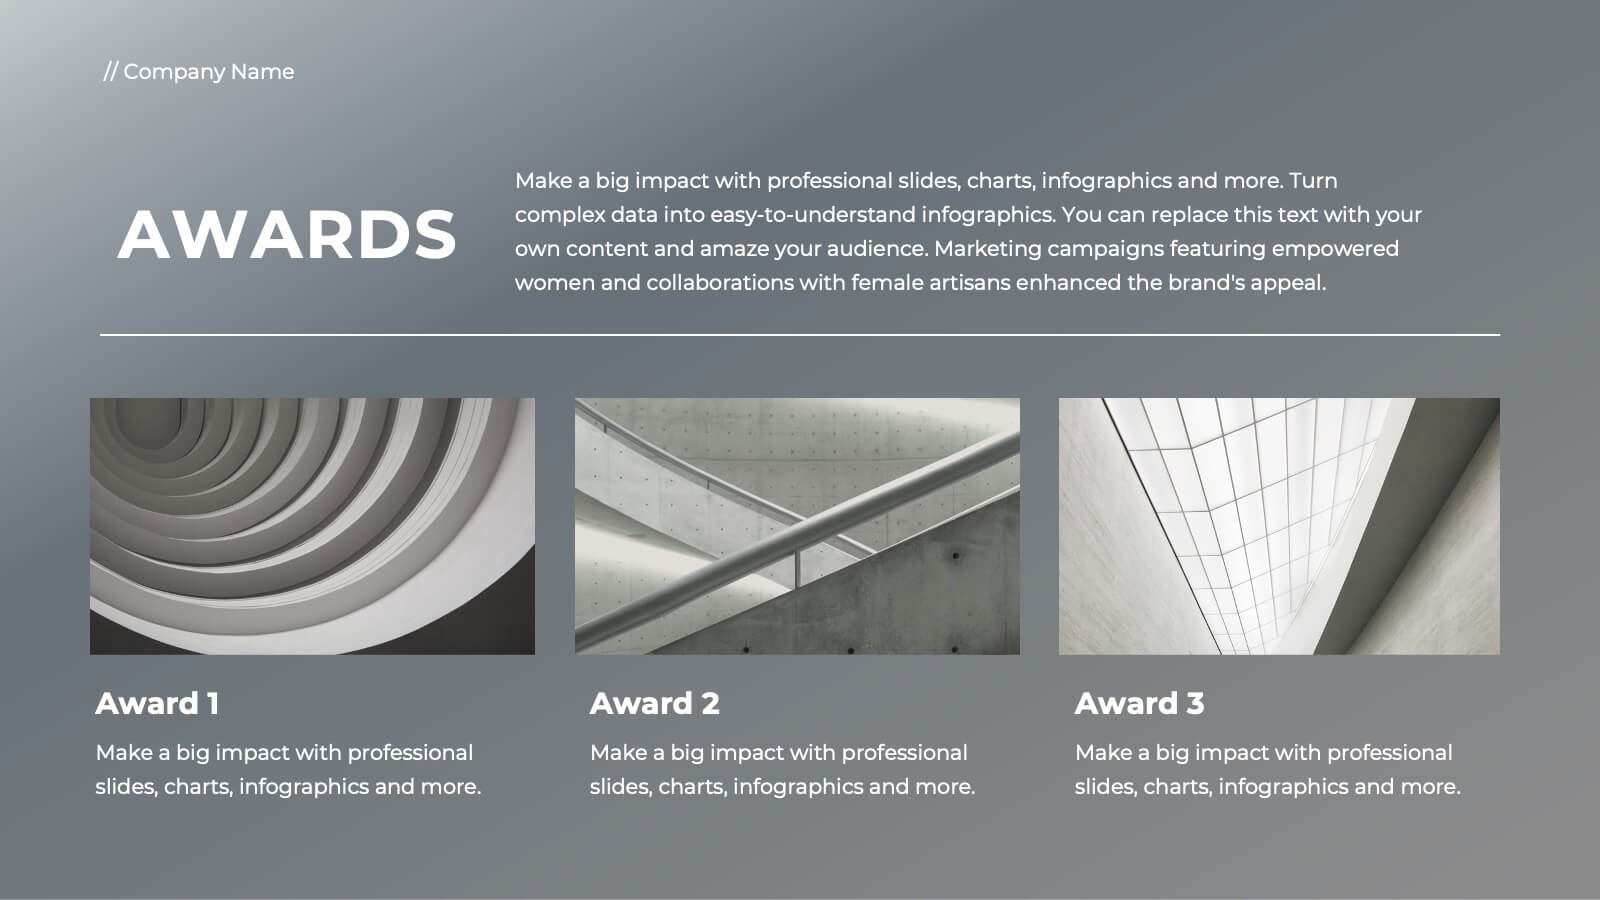
Vesta Photography Portfolio Presentation
Showcase your photography skills with this elegant portfolio template, designed to highlight featured projects, creative process, client testimonials, and services offered. With sections for awards, pricing, and social media links, this template captures your unique style and professionalism. Compatible with PowerPoint, Keynote, and Google Slides for easy customization.


6 diapositivas
Network Solution Infographic
Network Solution refers to a system of interconnected components or entities that work together to achieve a specific purpose, whether that's communication, collaboration, or something else. This infographic template can be a powerful way to visually represent various aspects of a network, whether it's a computer network, social network, or any interconnected system. This is fully customizable and compatible with Powerpoint, Keynote, and Google Slides. This allows you to keep the infographic visually appealing, informative, and easy to understand. The goal is to help your audience grasp complex network concepts at a glance.


5 diapositivas
History in Science Infographics
The history in science refers to the development of scientific knowledge throughout human history. These Infographics can be used to visualize and simplify complex scientific concepts and discoveries in a historical context. This can help students and others interested in science understand the evolution of scientific theories and breakthroughs over time, and how they have shaped our understanding of the world. These infographics use a variety of visual elements, such as timelines, graphs, illustrations, and icons, to tell a compelling story about the history of science. Compatible with Powerpoint, Keynote, and Google Slides.


22 diapositivas
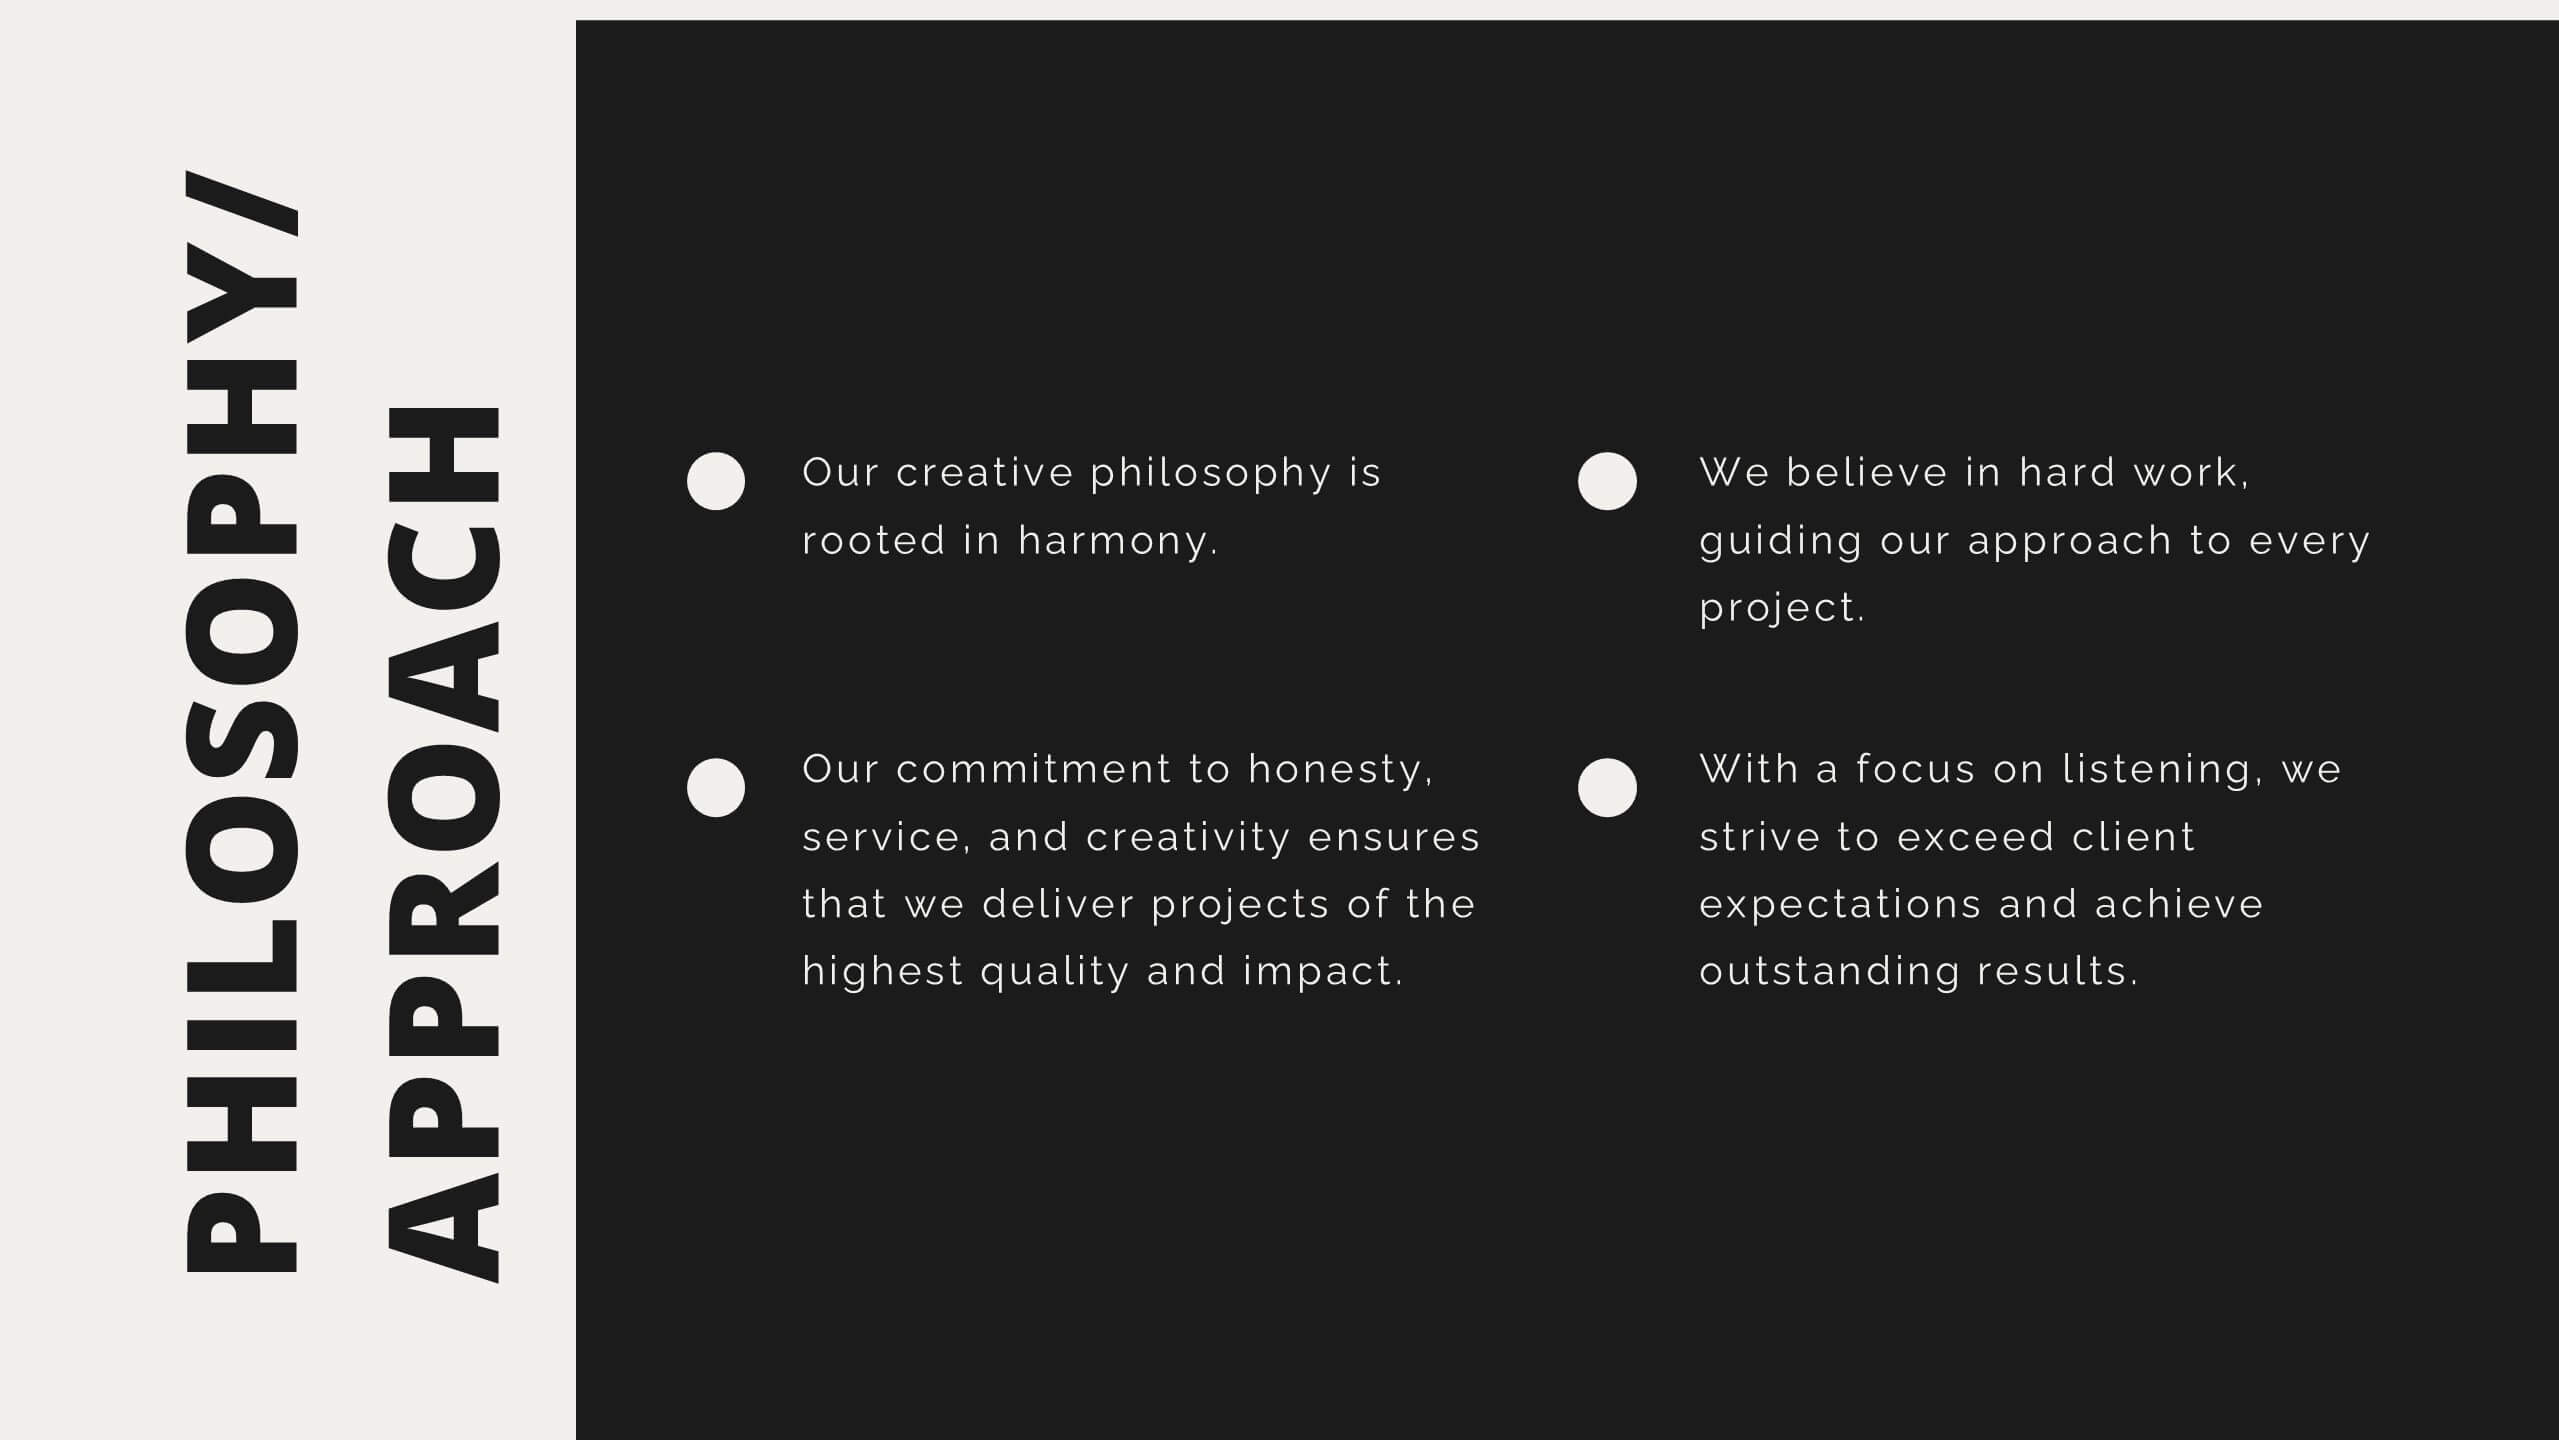
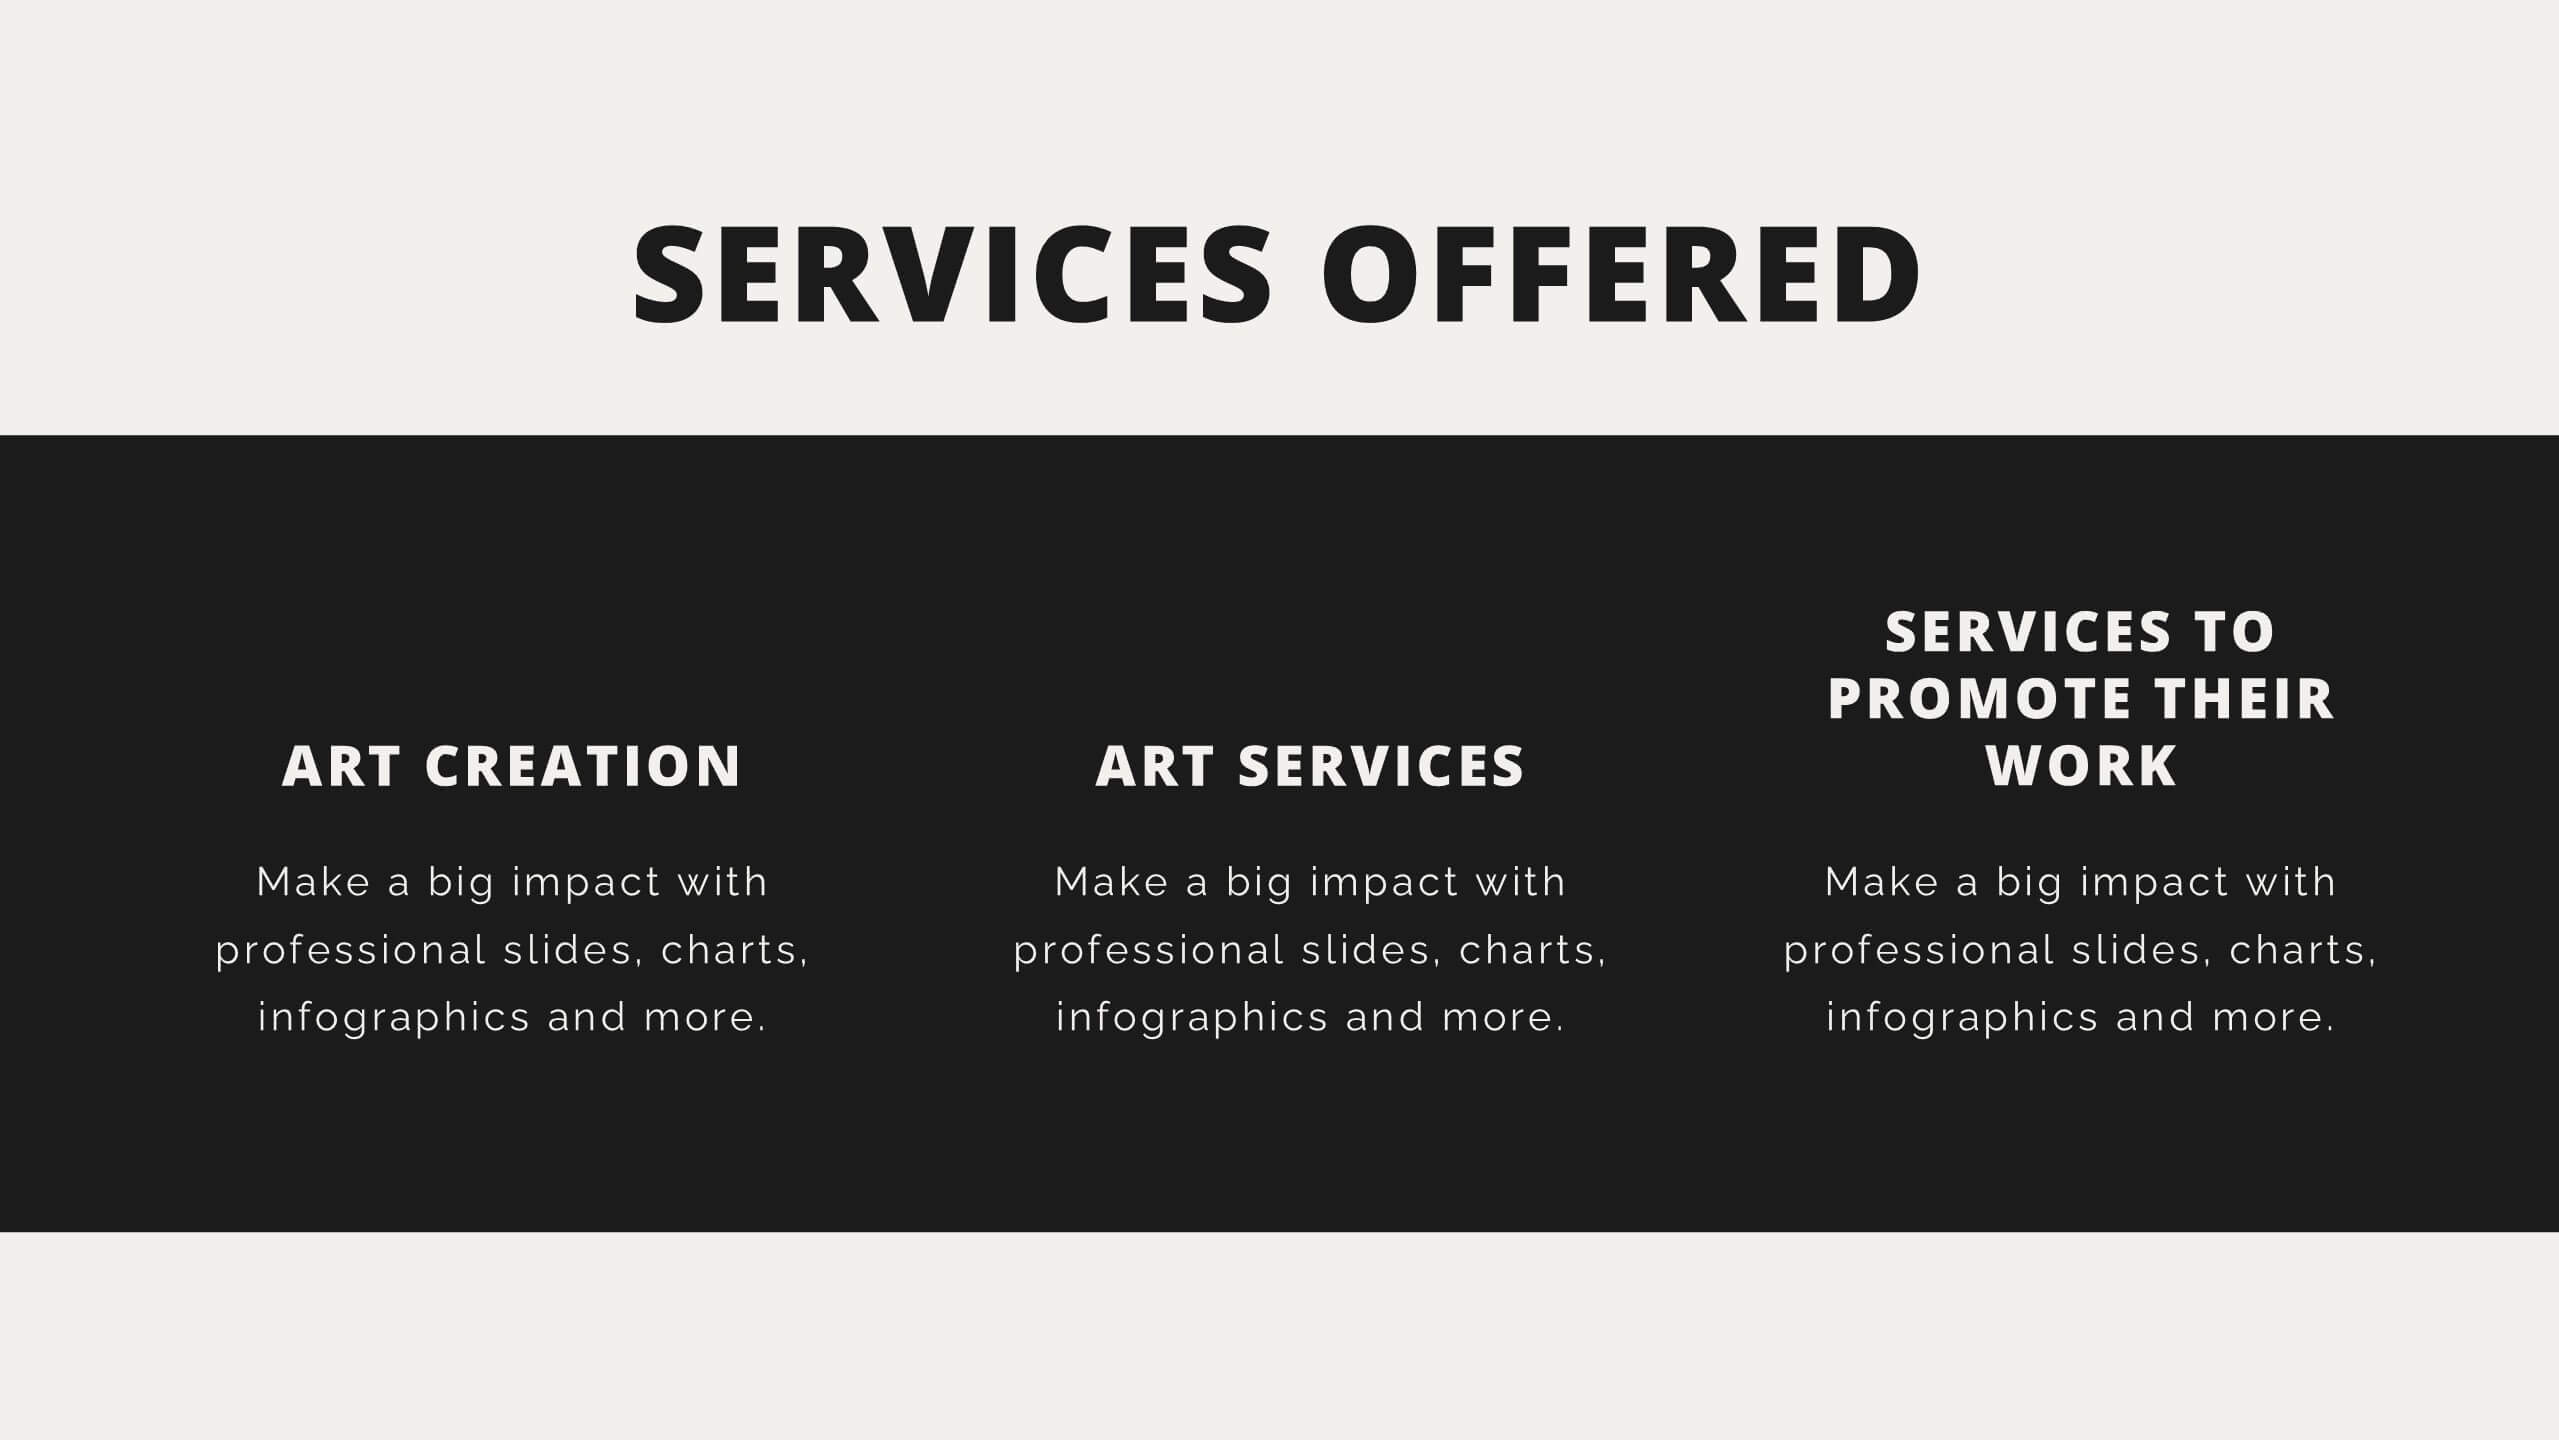
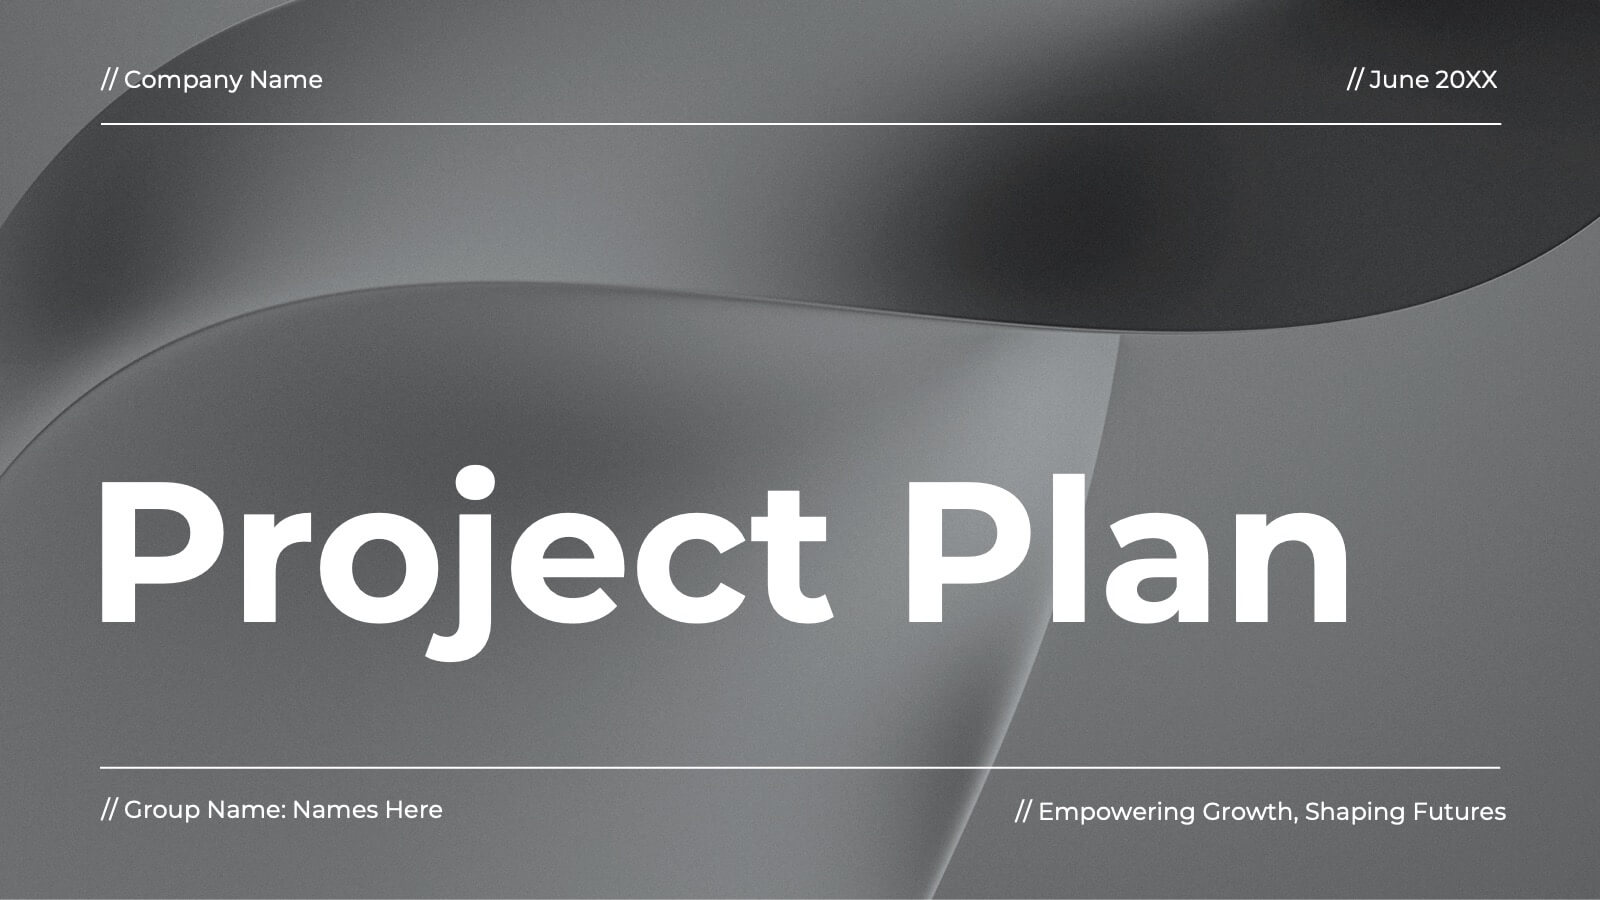
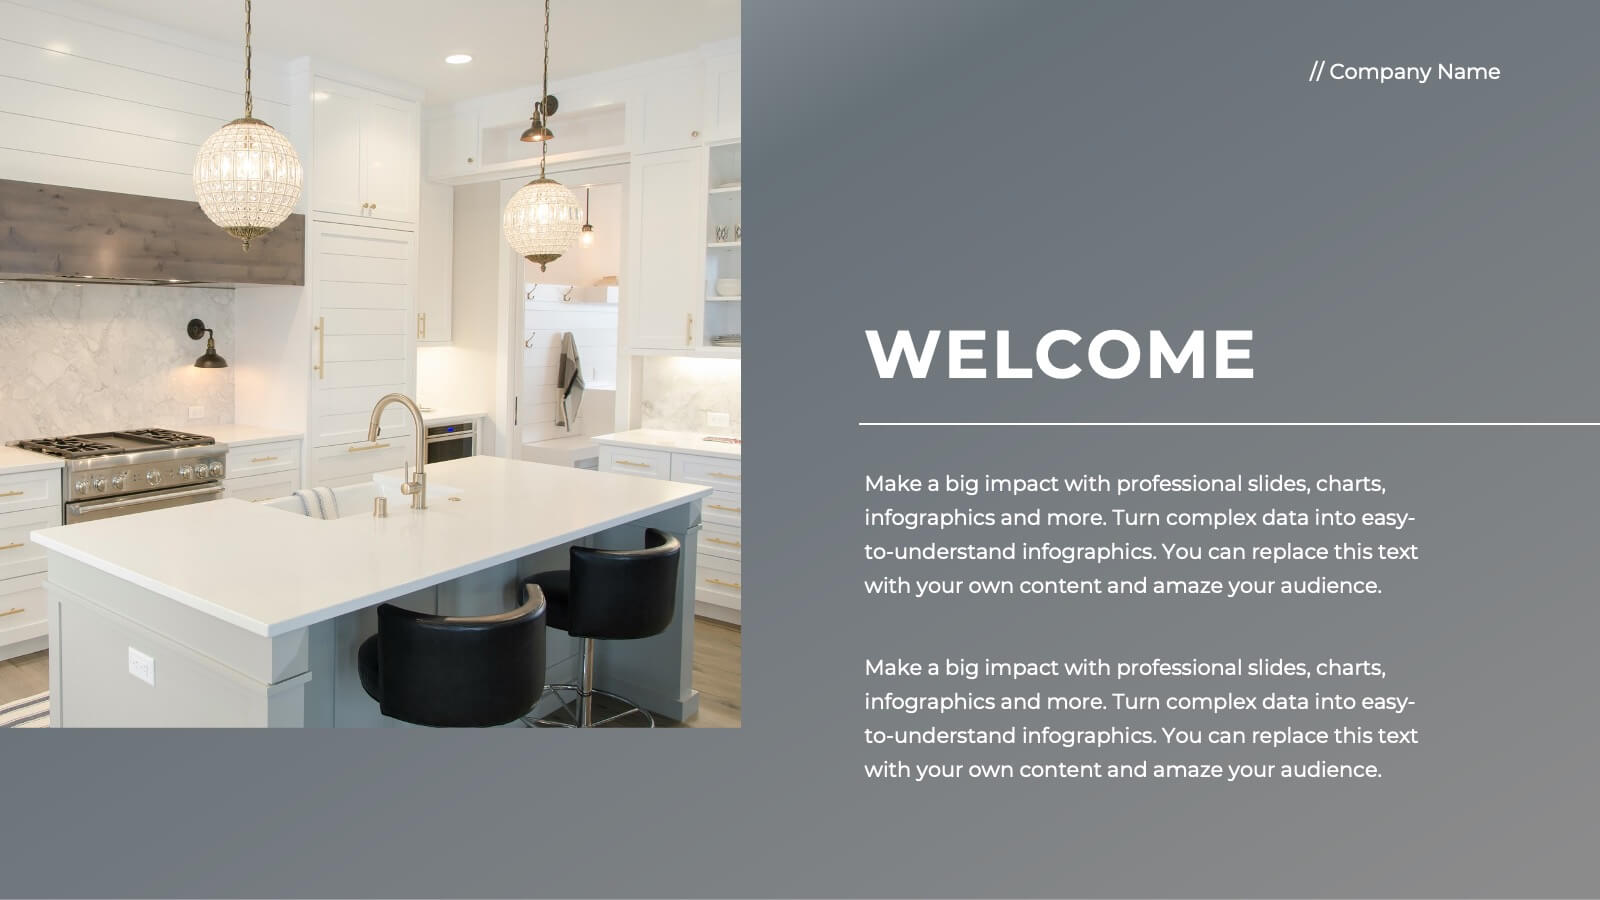
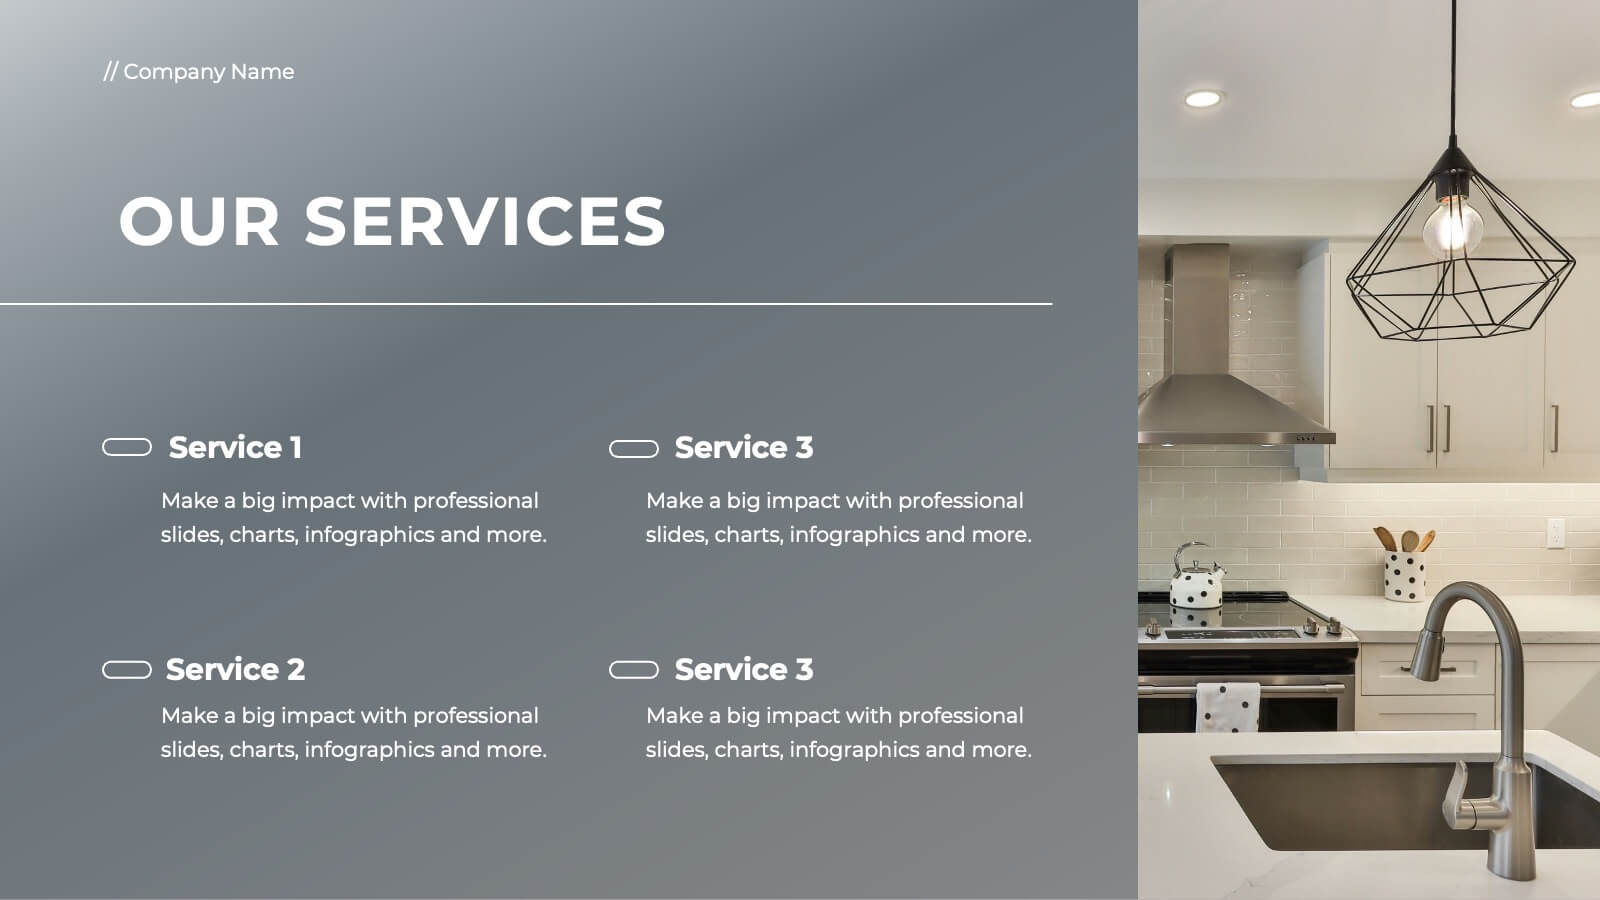
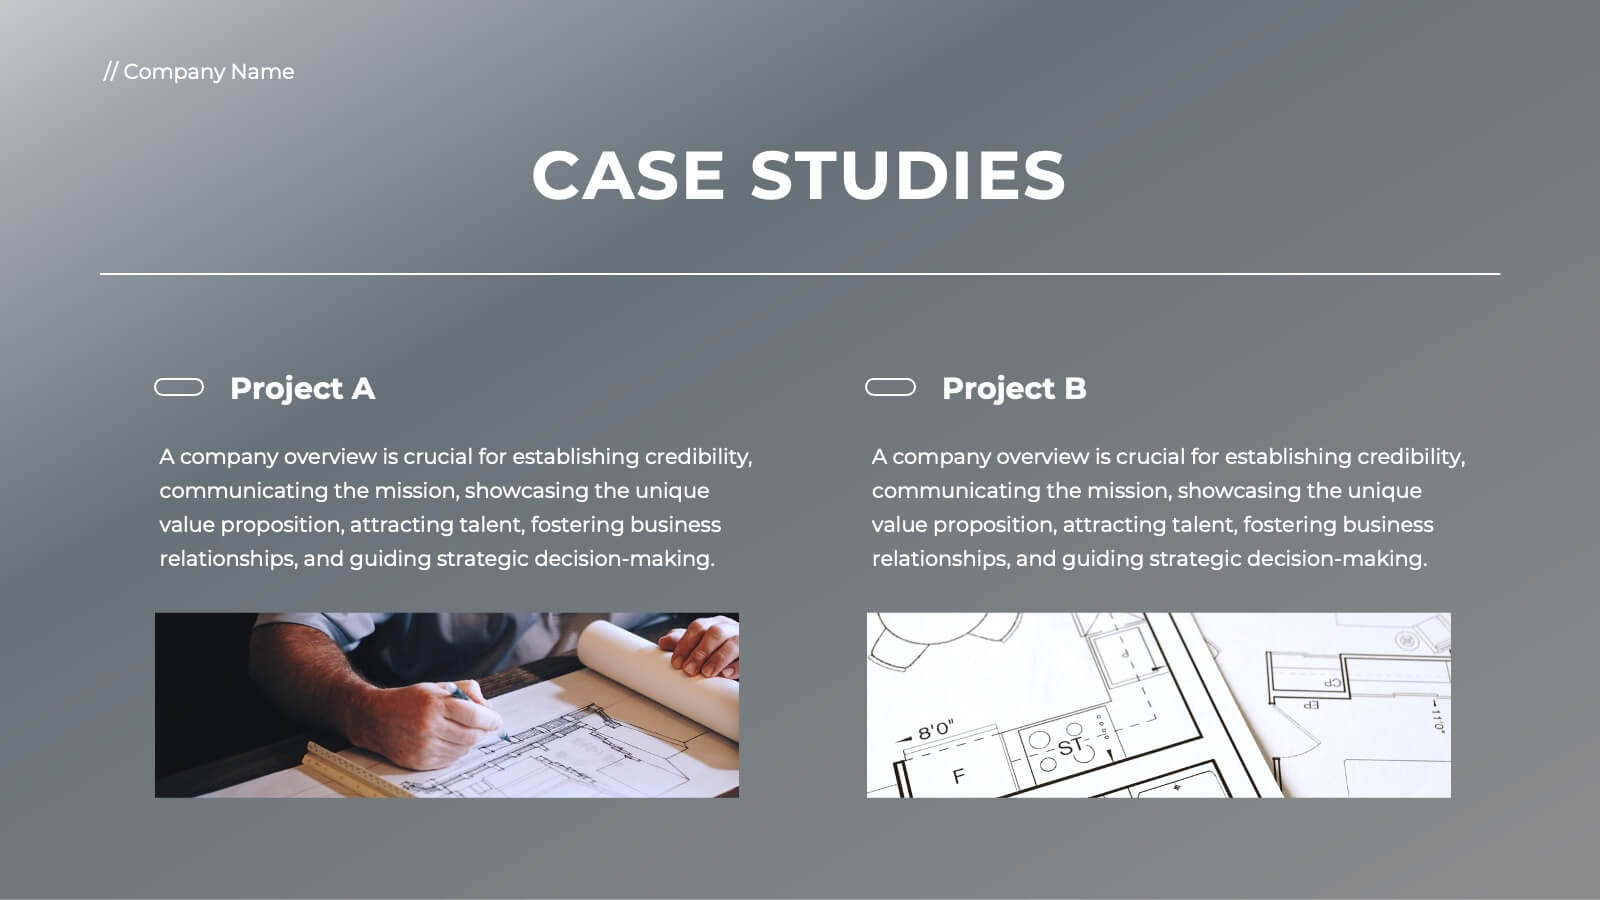
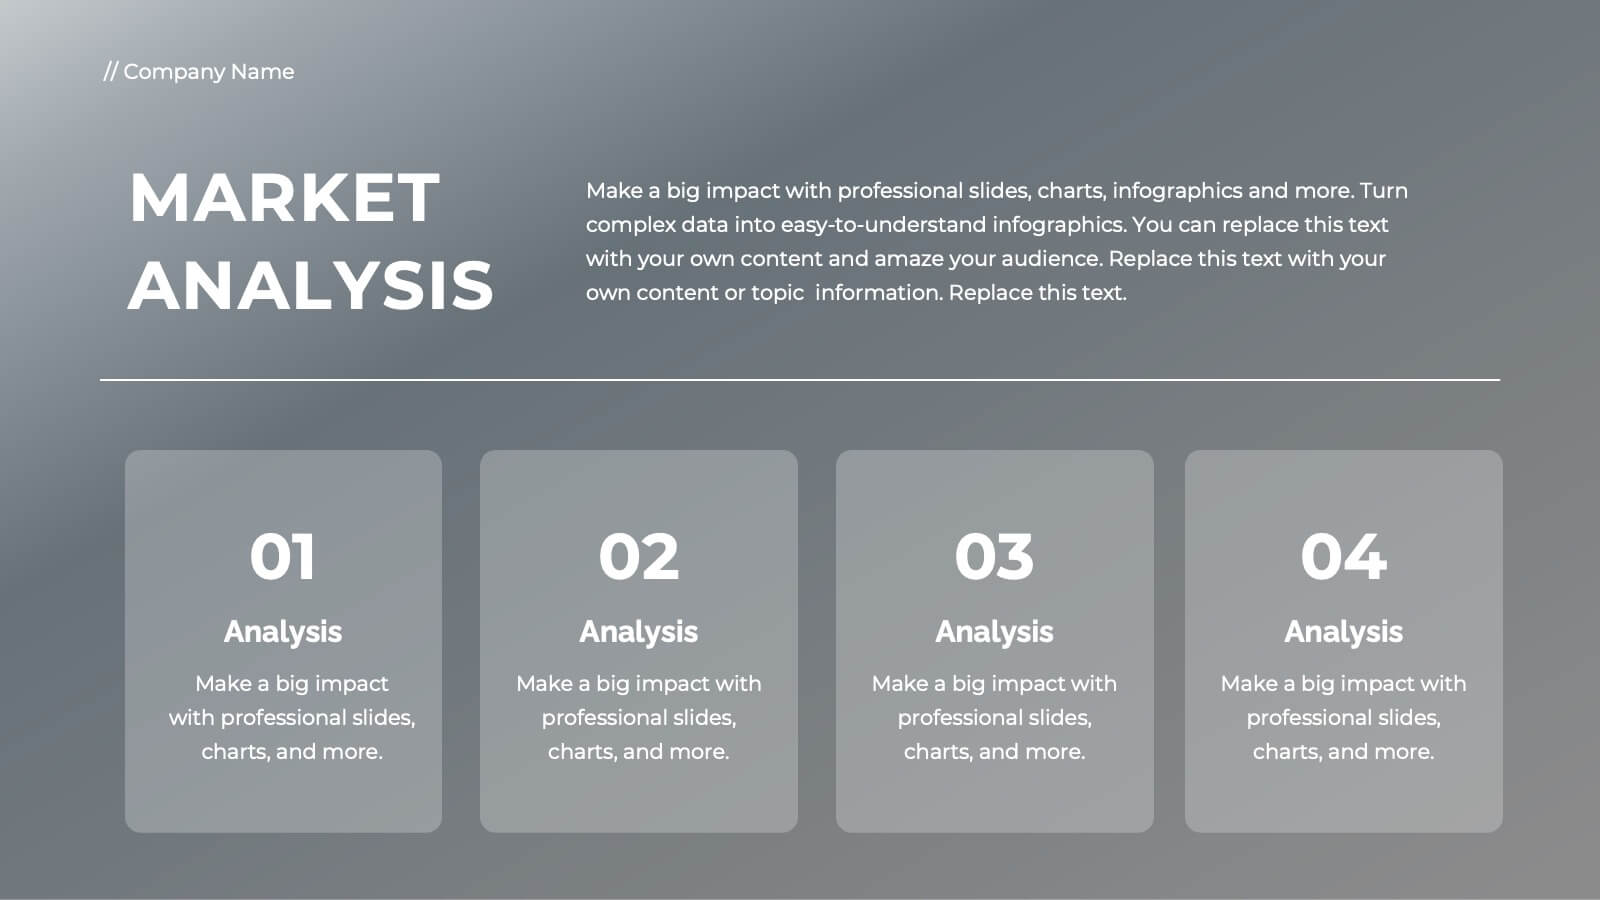
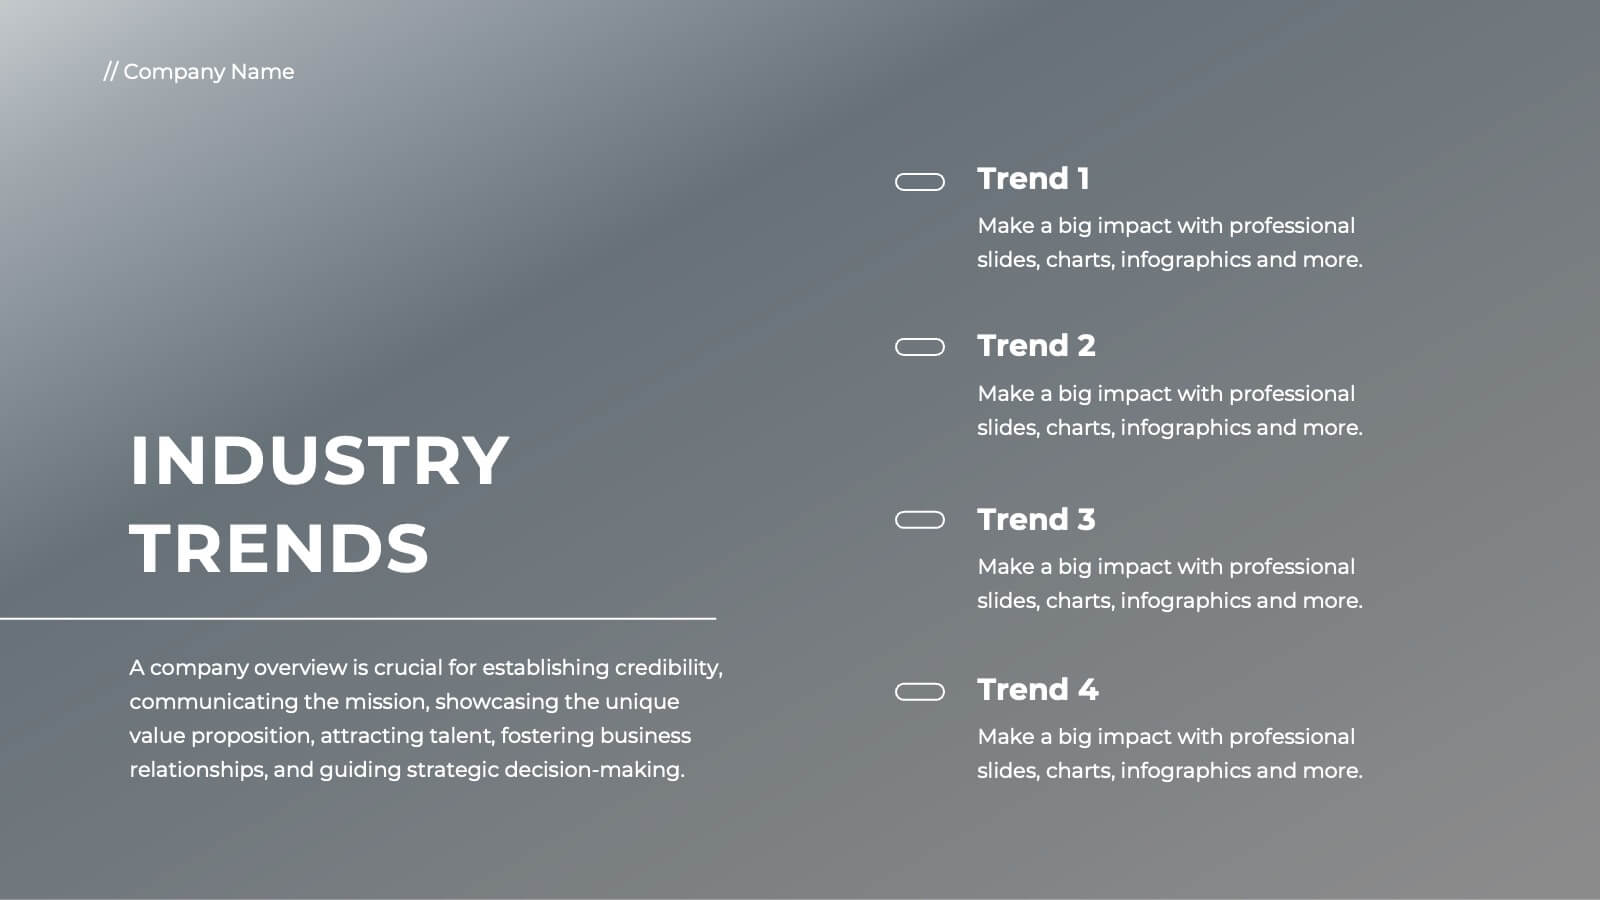
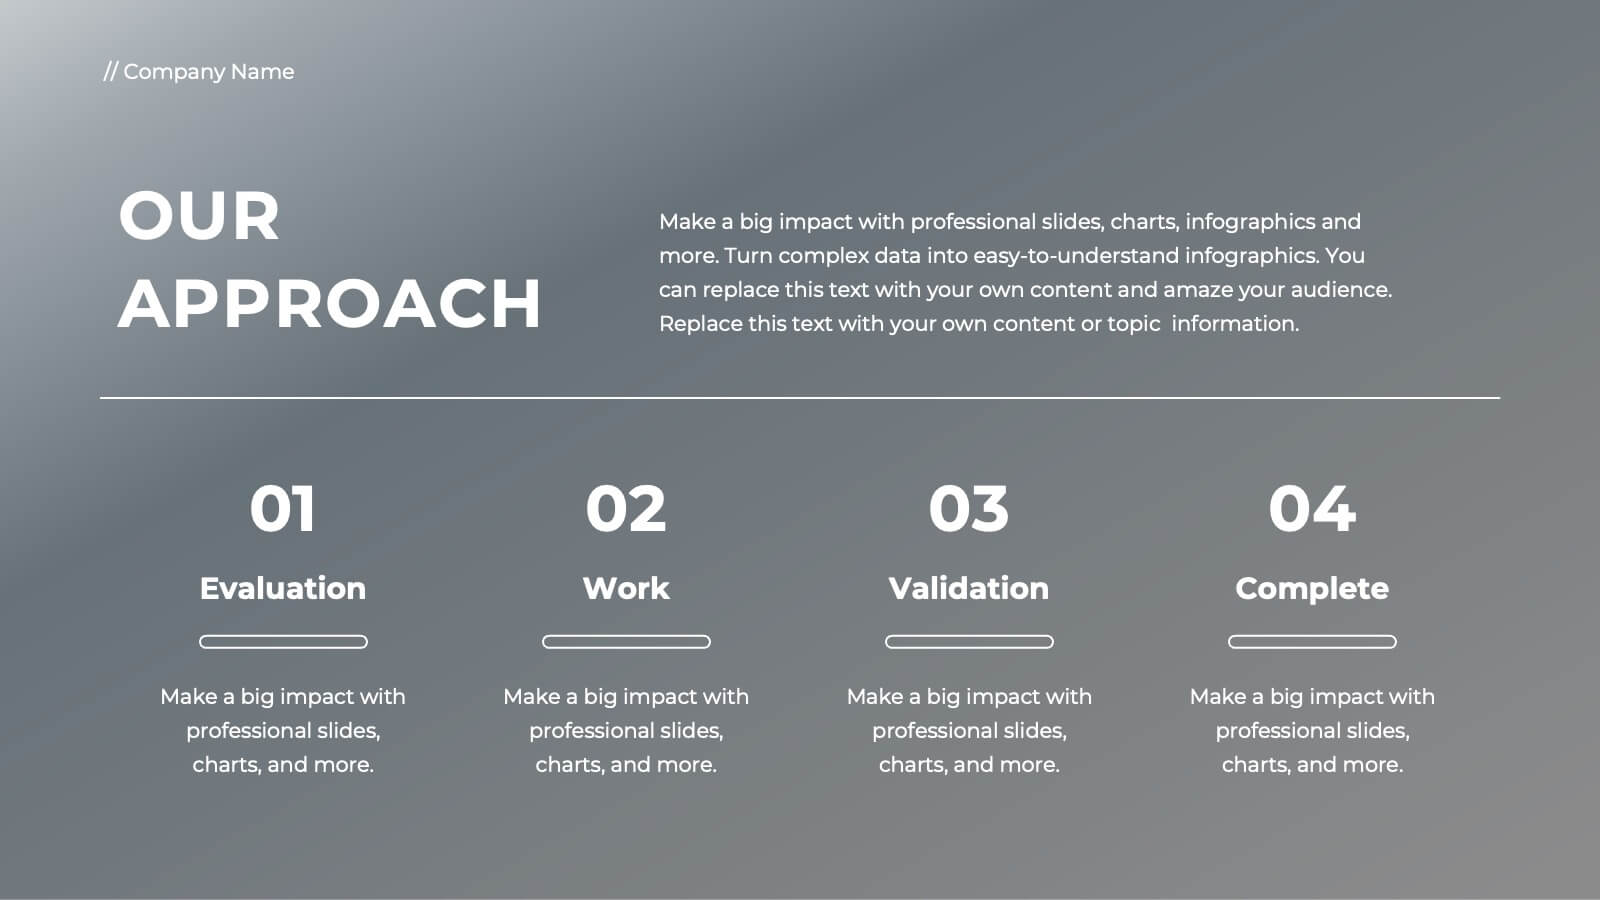
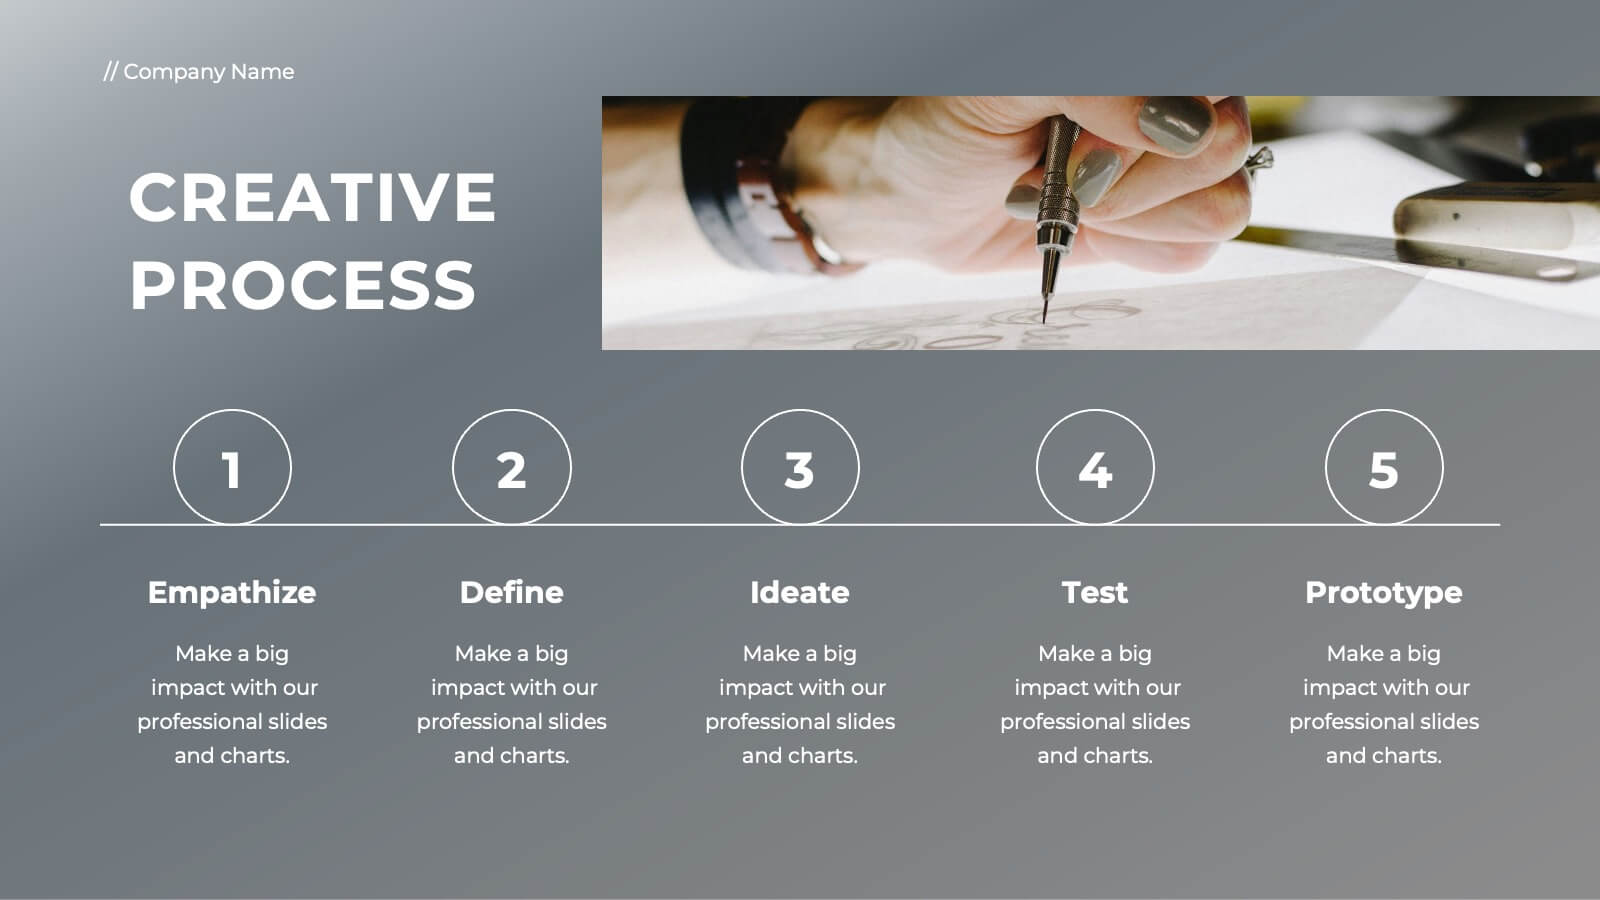
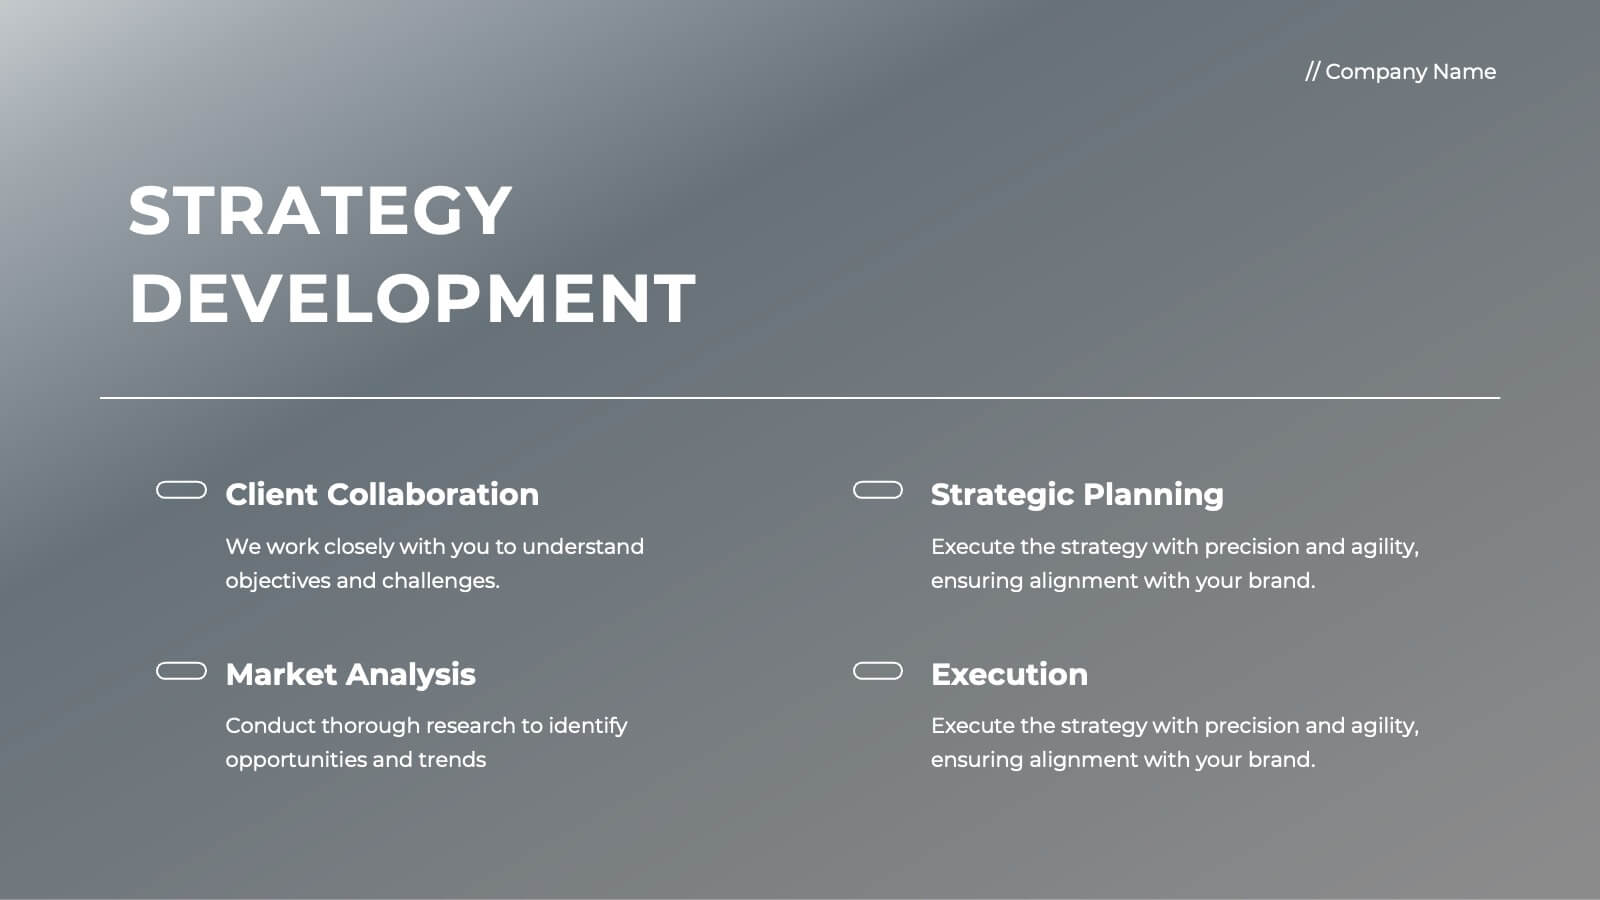
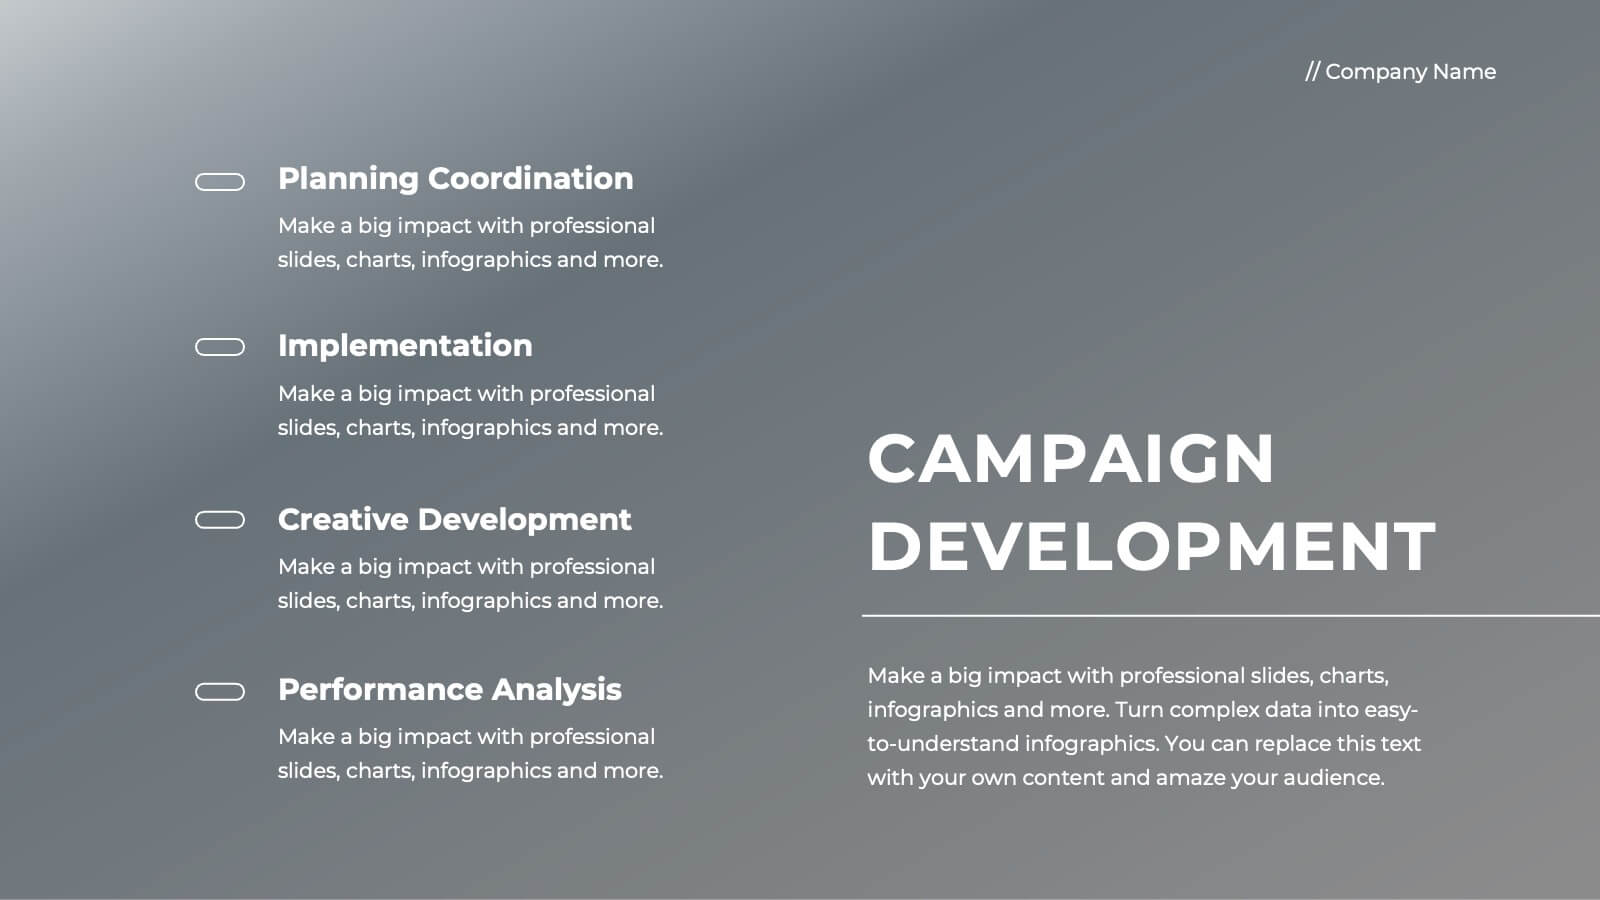
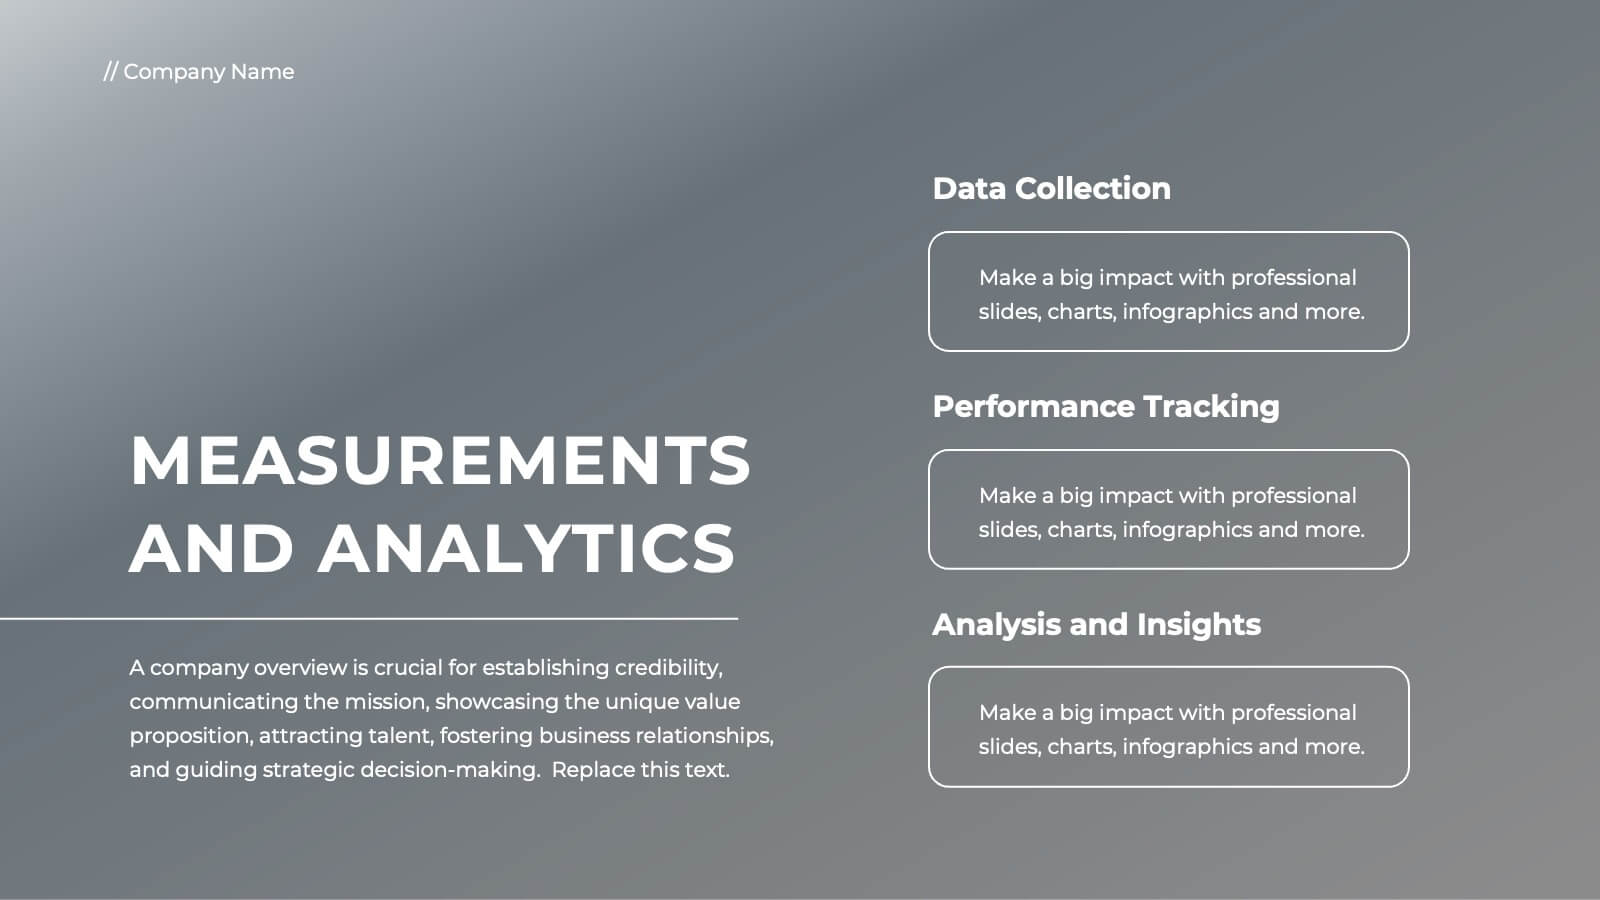
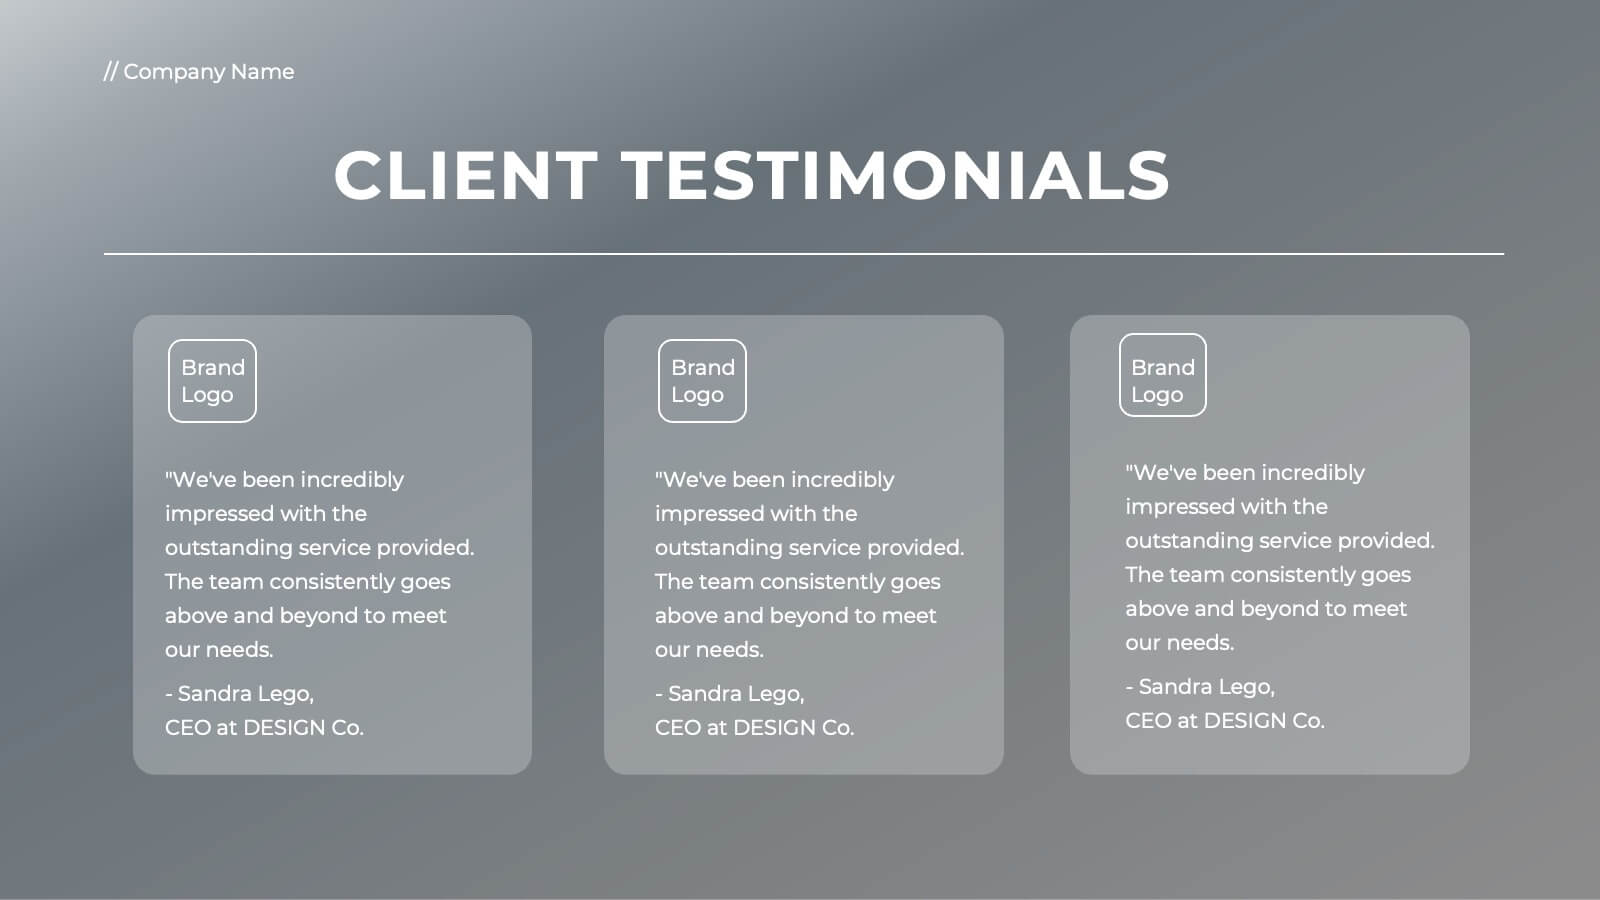
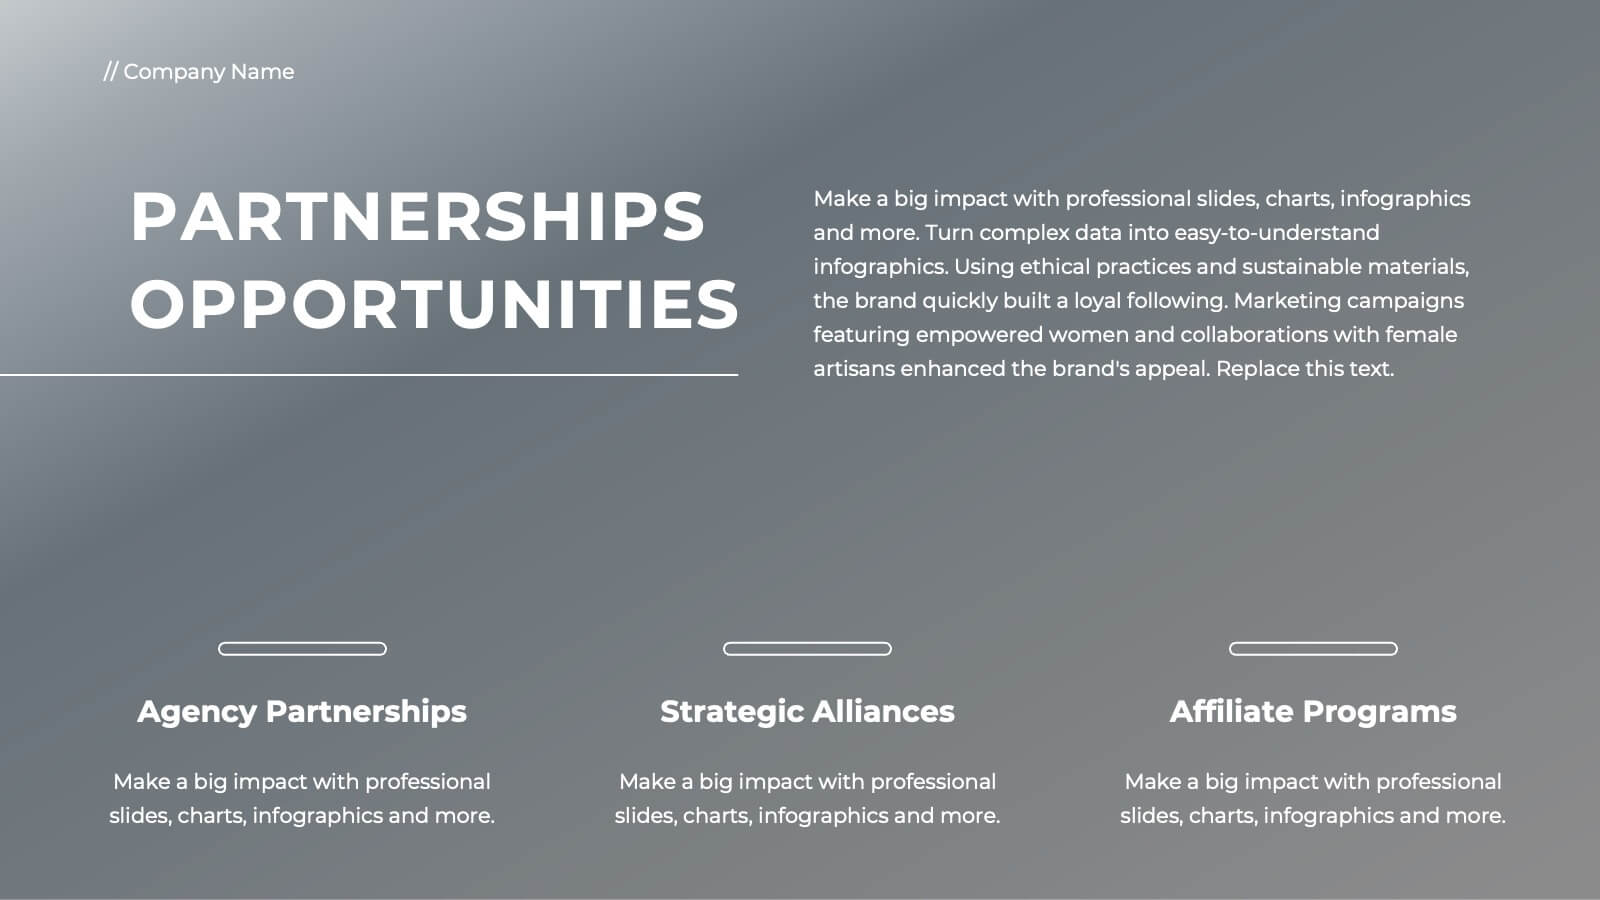
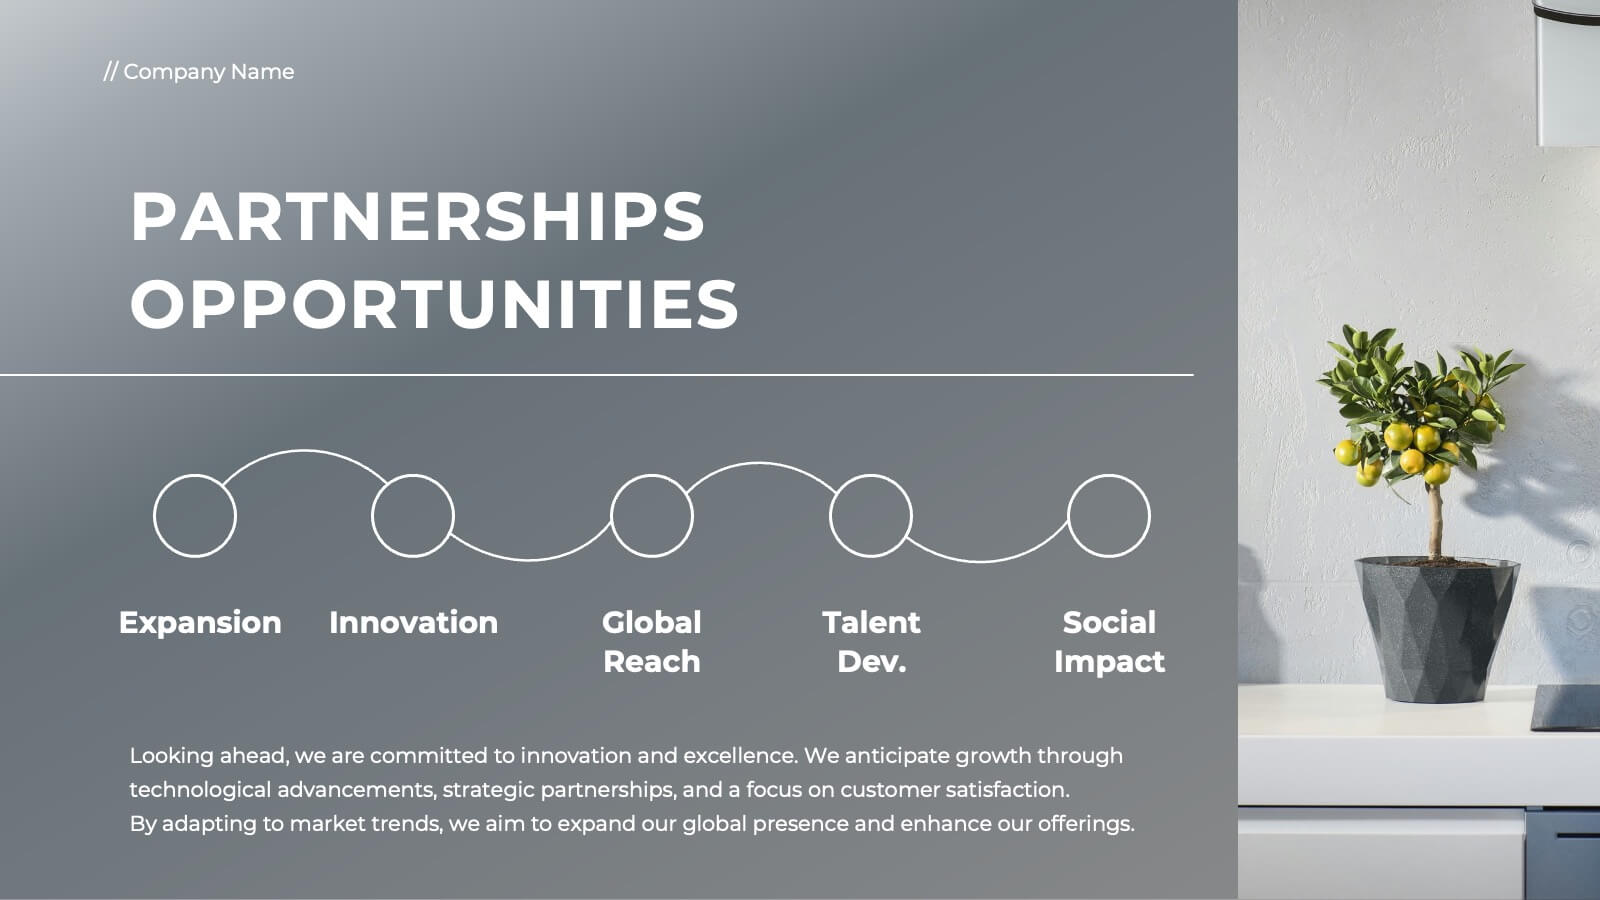
Ember Full-Service Agency Project Plan Presentation
Elevate your agency's presentation with this sleek project plan template! Ideal for showcasing your team's vision, market analysis, and client success stories, it includes slides for strategic development, campaign execution, and partnerships. Impress clients and stakeholders with professional visuals and detailed content. Compatible with PowerPoint, Keynote, and Google Slides for seamless presentations on any platform.


14 diapositivas
Key Takeaways Summary Presentation
Summarize important insights effectively with this key takeaways summary template! Designed to highlight crucial points in a visually engaging format, this layout is perfect for reports, presentations, and meetings. Keep your audience focused on the most valuable information. Fully customizable and compatible with PowerPoint, Keynote, and Google Slides.


3 diapositivas
Stock Market Investment Analysis Presentation
Unlock the secrets of the stock market with our "Stock Market Investment Analysis" presentation templates. Ideal for financial analysts and investors, these templates provide a clear framework for analyzing trends and making informed decisions. With easy-to-edit elements and professional design, they are perfect for delivering compelling investment insights. Compatible with PowerPoint, Keynote, and Google Slides, they ensure your analysis looks sharp and persuasive across all platforms.


10 diapositivas
Chronological Event Timeline Presentation
Present events with clarity using this linear timeline slide. Ideal for showcasing project milestones, historical developments, or sequential achievements. Features 5 editable points with icons, titles, and dates for easy customization. Compatible with PowerPoint, Keynote, and Google Slides—perfect for planners, managers, educators, and strategists needing organized time-based visuals.


4 diapositivas
Cloud Computing IT Architecture Presentation
Enhance your Cloud Computing IT Architecture presentations with this dynamic layered cloud infographic. Perfect for visualizing cloud storage and security frameworks, this template is fully customizable and compatible with PowerPoint, Keynote, and Google Slides.


5 diapositivas
Predictive Analytics with Big Data
Break down complex predictive data processes with this layered diagram designed for big data professionals, analysts, and AI teams. Clearly illustrate multi-level data pipelines and machine learning systems in an engaging, structured format. Fully customizable in PowerPoint, Keynote, and Google Slides.


4 diapositivas
Risk Impact Matrix Grid Presentation
Visualize project risk with this customizable impact matrix grid. Designed for quick risk assessment, it helps you map likelihood versus impact using color-coded indicators and clean grid layouts. Ideal for strategic planning, audits, or compliance meetings. Compatible with PowerPoint, Google Slides, and Keynote for seamless editing and professional presentations.


6 diapositivas
Innovation-Driven Culture and Vision
Present your strategy with clarity using the Innovation-Driven Culture and Vision Presentation. This clean, modern layout features five vertical icon markers to highlight key pillars of innovation. Ideal for leadership talks or team strategy meetings. Fully customizable in PowerPoint, Keynote, and Google Slides for easy edits and branding.


4 diapositivas
Business Cycle Diagram Overview Presentation
Illustrate your business processes with this modern cycle diagram template. Designed to showcase four interconnected stages, it’s ideal for visualizing workflows, project phases, or continuous improvement models. Fully editable in Canva, PowerPoint, and Google Slides, this template helps you present complex cycles with clarity and visual impact.