


Características


¿Tienes alguna pregunta?
Recomendar


5 diapositivas
Retention and Loyalty Program Benefits Presentation
Showcase the value of your loyalty strategy with the Retention and Loyalty Program Benefits presentation. This template clearly communicates reward tiers, membership perks, and engagement incentives using a card-based visual structure. Perfect for marketing presentations, customer success teams, and subscription-based business models. Fully customizable in PowerPoint, Keynote, and Google Slides.


6 diapositivas
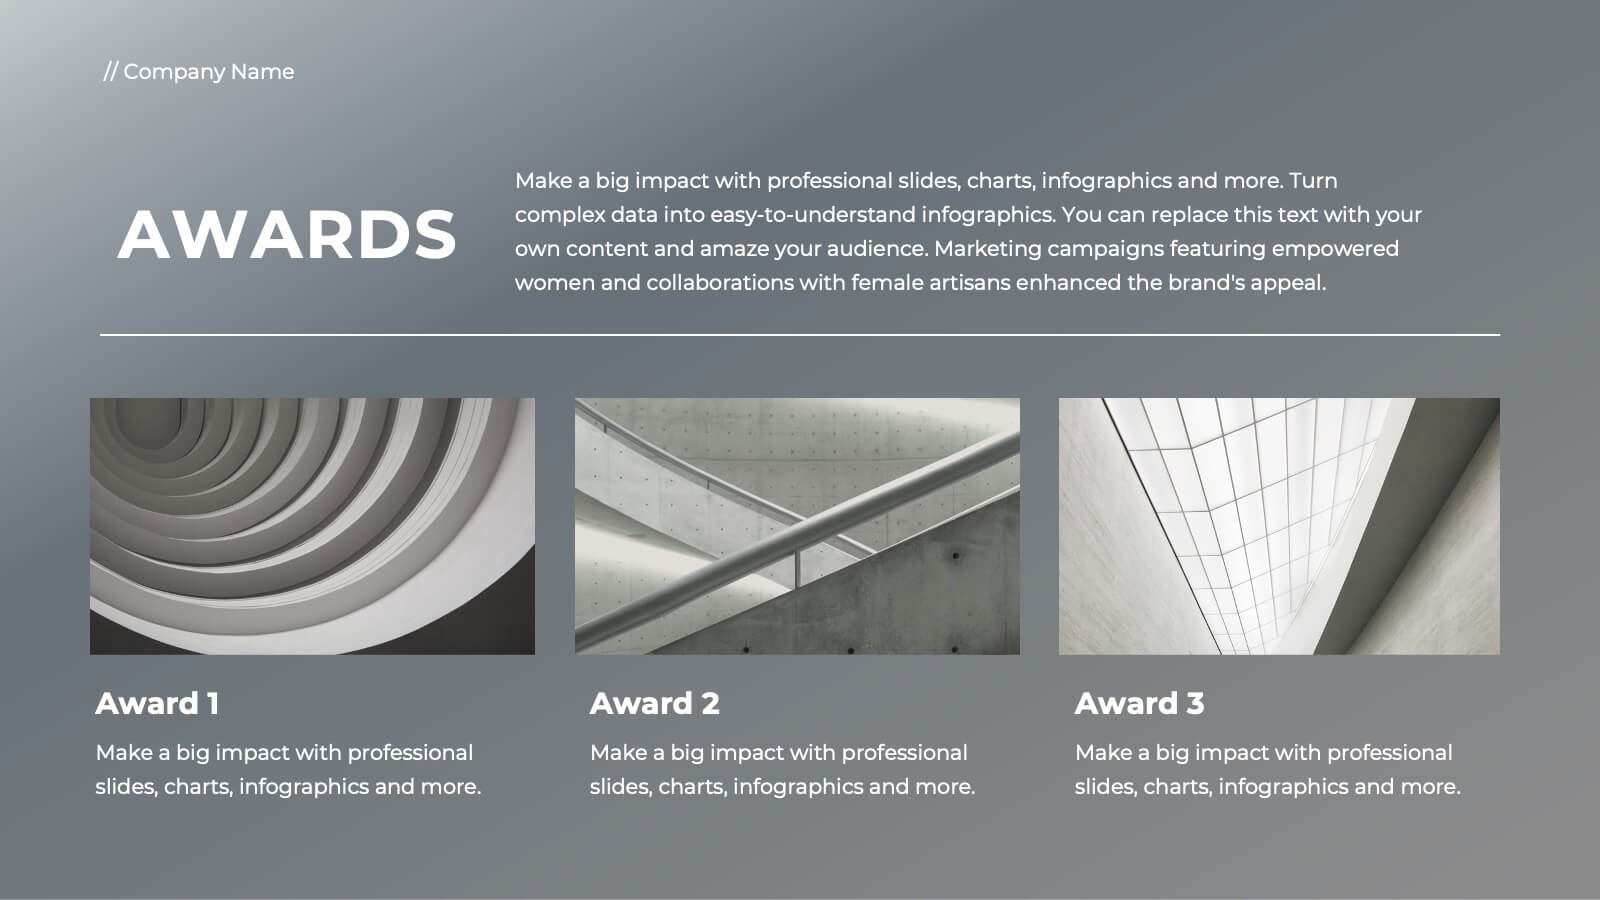
Top Benefits Breakdown Presentation
Showcase your strongest advantages with a clean, structured layout that highlights each benefit clearly and effectively. This modern design is perfect for presenting key selling points, service features, or strategic highlights in a professional way. Fully customizable and compatible with PowerPoint, Keynote, and Google Slides for seamless editing and presentation.


22 diapositivas
Calcifis Qualitative Research Findings Presentation
Present your research insights with clarity and impact using this modern and engaging presentation template. Cover key areas such as research objectives, methodology, data analysis, key findings, limitations, and recommendations. The visually appealing design helps you communicate complex qualitative data effectively, making it ideal for academic, business, and market research presentations. Fully customizable and compatible with PowerPoint, Keynote, and Google Slides.


12 diapositivas
Creative Mind Map Presentation
Unlock new perspectives with the Creative Mind Map Presentation. Designed to visualize brainstorming, strategic thinking, or concept development, this template offers an intuitive radial layout to highlight five key ideas. Fully customizable and ideal for professionals, educators, and creatives. Compatible with PowerPoint, Keynote, and Google Slides for seamless use.


6 diapositivas
Data Science and AI Big Data Presentation
Transform complex data concepts into engaging visuals with the Data Science and AI Big Data Presentation. This fully editable template highlights key areas such as machine learning, predictive analytics, automation, and data-driven decision-making. Perfect for data analysts, AI specialists, and business leaders, it’s available for PowerPoint, Keynote, and Google Slides, ensuring a modern and structured presentation.


22 diapositivas
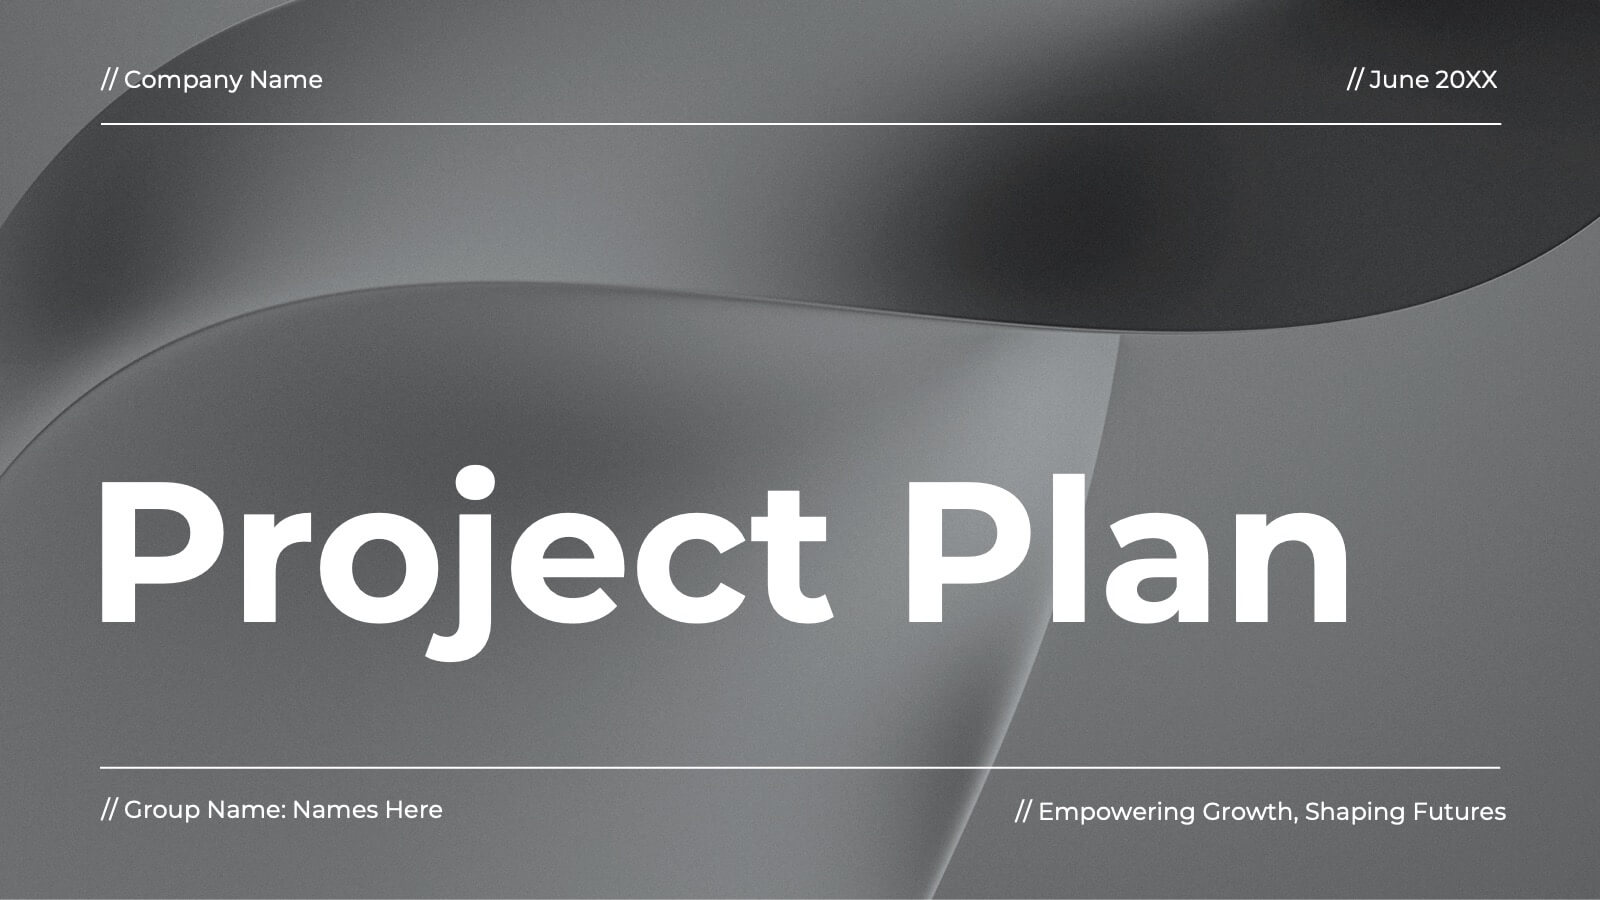
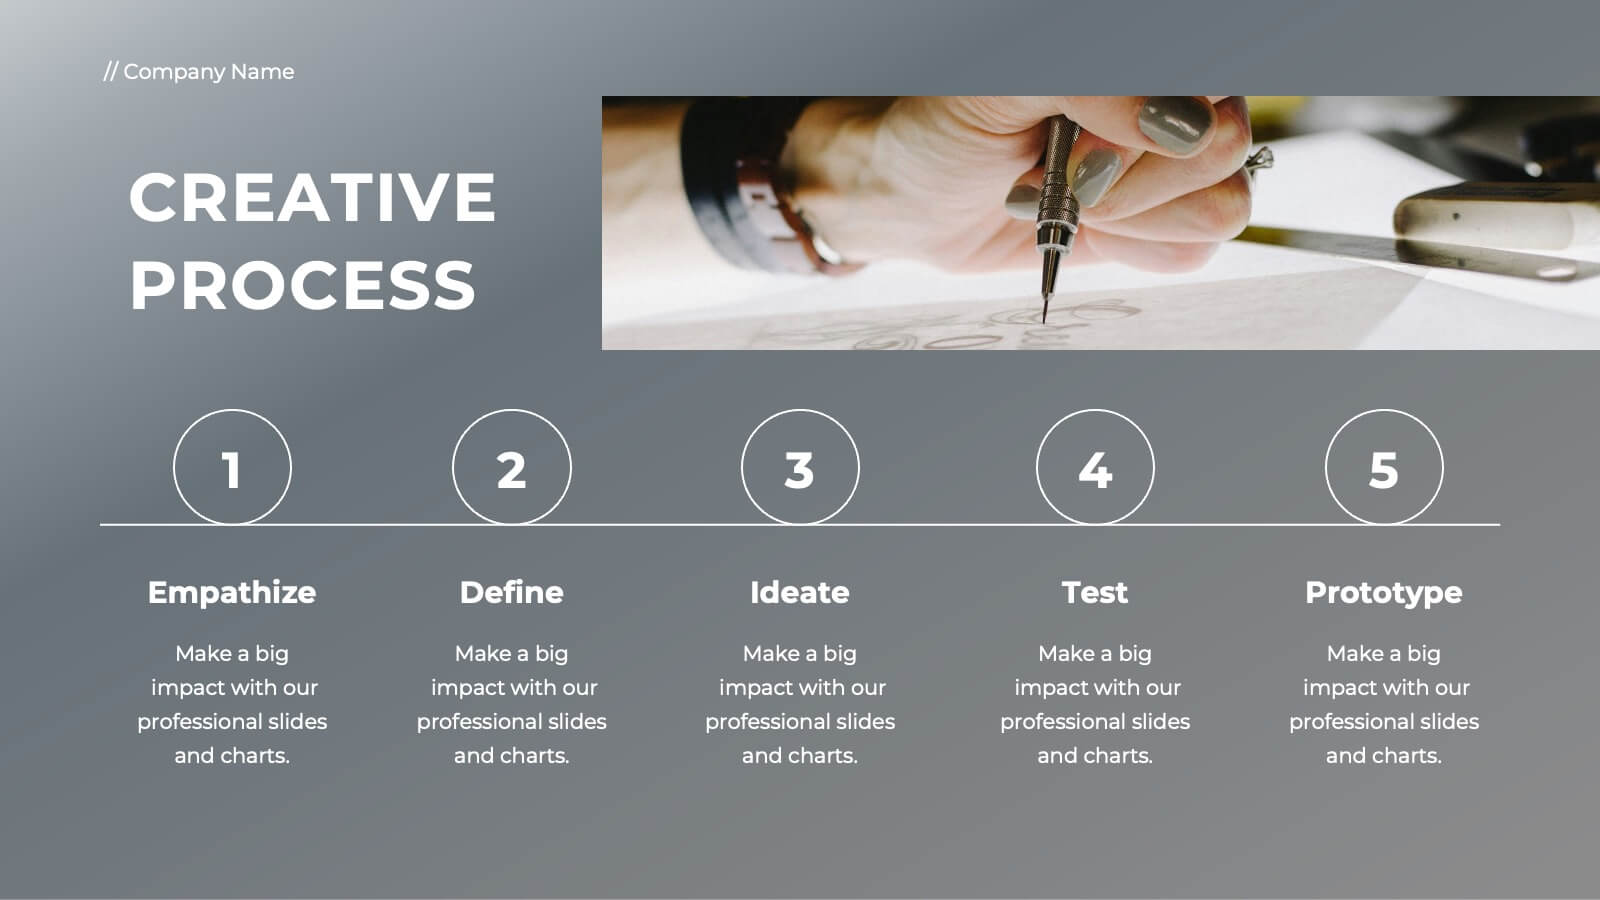
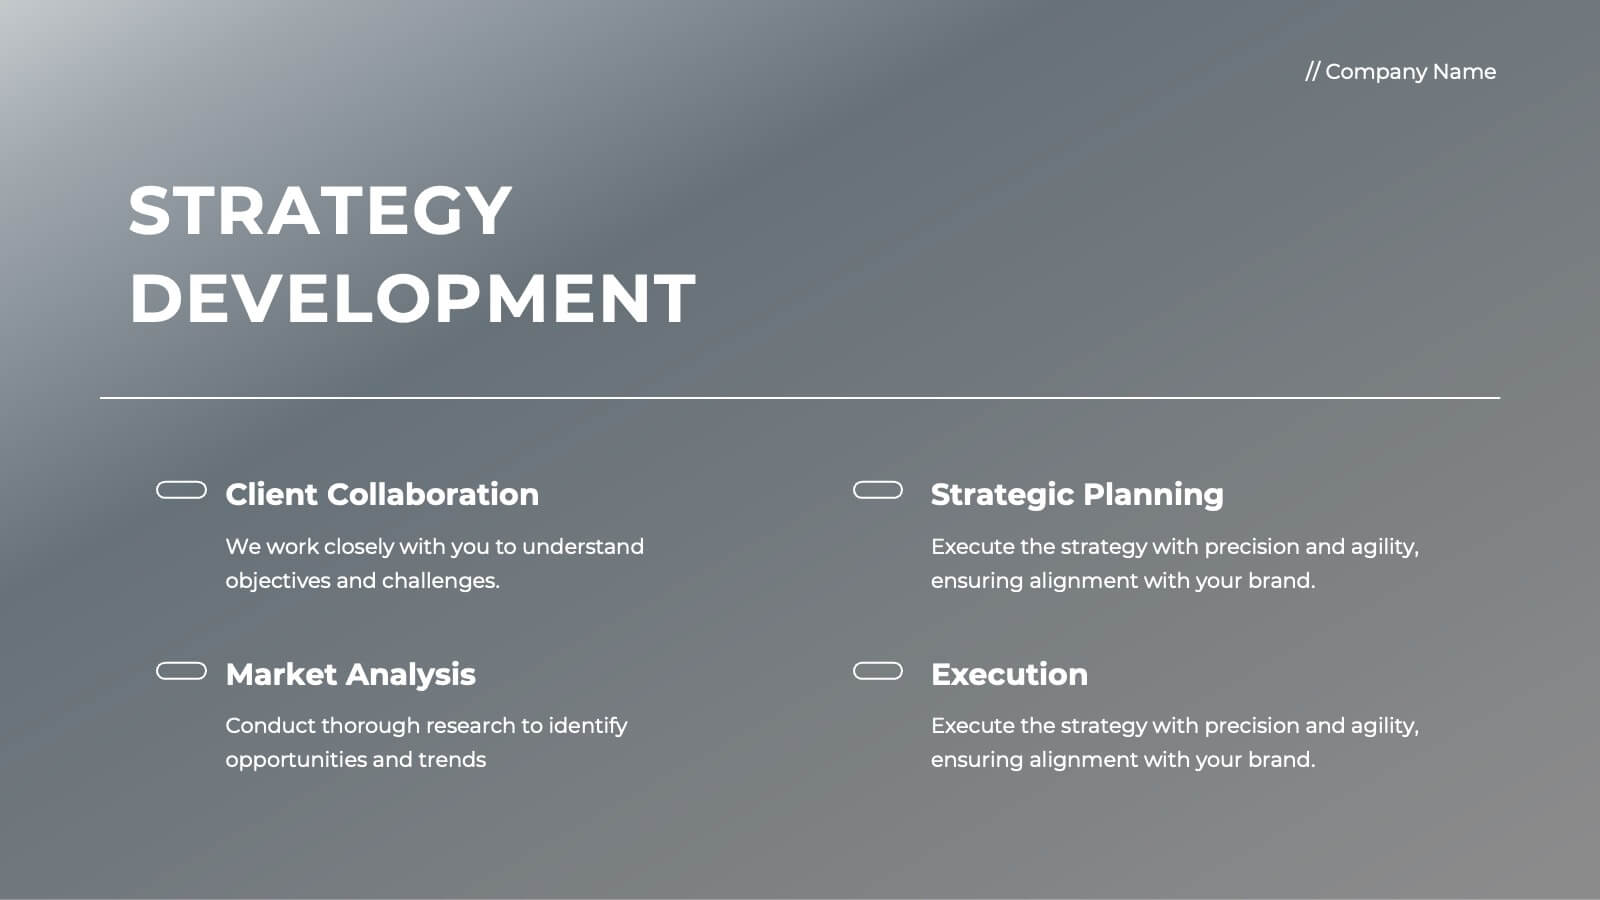
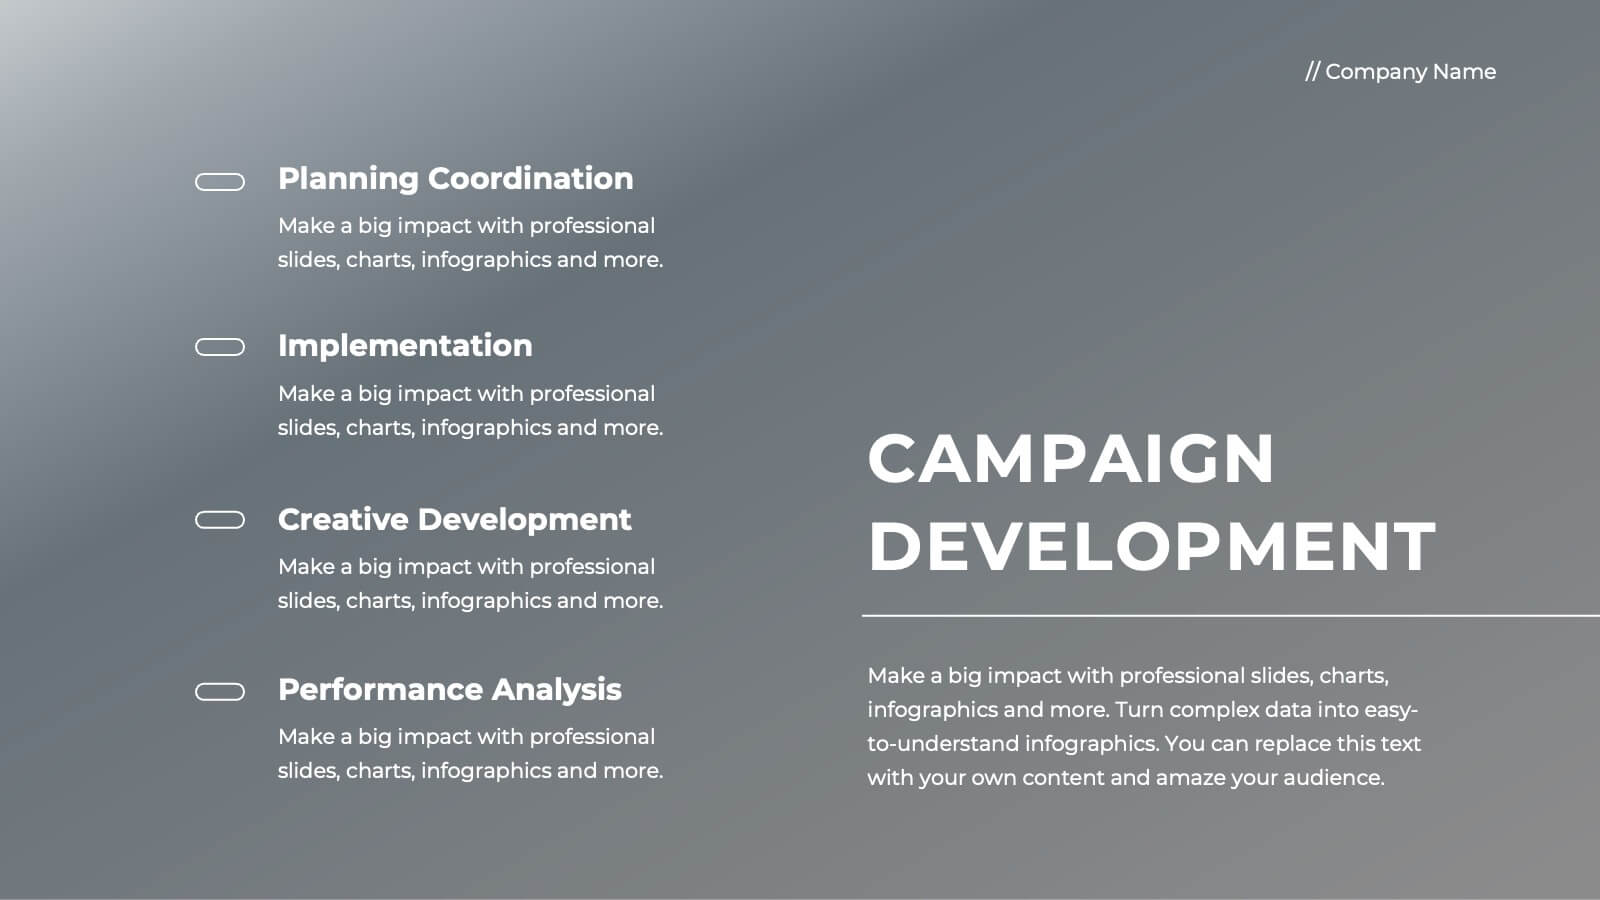
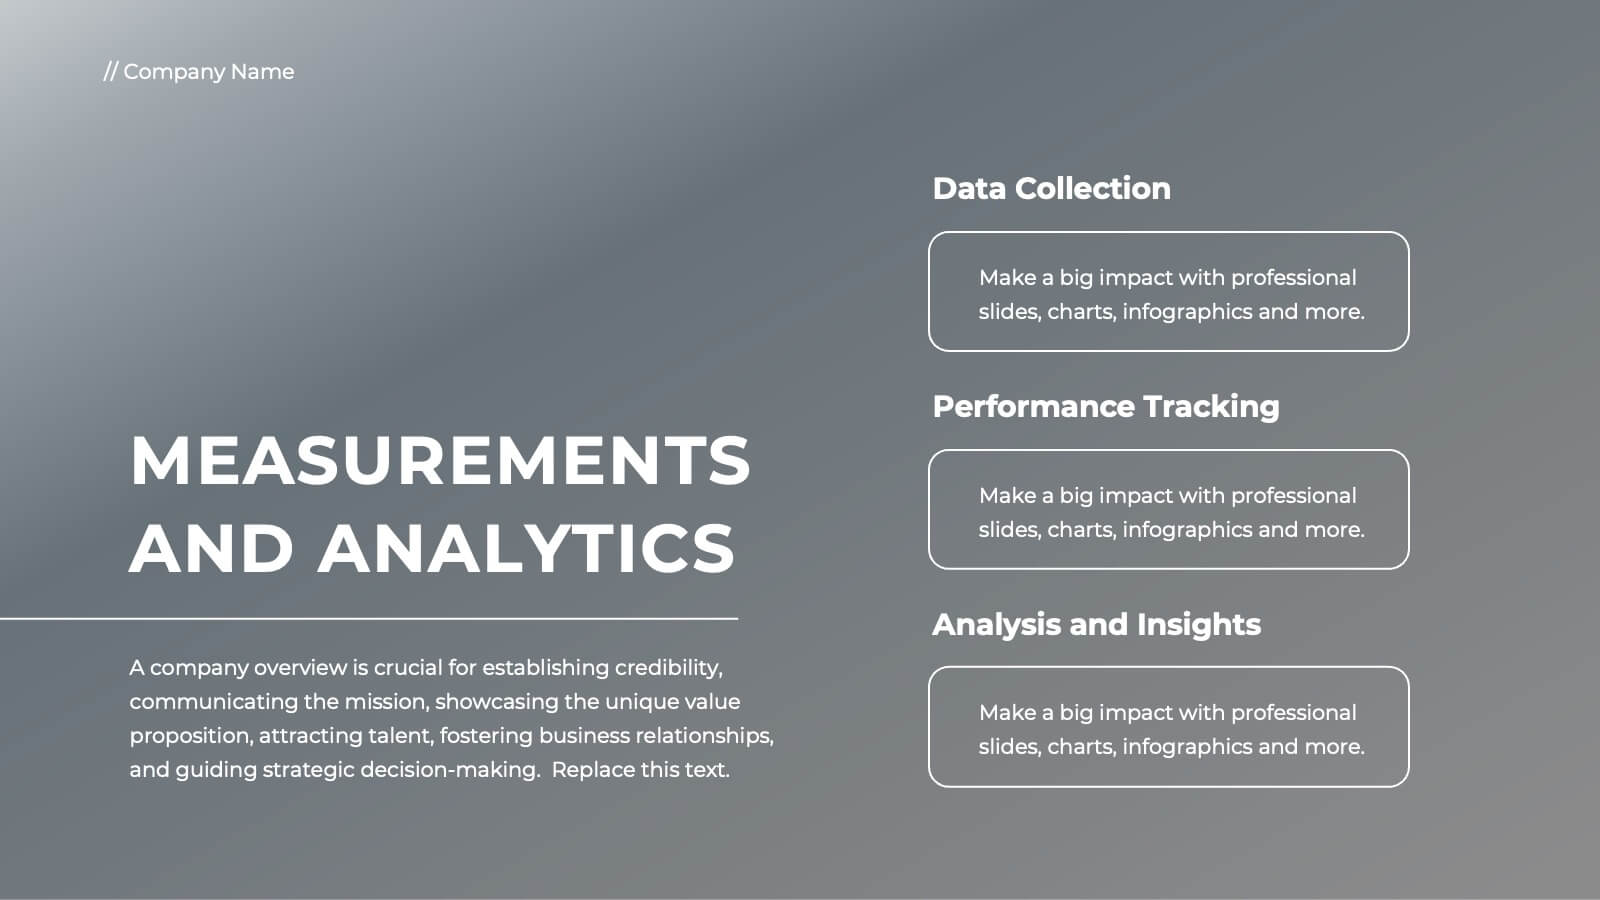
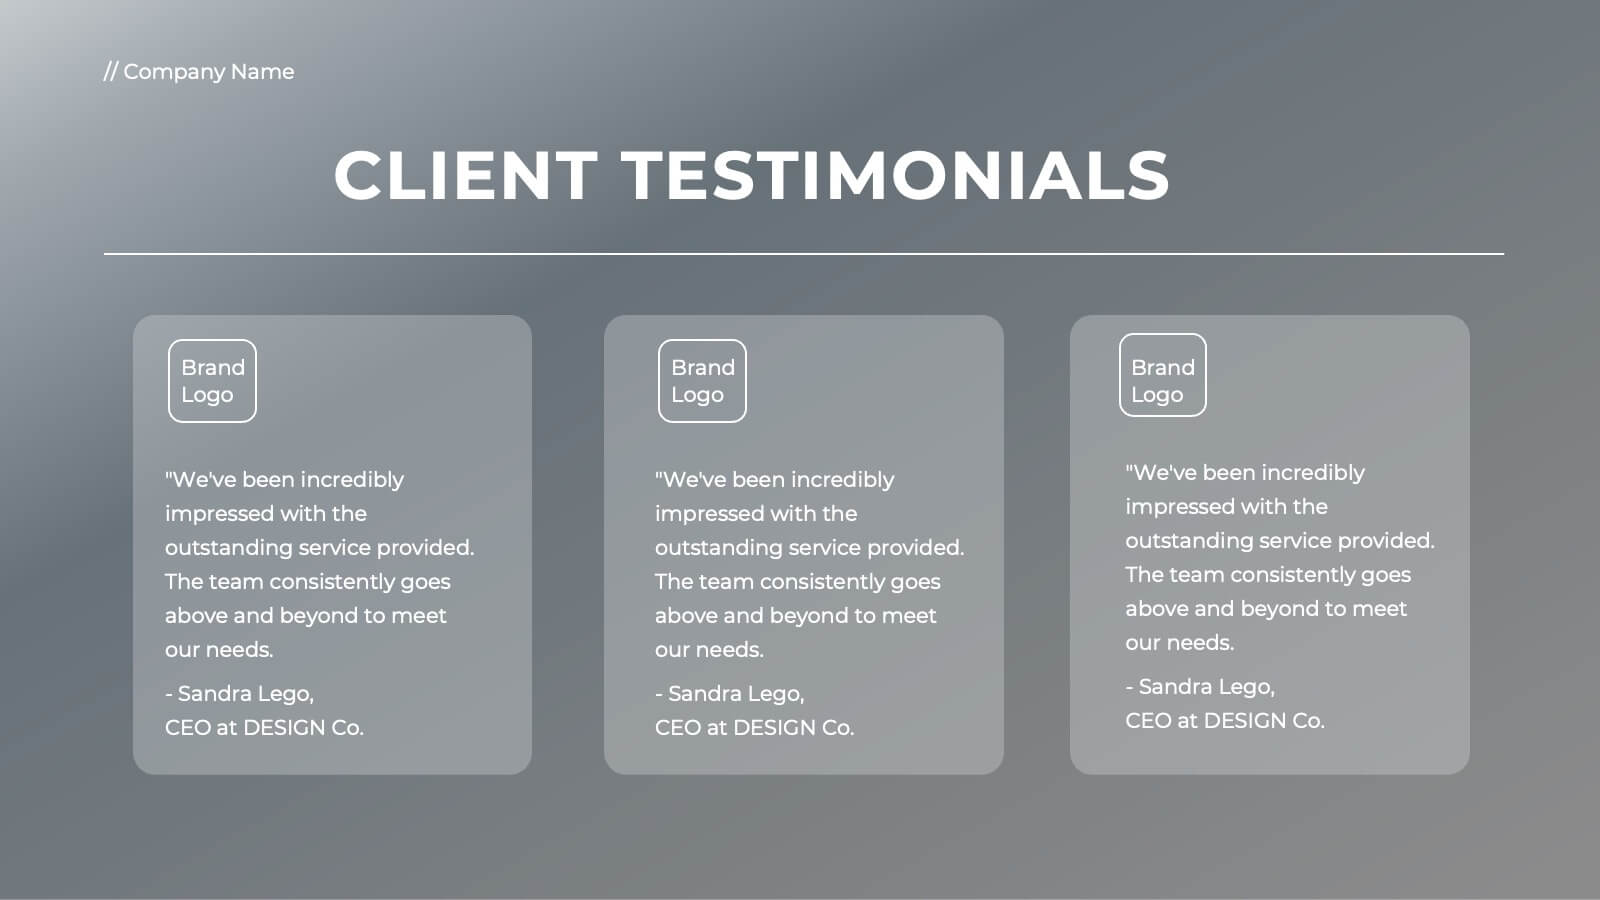
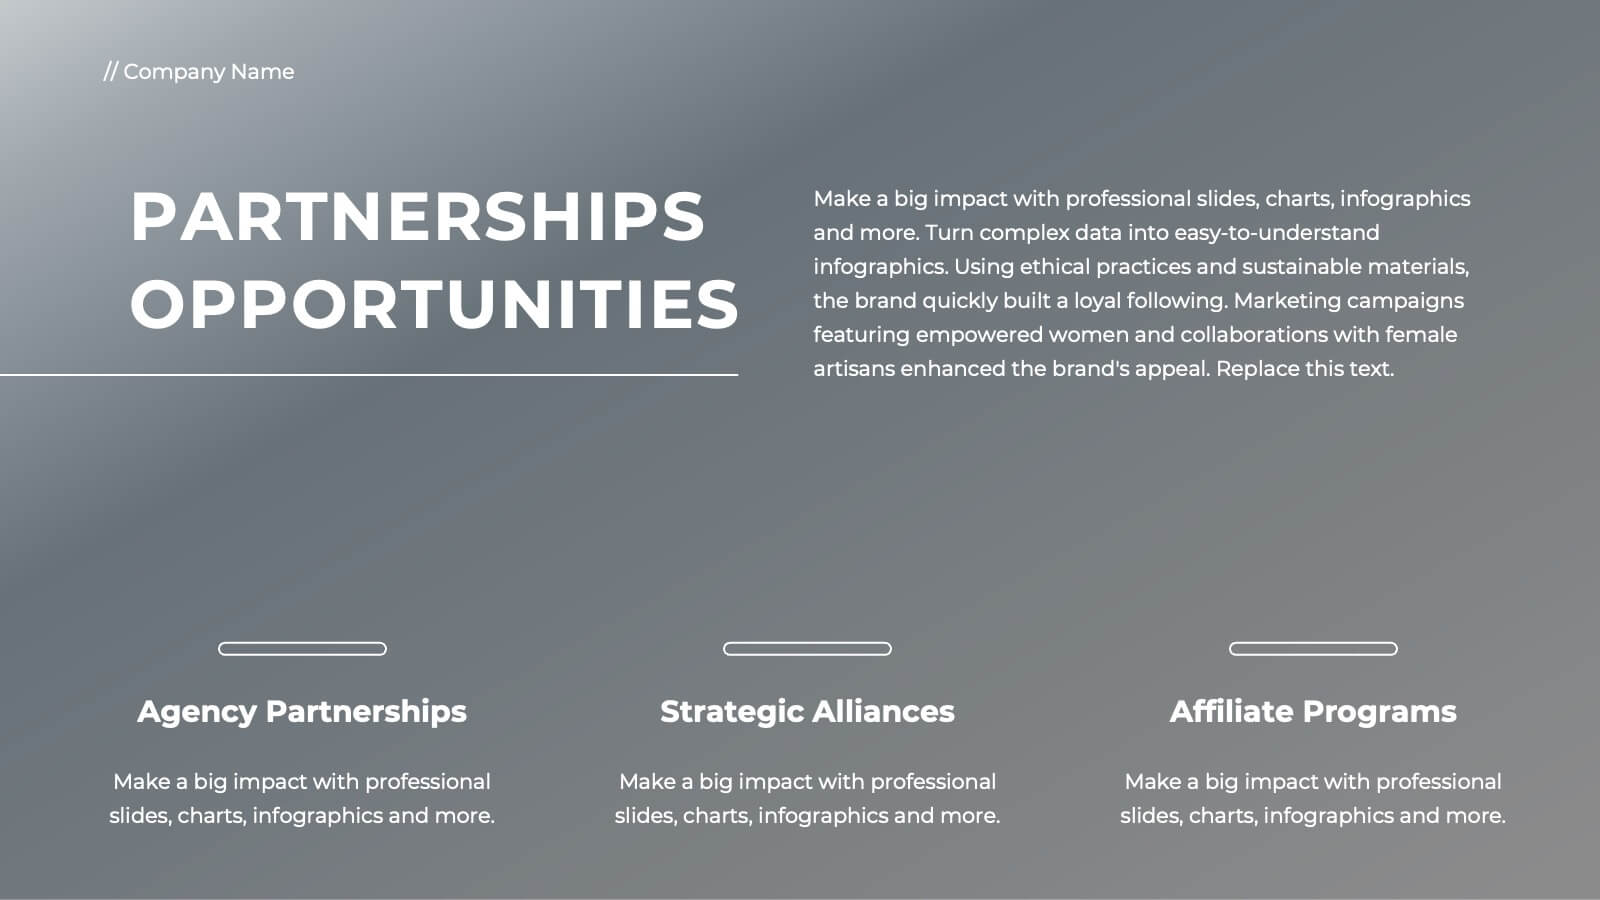
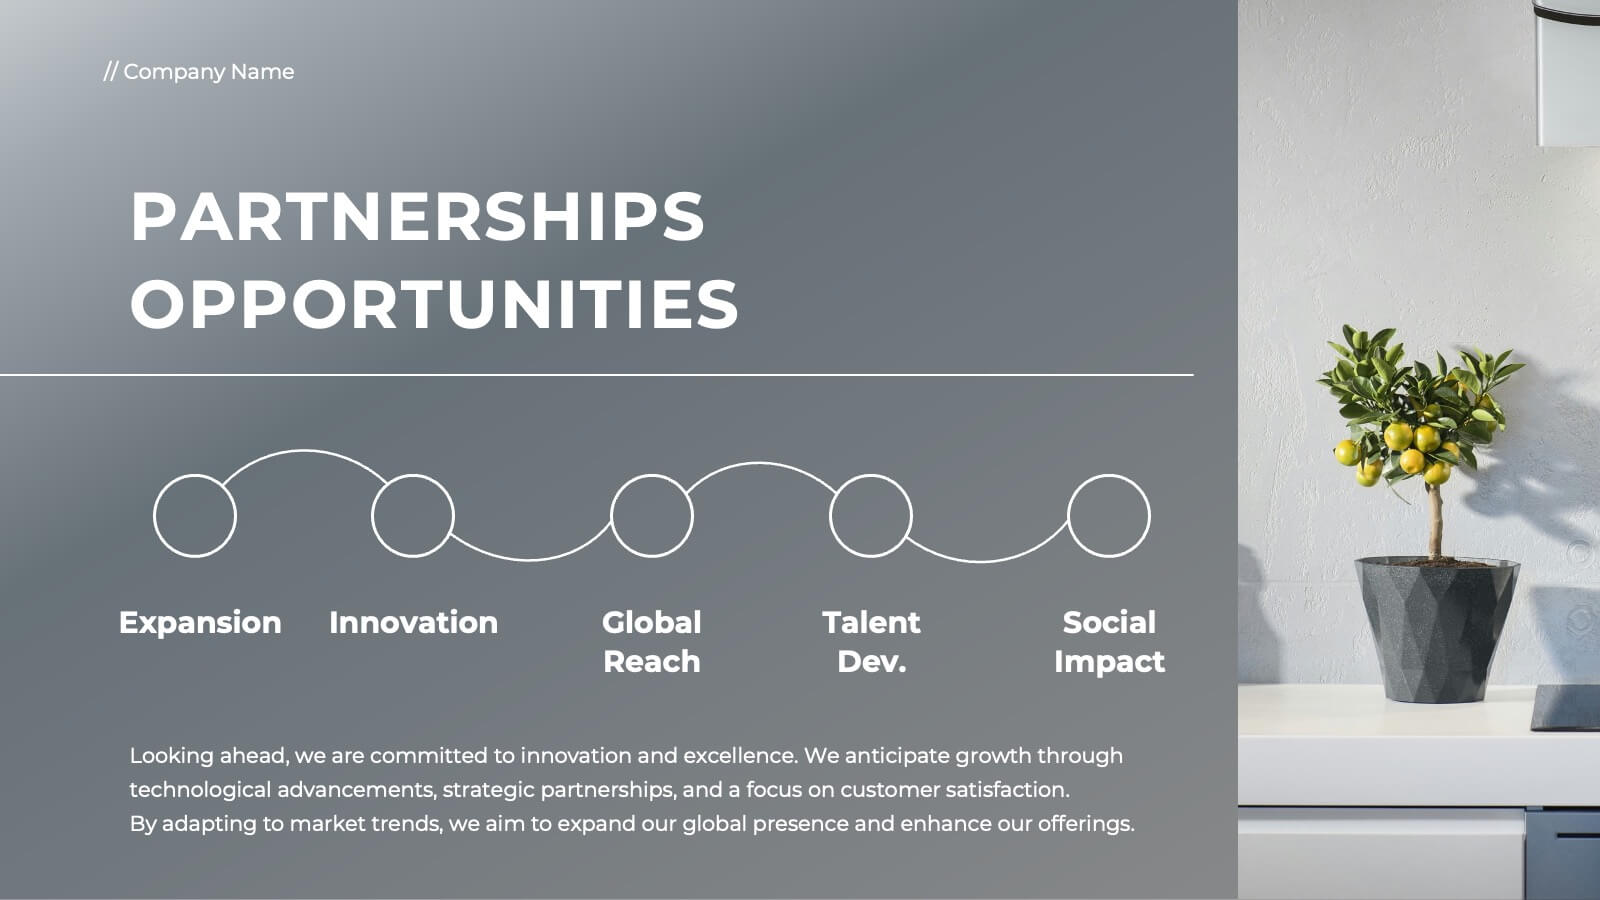
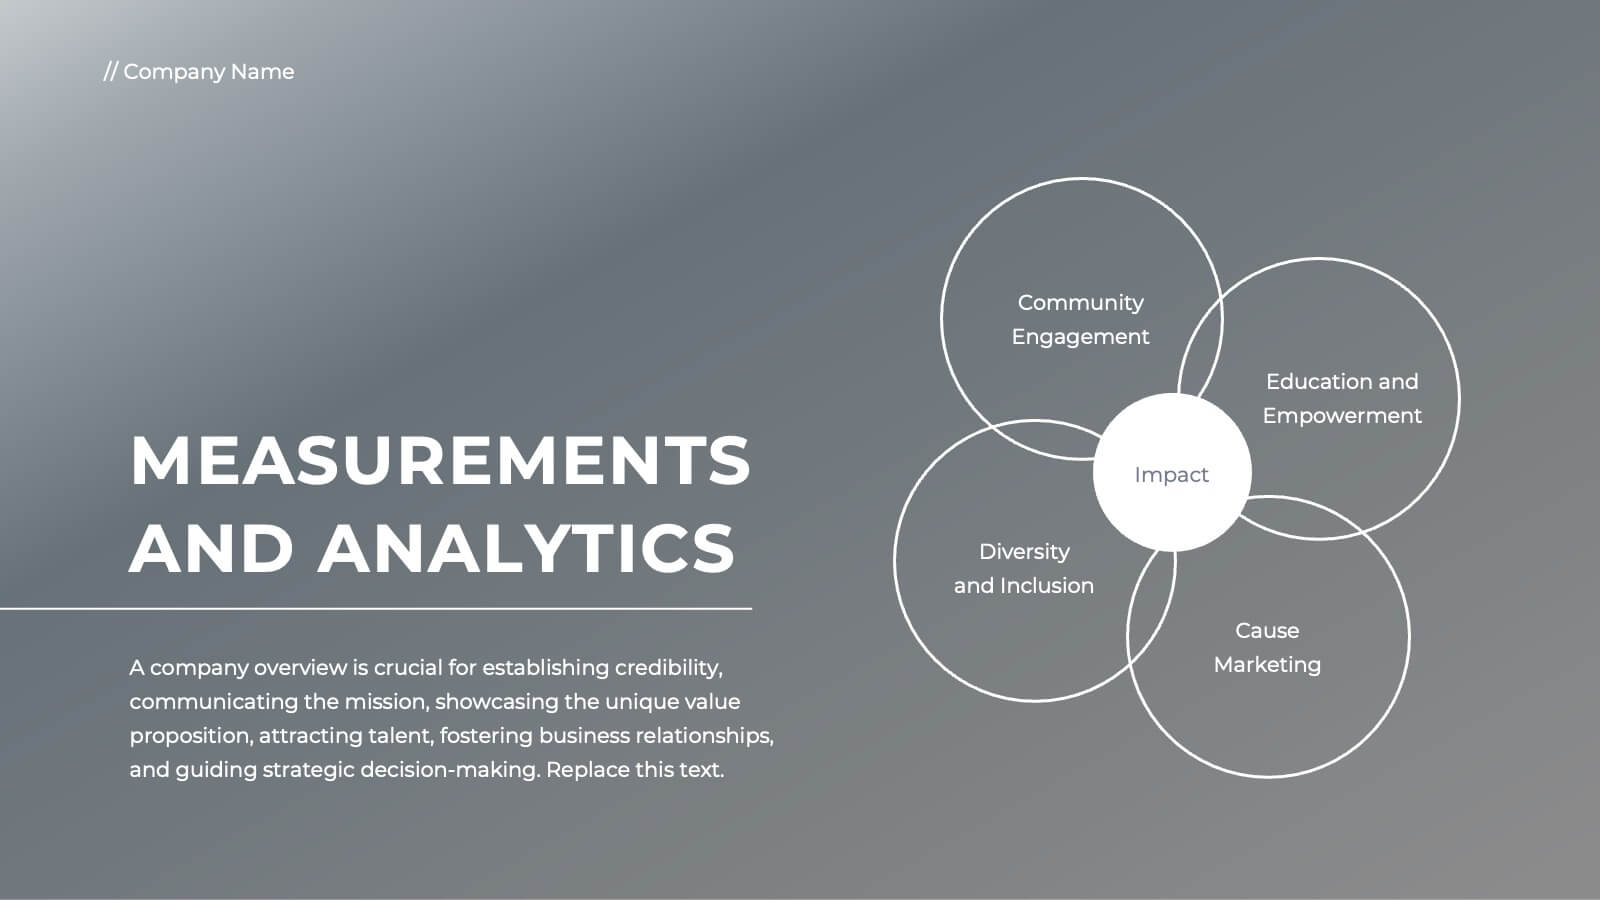
Ember Full-Service Agency Project Plan Presentation
Elevate your agency's presentation with this sleek project plan template! Ideal for showcasing your team's vision, market analysis, and client success stories, it includes slides for strategic development, campaign execution, and partnerships. Impress clients and stakeholders with professional visuals and detailed content. Compatible with PowerPoint, Keynote, and Google Slides for seamless presentations on any platform.


26 diapositivas
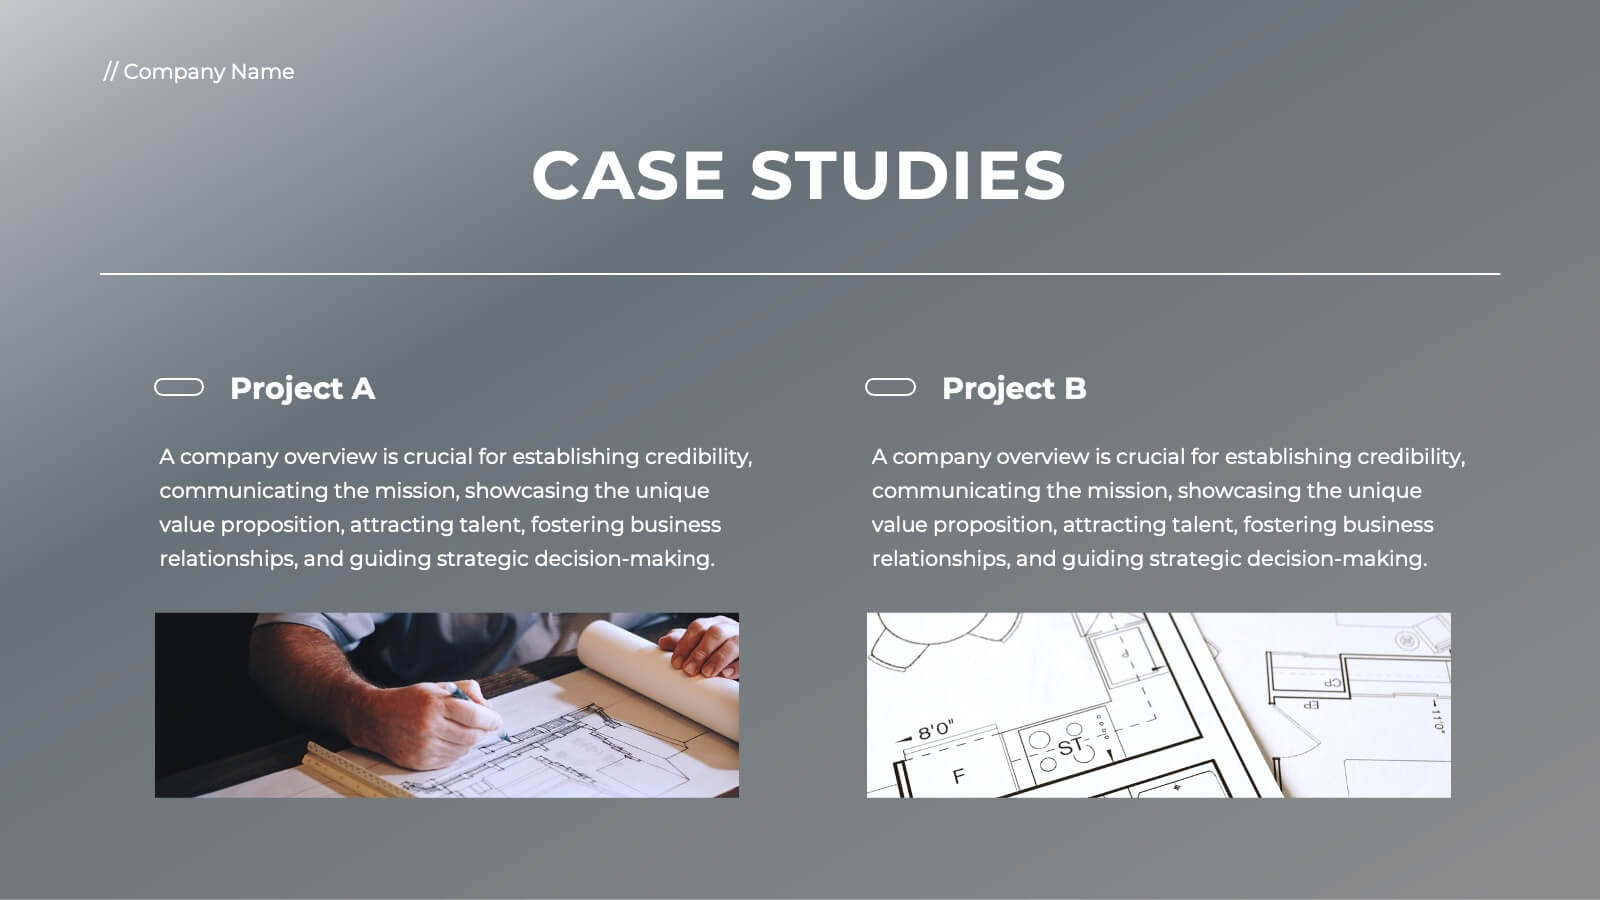
Company Profile Simple Duotone Presentation
Introducing our premier company profile presentation template, designed to beautifully encapsulate the essence of your business. Set against a backdrop that transitions from the serene blue sky to a deeper, more intense blue, this template evokes feelings of limitless possibilities and profound depth. This dual-tone theme, with its varying shades of blue, not only emphasizes trust, professionalism, and reliability but also creates an atmosphere of calm and stability, essential attributes for showcasing your company's strengths and accomplishments. Modern in its layout, our template facilitates a structured presentation of your company's history, mission, achievements, and future aspirations. The design intricately merges the visuals of the expansive sky with the profound depth of the darker hue, creating a narrative that speaks of a firm foundation with an eye on soaring to new heights. Perfectly compatible with both PowerPoint and Google Slides, this template offers ease of customization. Whether it's adjusting the content to fit your corporate story or tweaking the design elements, this template offers flexibility and user-friendliness. Dive deep into your company's journey and aspirations with this exquisite blue-themed template. It's not just a presentation; it's a reflection of your company's ethos and vision. Utilize this template to give stakeholders, partners, and employees a p....


6 diapositivas
Governance Information Infographic
Governance refers to the system of rules, practices, and processes by which an organization or entity is directed, controlled, and regulated. This infographic template is designed to present key information about a governance structure, guidelines, or principles. The layout of this template is organized logically, maintaining a clear flow from one section to another. Summarize the benefits and importance of effective governance. This template will encourage you audience to learn more about the governance or its implementation. This template is fully customizable and compatible with Powerpoint, Keynote, and Google Slides.


7 diapositivas
Funnel Web Infographic
Maximize your insights with our funnel web infographic. This template is a highly informative tool designed to help you illustrate and understand various processes, from sales pipelines to user engagement funnels. This funnel infographic is all about presenting data in an engaging, easy-to-digest manner. Ideal for marketing professionals, business strategists, and anyone looking to visualize multi-step processes. Compatible with Powerpoint, Keynote, and Google Slides. You can add a vibrant yet professional color scheme to ensure attention of information. Present your data in a visually captivating way!


7 diapositivas
RAPID Profit Matrix Infographic
Delve into the systematic world of decision-making with our RAPID Matrix infographic. Cloaked in the trustworthiness of blue tones and complemented by the proactive energy of green, our template elucidates the RAPID framework—Recommend, Agree, Perform, Input, Decide—in an engaging and comprehensible manner. Adorned with exact infographics, distinct icons, and tailored image placeholders, it demystifies roles and responsibilities within decision-making processes. Perfectly calibrated for Powerpoint, Keynote, or Google Slides. An invaluable tool for project managers, business leaders, or any team seeking clarity in its decision-making process. Engage, clarify, and execute with precision.


6 diapositivas
Profit Threshold Break-Even Calculation Presentation
Illustrate financial performance with this profit threshold timeline. The layout spans from big loss to high profit, marking each stage with flag icons and editable labels. Ideal for break-even analysis, sales strategies, or ROI comparisons. Easily customizable in PowerPoint, Keynote, and Google Slides to match your brand’s visual identity.


8 diapositivas
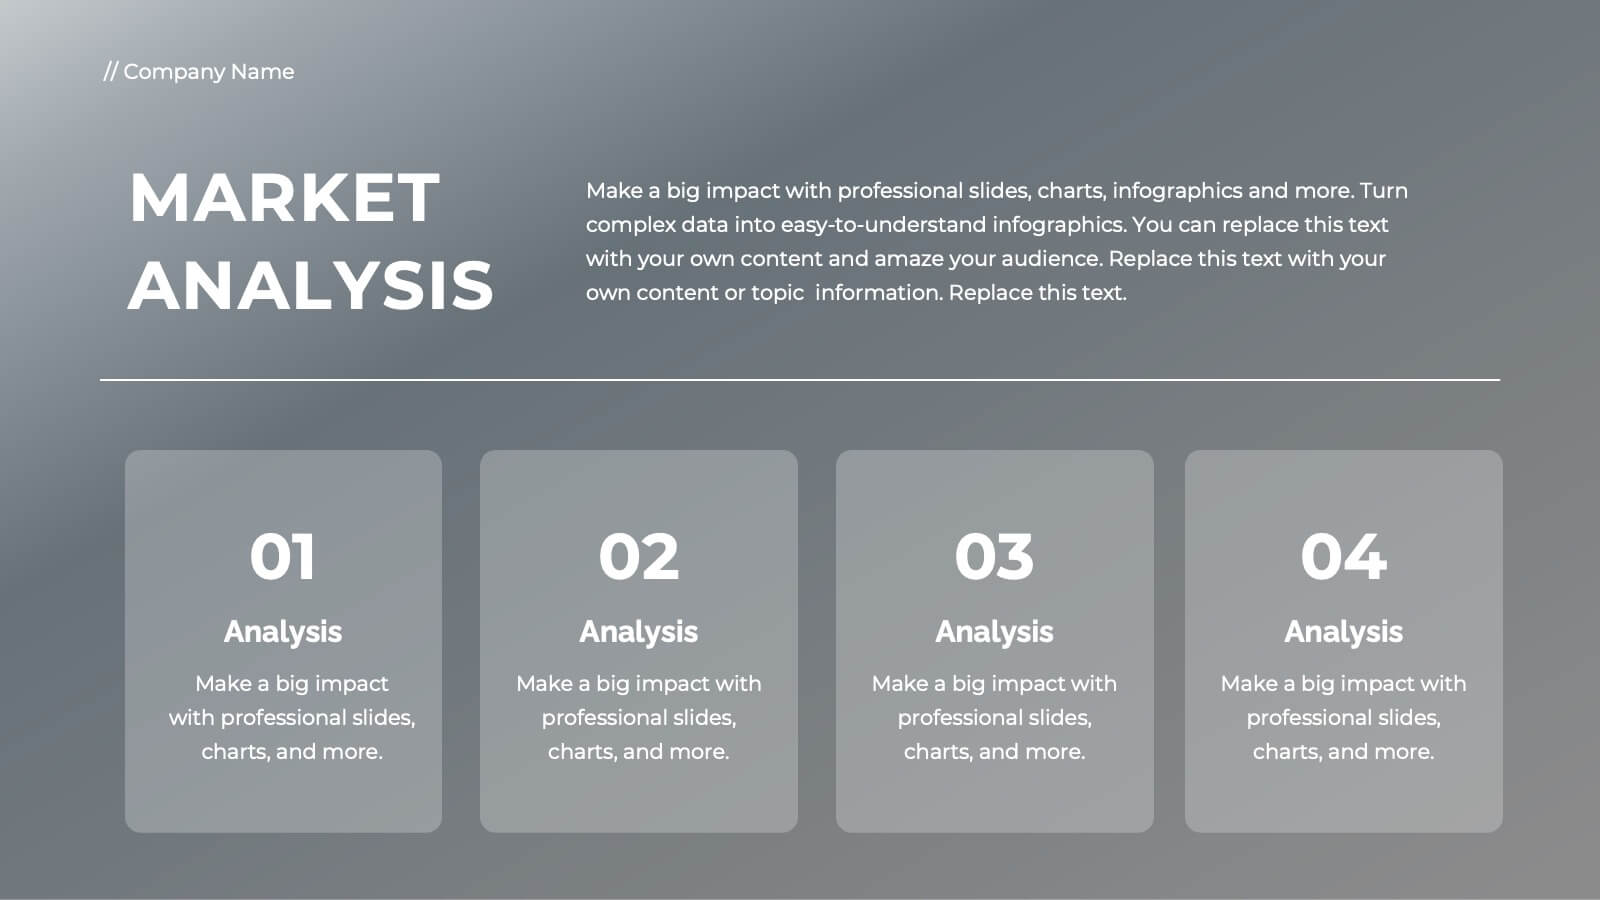
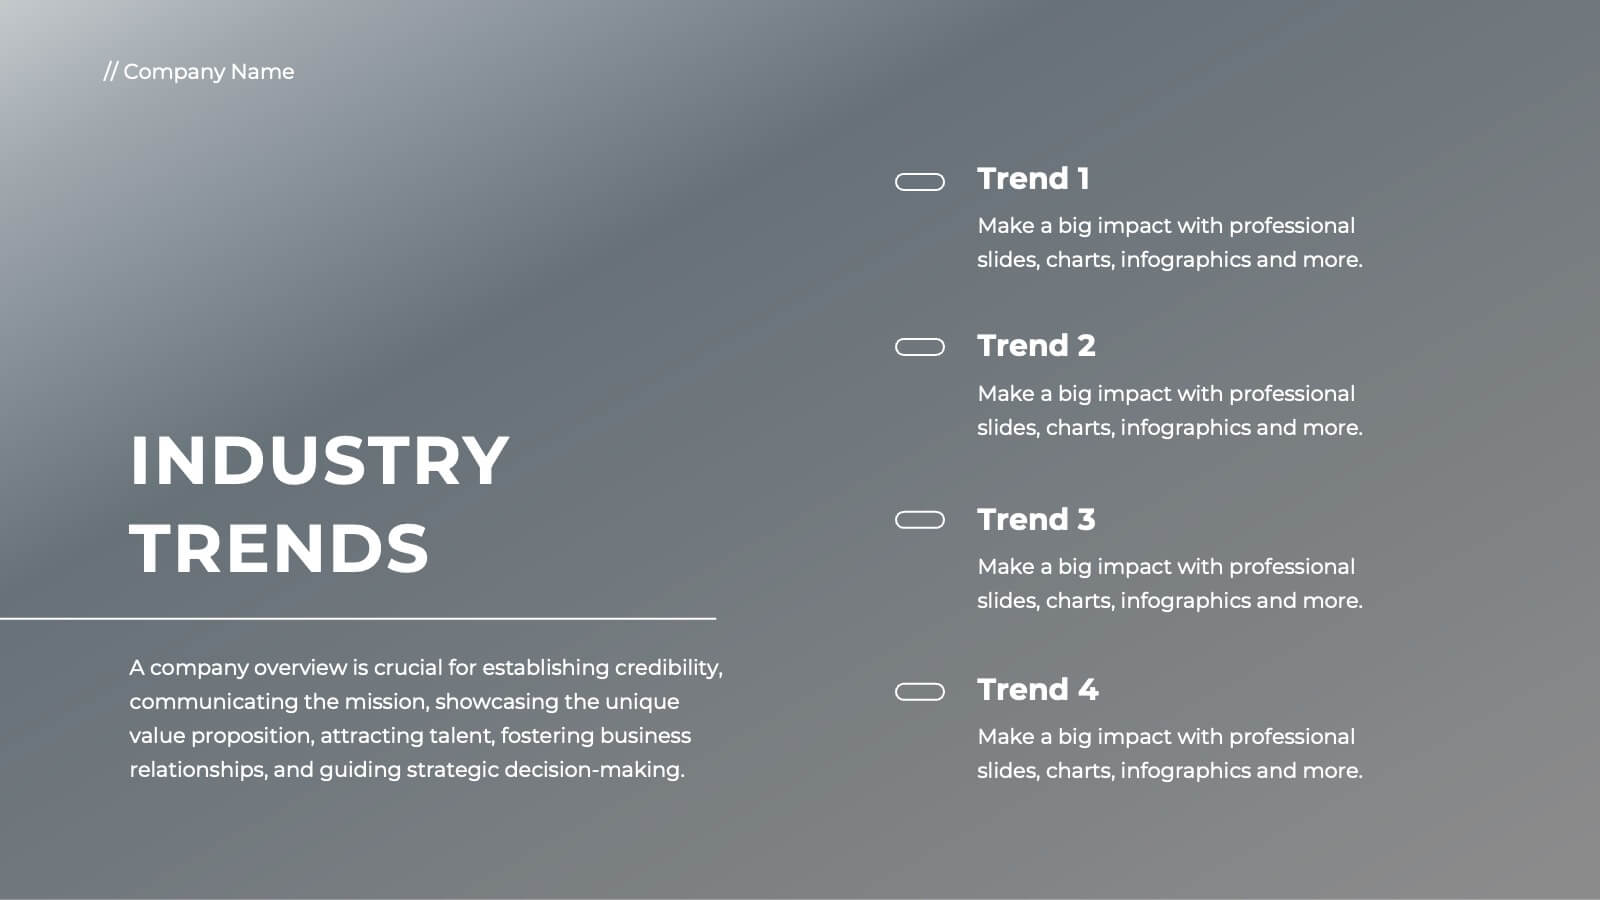
Airline Business Strategy Presentation
Leverage key insights into the aviation sector with the "Aviation Industry Market Analysis" presentation template. This design allows professionals in the aviation industry to effectively communicate market trends and forecasts. Its compatibility with PowerPoint, Keynote, and Google Slides ensures a versatile use across different platforms, making it ideal for industry analyses, investor meetings, or internal strategy discussions.


26 diapositivas
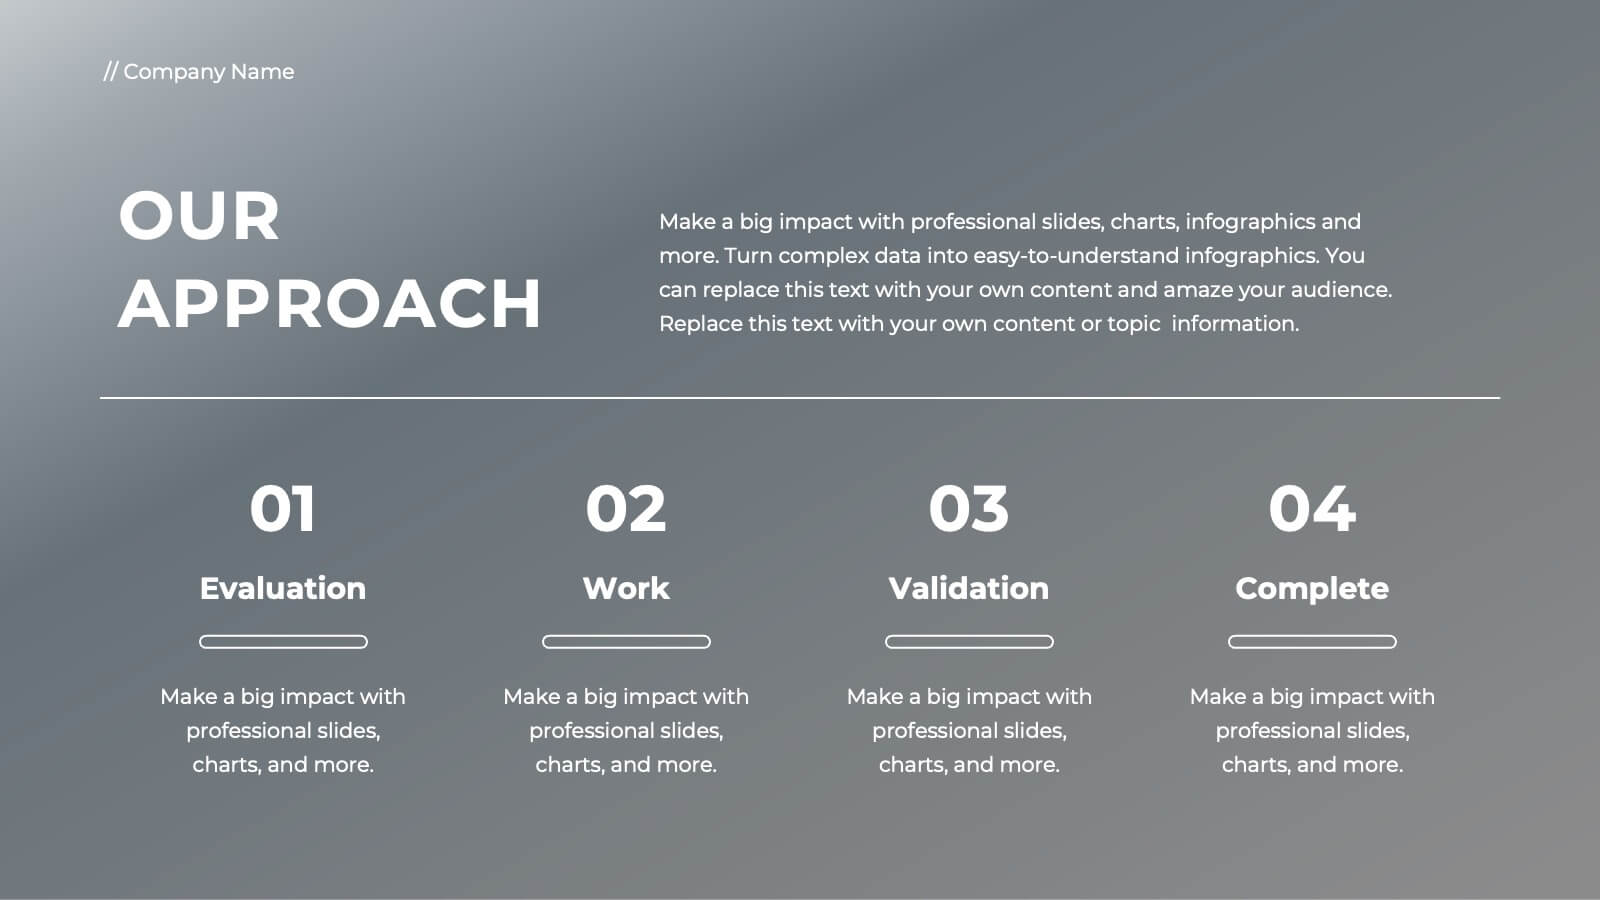
Leadership and Management Skills Presentation
Elevate your leadership and management training with a presentation template that's as organized and efficient as it is visually appealing. The design is tailored for clarity, with a clean, contemporary layout that speaks to professionals eager to enhance their skills. Each slide is crafted with purpose, using a smart blend of graphics and space to highlight key concepts in leadership and management. This template includes a variety of slides to cover all training aspects: from the core qualities of a leader to the intricacies of team management. Graphs and charts provide a clear representation of management theories, while comparison slides help illustrate different leadership styles. Whether for a corporate training session, a workshop for budding entrepreneurs, or a classroom lecture, this set is ready for use in PowerPoint, Keynote, and Google Slides, making it a valuable tool for any leadership development program.


6 diapositivas
Professional Company Profile Deck Presentation
Present your business with impact using this modern company profile deck. Designed for clarity and professionalism, it includes structured icons, visual highlights, and customizable content sections. Ideal for pitches, internal briefings, or executive introductions. Fully editable in PowerPoint, Keynote, and Google Slides to match your brand and messaging effortlessly.


4 diapositivas
Insurance Services Overview Presentation
Present your offerings with clarity using this Insurance Services Overview slide. Ideal for explaining coverage tiers, policy types, or service options. The clean umbrella graphic adds a strong visual metaphor for protection. Fully customizable and compatible with PowerPoint, Keynote, and Google Slides for use across any insurance or finance presentation.


26 diapositivas
Mazen Presentation Template
Mazen is a multi-purpose template that’s perfect for any business. The colors and layout are clean and chic, and it’s suitable for all types of businesses, from small business accounts to large corporate companies. It also has a hip aesthetic with nude warm tones, while pictures and charts are easy to edit and easy to read so users can easily understand the information in them. Easy to use, high quality and many features make this template suitable for all kinds of businesses. Pictures and charts are also made for easy editing as well as easy readability without too much confusion on reading.


21 diapositivas
Shadowrise Product Roadmap Presentation
Plan and present your product journey effectively with this detailed roadmap presentation! It covers key areas like market analysis, product features, use cases, pricing strategies, and distribution channels, ensuring a clear path to success. Perfect for product teams, stakeholders, or investor meetings, this template is fully compatible with PowerPoint, Keynote, and Google Slides.