


Características


¿Tienes alguna pregunta?
Recomendar


6 diapositivas
Sales Summary Infographic
Enhance your business presentations with our Infographic Templates! Designed specifically for professionals aiming to deliver impactful data insights, this collection provides an array of slides tailored to articulate complex information effortlessly. Crafted to showcase performance metrics, analyze market trends, and outline strategic directions, these templates turn data into narratives. Featuring unique designs ranging from sophisticated circular diagrams to innovative hexagonal lists and visually engaging photo integrations, each slide ensures your data is both comprehensive and compelling. You can customize colors and text to seamlessly align these designs with your corporate identity, enhancing brand consistency across all communications. Ideal for use in PowerPoint, Google Slides, and Keynote, these templates serve as essential tools for marketers, team leaders, and analysts. They facilitate clearer understanding, promote informed decision-making, and boost presentation impact, making them invaluable in any professional setting.


5 diapositivas
Four-Step Marketing Funnel Plan Presentation
Streamline your messaging with the Four-Step Marketing Funnel Plan Presentation. This clean, vertical funnel layout highlights each stage of your strategy—ideal for visualizing lead nurturing, sales processes, or campaign progression. Each level is clearly marked and editable, helping you deliver focused insights with ease. Fully compatible with PowerPoint, Canva, Keynote, and Google Slides.


10 diapositivas
Cloud Services Deployment Strategy Presentation
Present your IT roadmap with clarity using the Cloud Services Deployment Strategy slide. This vertical flowchart features ascending arrows and cloud icons, ideal for showing phased rollouts, service tiers, or migration plans. Easy to customize in PowerPoint, Keynote, and Google Slides.


5 diapositivas
Geometric Design Elements
Make your message stand out with this bold, 3D geometric infographic layout. Ideal for visualizing layered concepts, structural data, or multi-dimensional strategies. Each triangular section is color-coded and fully editable to align with your brand or topic. Compatible with PowerPoint, Keynote, and Google Slides.


5 diapositivas
5-Level Smile Rating Presentation
Give your audience a fun, visual way to understand sentiment with this colorful rating slide. Perfect for feedback summaries, project reviews, or performance insights, it displays five clear emotion levels in a simple, engaging format. Easy to customize and fully compatible with PowerPoint, Keynote, and Google Slides.


6 diapositivas
Project Cycle Infographics
The "Project Cycle" infographic template is a meticulously designed resource, ideal for project managers, team leaders, and business analysts. This template facilitates a clear and comprehensive presentation of the various stages involved in a project, from initiation to completion. This template encompasses essential elements of the project cycle, including project initiation, planning, execution, monitoring, and closure. The structured design ensures each phase is distinctly represented, allowing for detailed exploration of timelines, resource allocation, and milestone achievements. This makes it an excellent tool for project planning meetings, stakeholder briefings, and team workshops. The design is professional and methodical, featuring a color scheme that is both engaging and indicative of progression and clarity. This not only enhances the visual appeal of the presentation but also aids in effectively communicating the sequential and cyclical nature of project management. Whether it's used in corporate boardrooms or educational settings, this template guarantees that your project cycle is presented in a detailed, visually compelling, and easily understandable manner.


6 diapositivas
Education Services Infographic
Education services refer to the various activities and resources provided to facilitate learning and knowledge acquisition. This infographic template showcases various education services and their benefits. This infographic is designed to highlight the different aspects of education services and their impact on individuals and society as a whole. The infographic features a vibrant and eye-catching design that captures attention and engages viewers. The use of bright colors and appealing illustrations makes the infographic visually appealing and memorable. Compatible with Powerpoint, Keynote, and Google Slides.

22 diapositivas
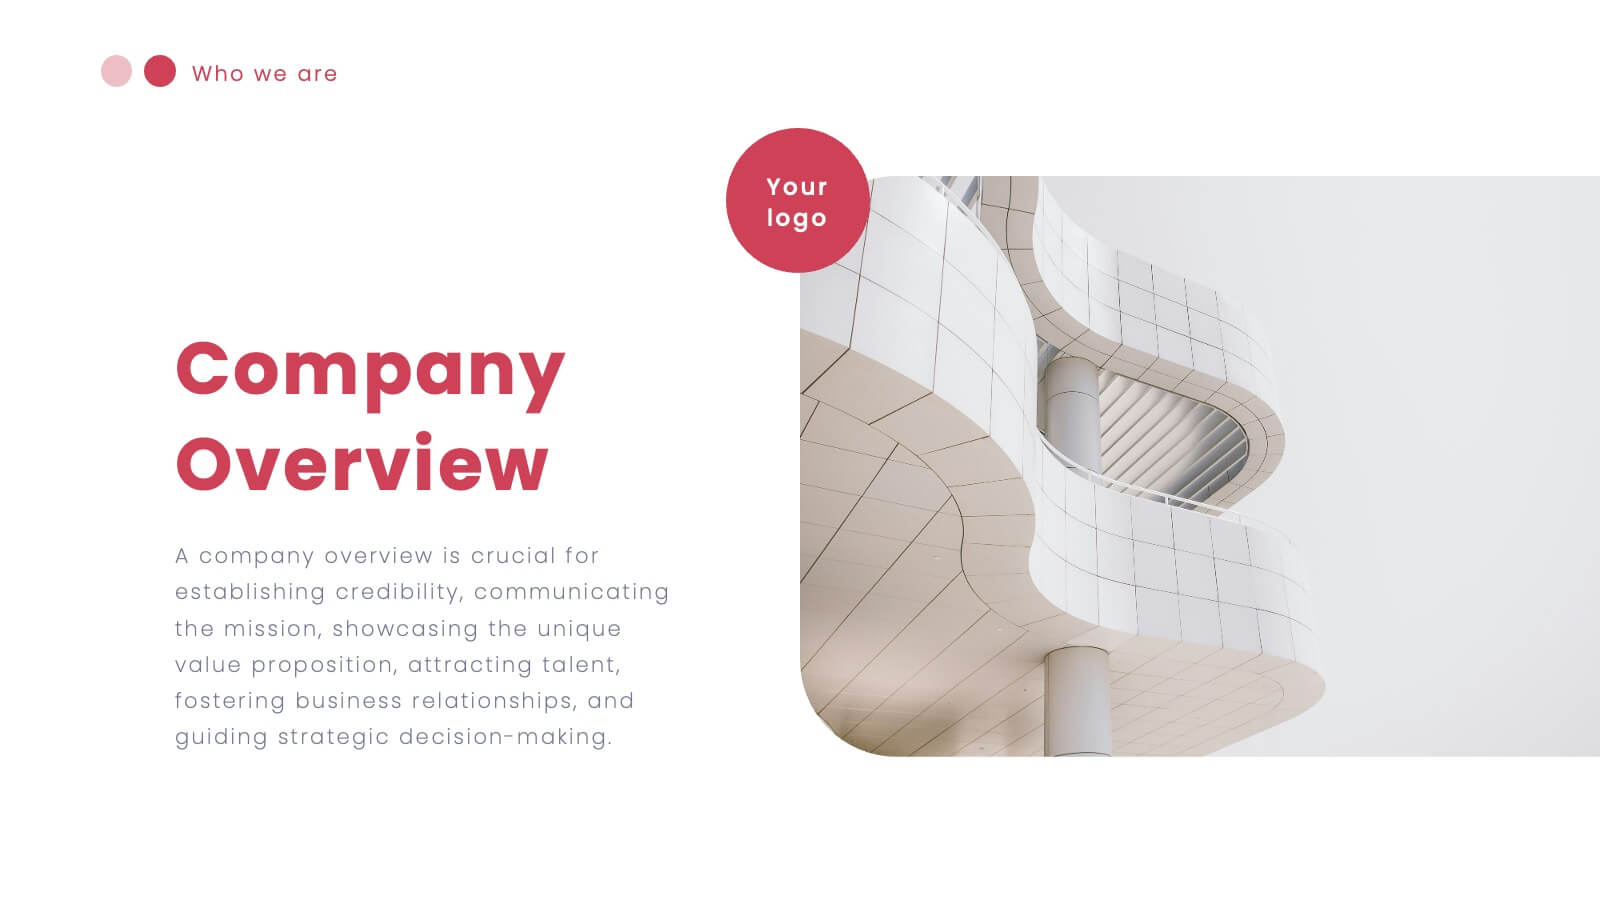
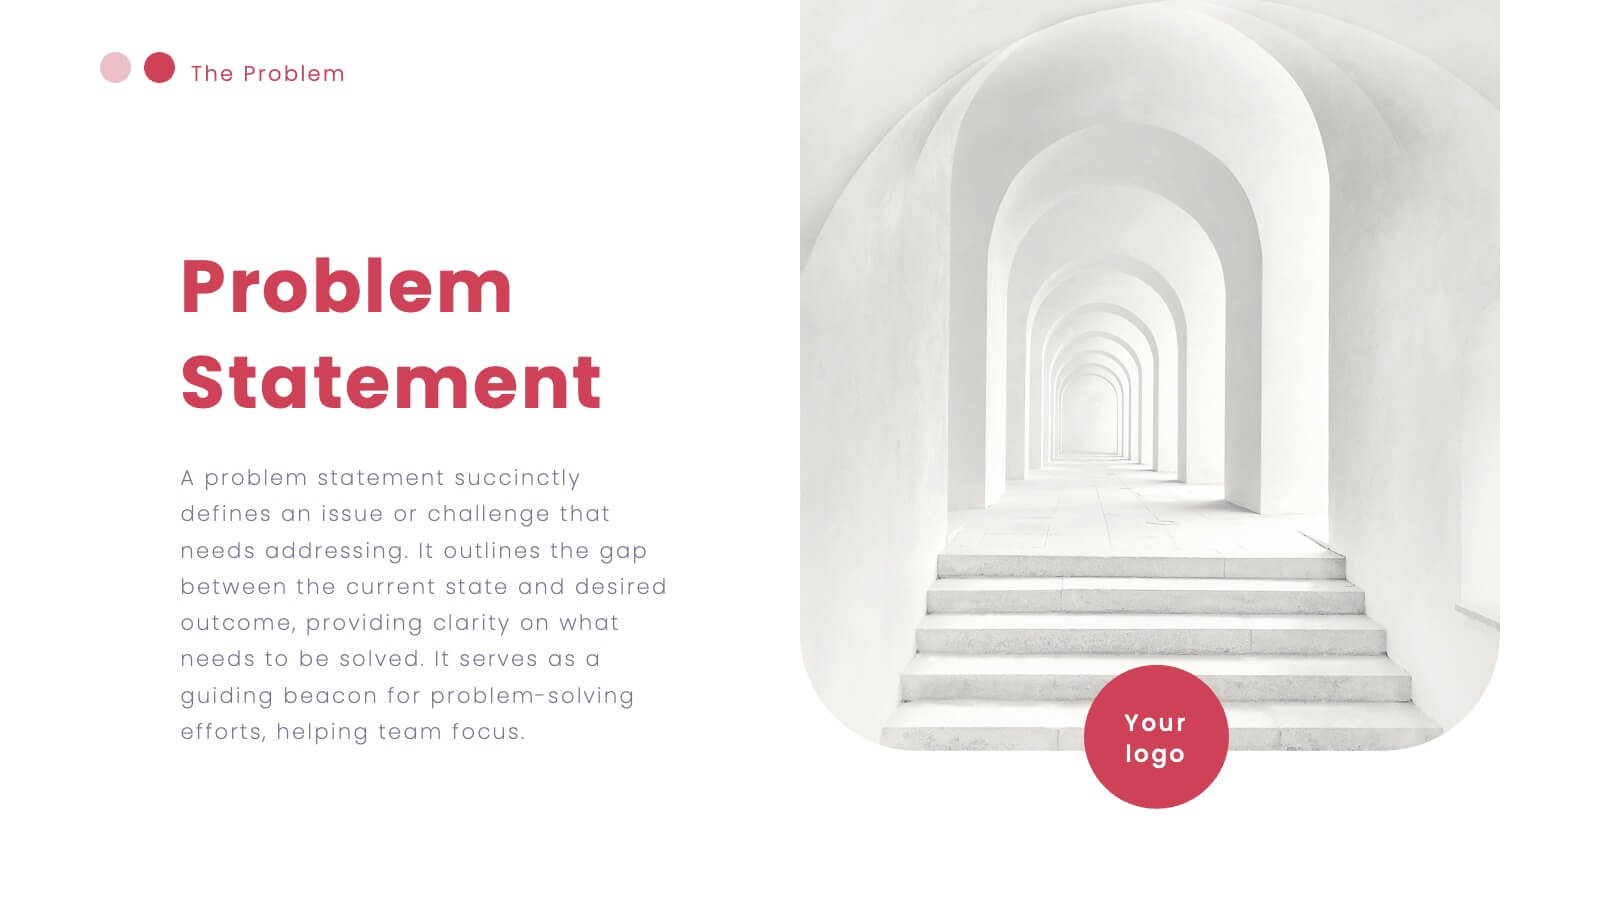
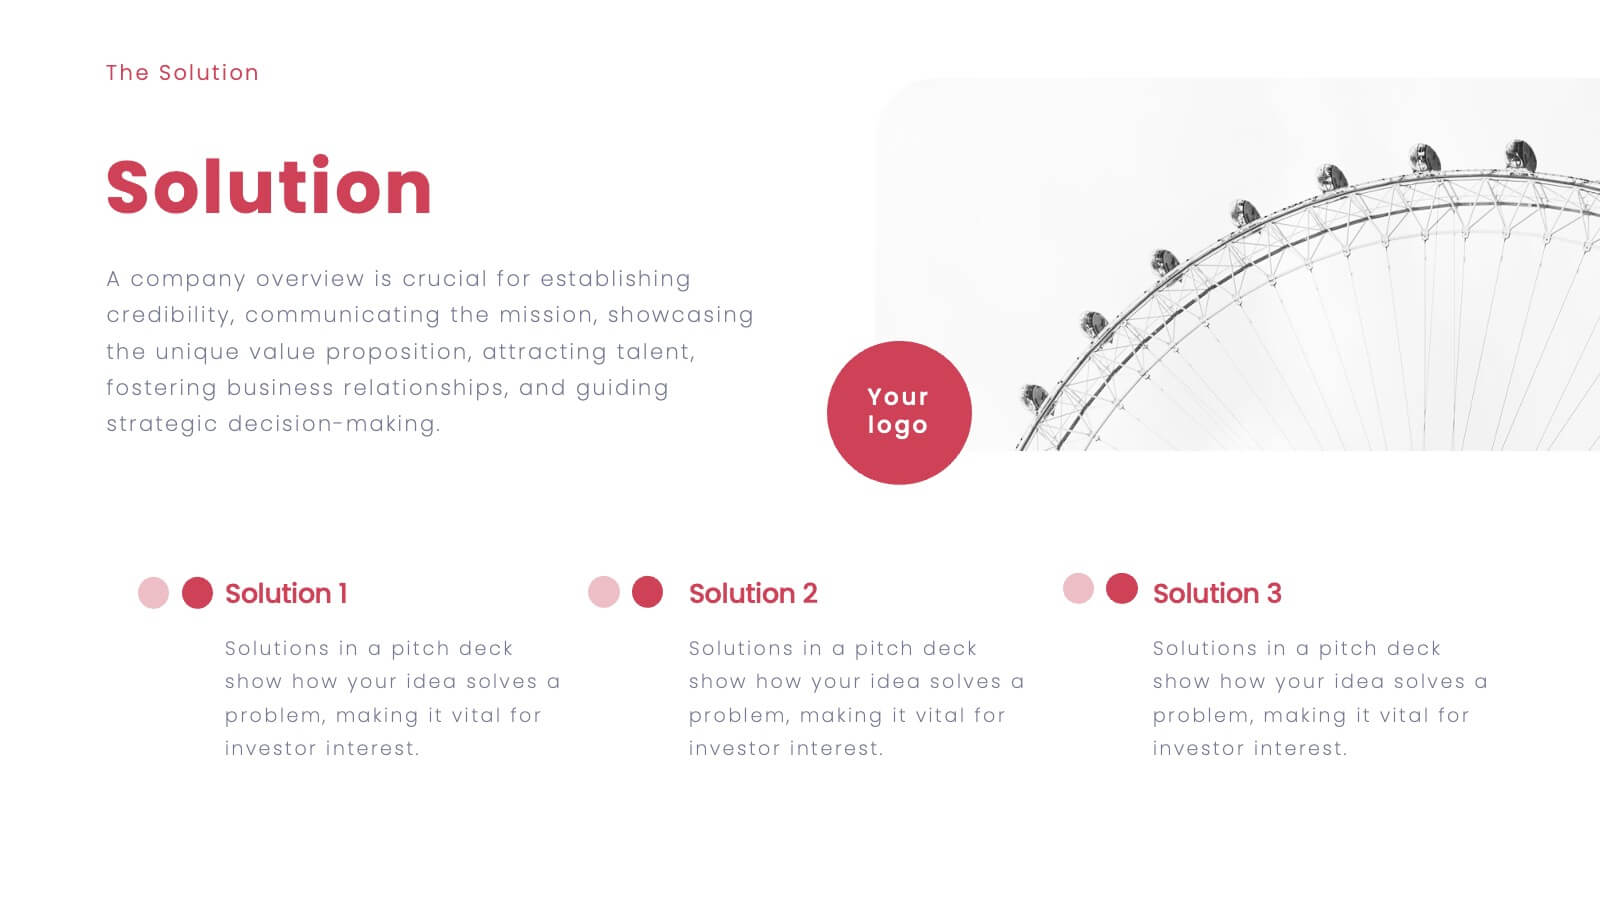
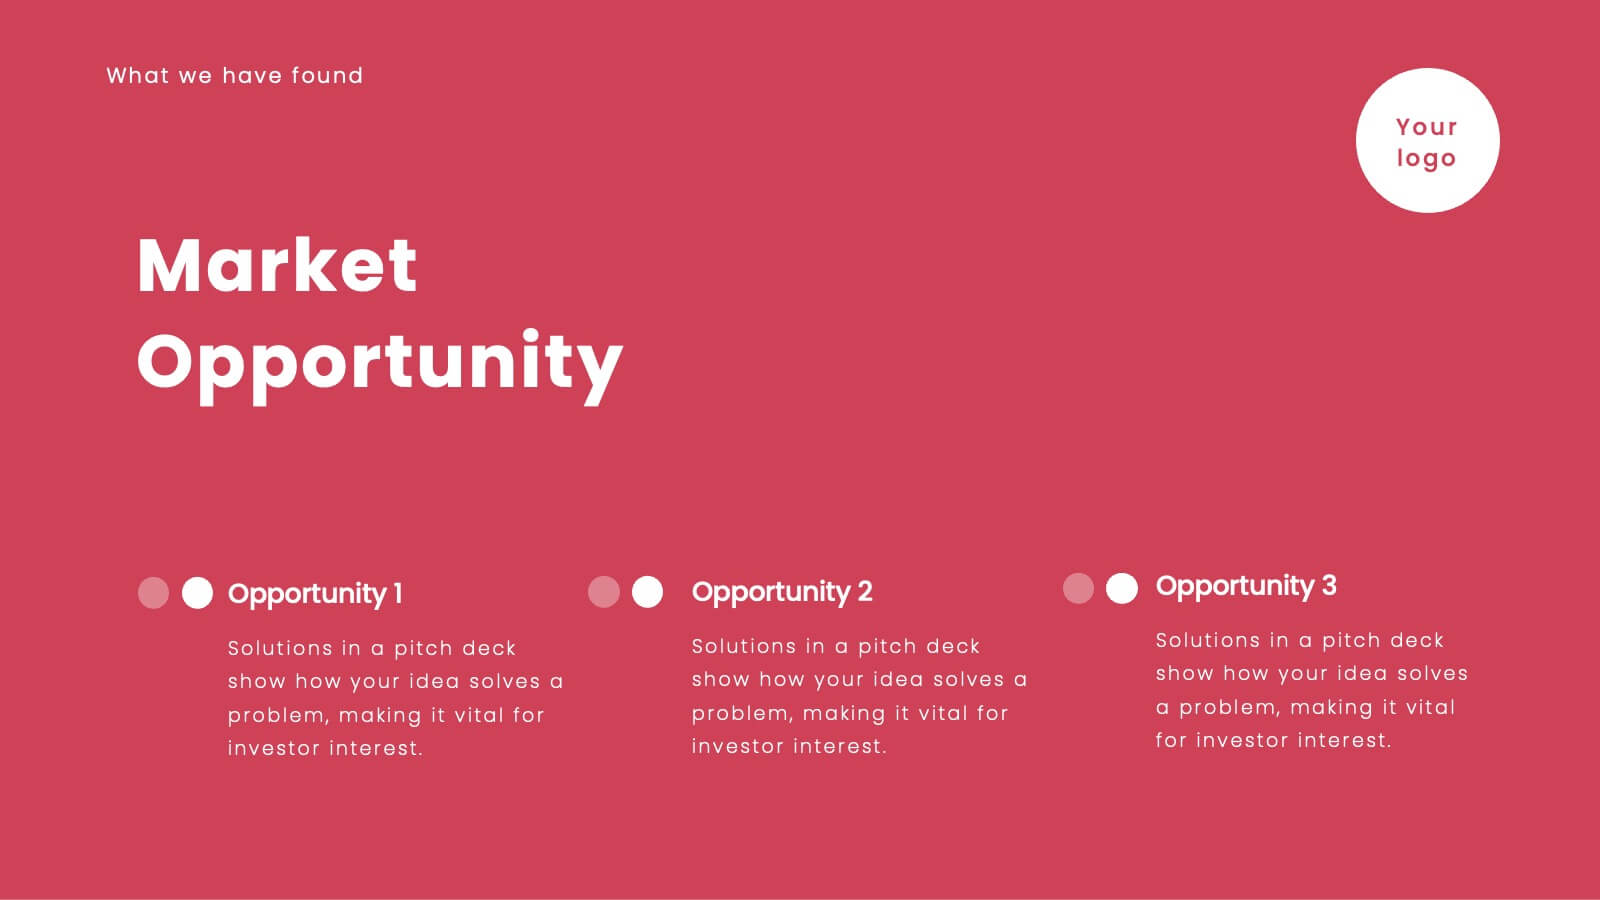
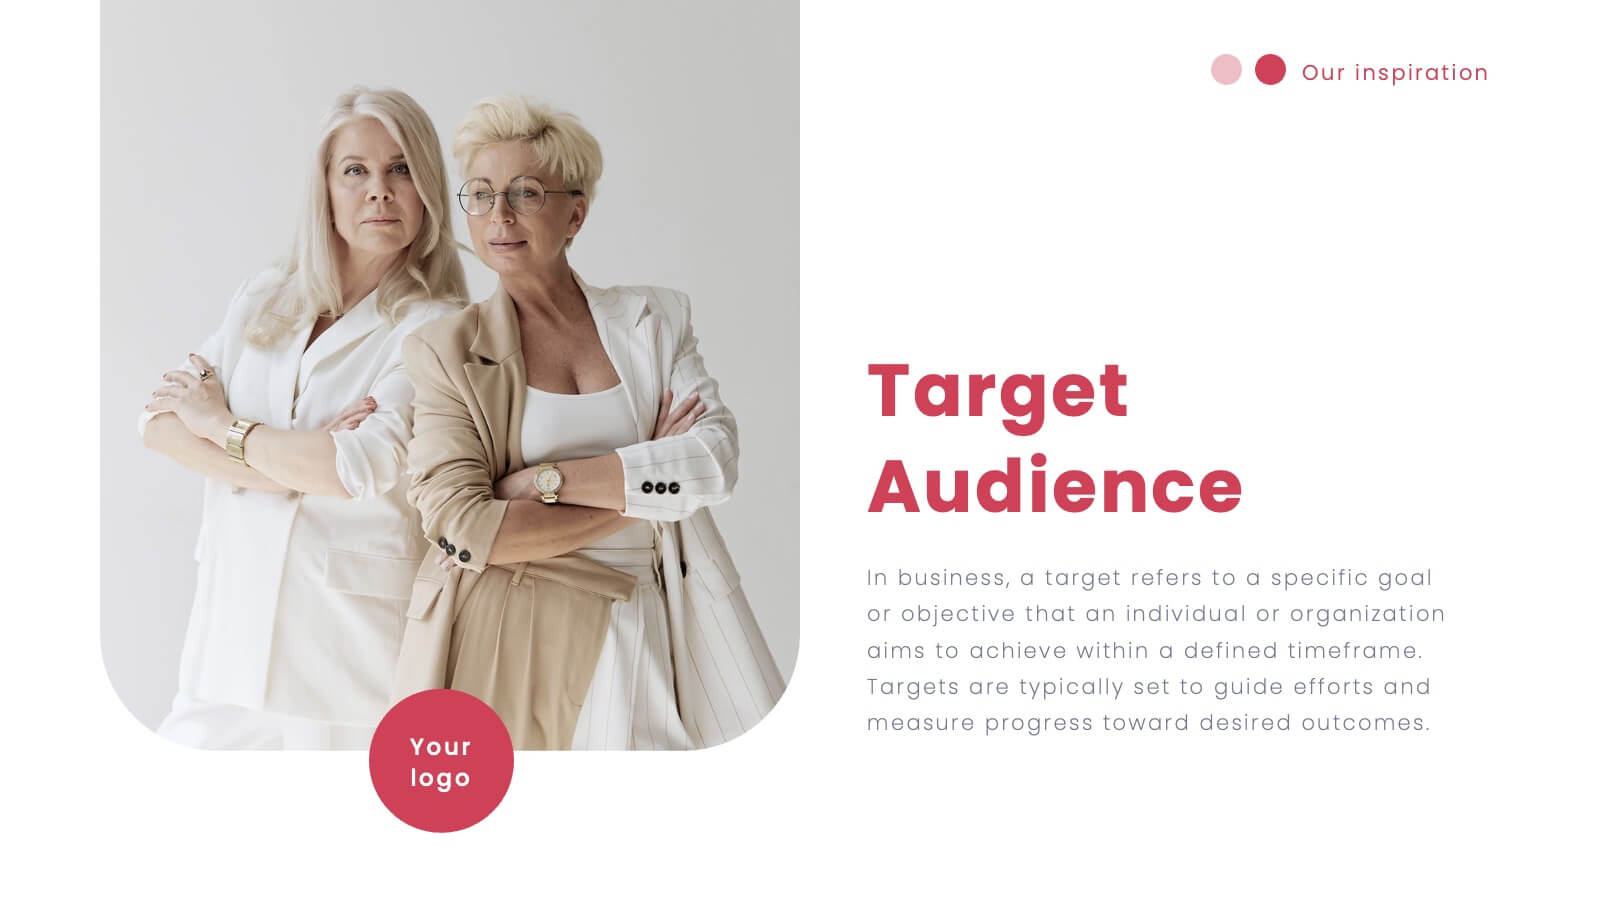
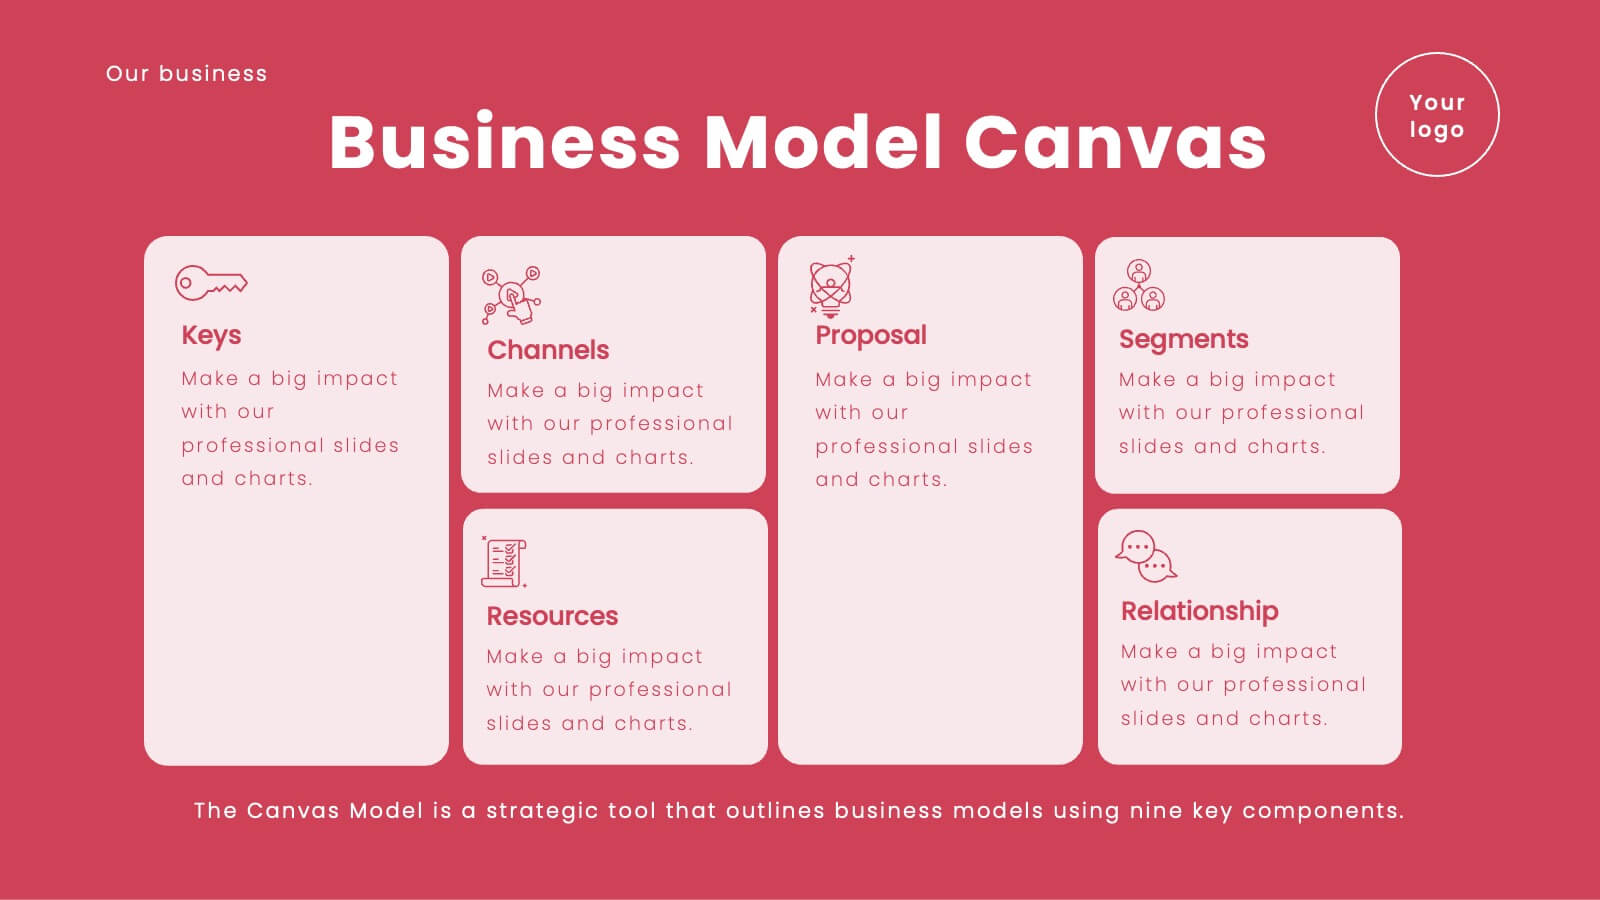
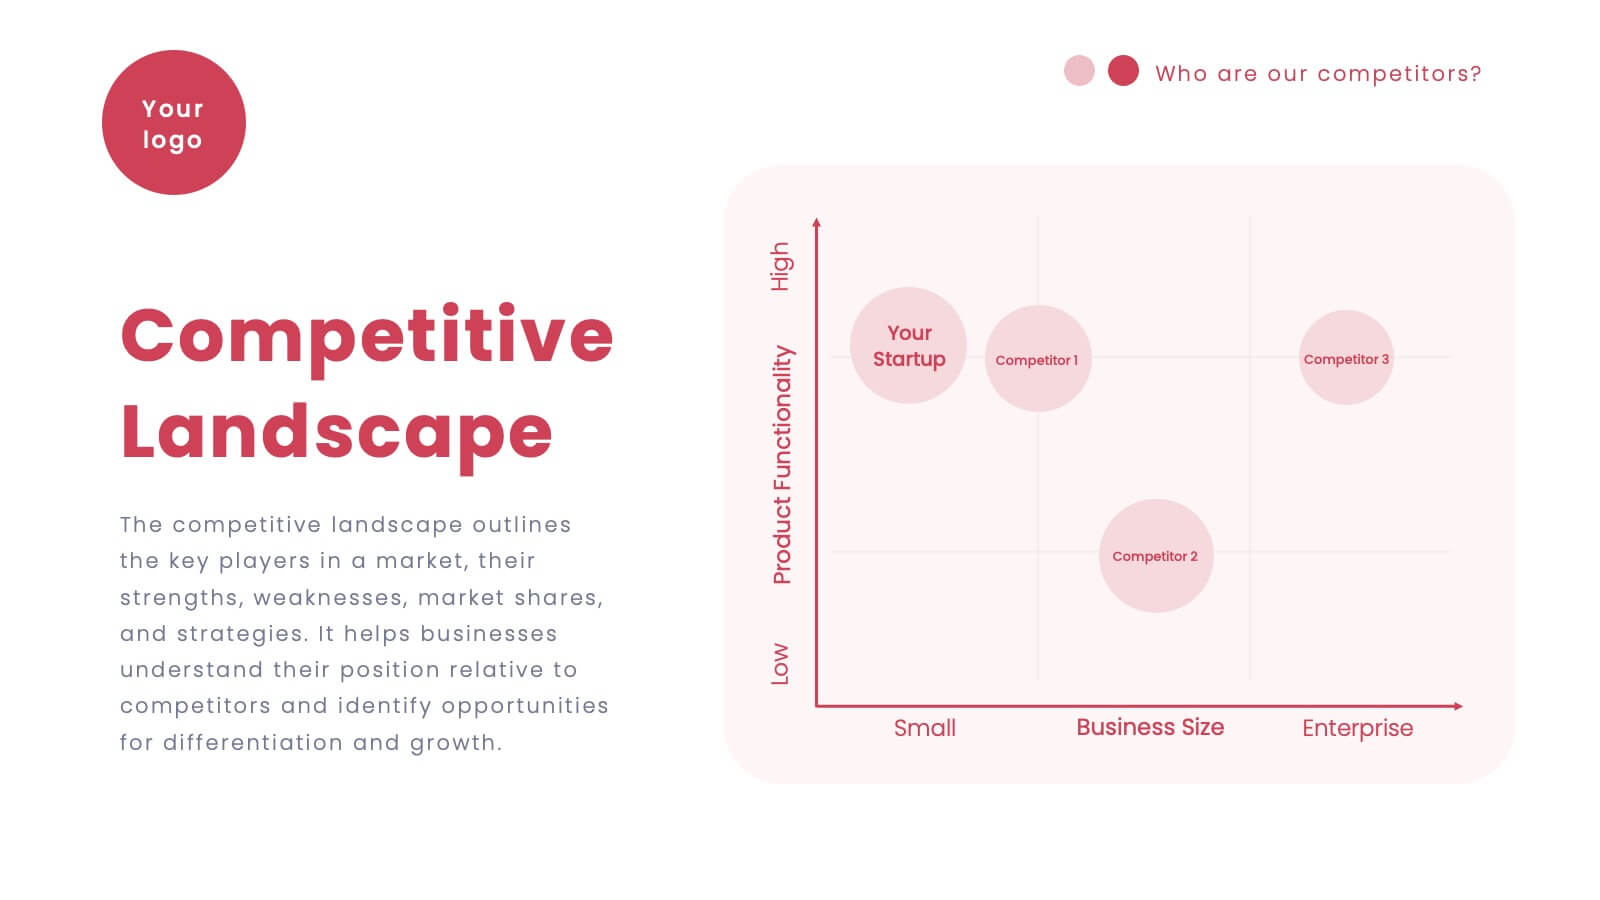
Vortex Startup Pitch Deck Presentation
Launch your ideas into action with this vibrant red pitch deck template, designed to captivate and inform potential investors. It covers everything from company overview to financials and market strategy, ensuring your vision is communicated effectively. Compatible with PowerPoint, Google Slides, and Keynote, this template is perfect for startups seeking to impress and engage.


7 diapositivas
Business People Networking Infographic
Networking is the lifeblood of any thriving business. Our business people networking infographic, designed in a pristine white backdrop with striking orange highlights and sophisticated black nuances, encapsulates the essence of professional connections and collaborations. It provides a visual representation of how relationships can foster growth, open opportunities, and catalyze success. Tailored for business leaders, conference organizers, and networking event planners, this template offers a compelling narrative of networking's power. Fully optimized, it's compatible with leading presentation platforms: PowerPoint, Keynote, and Google Slides.


5 diapositivas
Task Management and Scheduling
Stay organized and efficient with this clear task management and scheduling layout. This presentation makes it easy to prioritize assignments, allocate time slots, and track progress using a visual clock-based design. Perfect for business operations, project coordination, workflow planning, and productivity meetings. Fully customizable and compatible with PowerPoint, Keynote, and Google Slides.


4 diapositivas
Neuroscience-Inspired Concept Mapping Presentation
Visualize abstract ideas with clarity using the Neuroscience-Inspired Concept Mapping Presentation. Featuring a head silhouette and four labeled concept nodes, this layout is perfect for connecting ideas, frameworks, or steps in a thought process. Fully editable in PowerPoint, Canva, and Google Slides for seamless customization and presentation.


5 diapositivas
Music History Infographics
Music History is important for its cultural, educational, and historical significance. It deepens our understanding and appreciation of music, connects us with the past, and inspires us to create and explore new musical possibilities. These unique vertical Infographics are visual representations of the history of music, including key events, influential artists, and genres. They feature a guitar timeline, icons, text boxes, and illustrations to convey your information in an engaging way. You can cover a broad range of topics with this template, from the development of 70's music to the rise of rock and roll!


3 diapositivas
Decision-Making Bowtie Framework Presentation
Break down complex decisions with clarity using the Decision-Making Bowtie Framework Presentation. This template lets you visually weigh options, outcomes, and impacts from both sides of a decision point, making it ideal for strategic planning, risk assessment, and executive reporting. Compatible with PowerPoint, Keynote, and Google Slides.


6 diapositivas
Strategic Business Case Study
Present detailed business case analyses with this layered castle-style layout, ideal for step-by-step storytelling. Each section visually represents a different stage or insight, helping you build a clear and convincing narrative. Fully editable and compatible with PowerPoint, Keynote, and Google Slides.


20 diapositivas
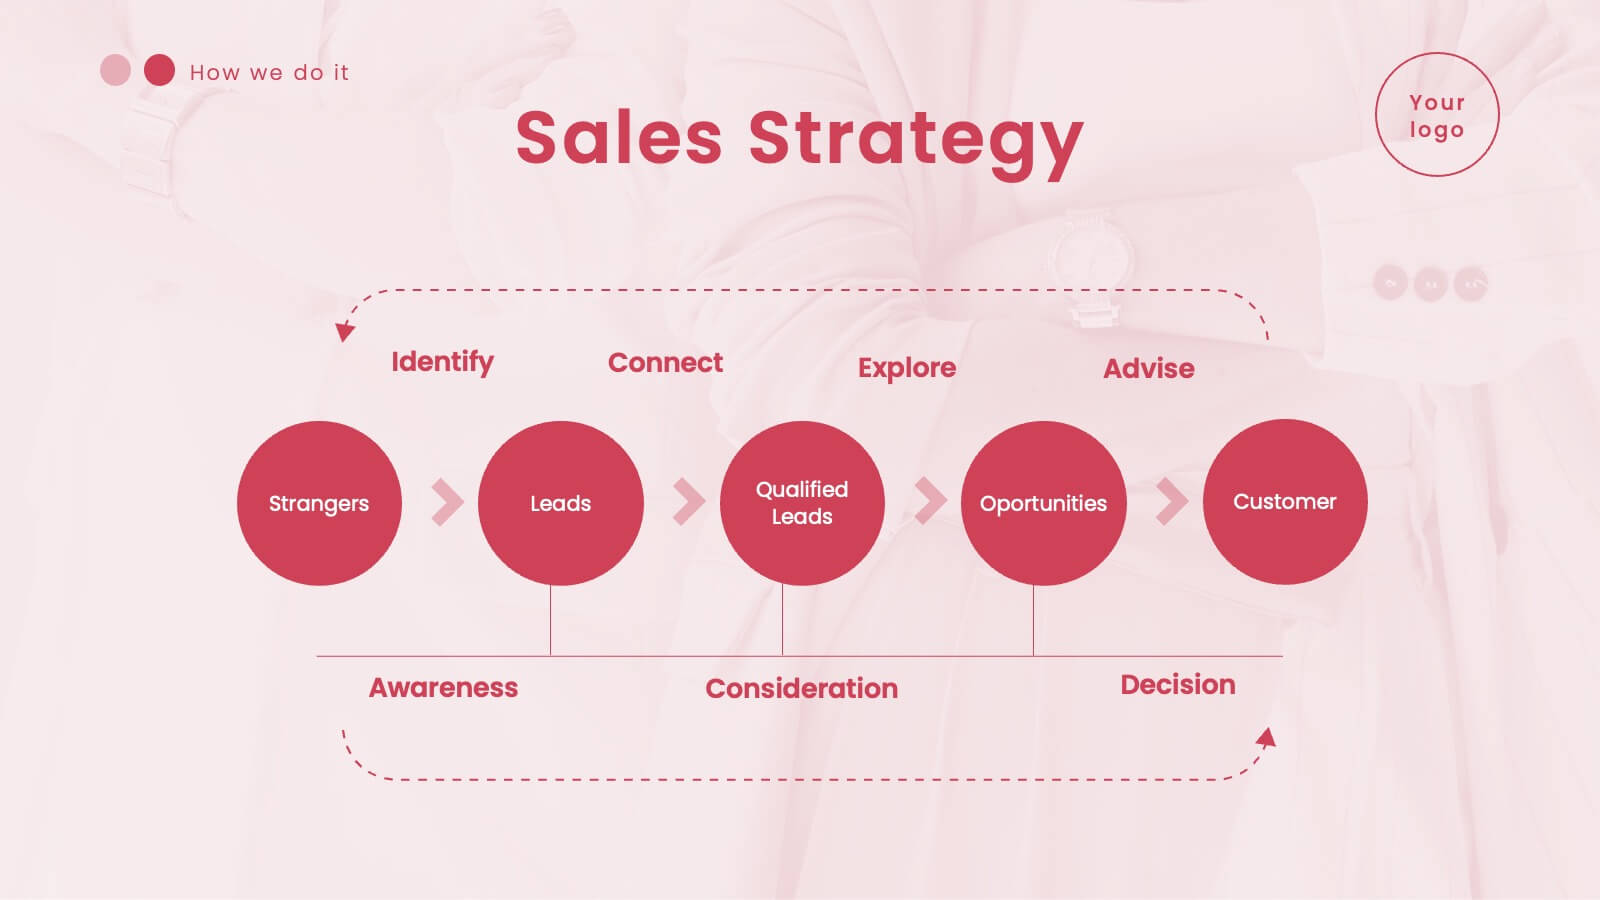
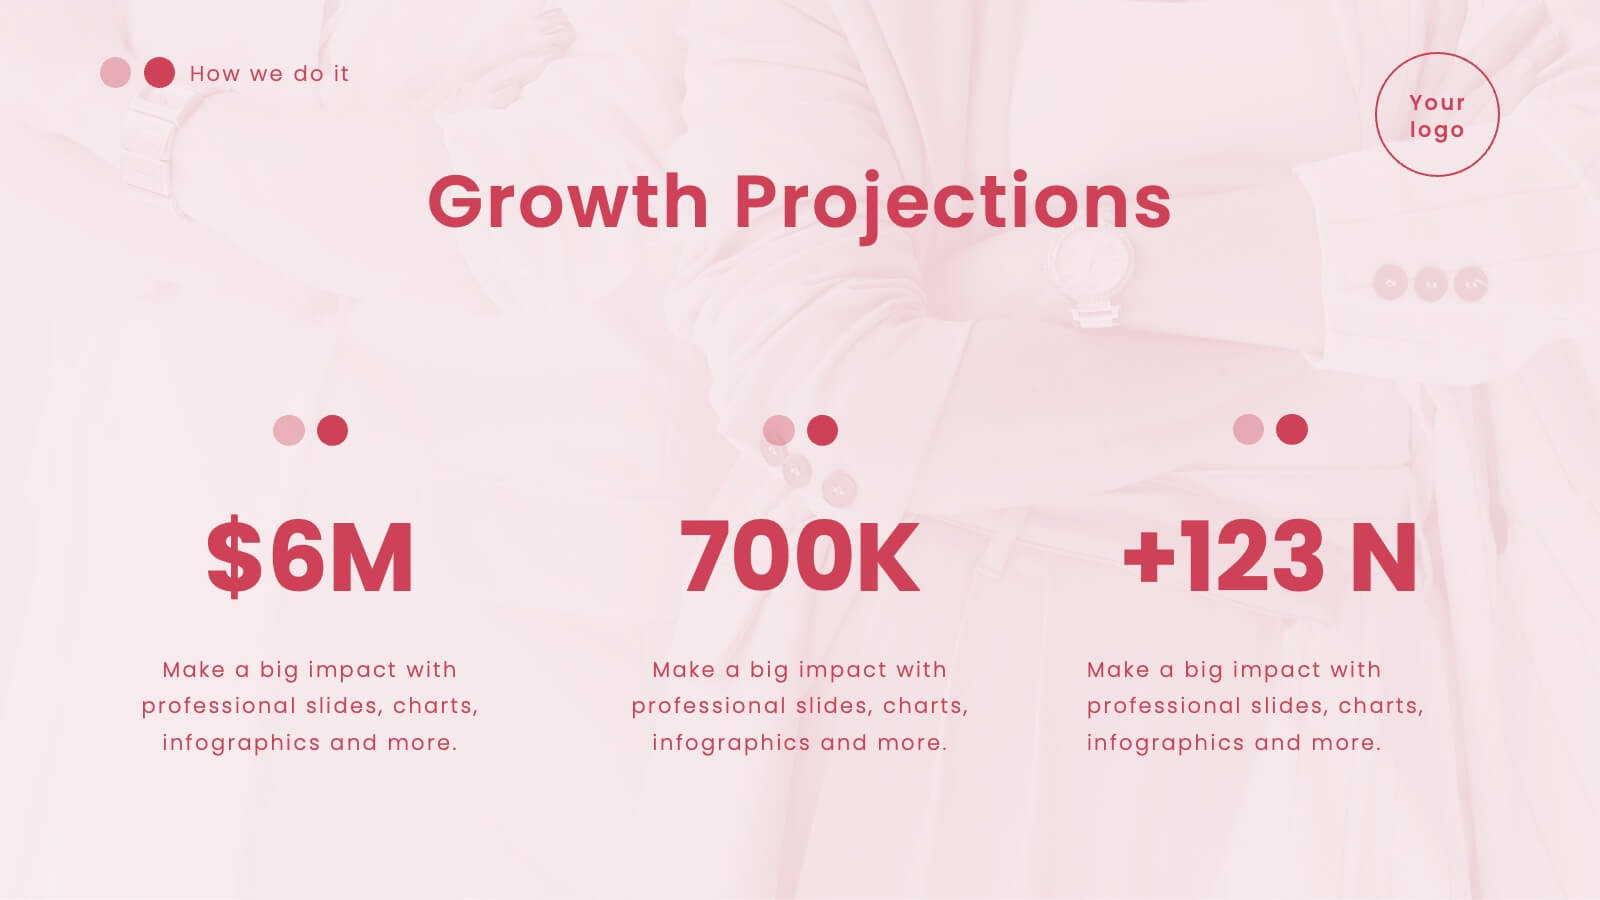
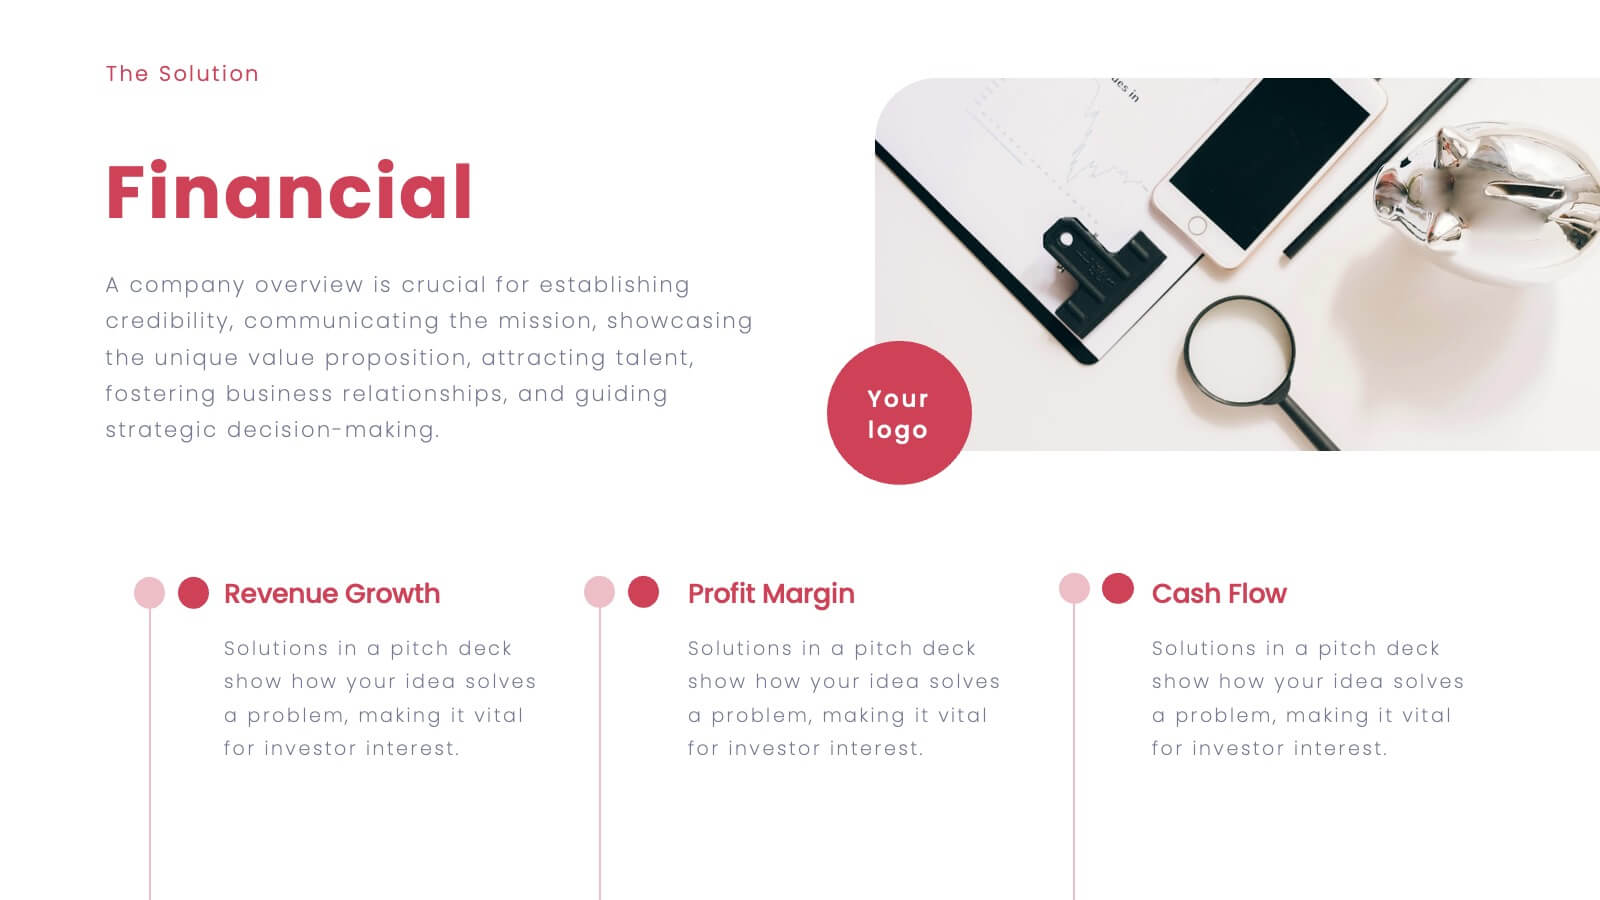
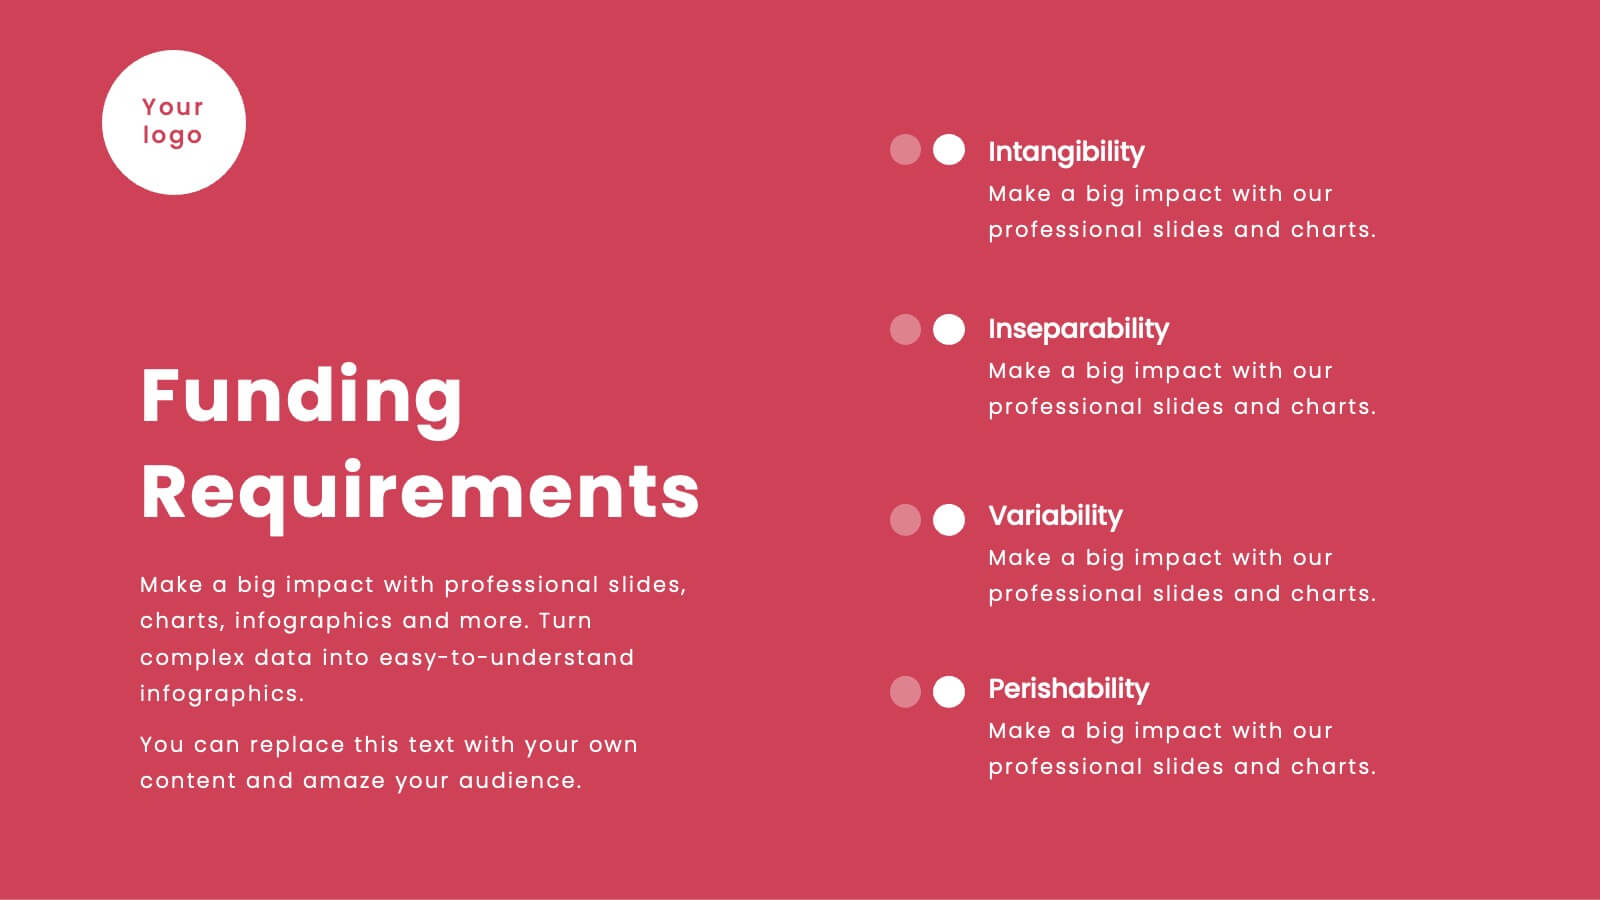
Cinderbark Product Launch Pitch Deck Presentation
Showcase your product launch with a sleek, modern, and professional pitch deck template. This design empowers you to captivate stakeholders by clearly presenting your problem statement, unique solutions, and market opportunity. Effectively highlight your target audience, revenue model, and competitive landscape to demonstrate market viability. Create impact with visuals detailing your sales strategy, growth projections, and financial summary, ensuring transparency and confidence in your business plan. Timeline and milestone slides keep the focus on key achievements and future goals, while team introduction pages establish credibility and expertise. Fully customizable and compatible with PowerPoint, Google Slides, and Keynote, this template is ideal for startups, entrepreneurs, and product managers aiming for a polished and compelling presentation. Tailor it to your needs and deliver your vision with clarity and style.


7 diapositivas
Investment Infographic Presentation Template
This Investment Infographic template is a professionally designed presentation made to present your ideas in an easy to understand format. This template features a professional design, easy color customization and a number of other useful elements to help you create an amazing infographic. This template is designed to include a variety of charts and graphs to visually demonstrate key points, and incorporates animated elements that make it more interesting for the viewer. This is the perfect presentation to introduce your company's investment portfolio to potential investors.


6 diapositivas
Meeting Planner Infographics
Efficiently plan and organize meetings with our Meeting Planner infographic template. This template is fully compatible with popular presentation software like PowerPoint, Keynote, and Google Slides, allowing you to easily customize it to illustrate and communicate the key steps and strategies for effective meeting planning. The Meeting Planner infographic template offers a visually engaging platform to outline the meeting planning process, including scheduling, agenda creation, participant coordination, and follow-up actions. Whether you're a project manager, event planner, or business professional, this template provides a user-friendly canvas to create informative presentations and educational materials on meeting planning best practices. Optimize your meeting planning skills and efficiency with this SEO-optimized Meeting Planner infographic template, thoughtfully designed for clarity and ease of use. Customize it to showcase tips for successful meetings, tools for scheduling, and strategies for engaging participants, ensuring that your audience becomes more proficient in planning and executing productive meetings. Start crafting your personalized infographic today to become a more effective Meeting Planner.