


Características


¿Tienes alguna pregunta?
Recomendar


4 diapositivas
Real Estate and Housing Market Presentation
Turn market insights into visual stories that captivate investors and clients alike. This sleek and modern presentation helps you illustrate property trends, housing data, and real estate growth with clarity and confidence. Fully customizable and compatible with PowerPoint, Keynote, and Google Slides for easy editing and professional results.


5 diapositivas
Online Advertising and SEO Marketing Presentation
Elevate your digital marketing strategy with this engaging infographic template! Designed for clarity, it simplifies online advertising and SEO concepts, covering key metrics, trends, and strategies. Perfect for teams, clients, or stakeholders, it’s fully customizable and compatible with PowerPoint, Keynote, and Google Slides for seamless presentations that captivate and inform.


5 diapositivas
Skills Gap Assessment Presentation
Spot talent strengths and uncover hidden weaknesses with a clean, visual layout that makes workforce insights easy to understand. This presentation helps teams evaluate current abilities, identify missing competencies, and plan targeted development. Ideal for HR, training, and leadership reviews. Fully compatible with PowerPoint, Keynote, and Google Slides.


6 diapositivas
Supply Chain and Logistics Strategy Presentation
Streamline complex logistics workflows with this bold, dual-loop arrow layout. Ideal for showcasing the full cycle of sourcing, distribution, warehousing, and returns, this diagram lets you visualize forward and reverse logistics processes side by side. Customizable icons, clear progression, and ample space for key data make this a must-have for operations managers, procurement teams, and logistics planners. Fully compatible with PowerPoint, Keynote, and Google Slides.


6 diapositivas
Conversion Funnel Stages Overview Presentation
Visualize user journeys with clarity using the Conversion Funnel Stages Overview Presentation. This funnel diagram template breaks down key conversion phases—from awareness to decision—into distinct, color-coded stages. Ideal for marketing reports, sales strategies, or product demos. Fully editable in PowerPoint, Google Slides, and Canva.


5 diapositivas
Business Insights Through Dashboard Visualization Presentation
Visualize key metrics with this Business Insights Through Dashboard Visualization presentation. The funnel chart layout is ideal for showcasing conversion rates, customer journeys, or sales processes. Each section includes clear labels and percentage indicators. Fully editable in Canva, PowerPoint, and Google Slides to suit your business reporting needs.


20 diapositivas
Waterfall Project Proposal Presentation
Get ready to impress with the Waterfall Project Proposal template! This visually striking and highly organized template is designed to help you communicate your project plan with clarity and impact. Start with an engaging introduction and company overview, then seamlessly guide your audience through the project summary, problem statement, and your proposed solutions. This template covers all essential aspects, including objectives, goals, scope of work, methodology, and a detailed timeline of milestones. With dedicated sections for pricing structure, team expertise, and client testimonials, you can showcase the strengths and reliability of your proposal. The template also includes slides for risk management, terms and conditions, and a clear next steps action plan. Perfect for any professional setting, this template is fully customizable and compatible with PowerPoint, Keynote, and Google Slides, ensuring that your proposal looks polished and professional every time.


5 diapositivas
Renewable Natural Energy Resources Infographics
Renewable natural energy resources, also known as renewable energy sources, are energy sources that are replenished naturally and sustainably. These vertical infographics serve as educational tools to promote awareness and understanding of renewable energy sources. They can be used in presentations, workshops, educational materials, or sustainability initiatives to inspire individuals, organizations, and communities to embrace and invest in renewable energy for a greener and more sustainable future. They are fully customizable and compatible with Powerpoint, Keynote, and Google Slides.

20 diapositivas
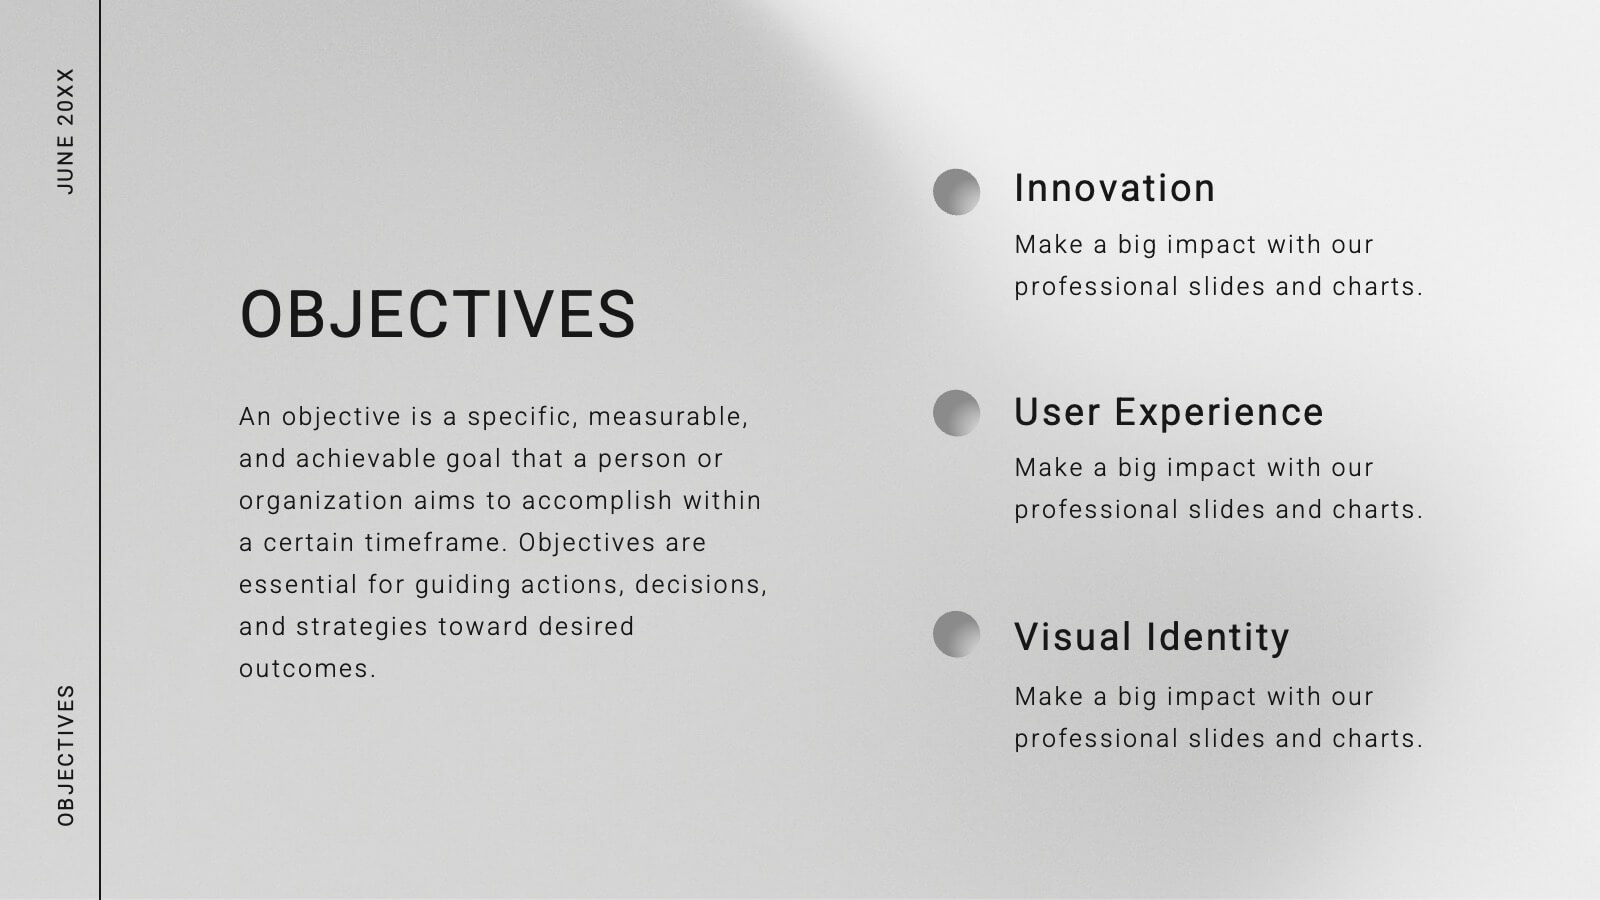
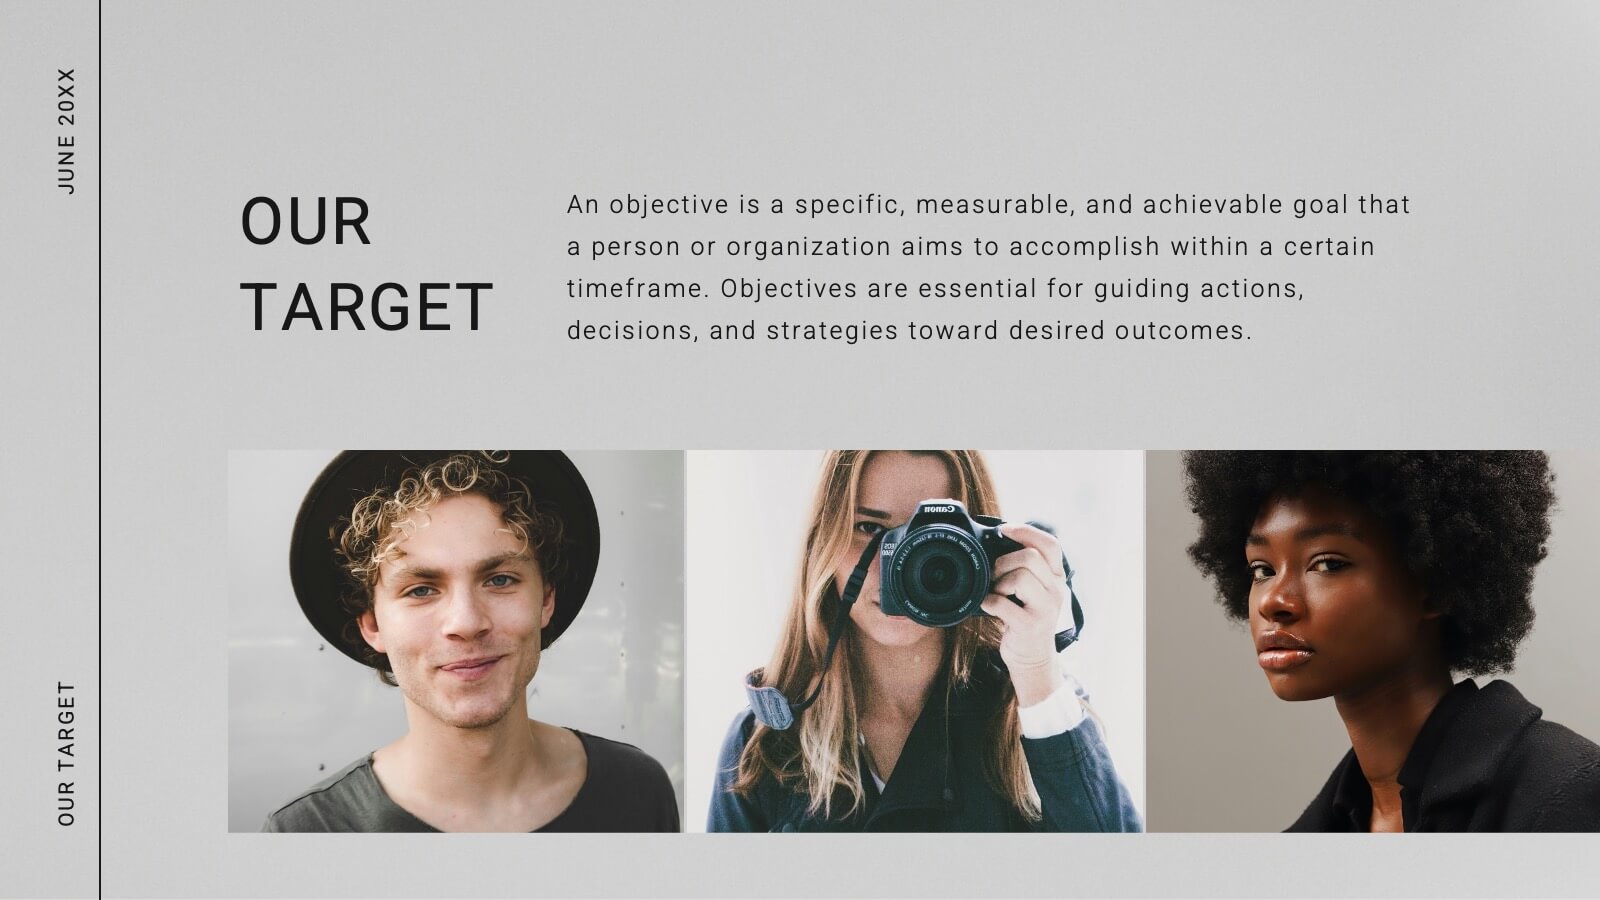
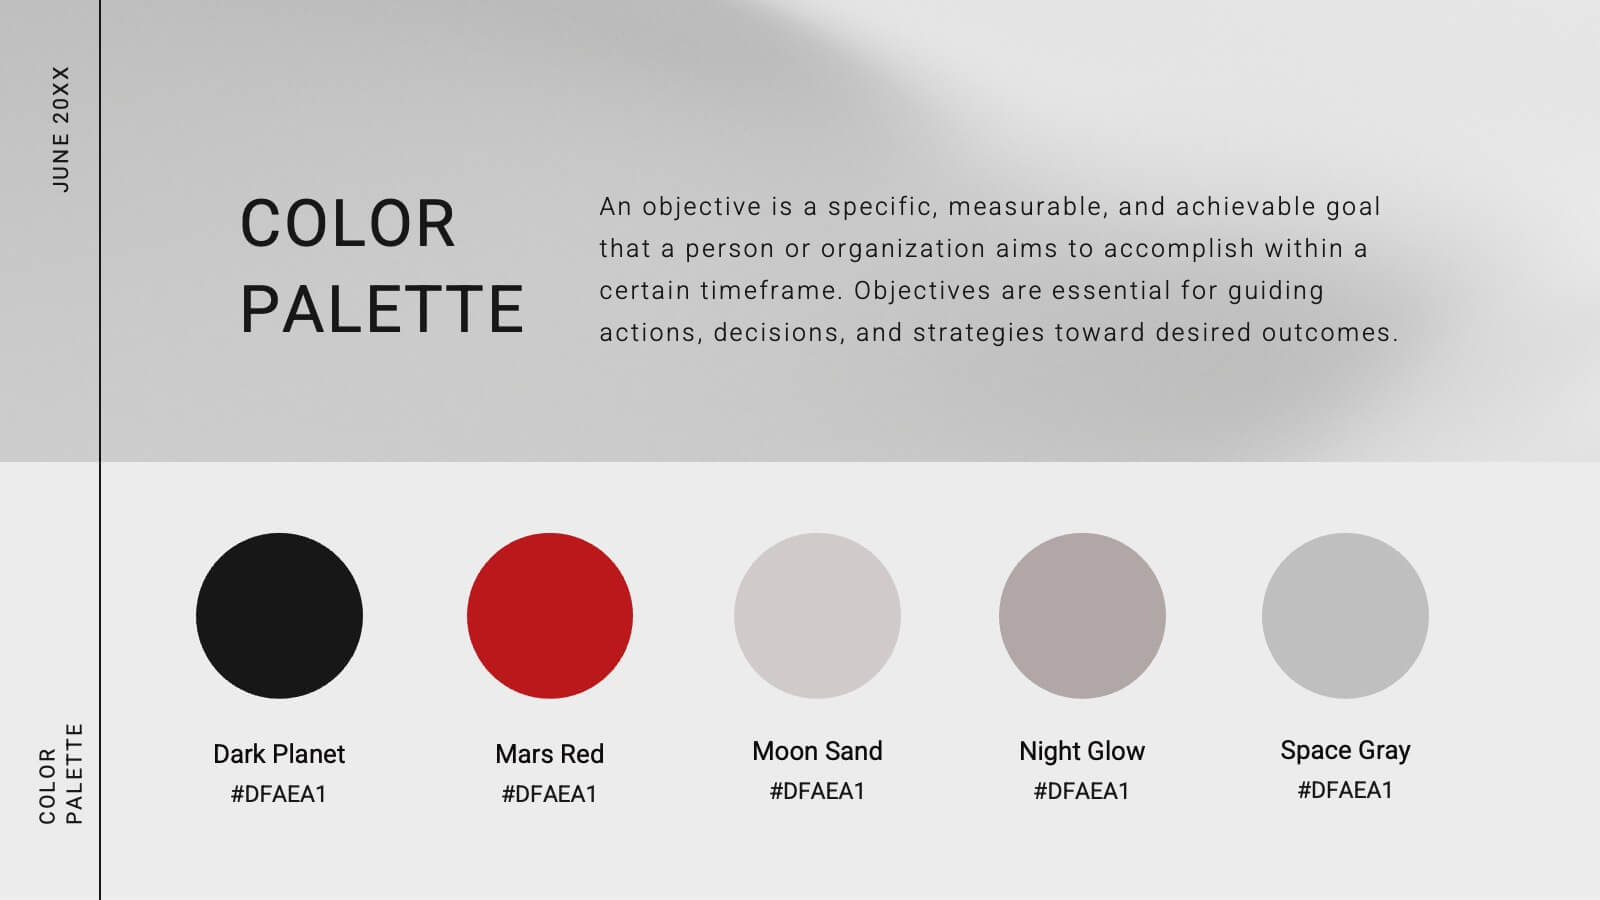
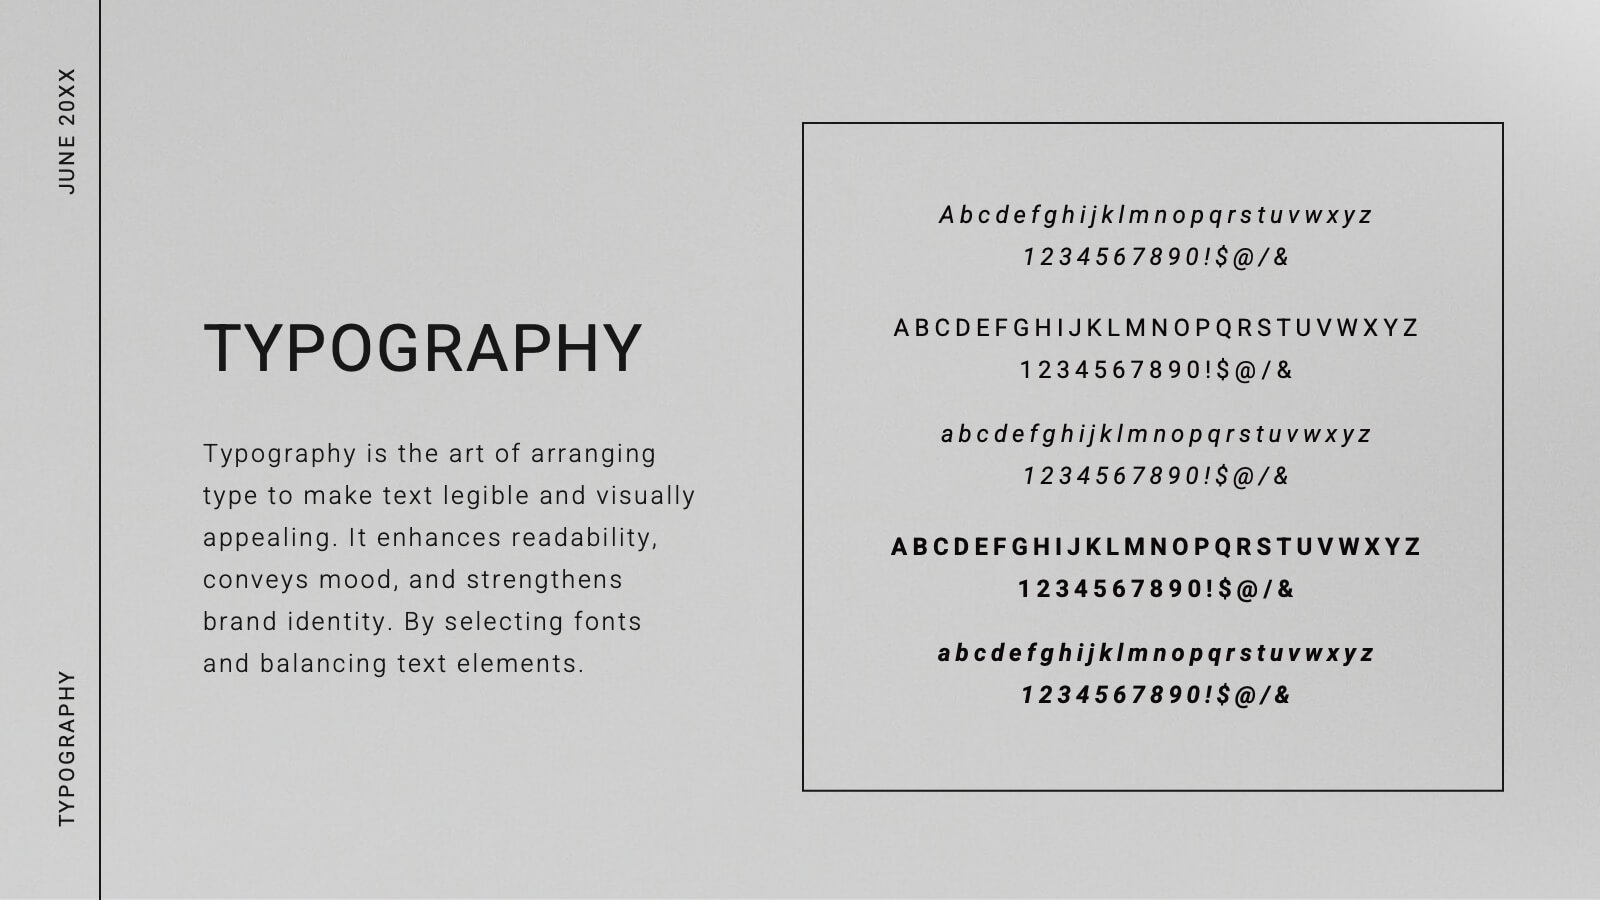
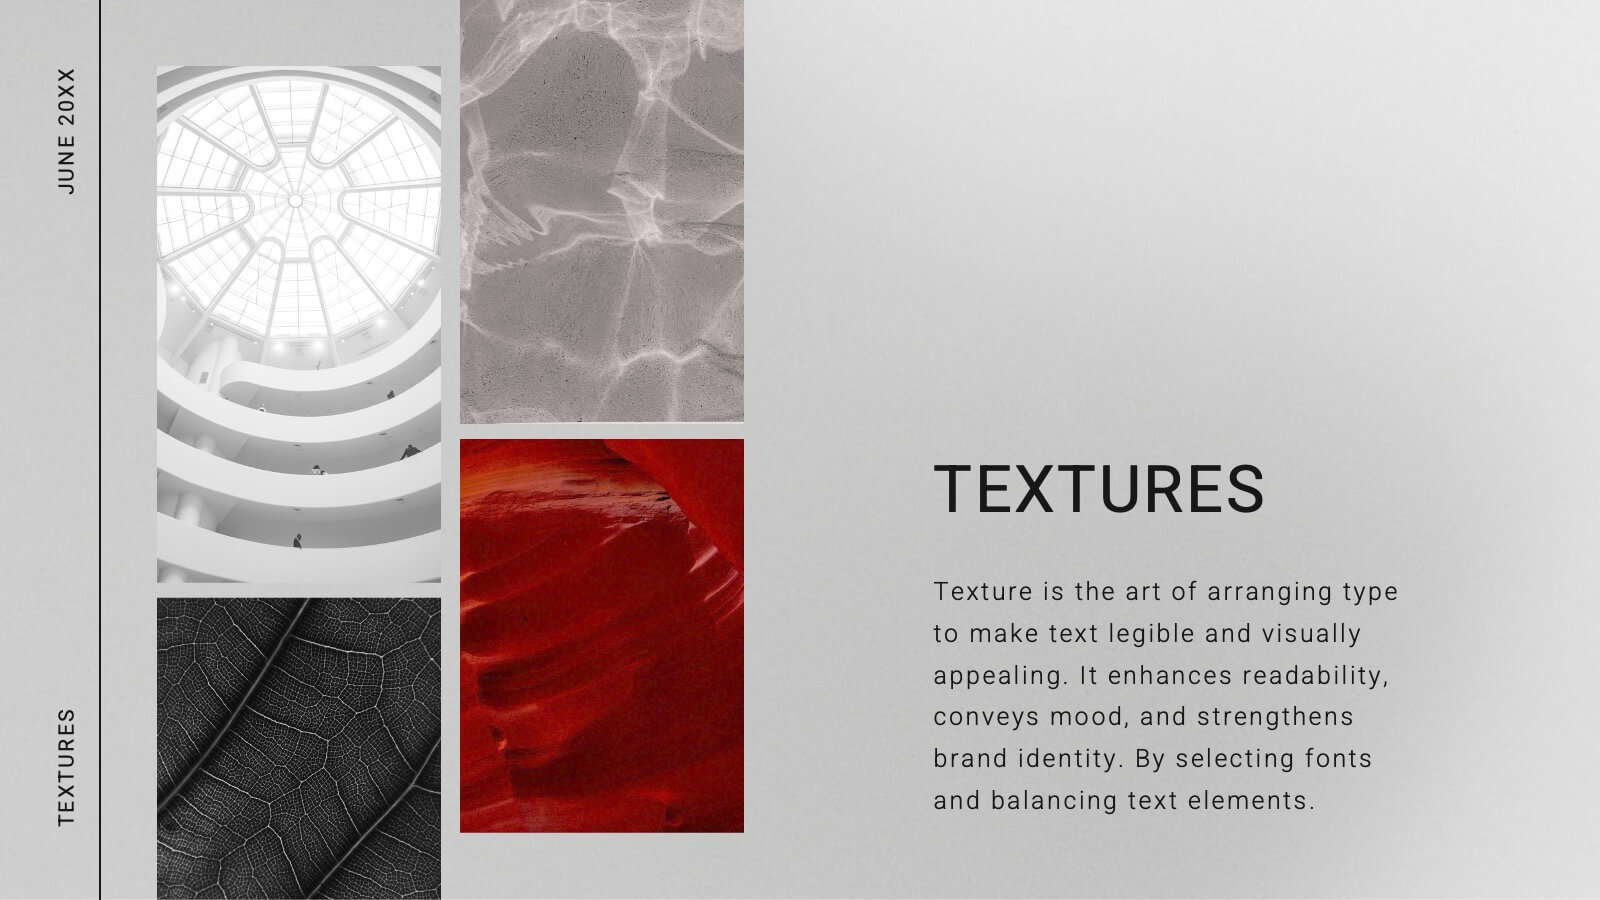
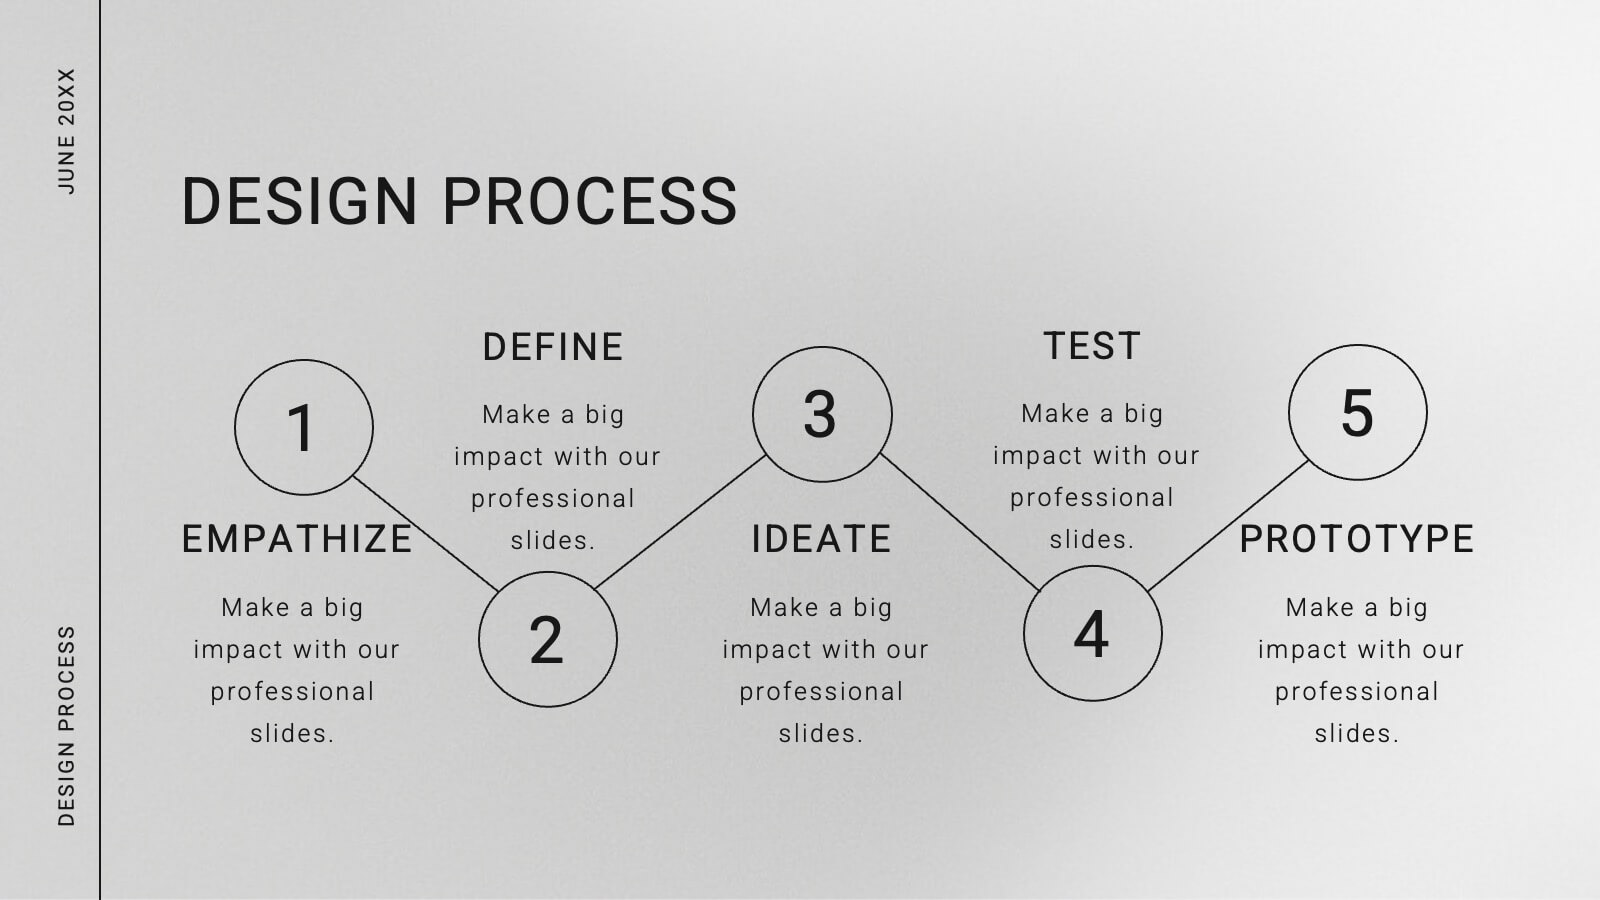
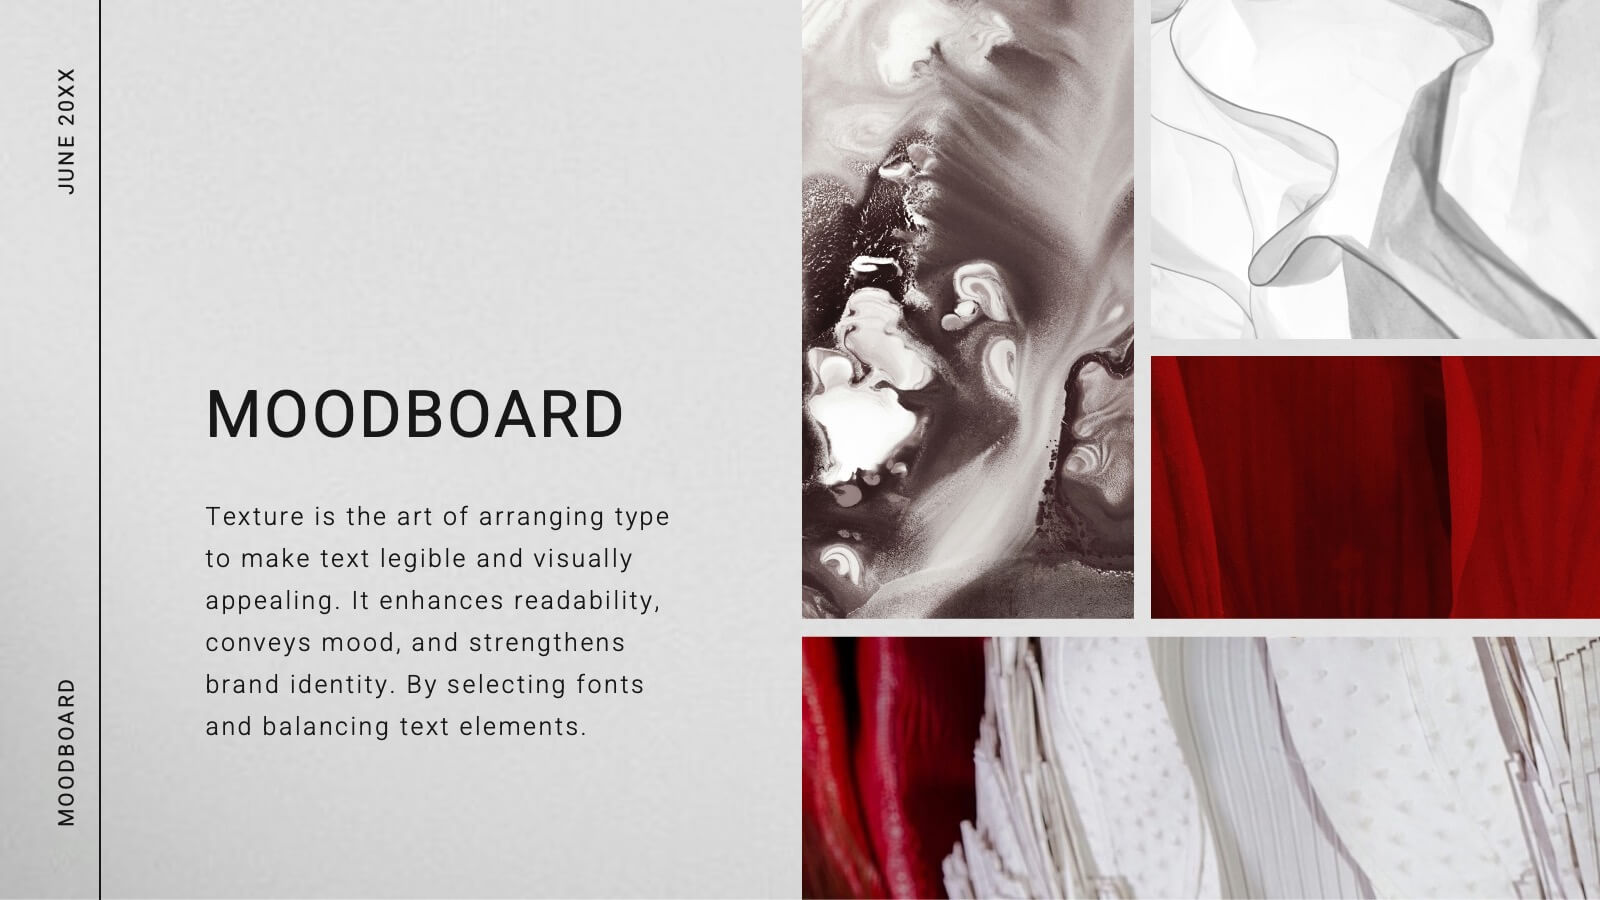
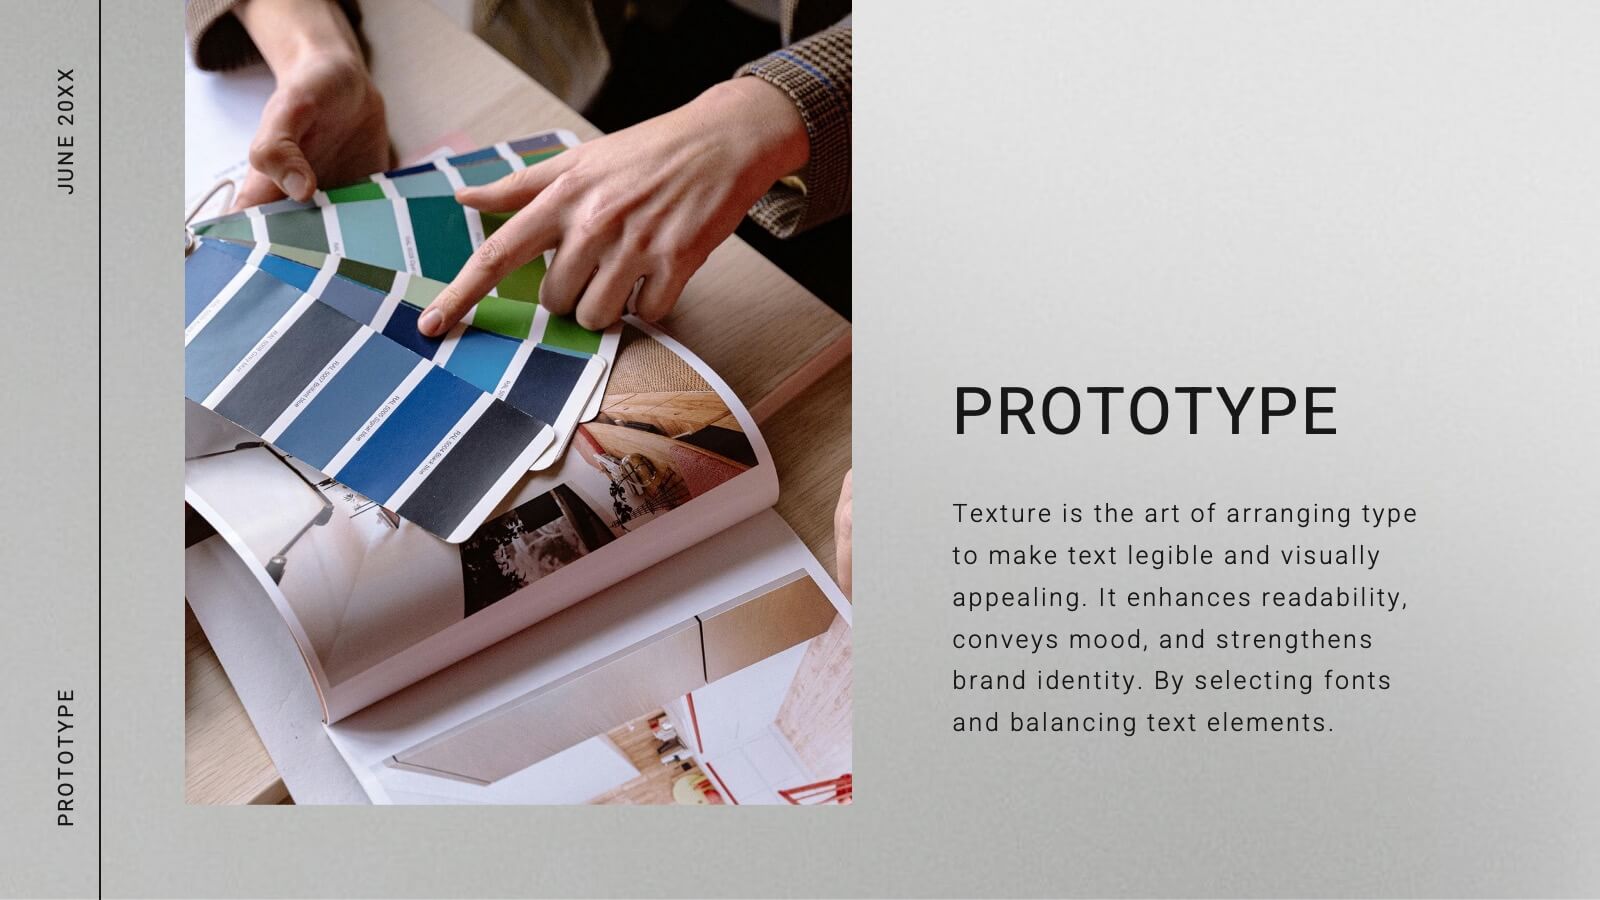
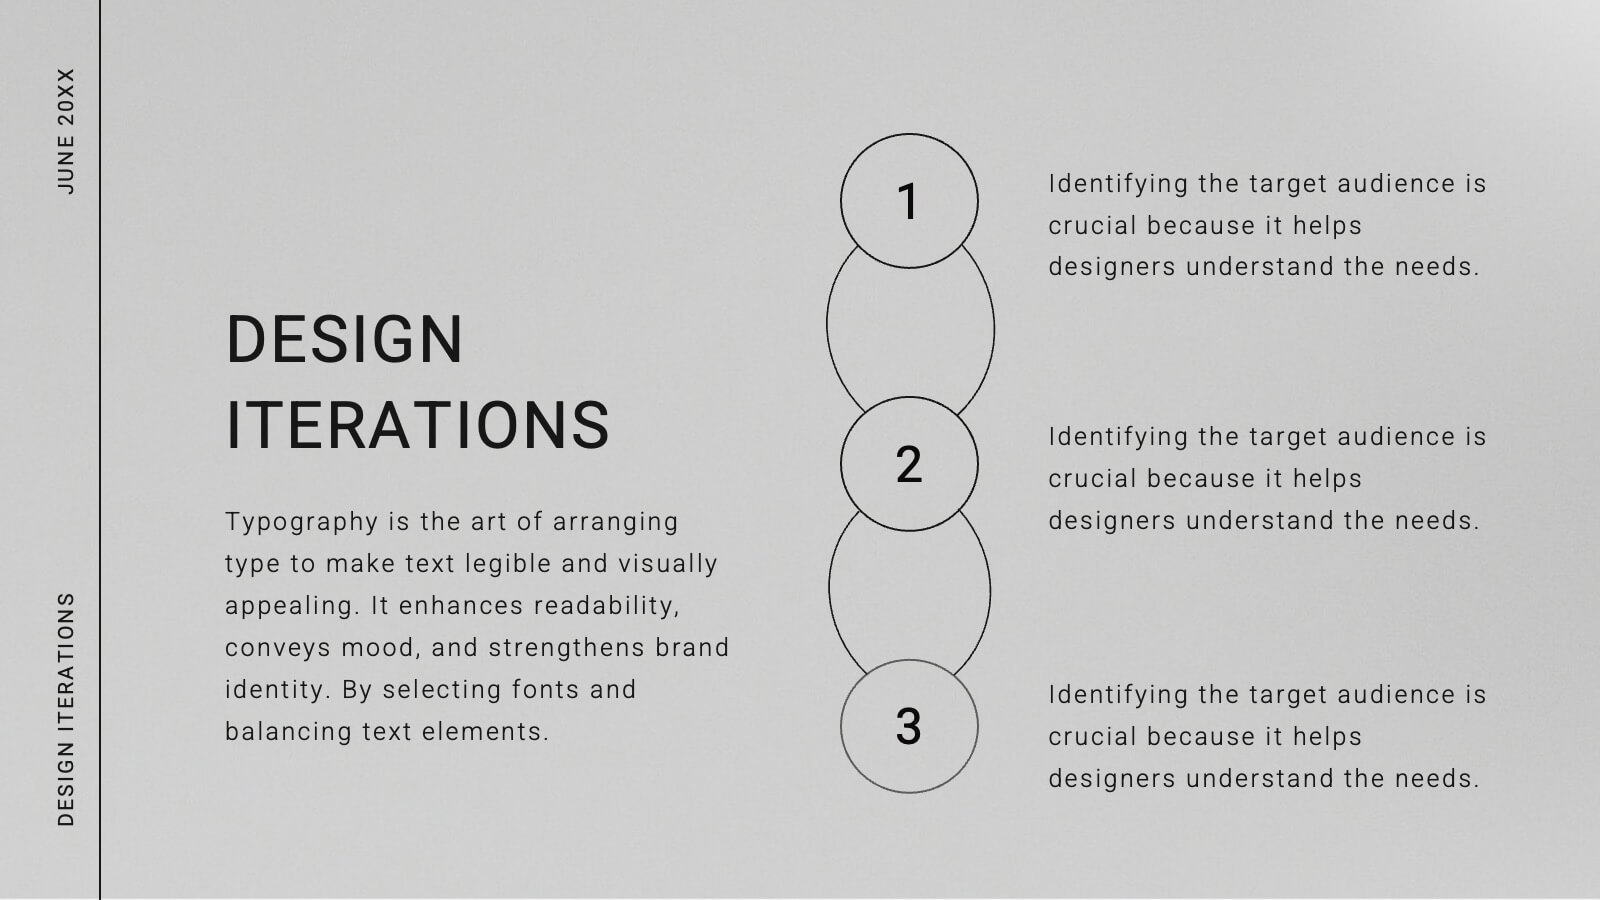
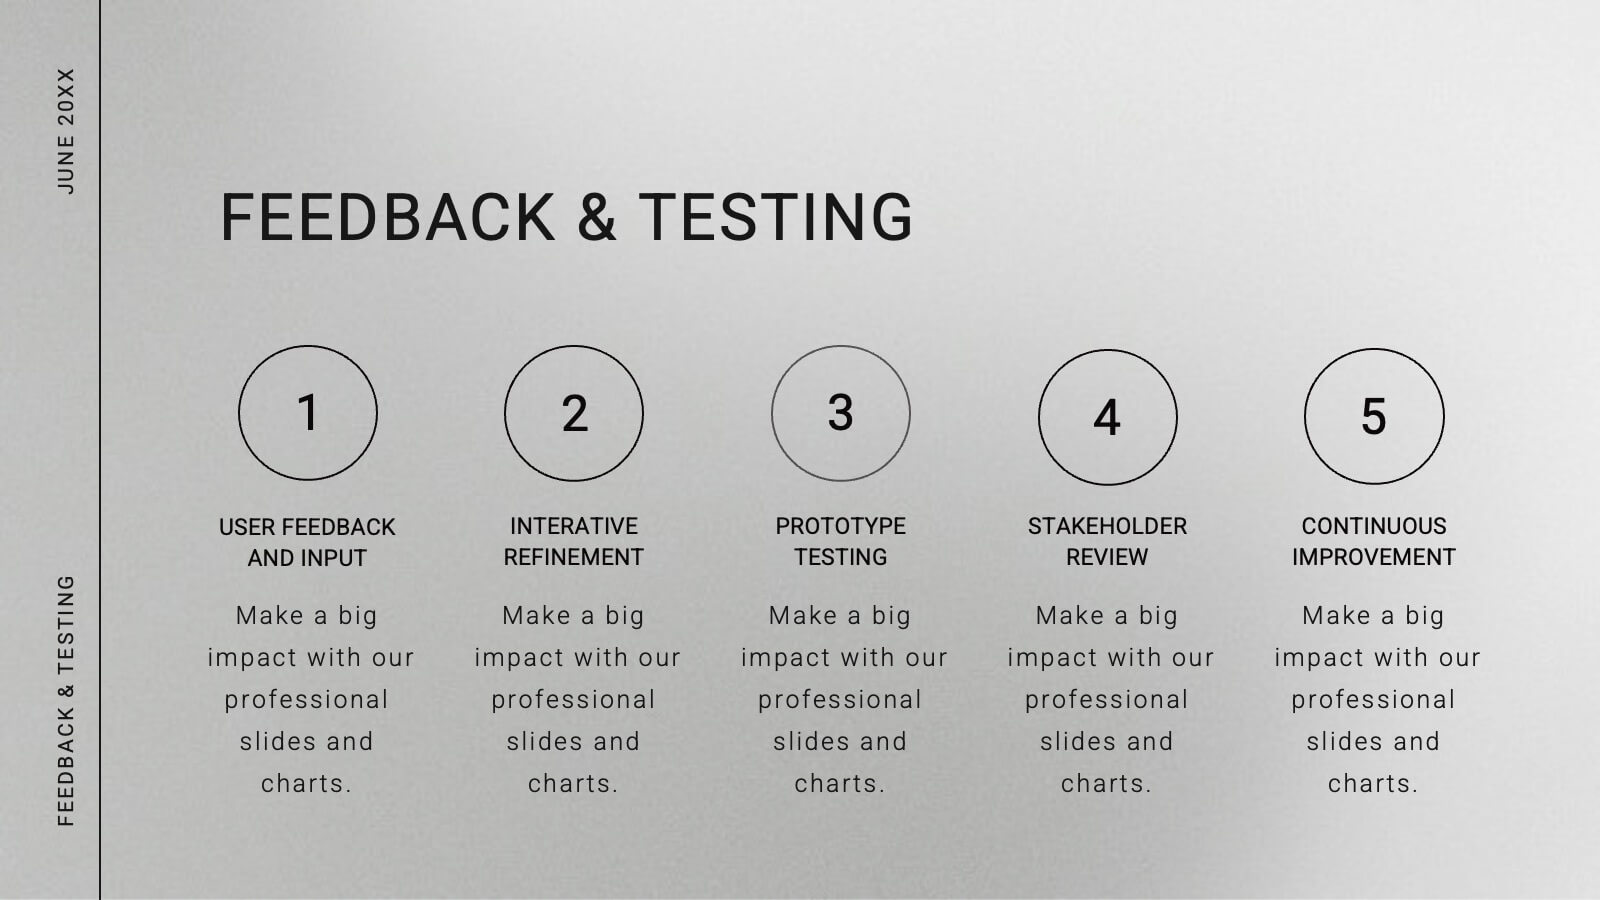
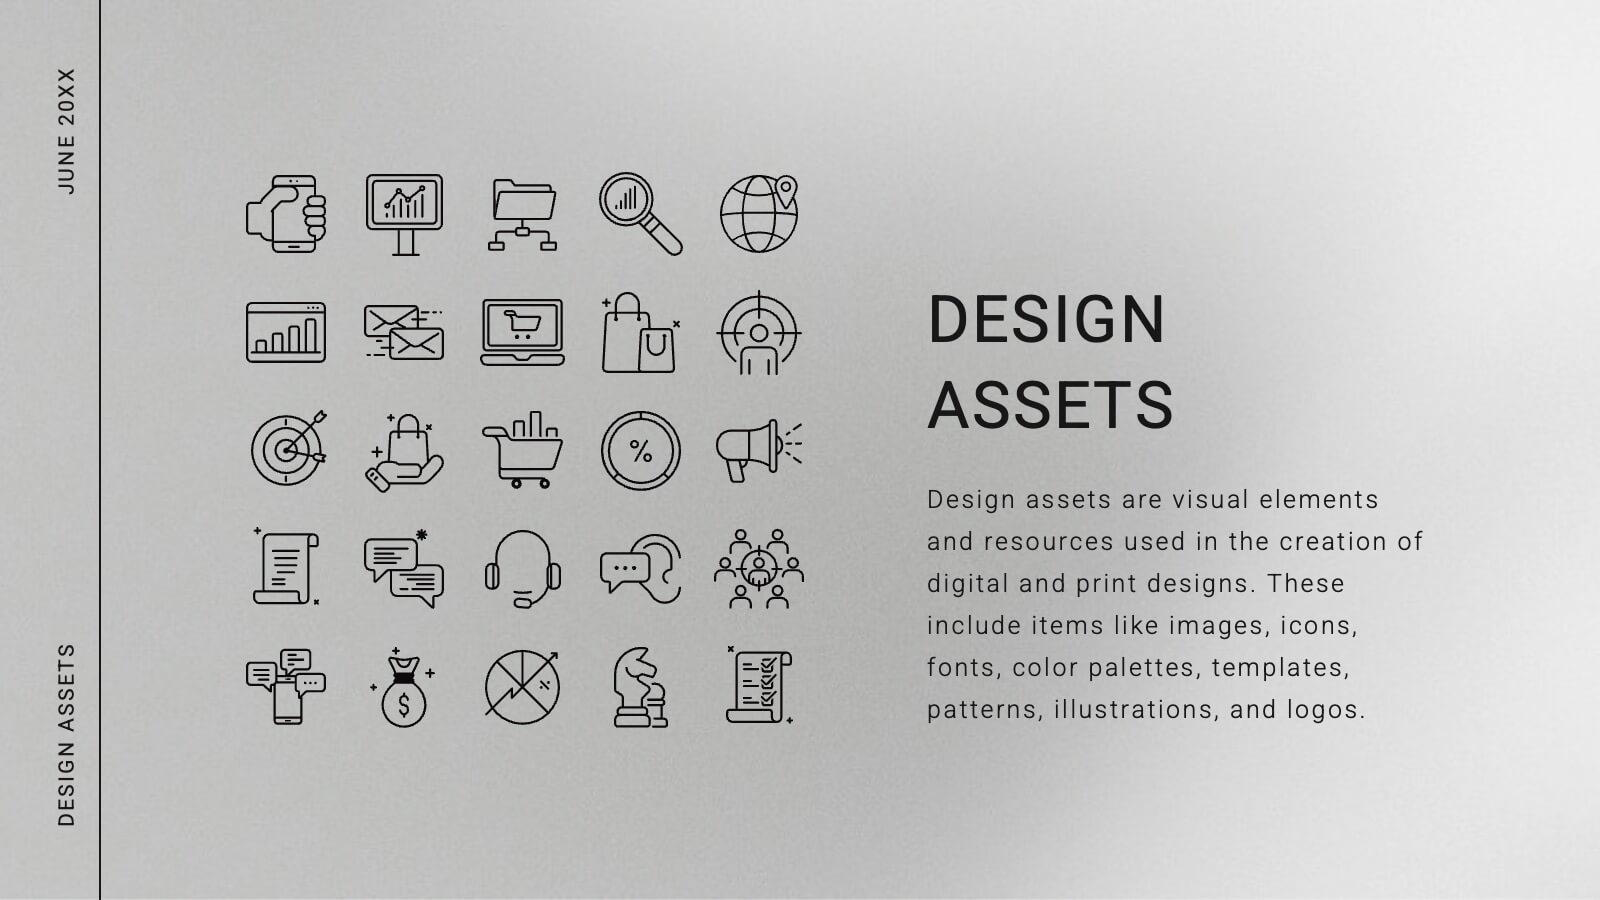
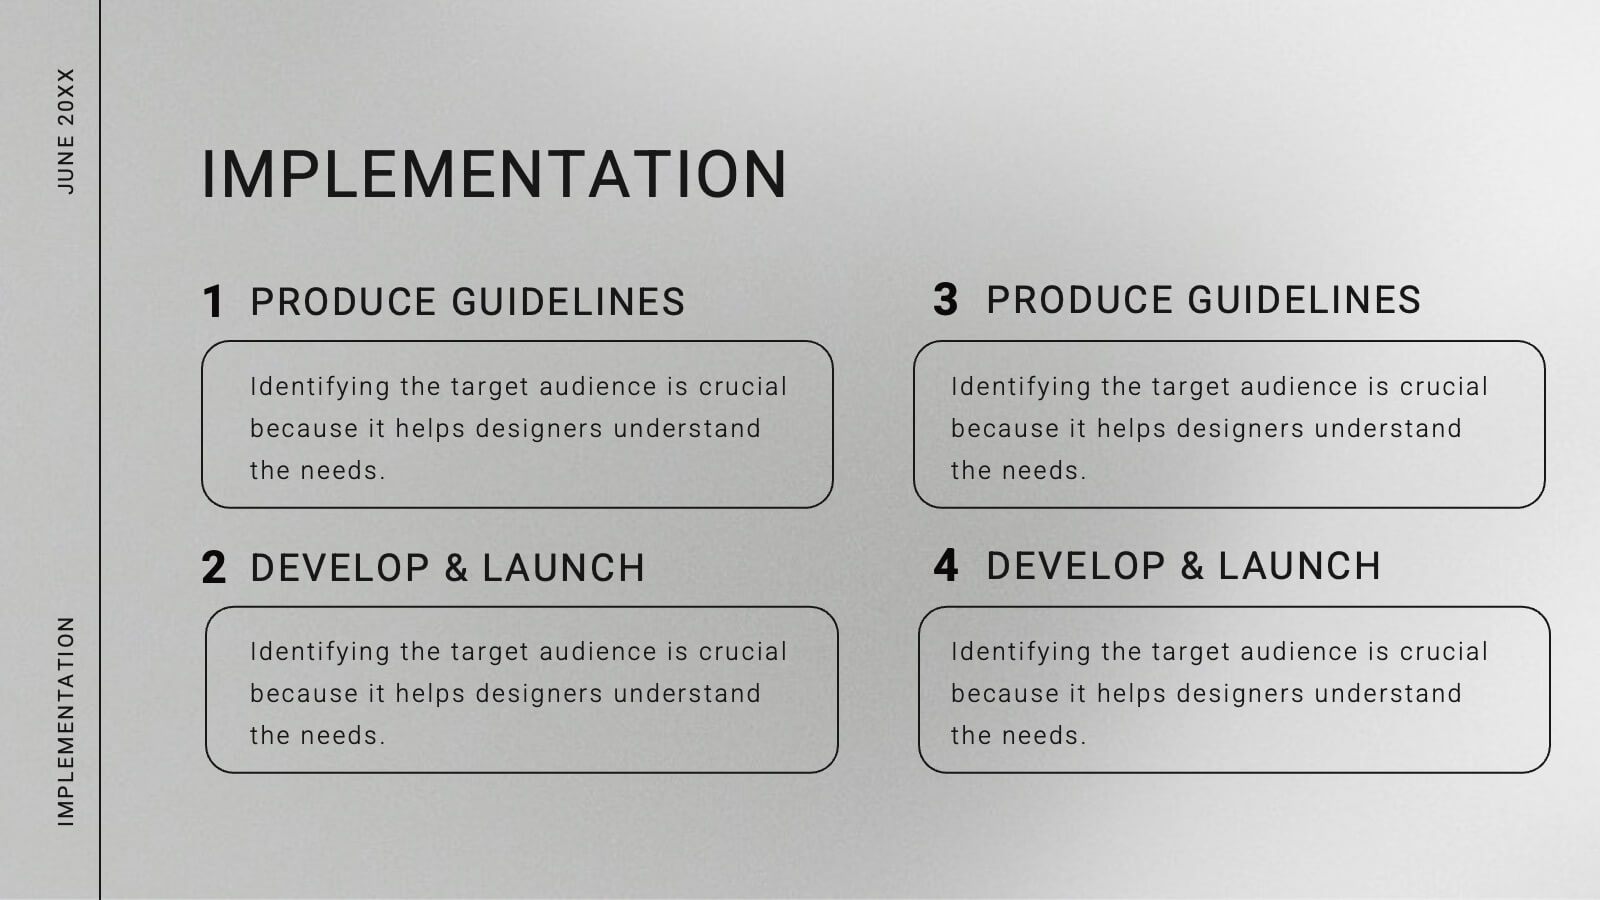
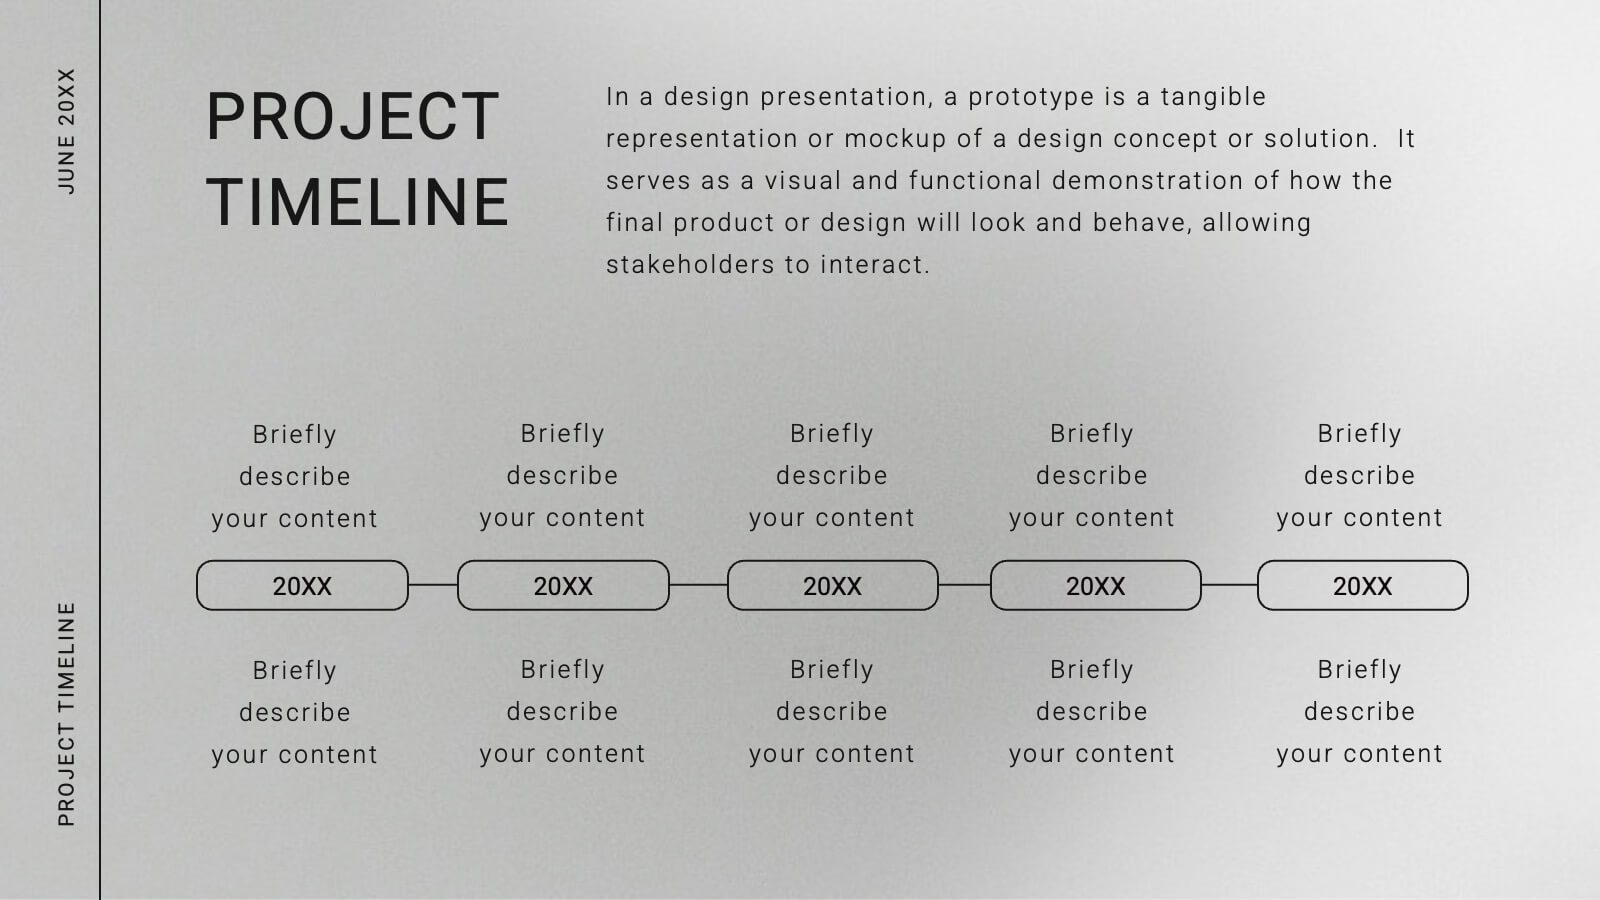
Comet Graphic Design Project Plan Presentation
Craft stunning design project presentations with this elegant template. Showcase objectives, processes, mood boards, and final designs effectively. Ideal for creative teams and clients. Fully compatible with PowerPoint, Keynote, and Google Slides.


21 diapositivas
Glacieron Financial Report Presentation
This Financial Report Presentation Template is a professional and visually engaging tool to showcase financial performance, key metrics, and strategic initiatives. It includes slides for performance metrics, financial summaries, competitor insights, and future goals, making it ideal for business reviews and stakeholder meetings. Compatible with PowerPoint, Keynote, and Google Slides for easy customization.


5 diapositivas
Restaurant Experience Infographics
The Restaurant industry plays a vital role in providing food, employment, and social spaces while contributing to economic growth and cultural exchange. These infographic templates are designed to showcase various aspects of the restaurant experience. It is an ideal tool for restaurant owners, managers, and marketers to present data, statistics, and key information about their establishment's unique features and offerings. The template includes a collection of eye-catching infographics that cover different elements of the restaurant experience. The graphics are designed in a modern and vibrant style, with attractive colors that capture attention.


6 diapositivas
Concentric Circles Strategy Infographics
Visualize your strategic approach with our Concentric Circles Strategy infographic template. This template is fully compatible with popular presentation software like PowerPoint, Keynote, and Google Slides, allowing you to easily customize it to illustrate and communicate your concentric circles strategy. The Concentric Circles Strategy infographic template offers a visually engaging platform to depict your strategy's core, intermediate, and peripheral elements. Whether you're a business leader, strategist, or planner, this template provides a user-friendly canvas to create informative presentations and effectively communicate your strategic vision. Enhance your strategic planning with this SEO-optimized Concentric Circles Strategy infographic template, thoughtfully designed for clarity and ease of use. Customize it to highlight the key components of your concentric circles strategy, ensuring that your team and stakeholders grasp the strategic direction clearly. Start crafting your personalized infographic today to drive alignment and execution of your strategic goals.


8 diapositivas
TAM SAM SOM Market Analysis Presentation
Define Your Market Potential Clearly with this TAM SAM SOM Market Analysis Presentation template. Designed to break down Total Addressable Market (TAM), Serviceable Available Market (SAM), and Serviceable Obtainable Market (SOM), this structured layout helps startups, investors, and business analysts showcase market opportunities and growth potential. Fully customizable and compatible with PowerPoint, Keynote, and Google Slides, this template is perfect for fundraising pitches, strategic planning, and competitive analysis.


7 diapositivas
Geometric Sequence Infographic Presentation
Geometric infographics typically involve the use of various shapes to convey different pieces of information. This Geometric Template is a professional way to show your great designworks and ideas. This template can be used in a variety of contexts, from business and marketing to education and journalism. This clean design includes many categories, dividers and icons which will help you show your data in the best way. Start creating your own customized presentation by adding your text, images and other content from your slides, just download in PowerPoint, Keynote or Google Slides.


21 diapositivas
Somnara Full-Service Agency Project Plan Presentation
Present your agency’s expertise with a comprehensive project plan template designed to impress clients and stakeholders. This sleek and professional layout allows you to outline your mission and vision, highlight team strengths, and showcase core services with clarity. Use the client testimonials and case studies sections to establish credibility and trust. Visualize your strategic approach with dedicated slides for market analysis, creative process, and execution strategy. The template also includes detailed sections for partnership opportunities, social responsibility initiatives, and a future outlook, ensuring a holistic view of your agency’s capabilities and forward-thinking approach. Fully editable and compatible with PowerPoint, Google Slides, and Keynote, this template is perfect for full-service agencies seeking to elevate their presentations. Customize each slide to reflect your unique value and deliver impactful, results-oriented proposals.


7 diapositivas
Ecology Restoration Infographic
Dive into the world of eco-conscious solutions with our ecology restoration infographic. Adorned in soothing shades of white and fresh green, this template captures the essence of nature's rejuvenation. Compatible with Powerpoint, Keynote, and Google Slides, it boasts meticulously crafted graphics, intuitive icons, and user-friendly image placeholders, all tailored to emphasize the urgency and methods of restoring our planet's ecological balance. Ideal for environmentalists, educators, NGOs, or anyone aiming to spread awareness about our planet's well-being.


21 diapositivas
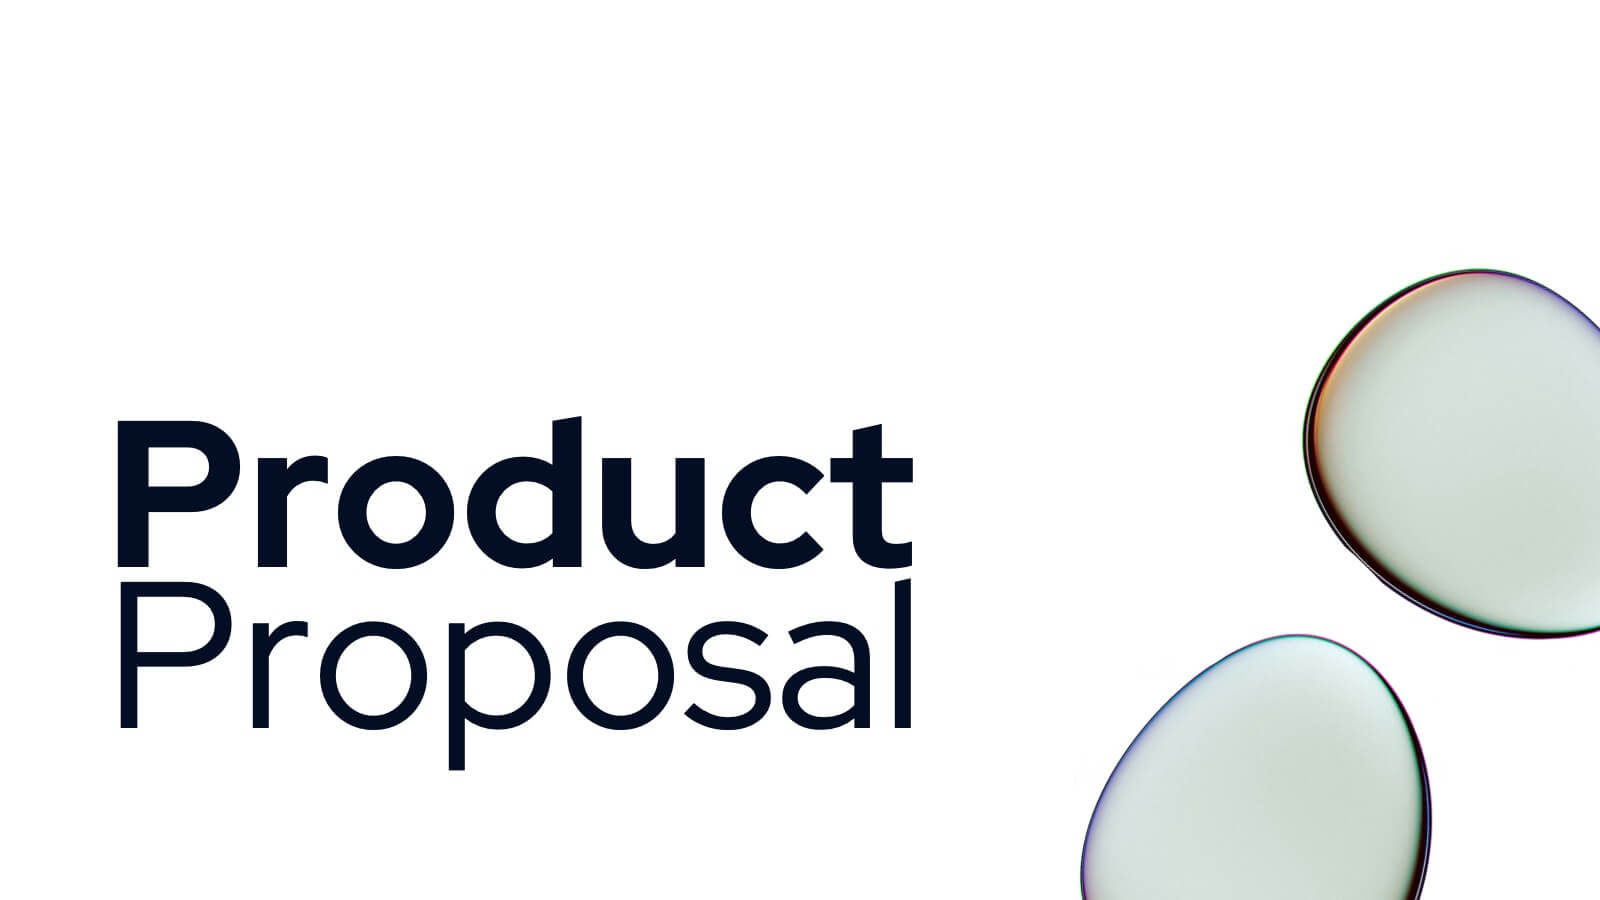
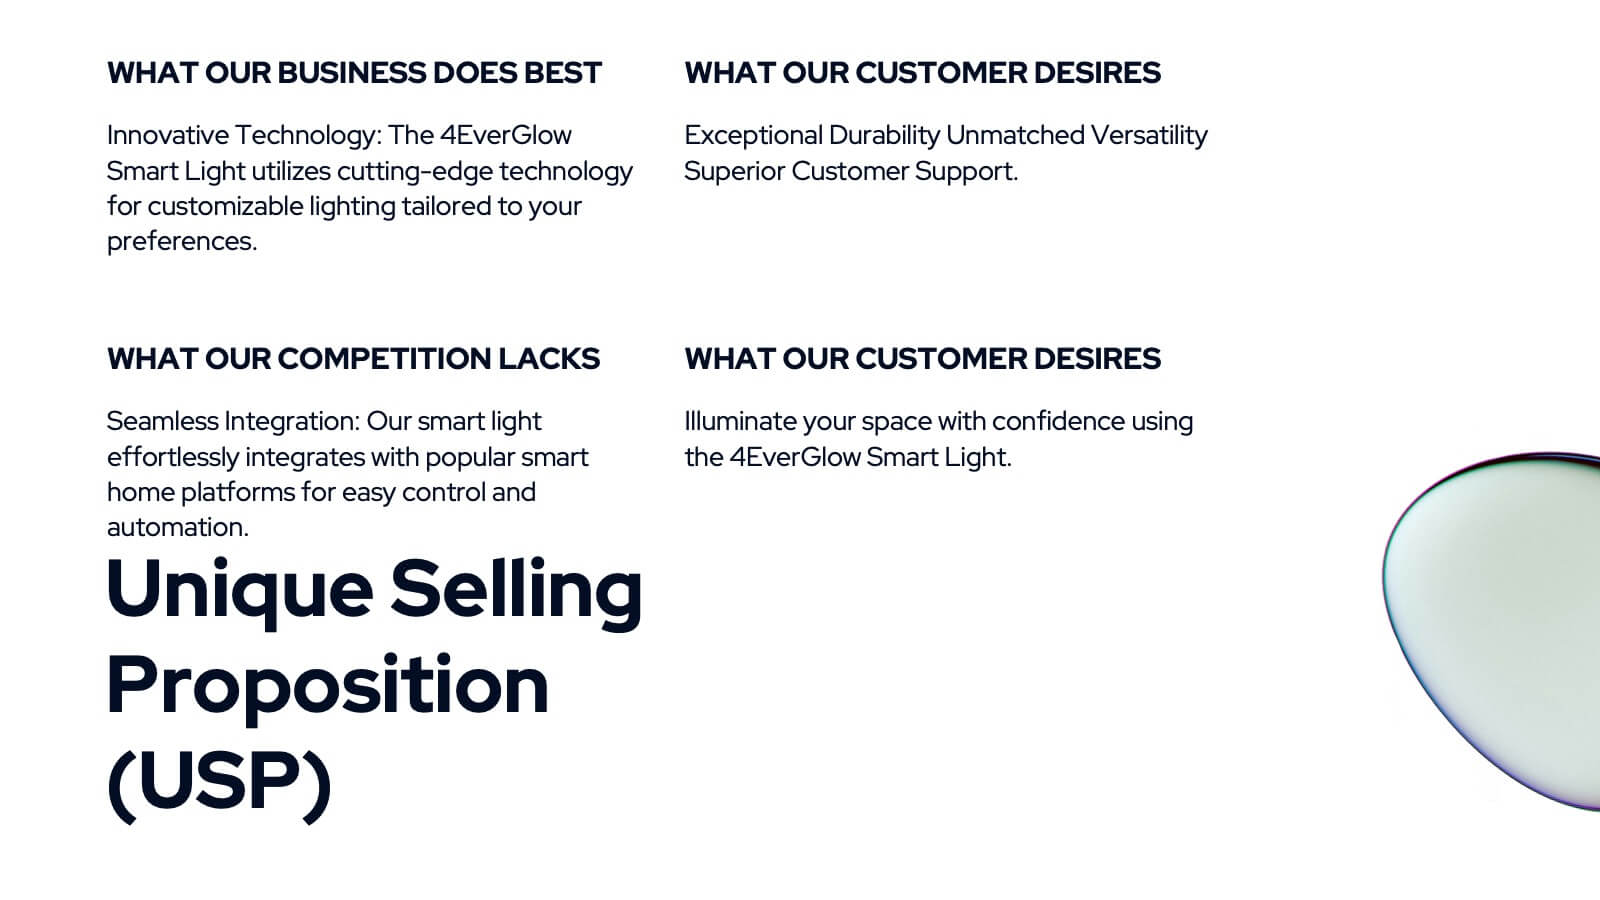
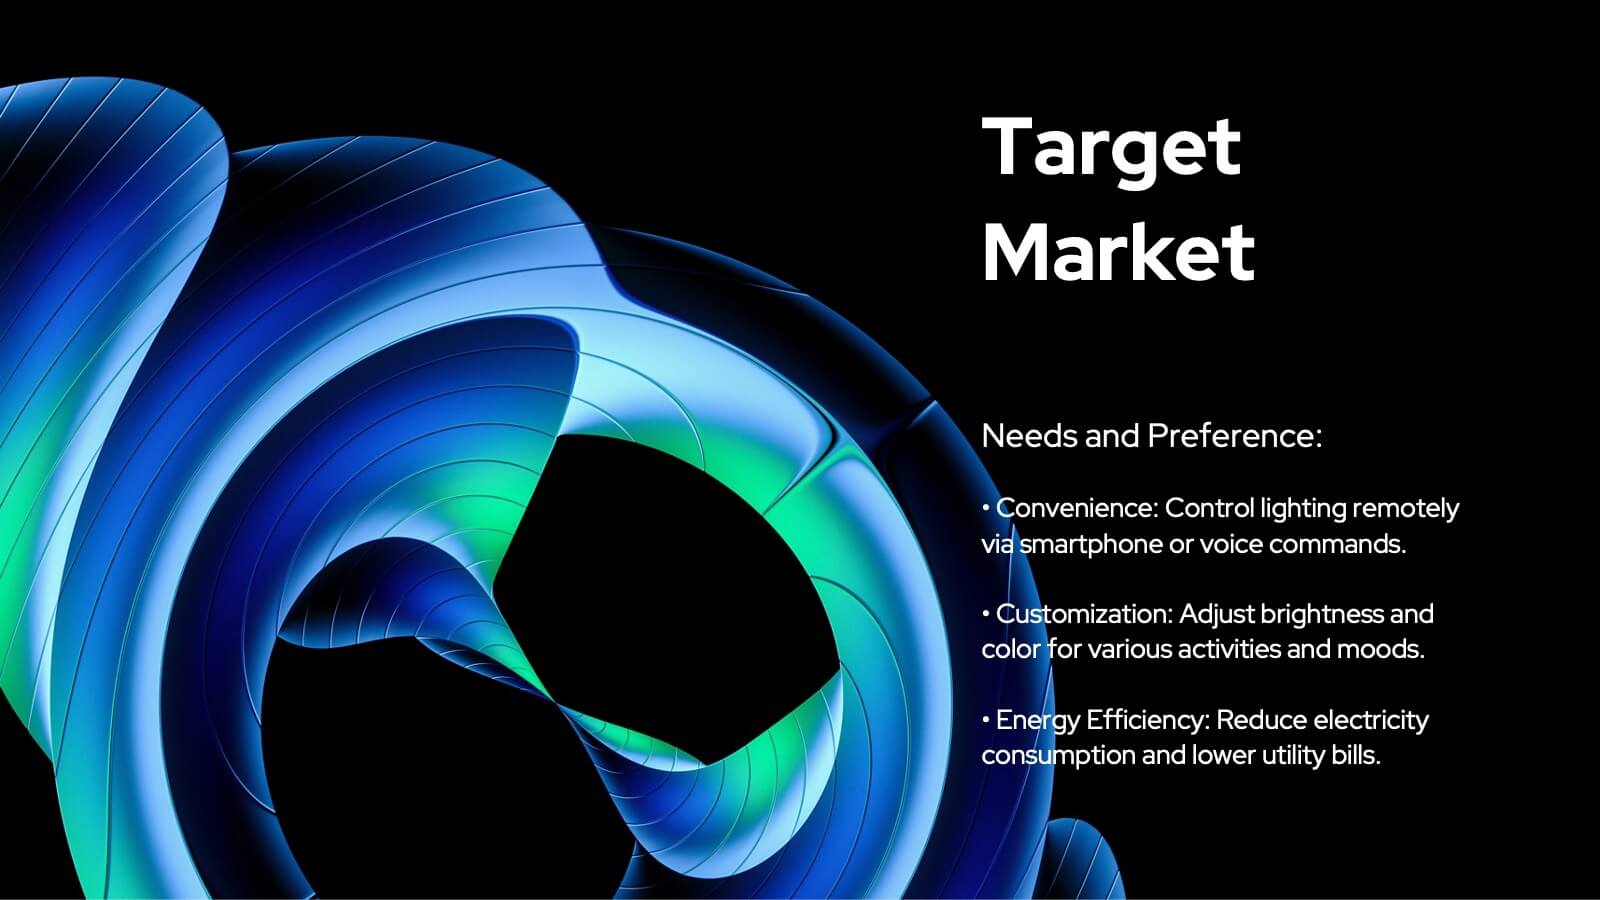
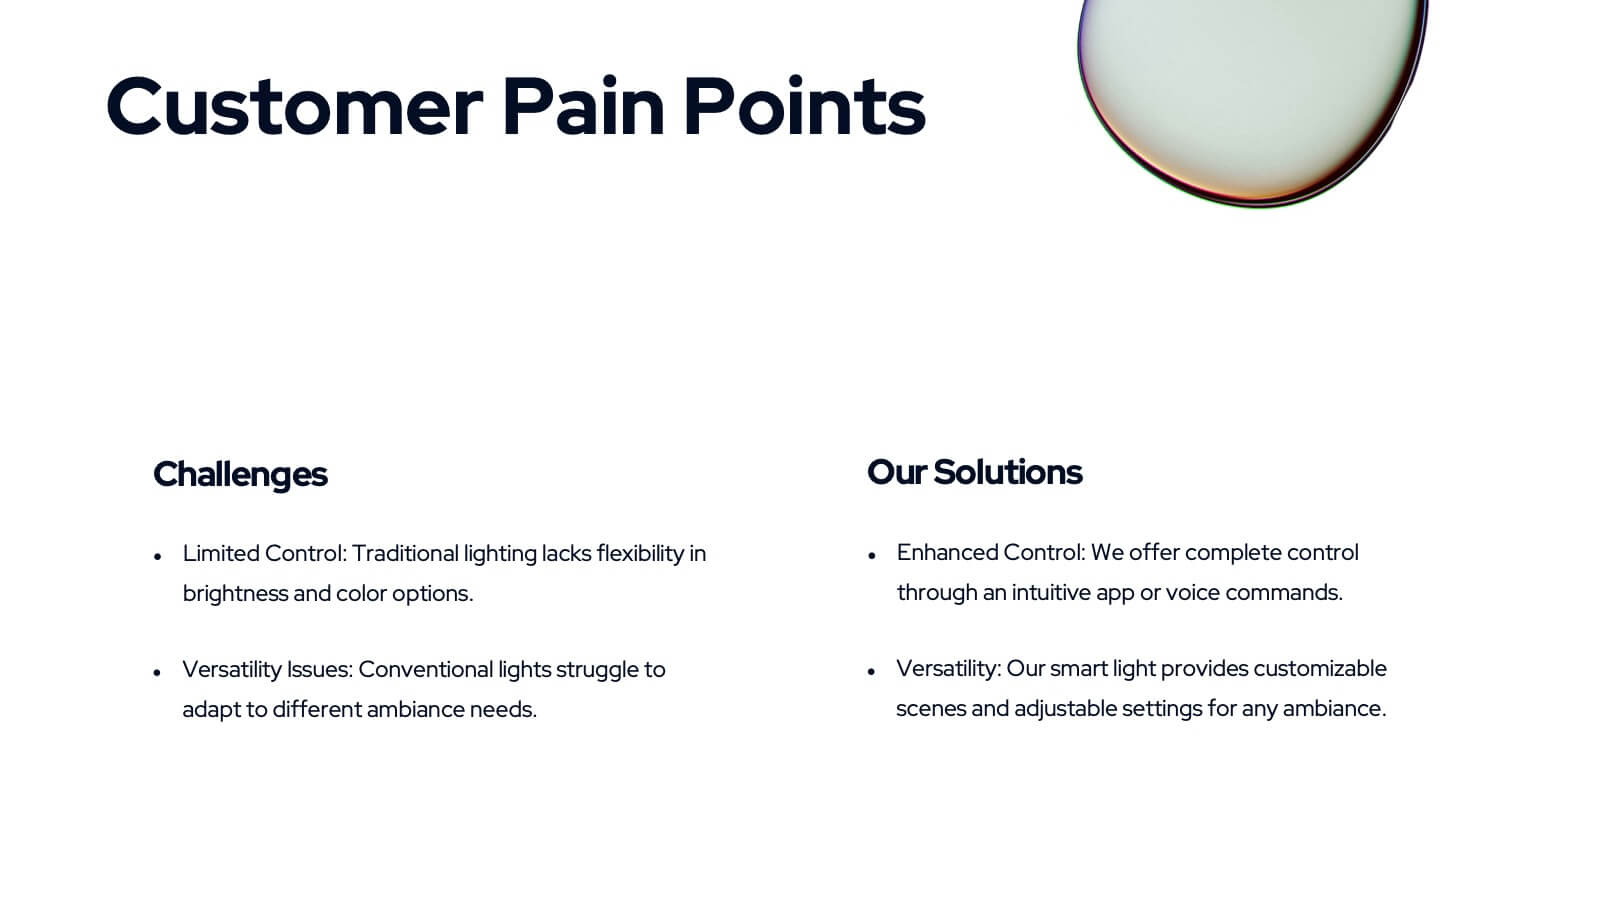
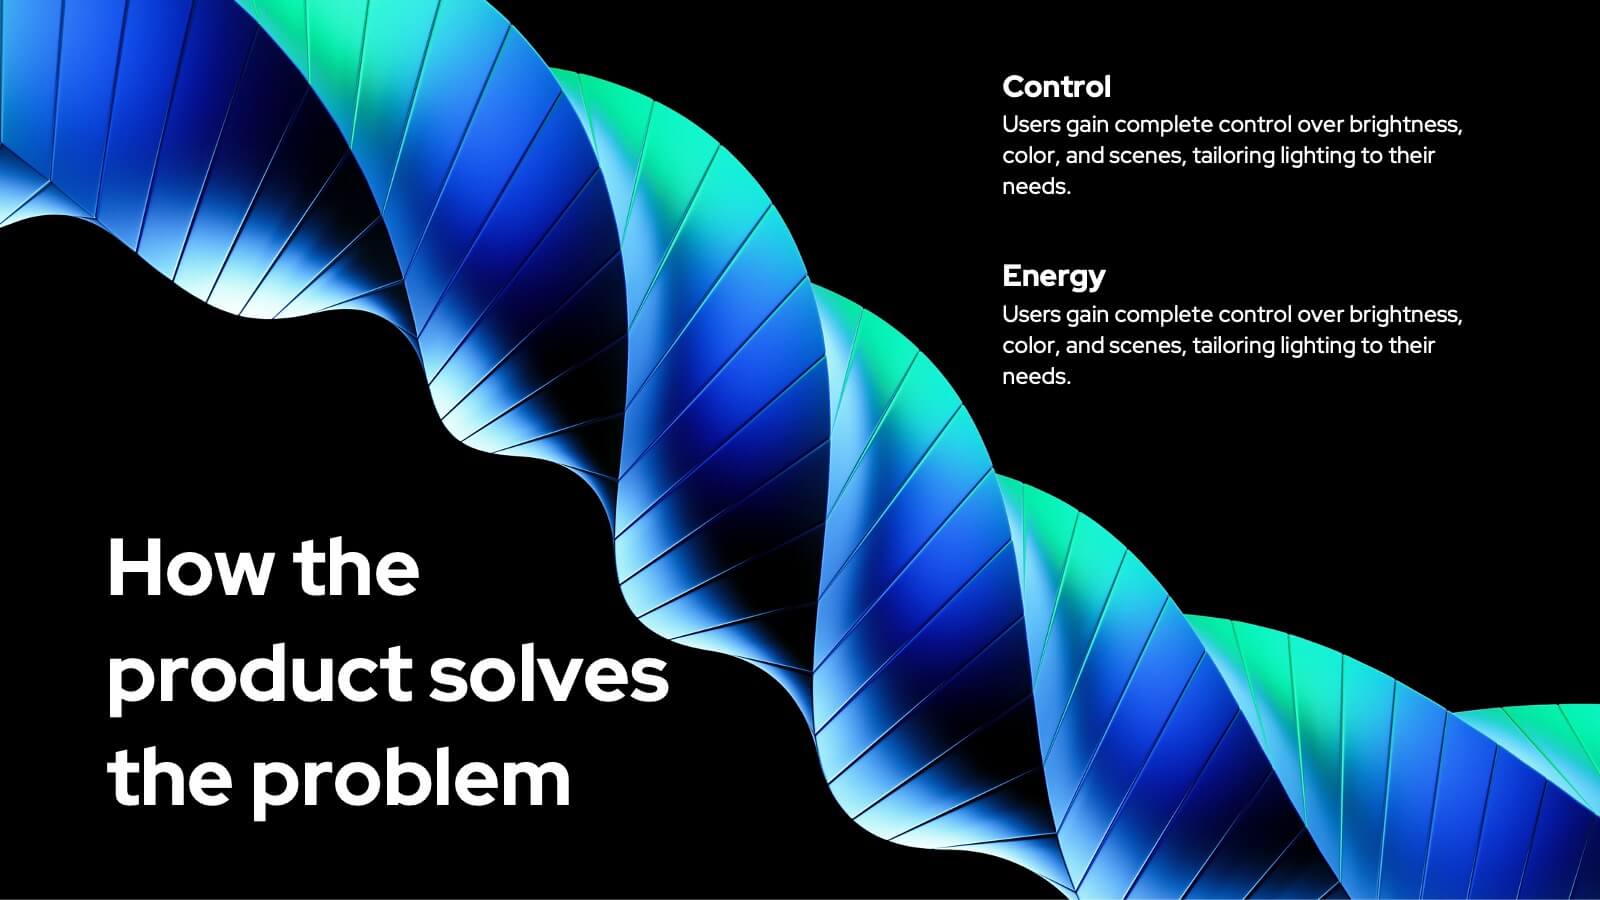
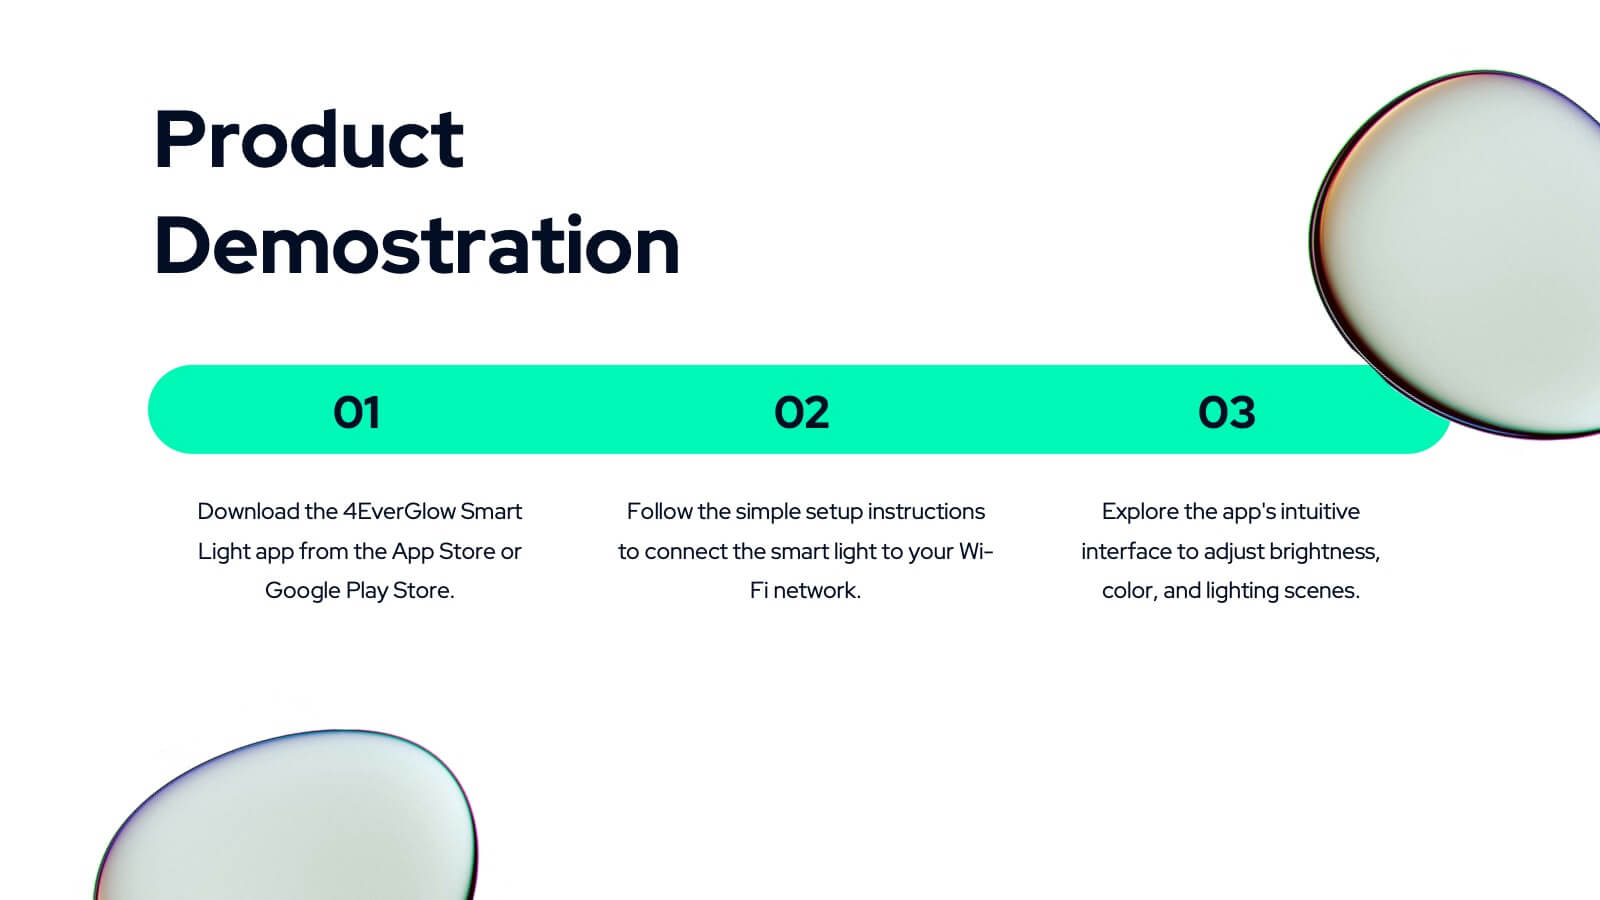
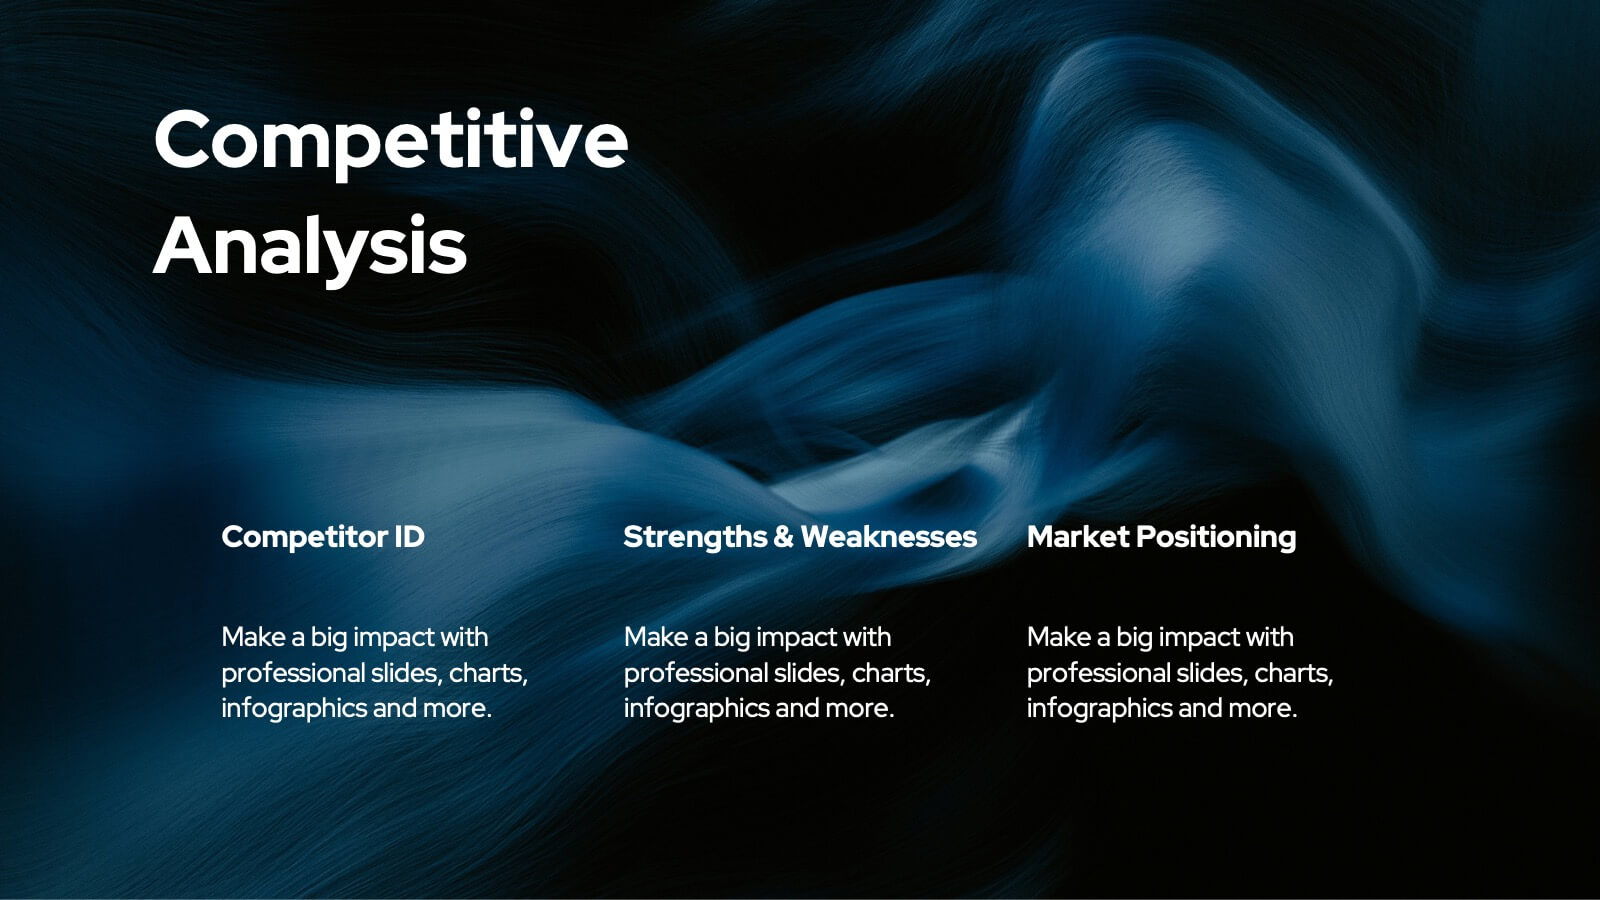
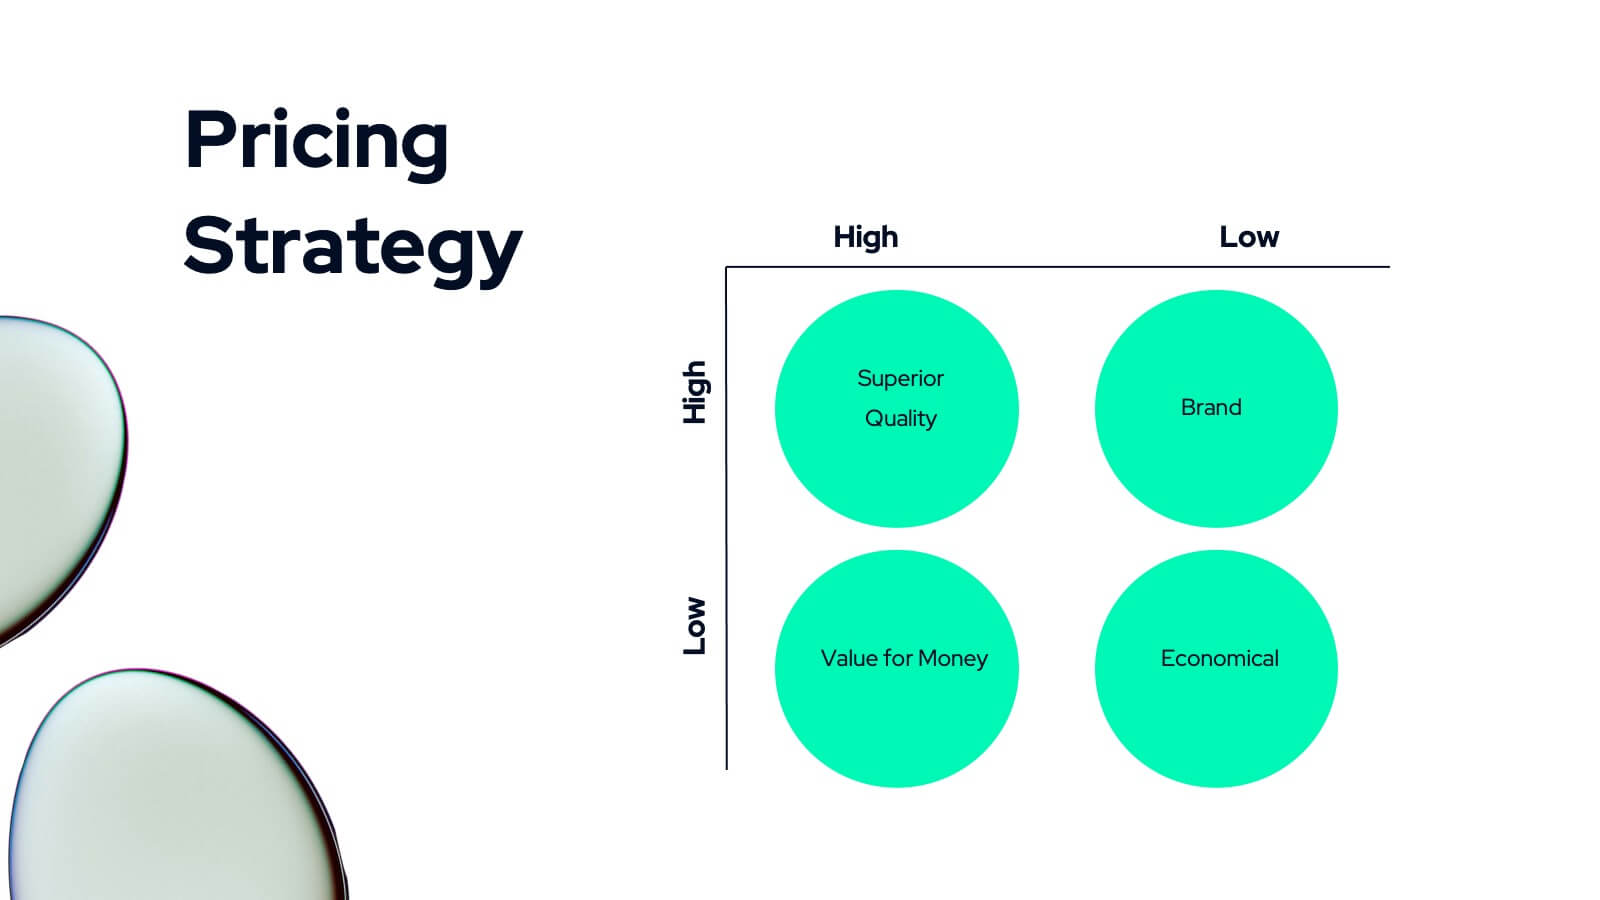
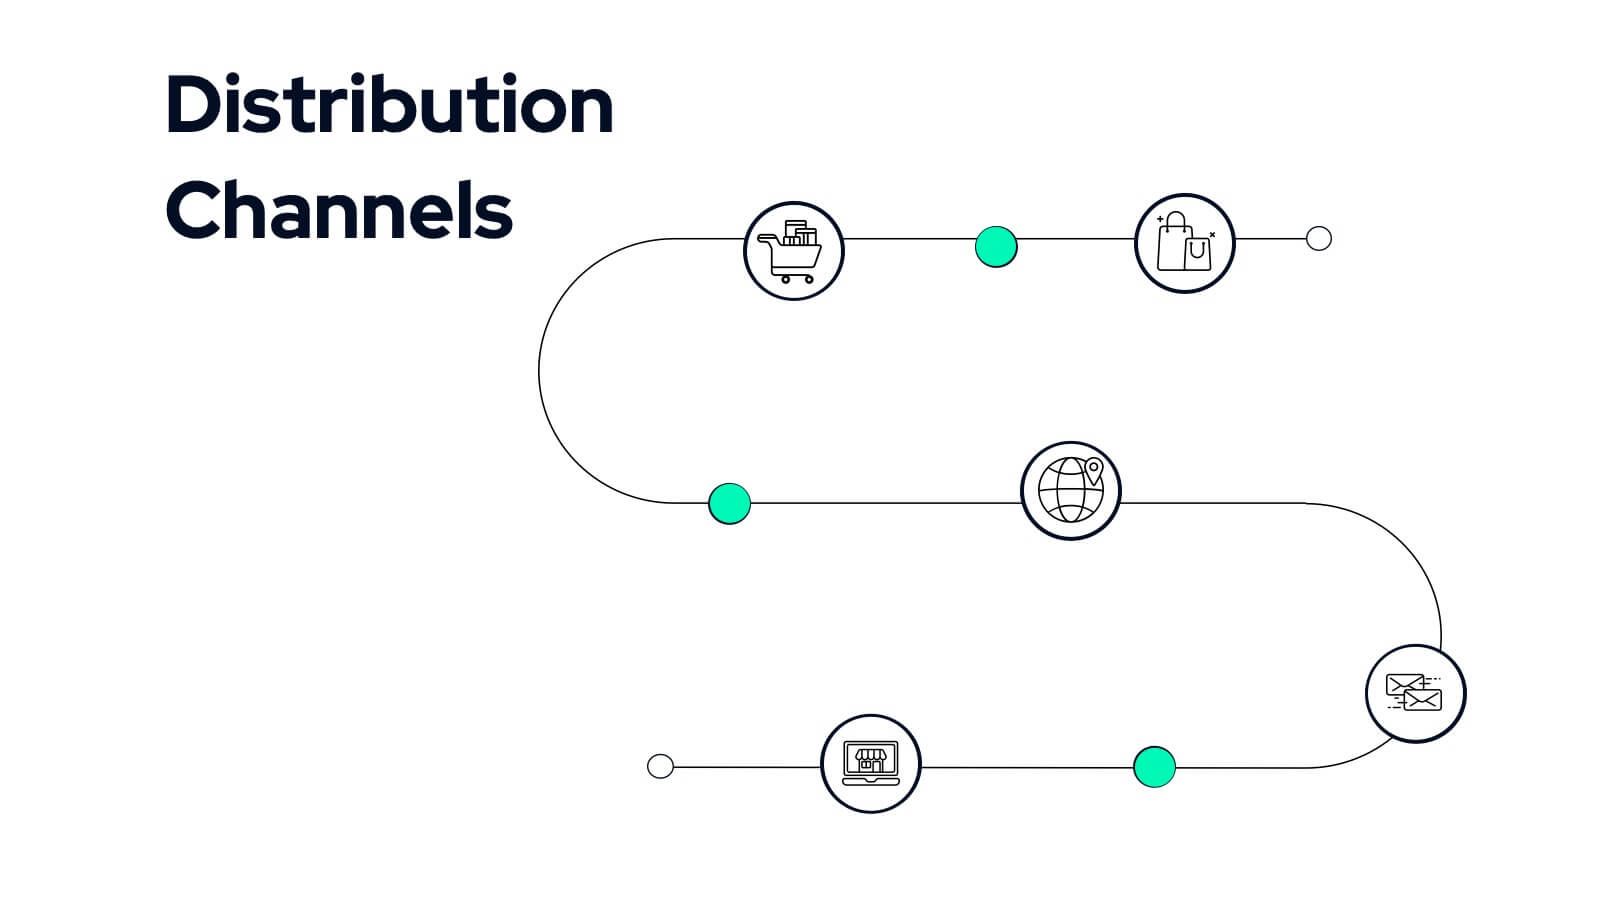
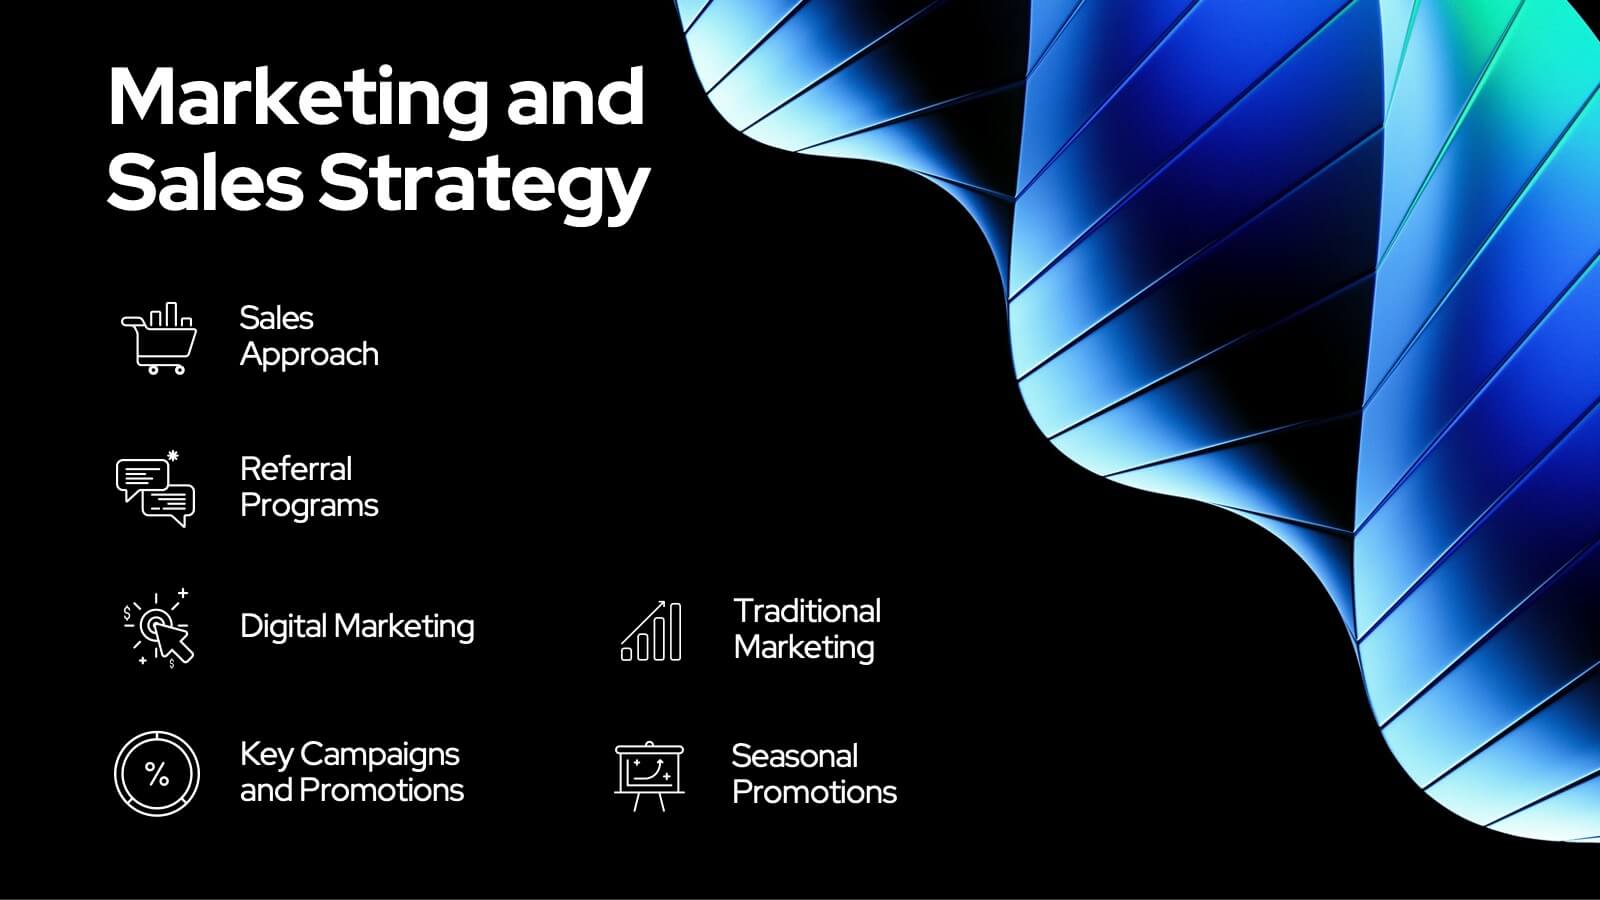
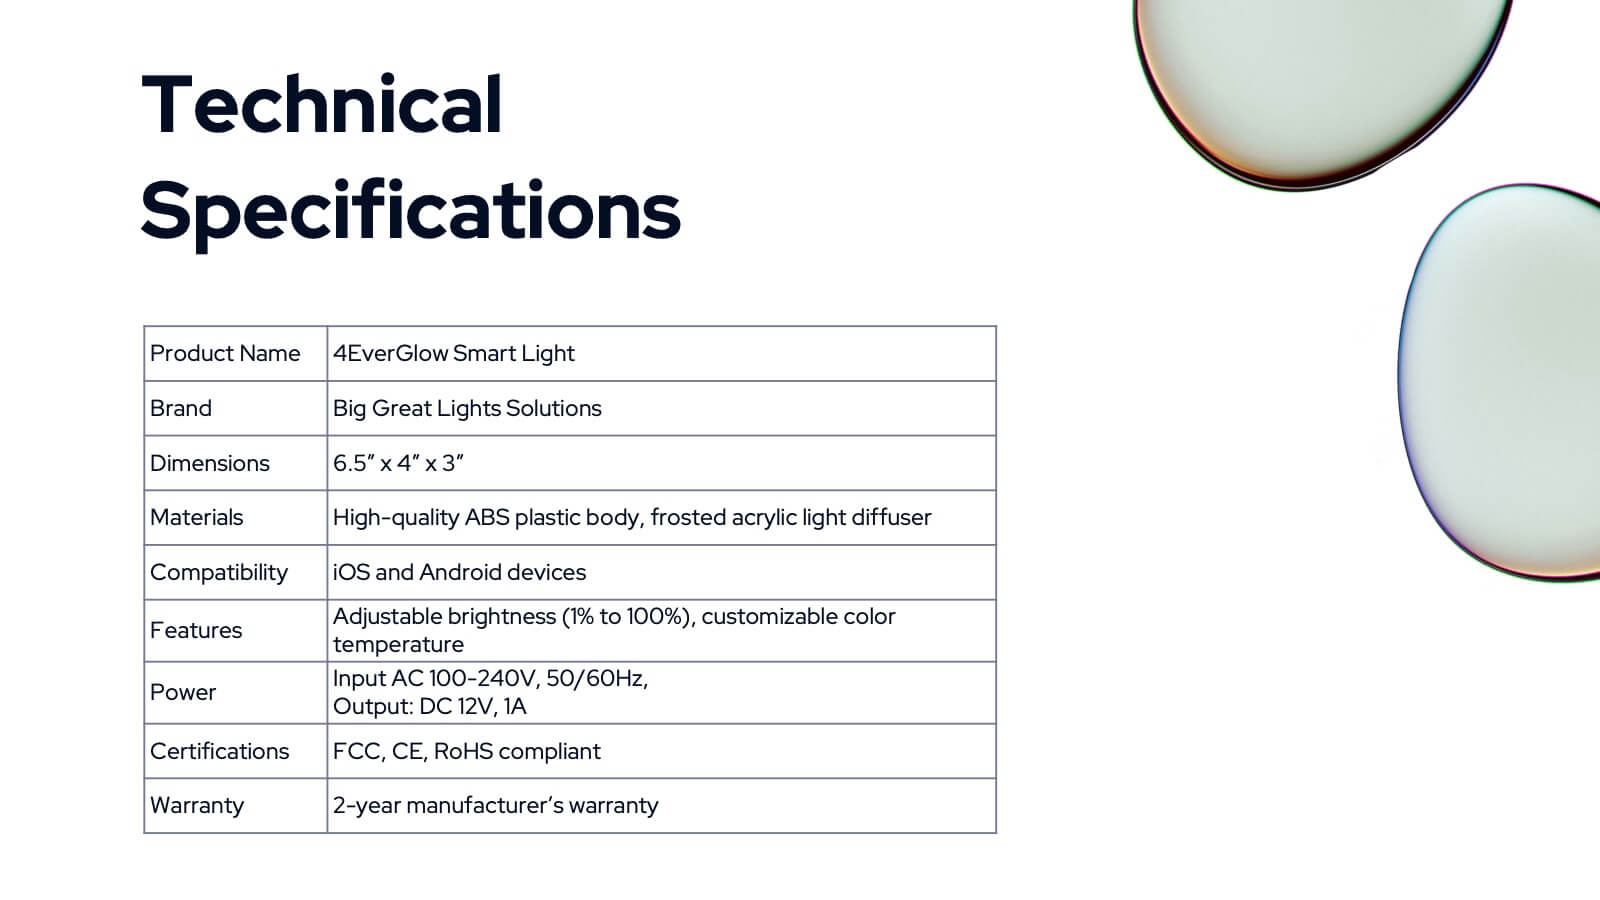
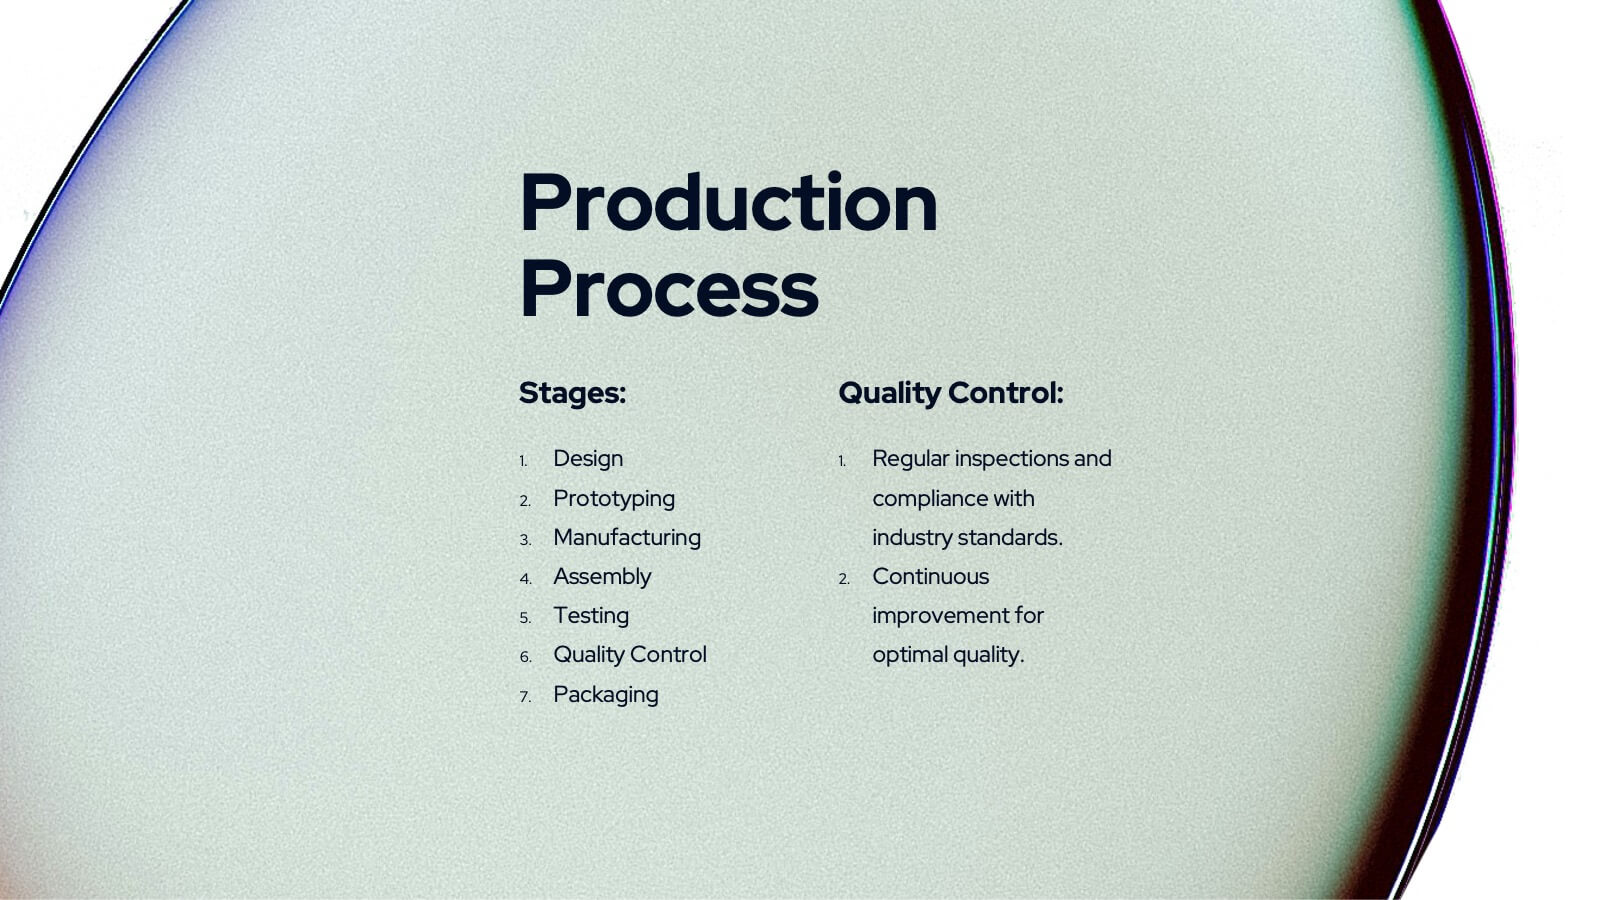
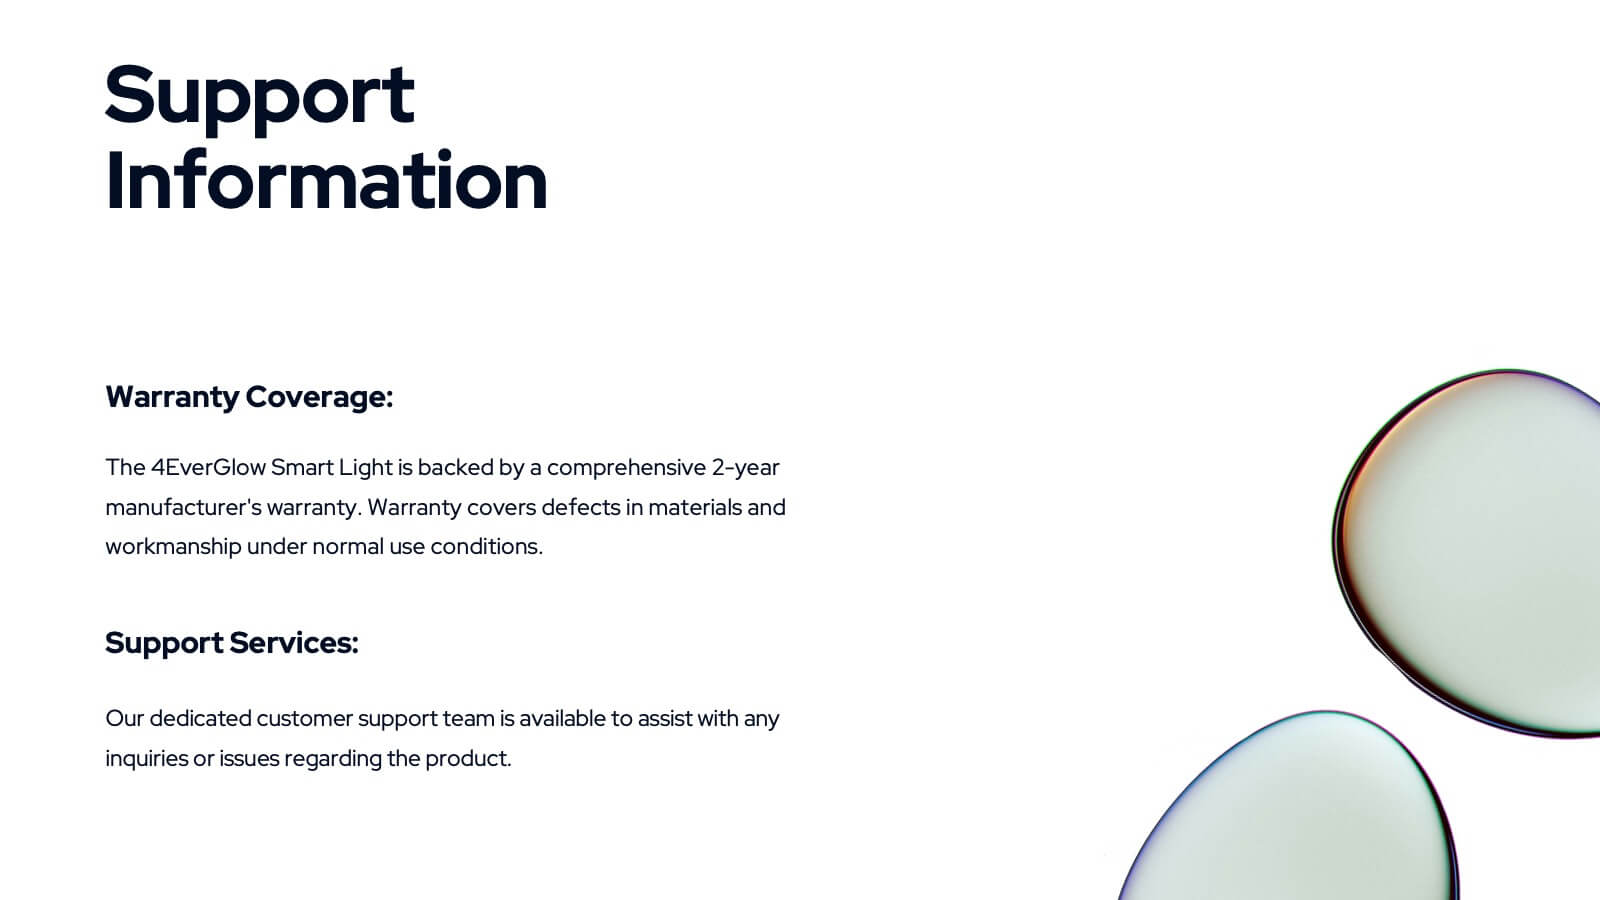
Selkie New Product Proposal Presentation
Dive into your next big idea with this sleek, Selkie-inspired presentation template, designed for presenting a new product proposal! Highlight key features, market opportunities, and potential growth in a visually captivating format that flows effortlessly. Engage your audience and make an impact. Compatible with PowerPoint, Keynote, and Google Slides for easy customization.