


Características


¿Tienes alguna pregunta?
Recomendar


21 diapositivas
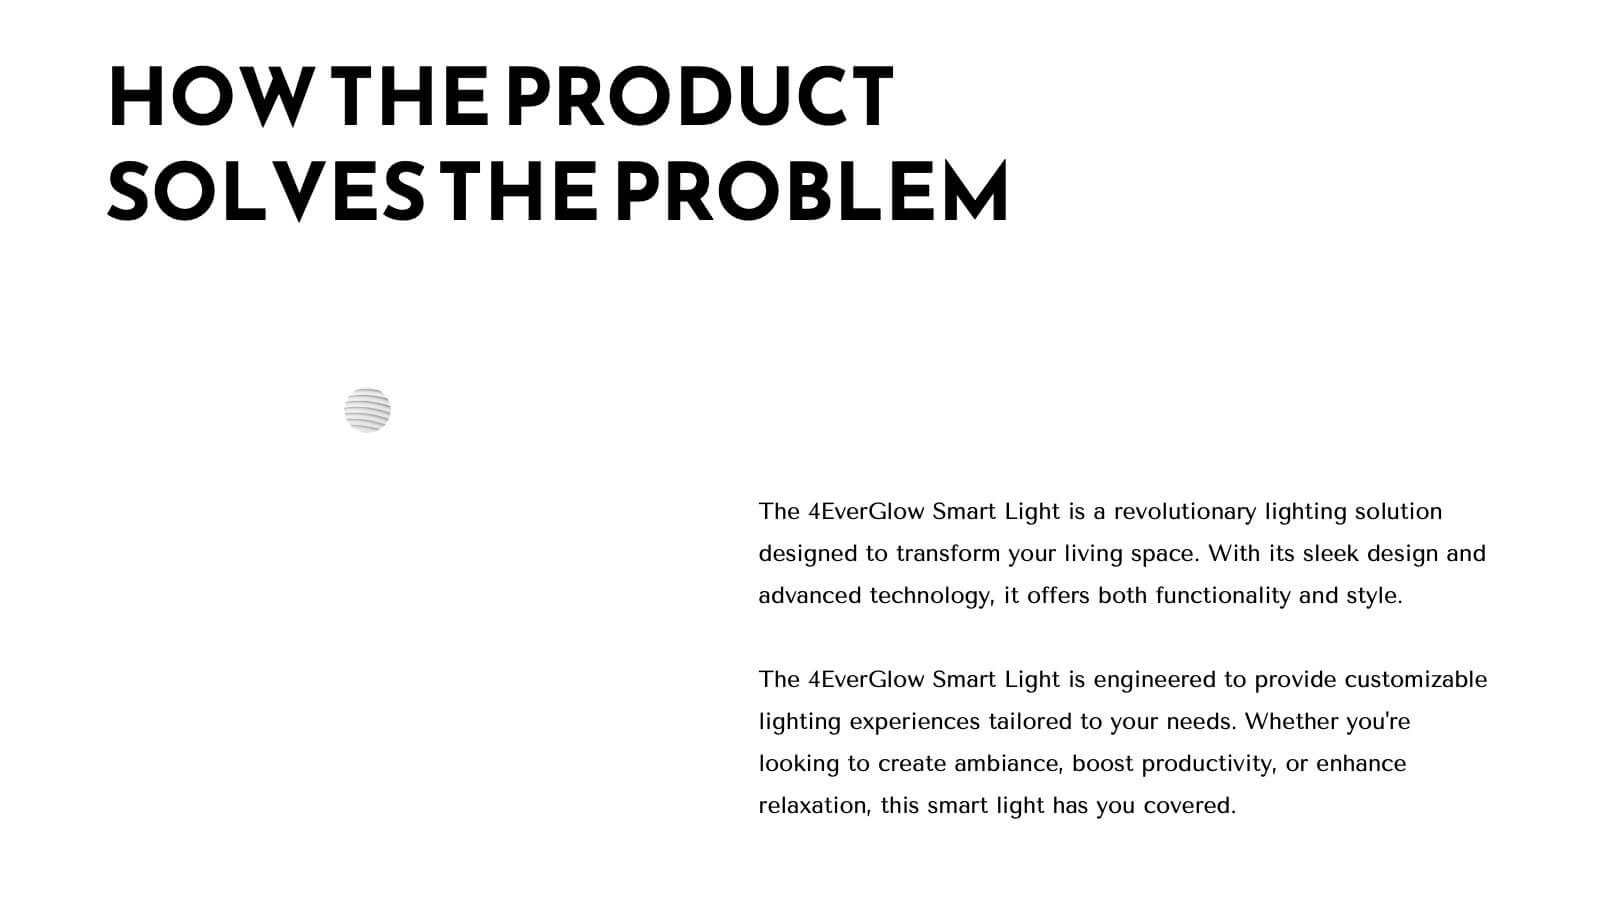
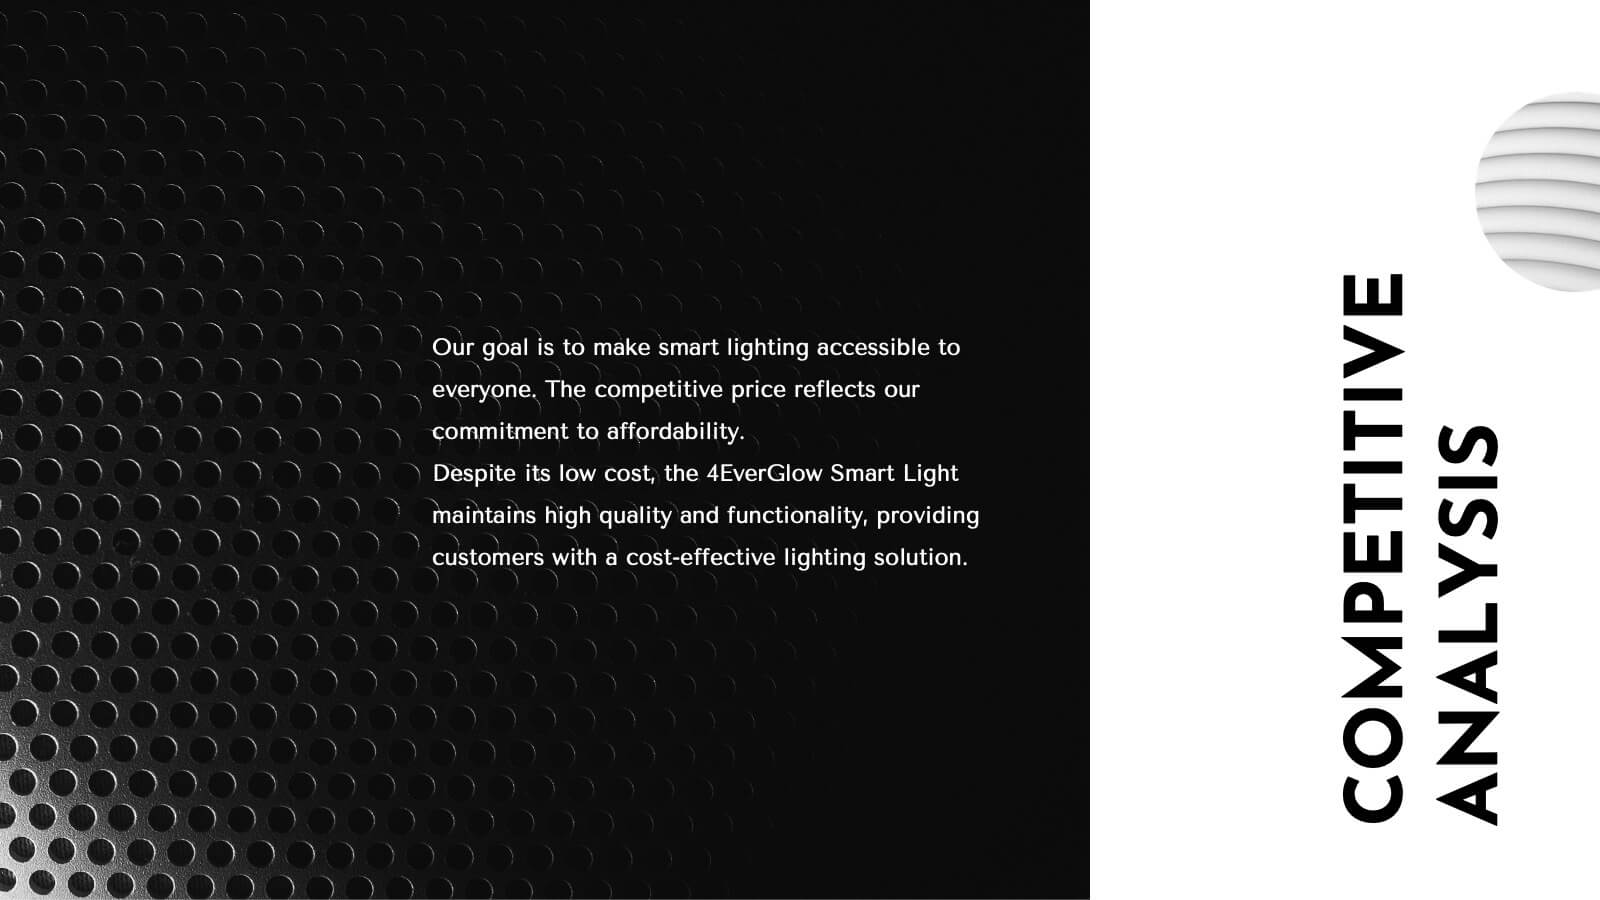
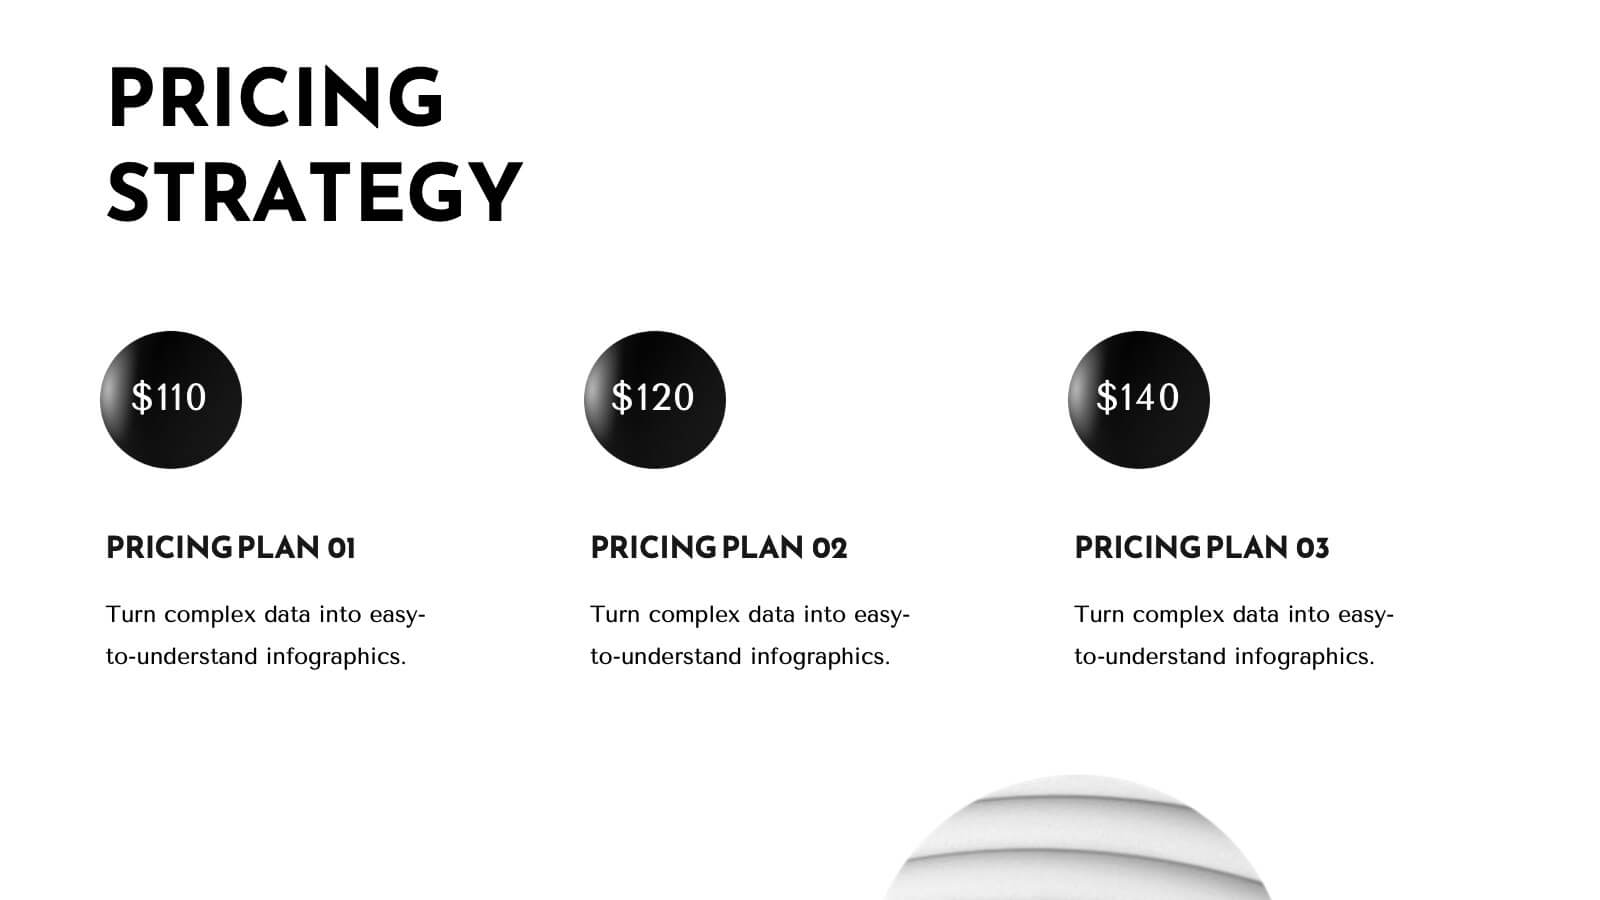
Trident Product Development Plan Presentation
Present your product development strategy with this sleek, professional template! Highlight company overview, product features, and unique selling proposition. Ideal for showcasing market analysis, pricing strategy, and production process. Perfect for developers and project managers. Compatible with PowerPoint, Keynote, and Google Slides.
6 diapositivas
Arrow Mapping for Growth Journey
Showcase progress and strategic development using the Arrow Mapping for Growth Journey Presentation. This vibrant arrow-style roadmap is designed to highlight five key stages—perfect for illustrating phases of growth, milestones, or business transformations. Use it to map out project timelines, organizational development, or customer onboarding flows. Fully editable in PowerPoint, Keynote, and Google Slides, it’s ideal for business strategists, consultants, and marketing teams.


10 diapositivas
Growth Strategy in Four Steps Presentation
Achieve sustainable business expansion with the Growth Strategy in Four Steps presentation. This structured template guides teams through progressive development phases, using clear visuals to illustrate key milestones and percentage-based improvements. Ideal for entrepreneurs, marketers, and business strategists, this slide layout is fully customizable and compatible with PowerPoint, Keynote, and Google Slides for seamless integration into your workflow.


26 diapositivas
Becka Presentation Template
Becka is a modern and powerful template for people who want to present themselves in a professional but bold way. Perfect for the CEO or company executive who wants to have a strong presence on screen. Made with clear and crisp typography, with added bold colors that appeal to both men and women which can evoke powerful emotions and confidence. This template contains easy to edit maps, charts and image place holders that are ready to use. The dynamic slides make it quick and easy to create the perfect presentation.


6 diapositivas
Corporate Sustainability Management Presentation
Step into the future of business with our Corporate Sustainability Management Presentation template. Perfect for strategists seeking to integrate eco-friendly practices, this template facilitates effective communication of sustainability goals and initiatives. It’s a powerful tool for illustrating how environmental strategies can be interwoven with business objectives to foster long-term growth. Tailored for presentations on PowerPoint, Keynote, and Google Slides, it helps leaders inspire action and commitment to sustainability across their organizations.


7 diapositivas
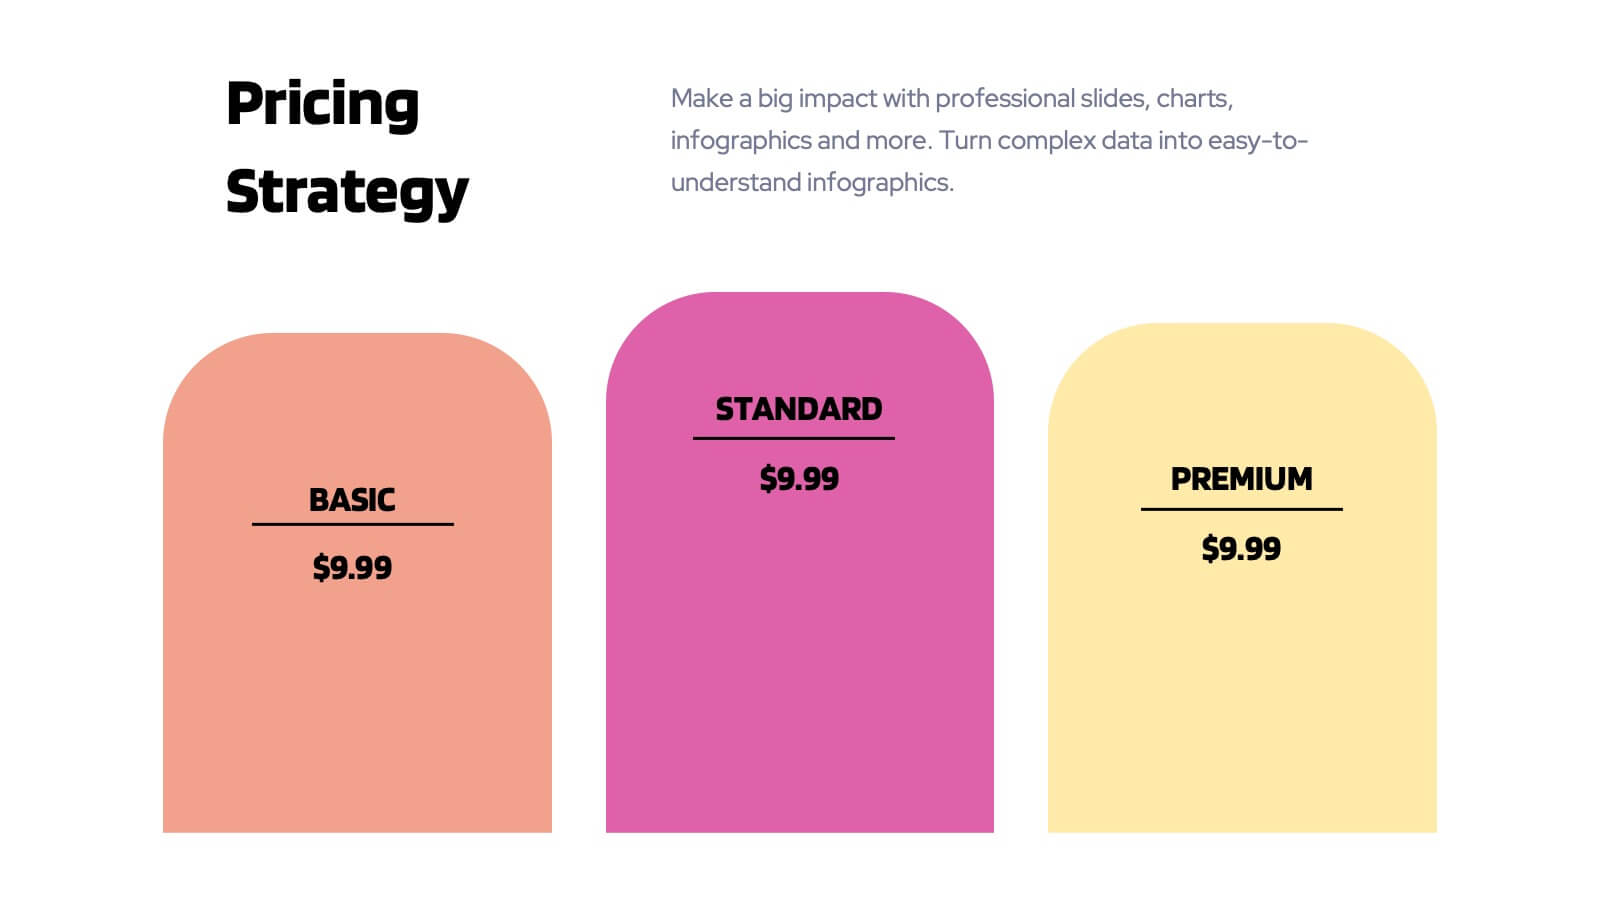
Business Strategy Options Presentation
Bring clarity to your strategic choices with a clean, modern layout that helps you present multiple business directions side by side. Ideal for showcasing growth plans, decision paths, or market approaches, this presentation makes strategy easy to follow. Fully compatible with PowerPoint, Keynote, and Google Slides for effortless editing.


4 diapositivas
Asia Market Distribution Map Presentation
Highlight your business reach with the Asia Market Distribution Map Presentation. This dynamic layout features a regional color-coded map paired with labeled icons for clear segmentation by country or territory. Ideal for marketing teams, sales updates, and geographic performance reviews. Fully customizable in PowerPoint, Keynote, Google Slides, and Canva.


6 diapositivas
6-Stage Business Cycle Presentation
The "6-Stage Business Cycle Presentation" template expertly outlines the progression of business processes through a visually appealing circular diagram, perfect for detailed strategic presentations. This template features six interconnected stages, each distinguished by unique colors and intuitive icons, simplifying complex business concepts into digestible segments. Central placeholders allow for concise titles and brief descriptions, enhancing clarity and comprehension. Ideal for business analysts, strategists, and educators, this tool facilitates the effective communication of developmental cycles, operational processes, and strategic evaluations. Use this template in board meetings, workshops, or educational sessions to convey the cyclical nature of business tasks and strategies efficiently.


7 diapositivas
Change Management Process Infographic Presentation
Change Management is the process of managing and guiding an organization or individual through a planned and deliberate change. This template is perfect for discussing change management and allows you to customize the design and add your own tips. Designed in Powerpoint, Keynote, and Google Slides it is easy to use with helpful illustrations. Use this change management template to report on current practices, issues and reasons for change, along with how these changes can improve your organization's performance. The perfect tool to share your vision and plan, or align an entire organization!


4 diapositivas
Global Business Distribution Layout Presentation
Visualize your company’s international footprint with this Global Business Distribution Layout. Perfect for showcasing market reach, branch networks, or regional performance. Features a clean world map design with customizable highlight zones. Fully editable in PowerPoint, Keynote, and Google Slides—ideal for corporate overviews, investor decks, and business expansion presentations.


7 diapositivas
Loves Travel Infographic Presentation
Travel is an opportunity to get out of our comfort zones and be inspired to try new things, it changes our perspective on the world. Use this template to give your audience an overview of a trip and prepare them for what they will be experiencing. This template features an infographic style design, with plenty of room to describe the locations and activities as well as instructions and tips. Build your own infographic with this template, and add it to your presentations. You can easily add your own content in PowerPoint, Keynote, or Google slides and turn it into a fun presentation in minutes.


11 diapositivas
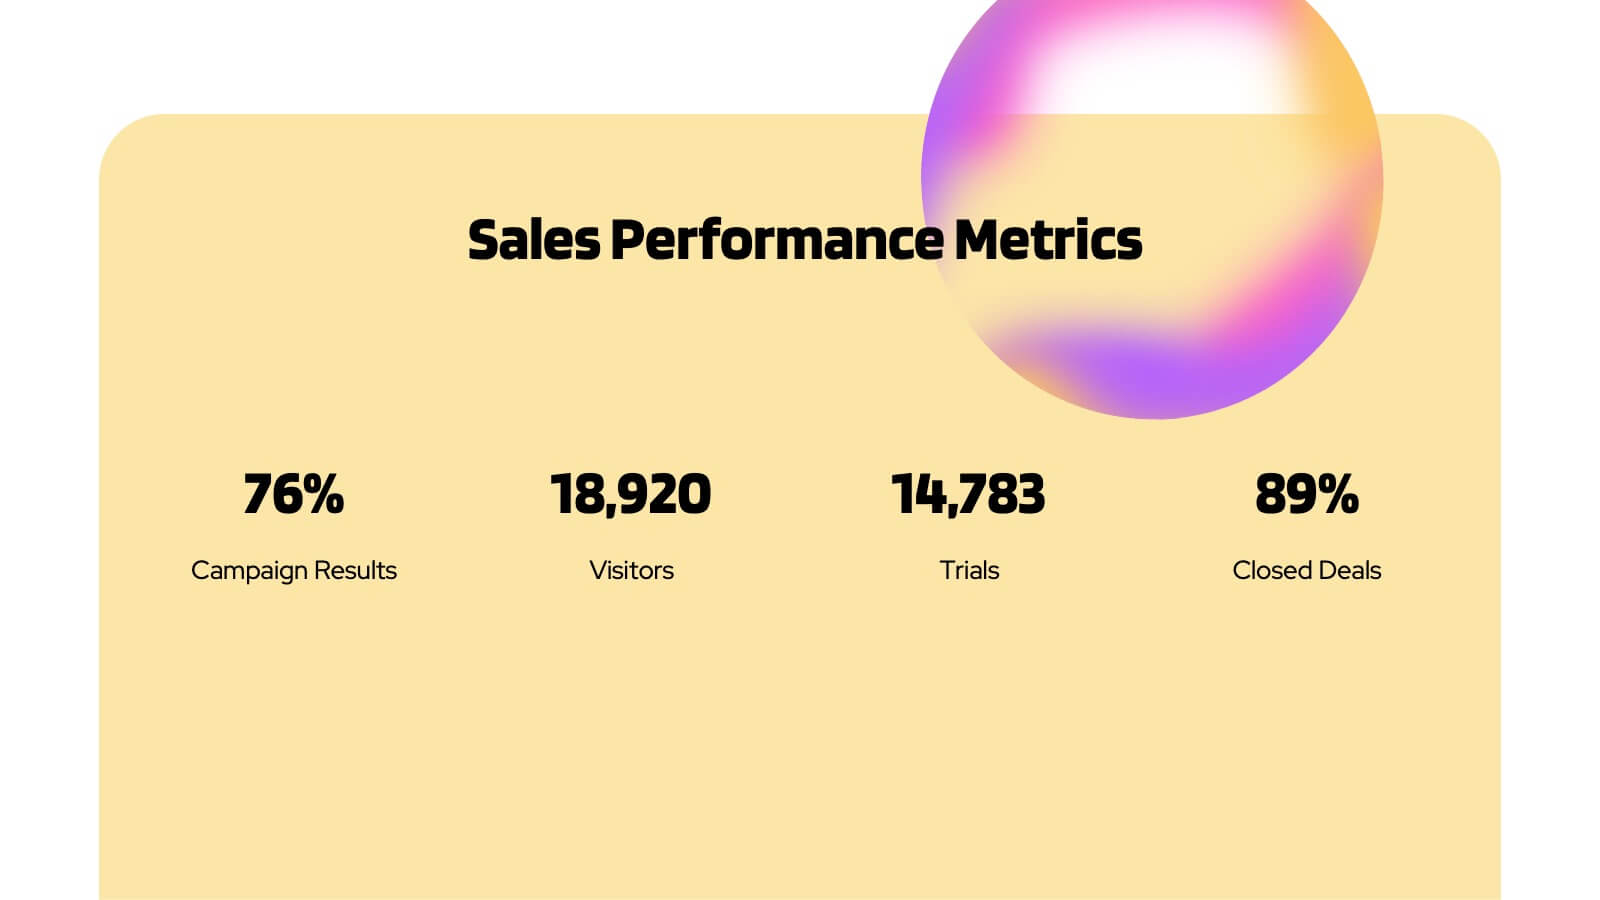
Sales Dashboards Infographic
A sales dashboard is a visual representation of sales data and key performance indicators (KPIs) that provides a quick and comprehensive view of a company's sales performance and related metrics. Step into the fast-paced world of sales with our sales dashboards infographic template. It's your compass for charting the course to success in the dynamic realm of sales, providing a visual guide that transforms data into actionable insights. This infographic is designed to to track progress towards sales goals, identify trends, and optimize strategies to improve sales performance. Compatible with Powerpoint, Keynote, and Google Slides.


7 diapositivas
Business Office Scenes Infographic Presentation
Office Scene Infographics can be a valuable tool for businesses or organizations that want to showcase their workplace culture or attract potential employees by providing a visual representation of what it's like to work at their company. This template is designed to provide a visual representation of different office scenarios and activities. The template is fully customizable and can be used for a variety of purposes, such as internal communication, training, marketing, and educational. It has a unique design, easy customization, and compatibility with Powerpoint, Keynote and Google Slides.


22 diapositivas
Mistgrove Digital Agency Strategy Plan Presentation
Craft an impactful strategy for your digital agency with this sleek and professional presentation template. Highlight your agency's mission, vision, and services while showcasing success stories through client testimonials and case studies. Dive into essential sections like market analysis, industry trends, and competitive positioning to communicate a forward-thinking strategy effectively. This template includes dedicated slides for creative processes, strategy development, and campaign execution, ensuring you present your approach clearly and confidently. With options for measurement and analytics, future outlooks, and social impact initiatives, it empowers you to convey the value and growth potential of your strategies. Fully compatible with PowerPoint, Google Slides, and Keynote, this template offers seamless customization to align with your agency's unique brand identity and goals.


20 diapositivas
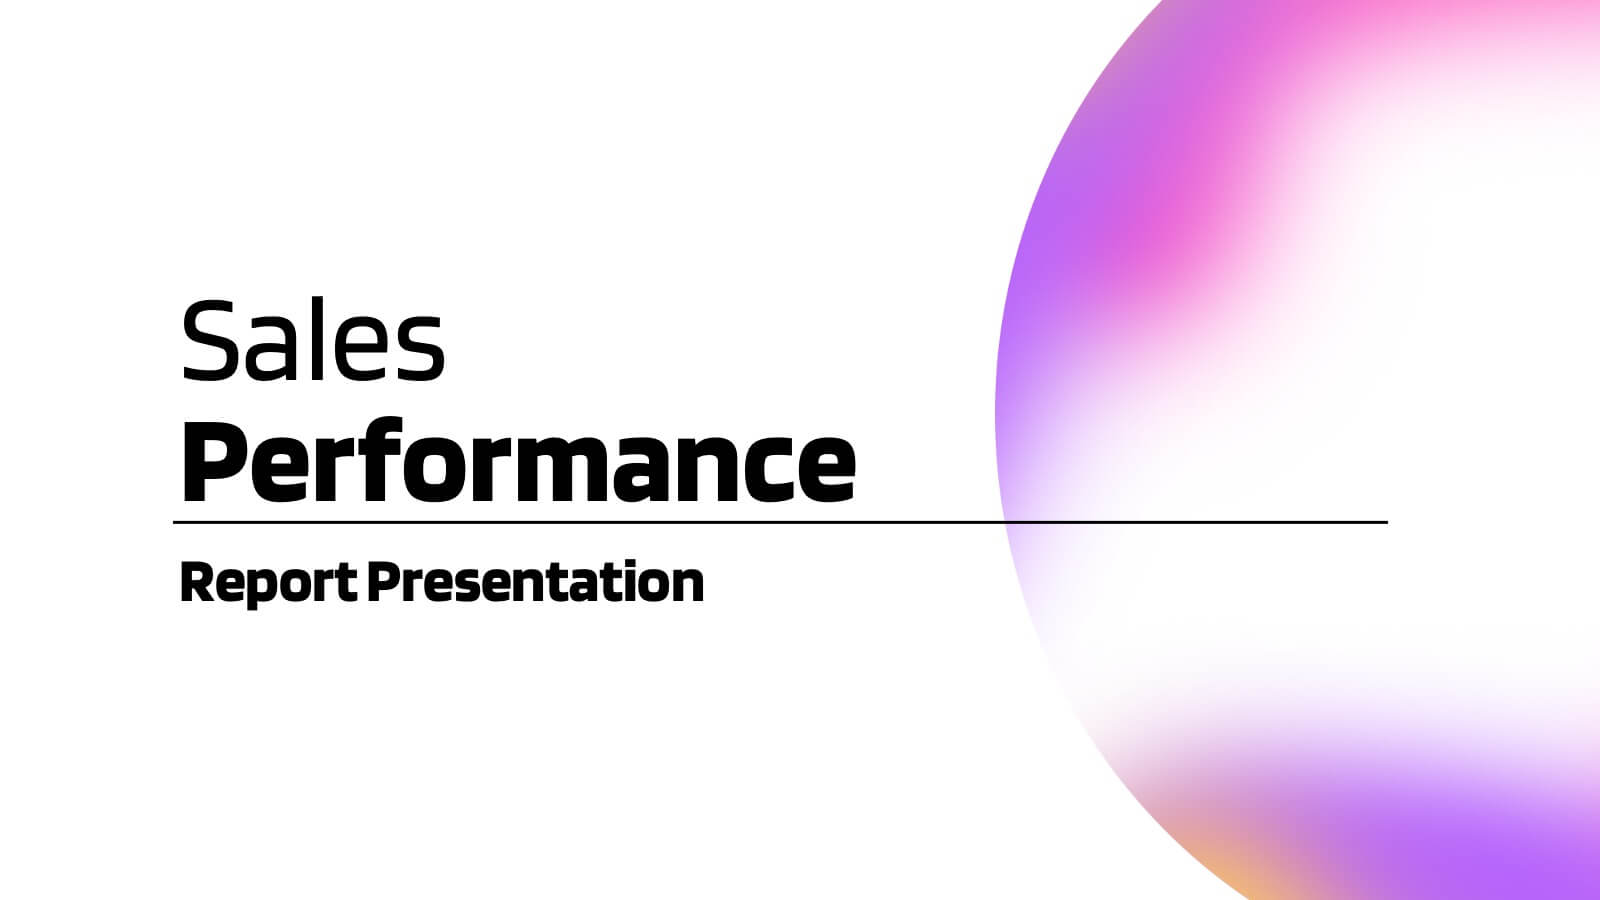
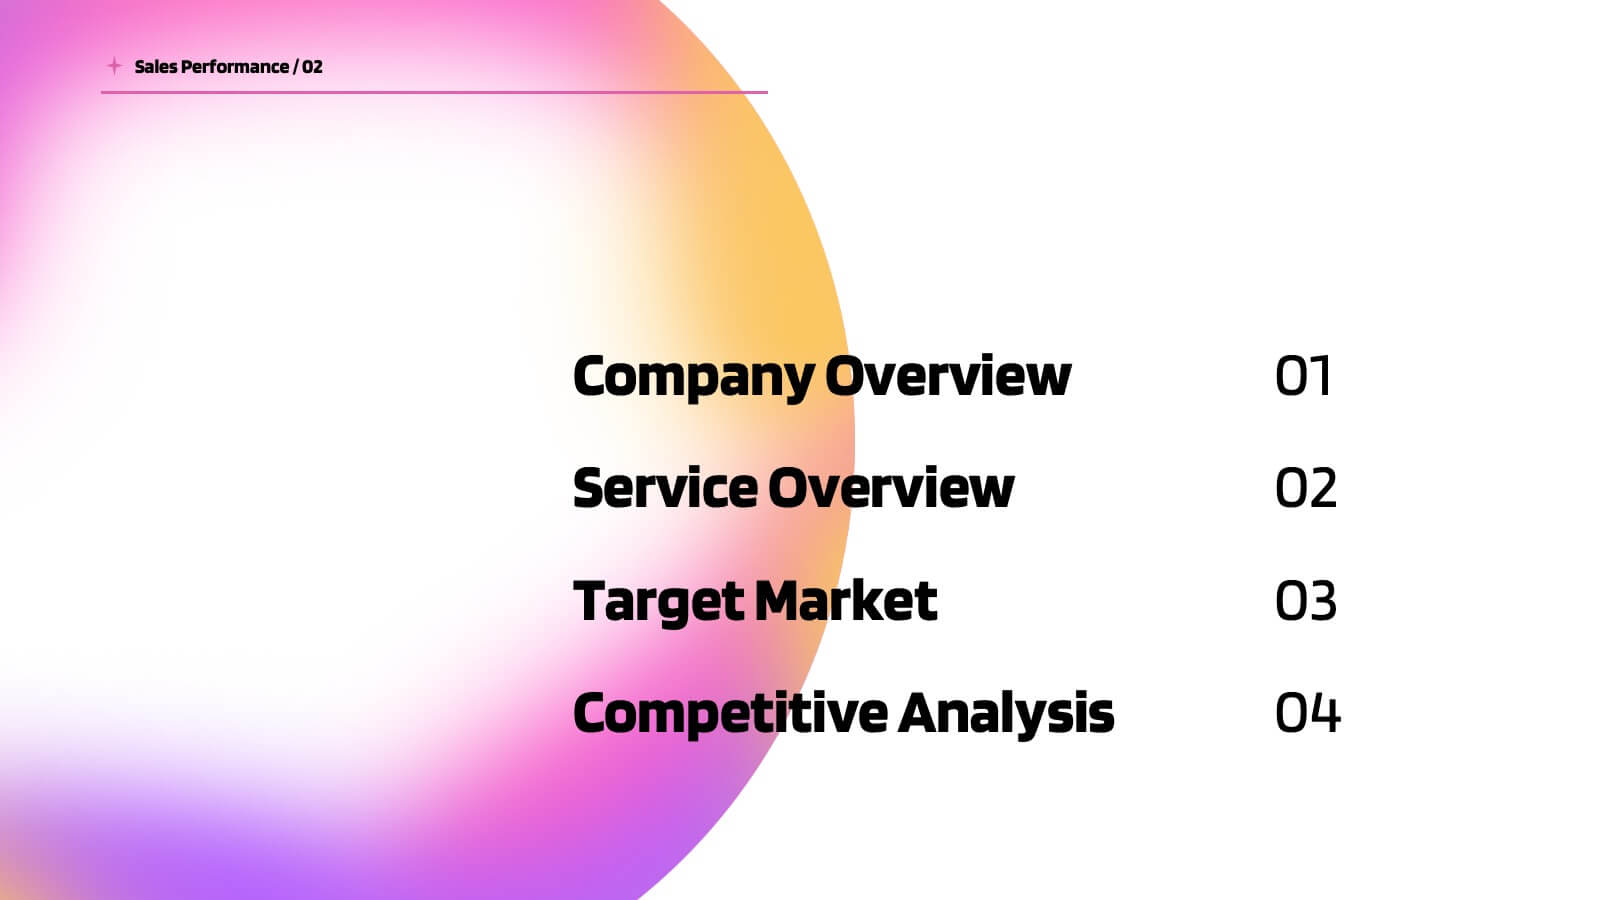
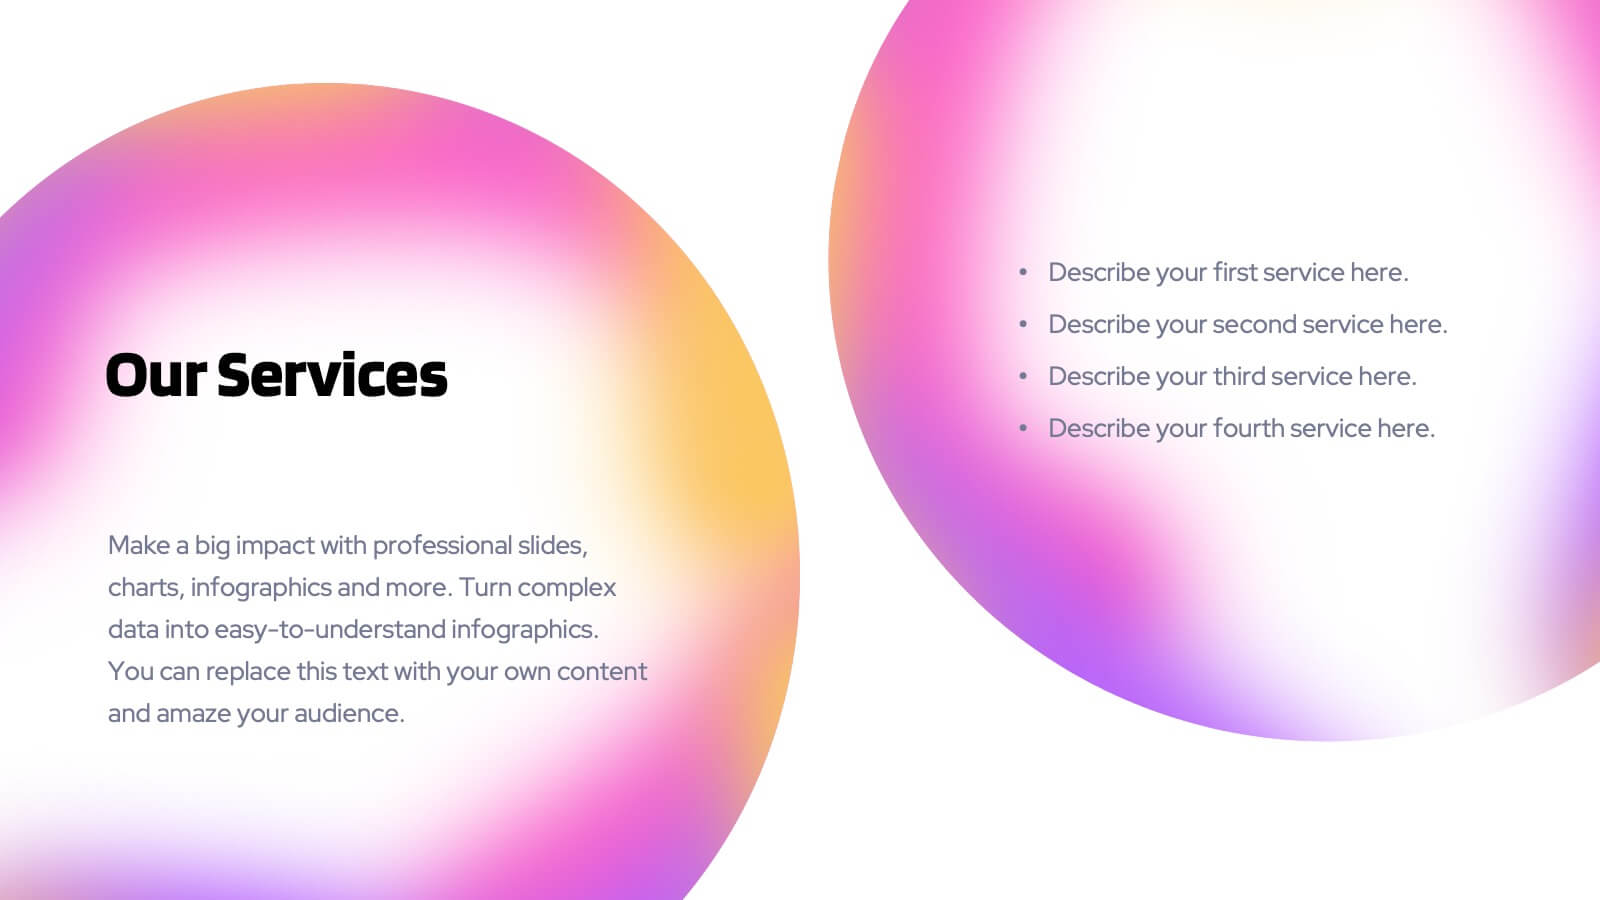
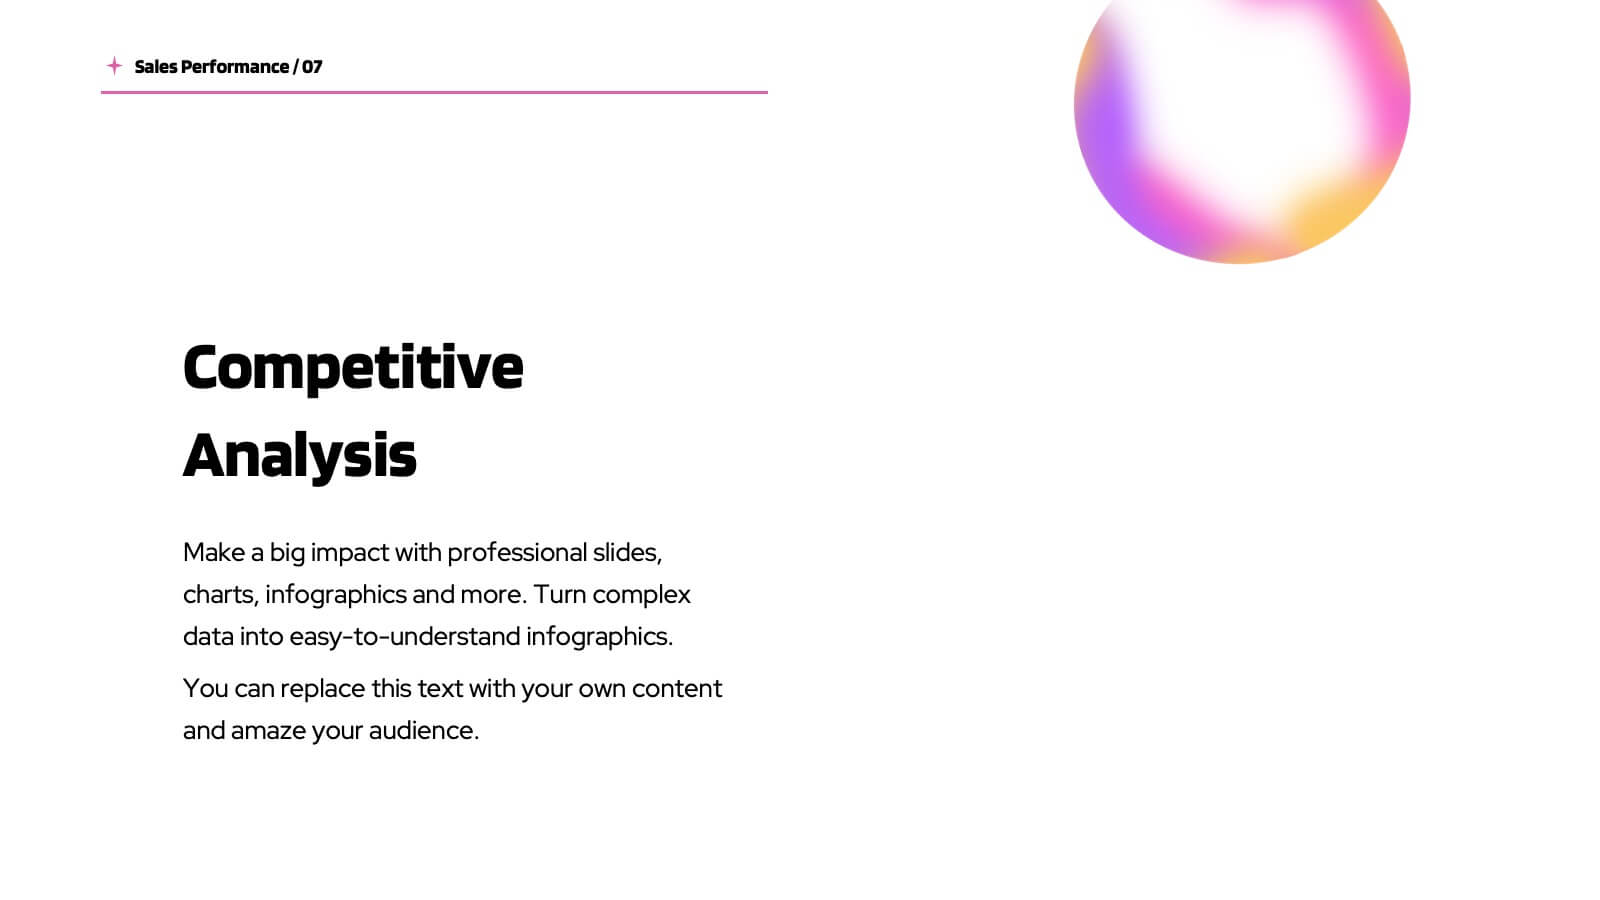
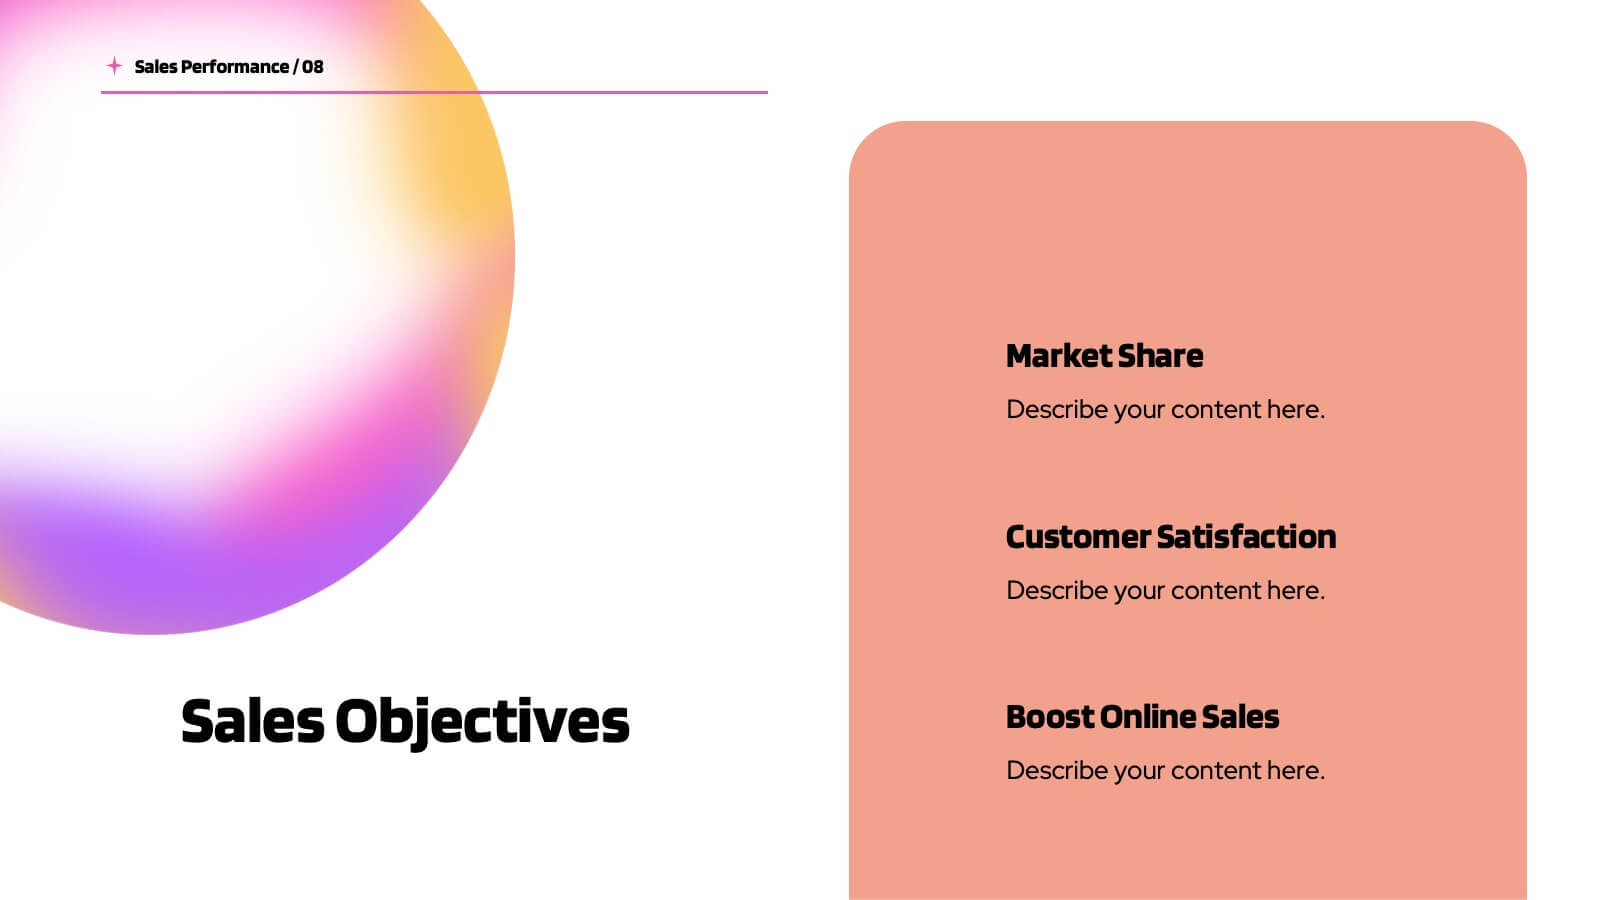
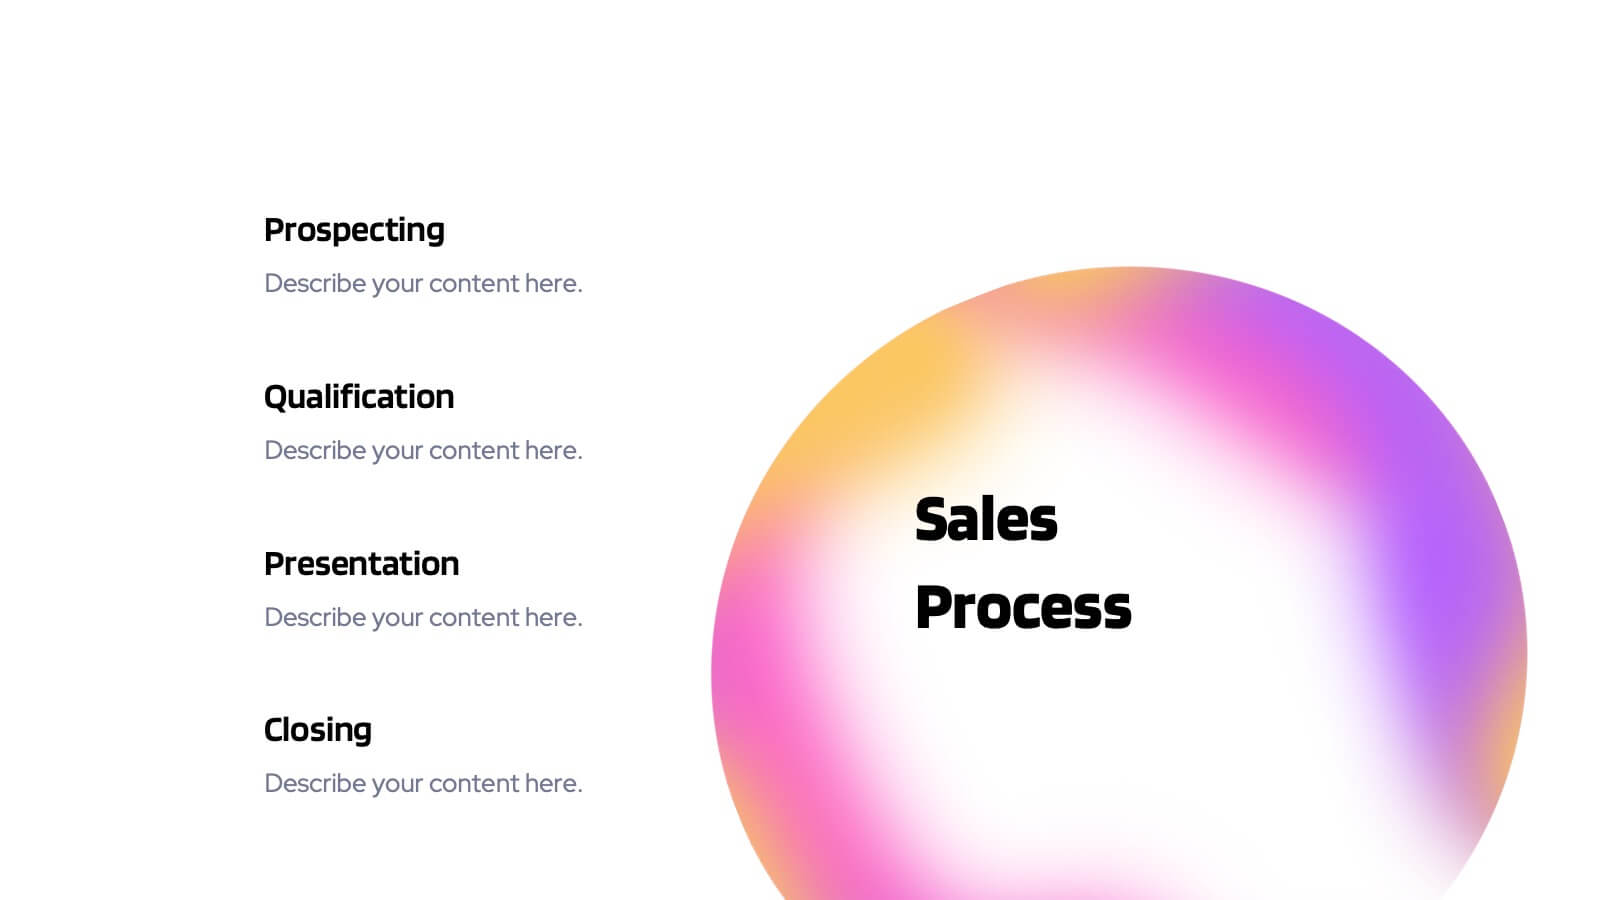
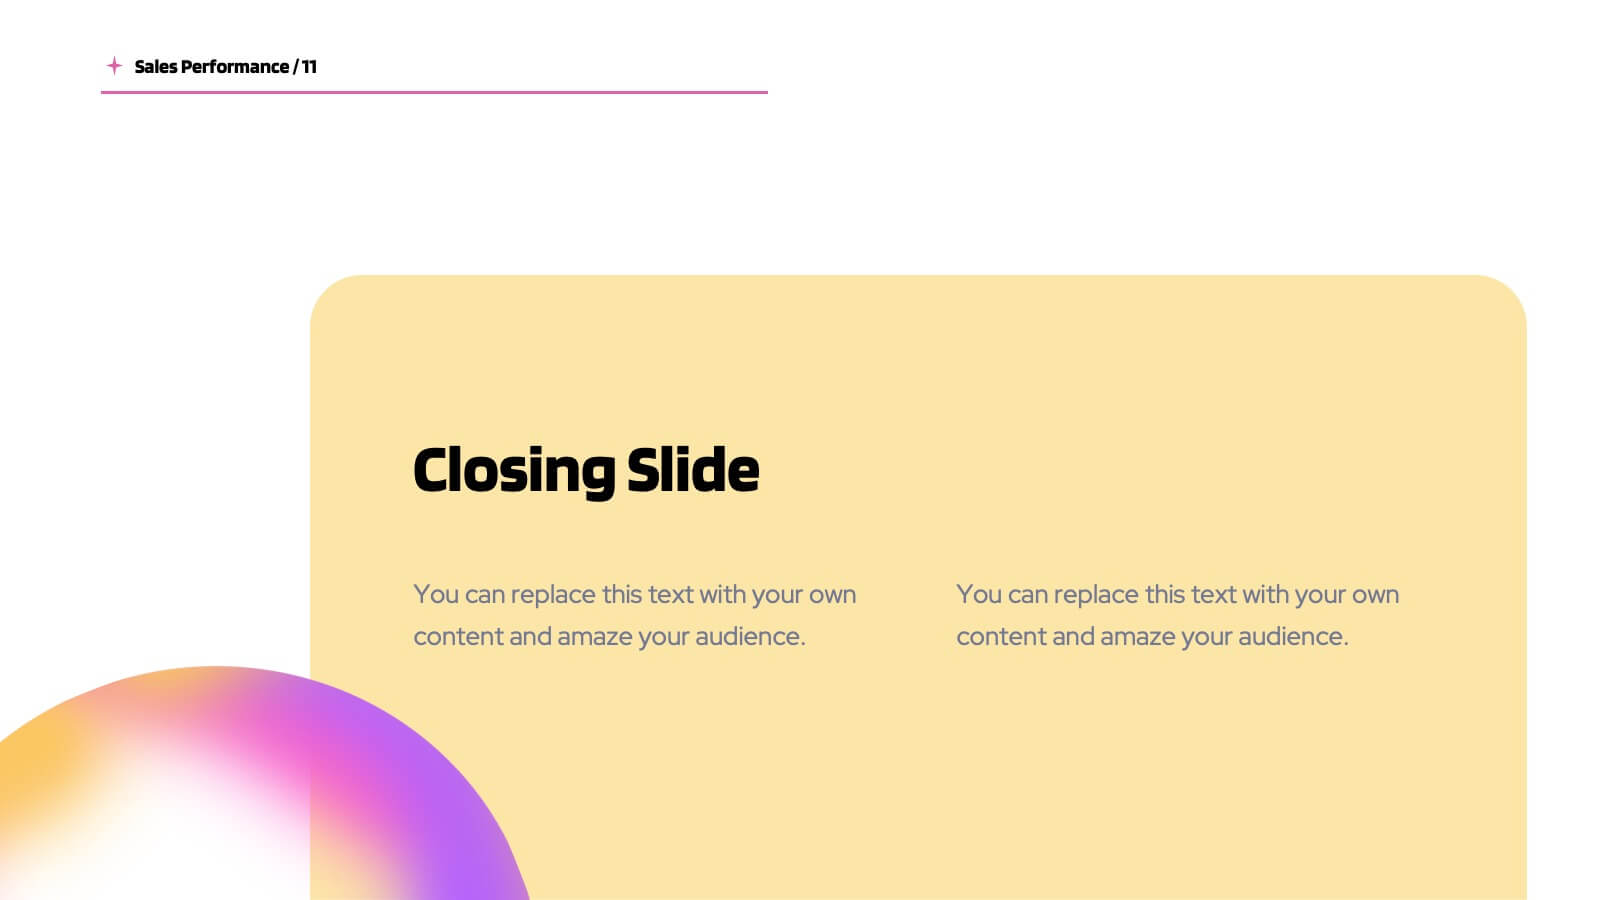
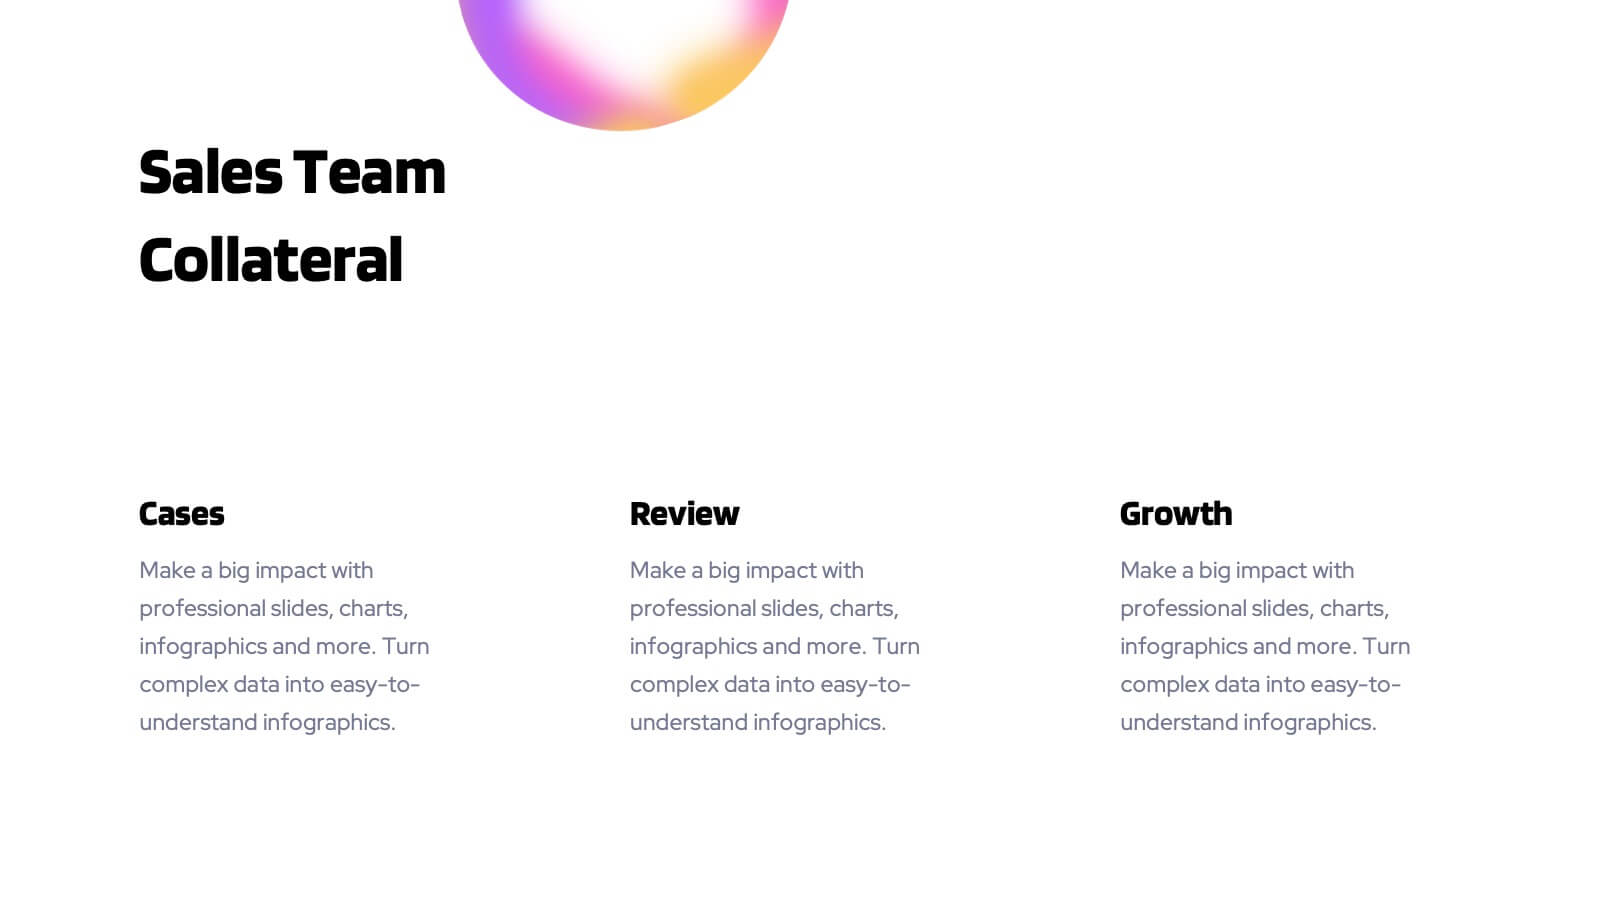
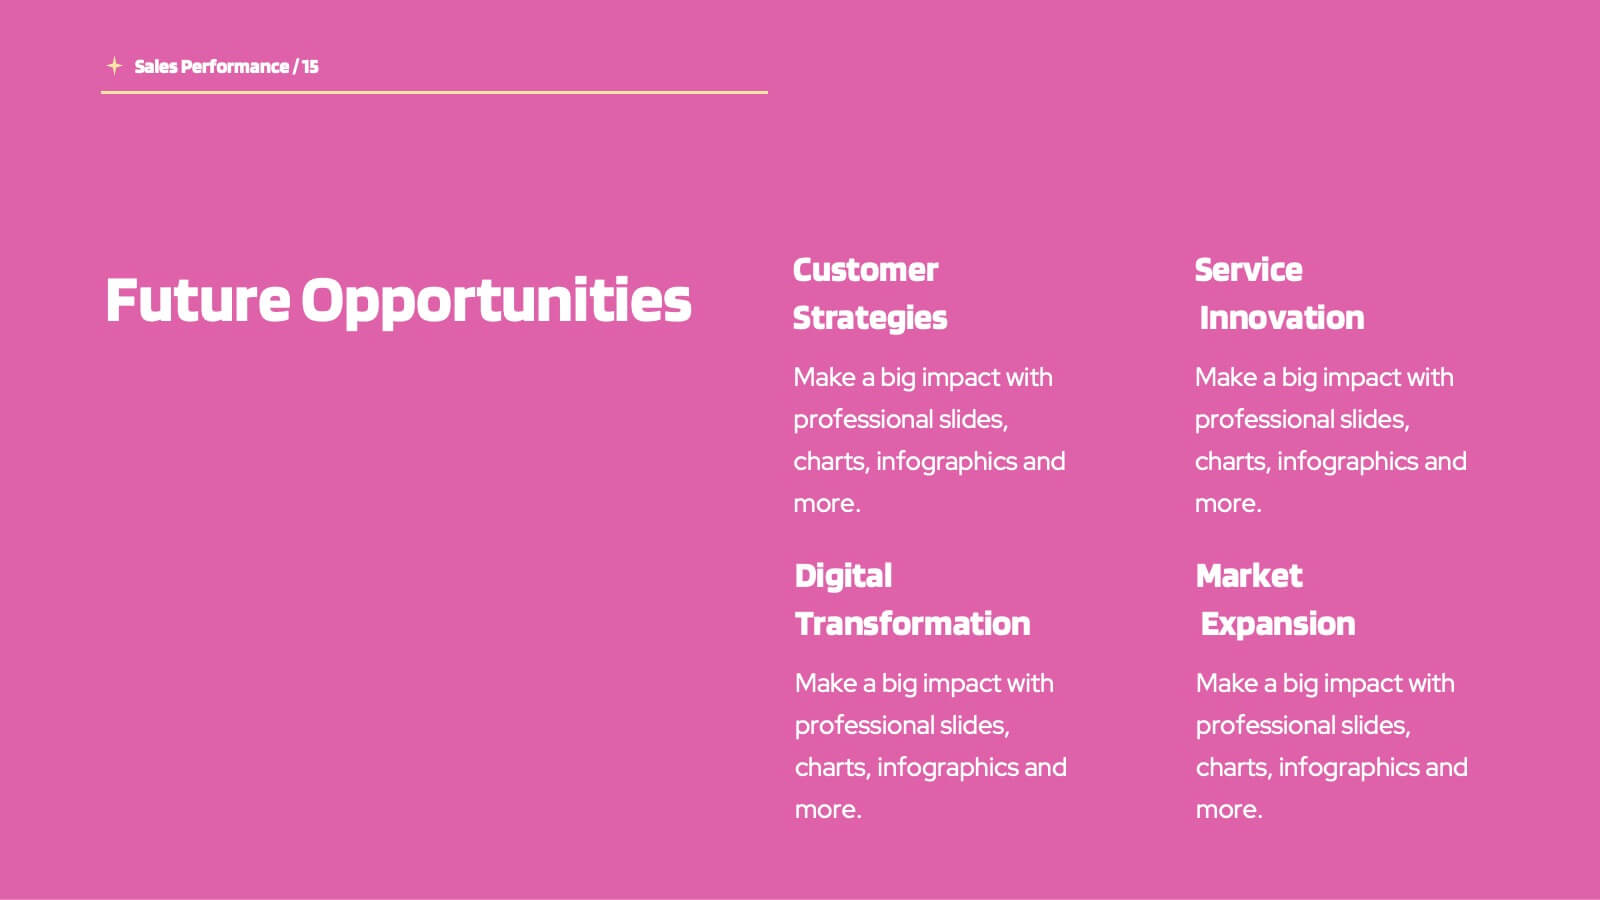
Planetary Sales Performance Report Presentation
Energize your sales efforts with this vivid sales performance presentation template. It includes sections for company overview, detailed sales metrics, and future goals, perfect for showcasing achievements. Compatible with PowerPoint, Google Slides, and Keynote, it’s designed to inform and motivate sales teams effectively.


4 diapositivas
Vision Statement Slide Presentation
Spark inspiration from the very first slide with a clean, modern layout designed to express future goals with clarity and confidence. This presentation helps teams communicate direction, long-term aspirations, and strategic focus in a simple, structured format. Fully compatible with PowerPoint, Keynote, and Google Slides.


7 diapositivas
Aviation Terms Infographic
Take flight with our aviation terms infographic, designed with a serene palette of white, blue, and hints of orange that echo the hues of the sky. This meticulously crafted infographic decodes the intricate jargon of the aviation world, making it a breeze for enthusiasts, trainees, and even seasoned aviators to grasp. Ideal for flight schools, airline training programs, and aviation seminars, this infographic simplifies complex terminologies with ease. With full compatibility across PowerPoint, Keynote, and Google Slides, sharing your knowledge of the skies has never been more accessible or visually appealing.