


Características


¿Tienes alguna pregunta?
Recomendar


6 diapositivas
OKR Goal-Setting Framework
Clarify your goals and drive performance with this OKR-based layout that maps Objectives, Key Activities, and Results in a clear, actionable format. Ideal for teams, managers, and performance reviews. Each section is fully editable to match your organizational strategy. Compatible with PowerPoint, Keynote, and Google Slides.


5 diapositivas
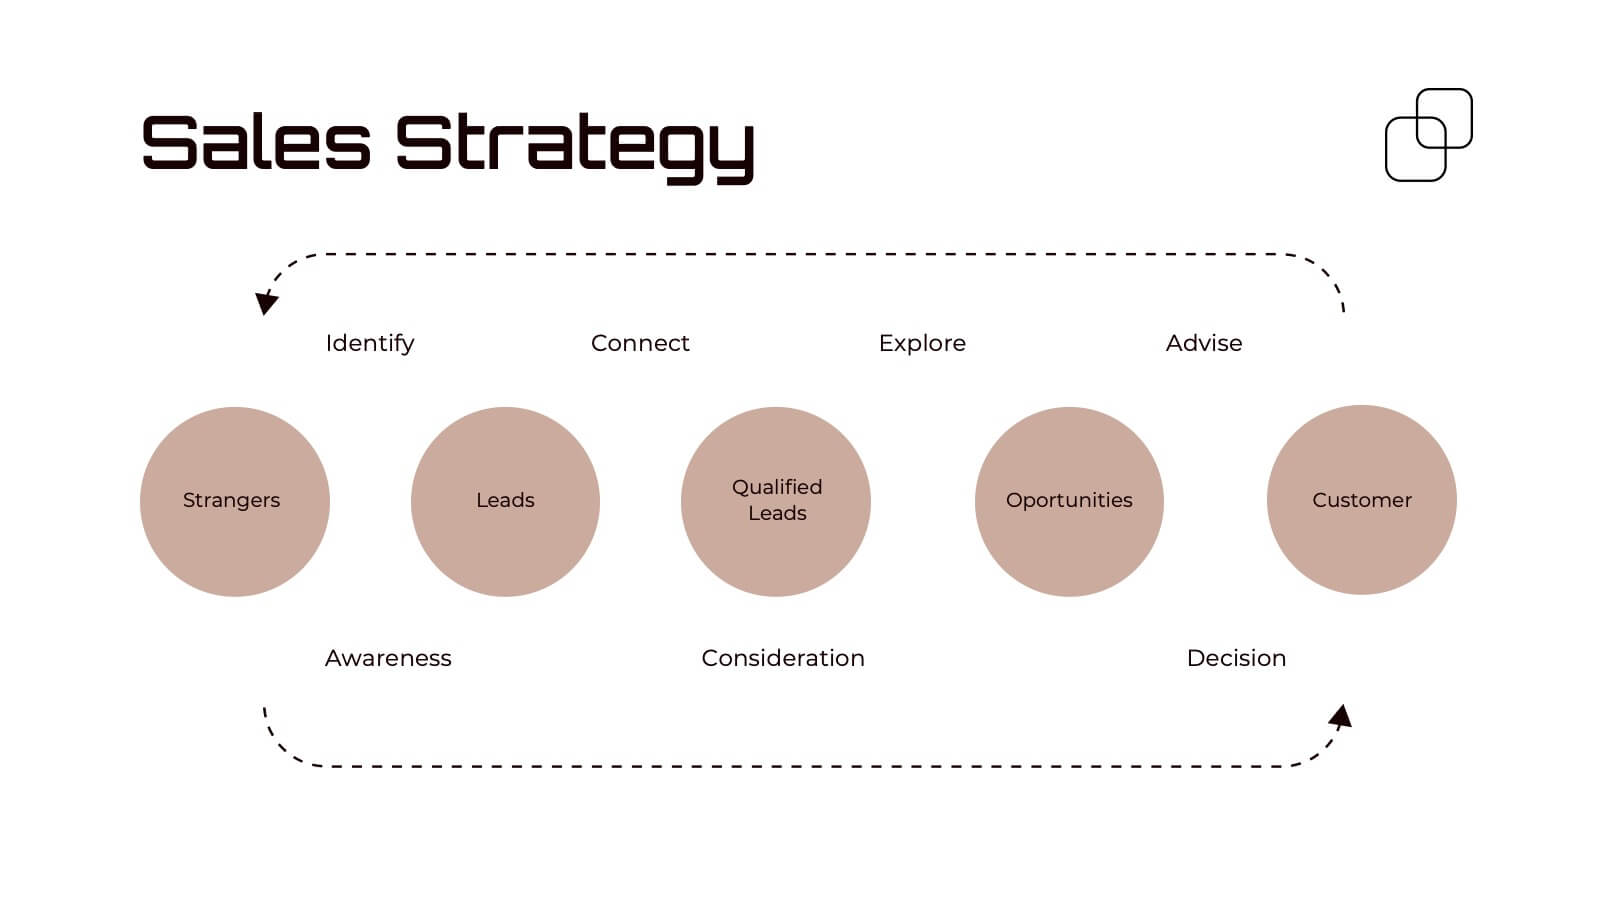
Business Strategy Planning Puzzle Presentation
Visualize interconnected initiatives with this Business Strategy Planning Puzzle Presentation. The magnifying glass design and five-piece puzzle format help you break down complex strategy components into digestible segments. Ideal for highlighting core objectives, key performance drivers, and strategic focus areas. Fully customizable with editable text boxes and icons. Compatible with PowerPoint, Keynote, and Google Slides.


26 diapositivas
Transportation and Logistics Company Profile Presentation
Delve into the fast-paced realm of Transportation and Logistics, the backbone of global commerce. Our vibrant template captures this essence with a lively mix of yellow, blue, orange, and purple. Precision-crafted, it comes alive with industry-specific graphics, adaptable icons, and purpose-built image placeholders. Seamless compatibility ensures smooth sailing whether you're on Powerpoint, Keynote, or Google Slides. Tailored for businesses, it's the go-to choice for presenting company profiles within the transportation sector. Don't just inform; captivate and inspire your audience. Elevate your presentation game today!


22 diapositivas
Pearl Product Launch Pitch Deck Presentation
Make your product launch shine with this sleek, pearl-inspired presentation! Perfect for pitching your product’s unique value, market positioning, and growth potential, this template is designed to captivate investors and stakeholders. Its elegant, minimalist layout keeps your message front and center. Compatible with PowerPoint, Keynote, and Google Slides.


12 diapositivas
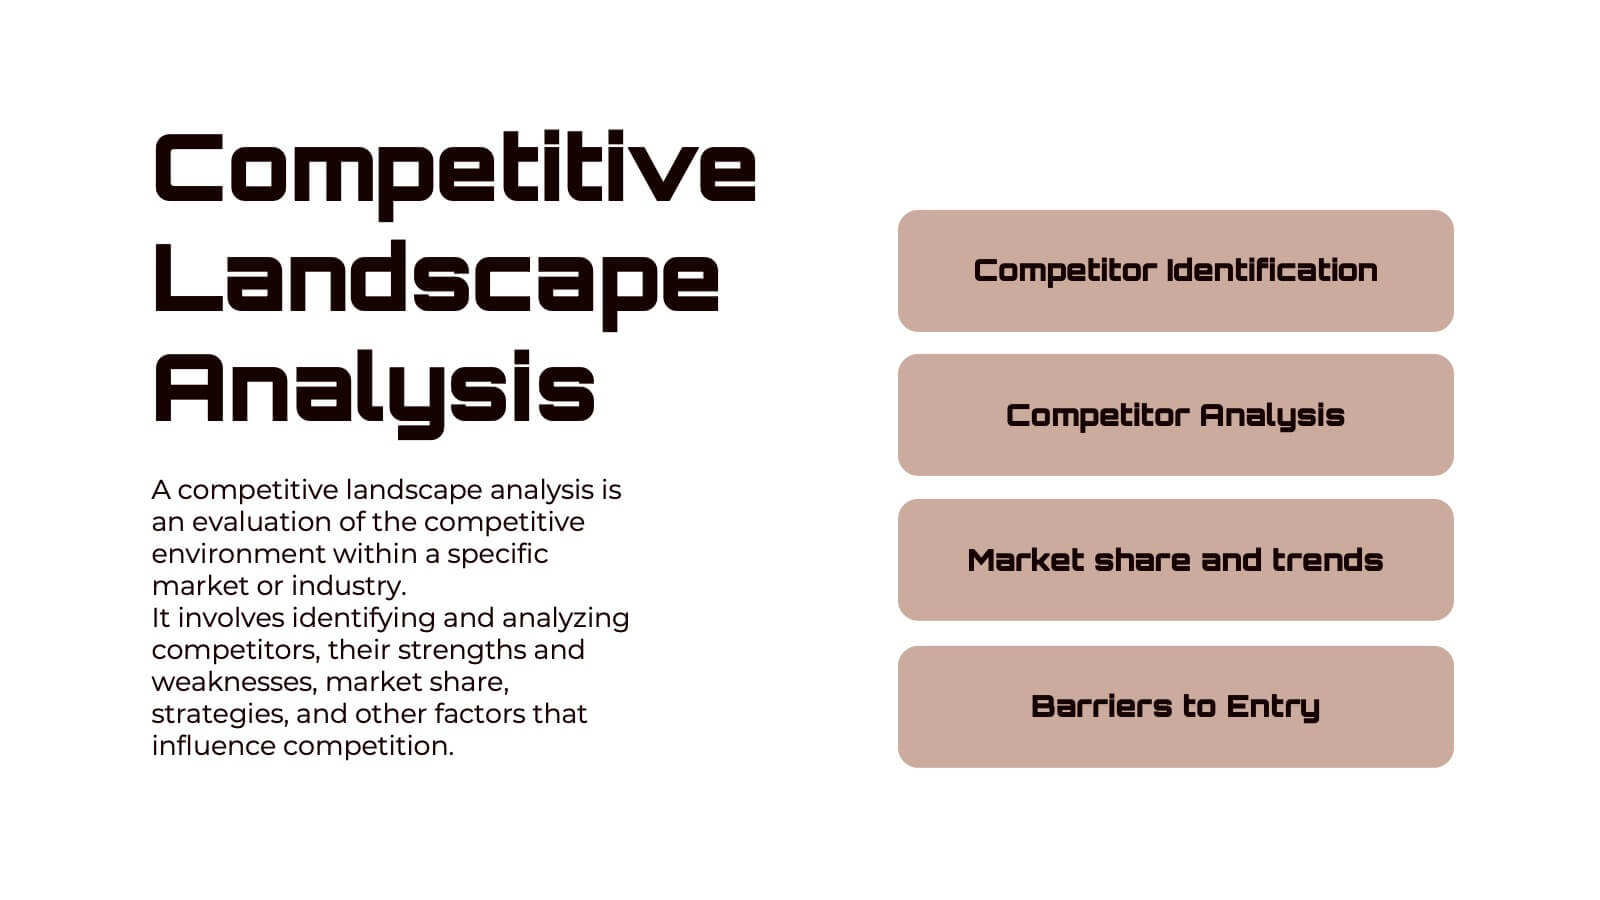
Business Issue Root Cause Identification Presentation
Pinpoint Business Challenges with Precision using this Business Issue Root Cause Identification presentation template. Designed to uncover underlying problems efficiently, this template features structured visuals, hierarchical frameworks, and clear labeling to facilitate root cause analysis. Whether you're a business strategist, operations manager, or consultant, this template helps identify, analyze, and resolve critical business issues. Fully customizable and compatible with PowerPoint, Keynote, and Google Slides, ensuring a seamless and professional presentation experience.


5 diapositivas
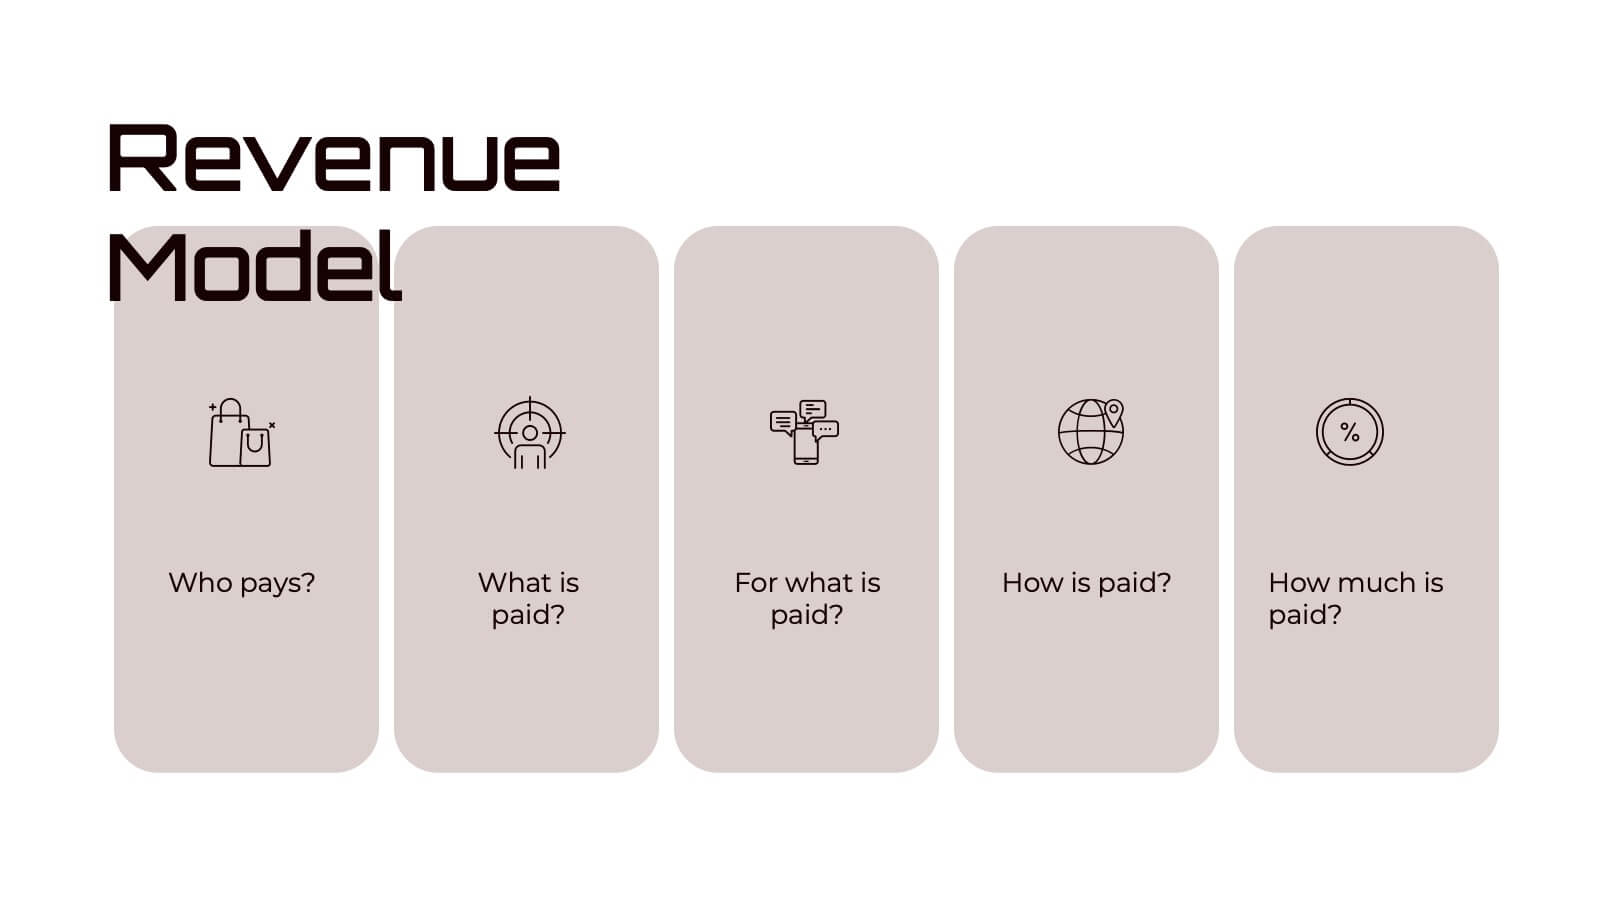
Competitive Strategy with Five Forces Presentation
Effectively visualize Porter’s Five Forces with this dynamic funnel-style infographic. Ideal for breaking down buyer power, supplier power, competitive rivalry, threats of substitution, and new entrants in a clear, engaging format. Perfect for consultants, strategists, and educators. Fully editable in PowerPoint, Keynote, and Google Slides.


6 diapositivas
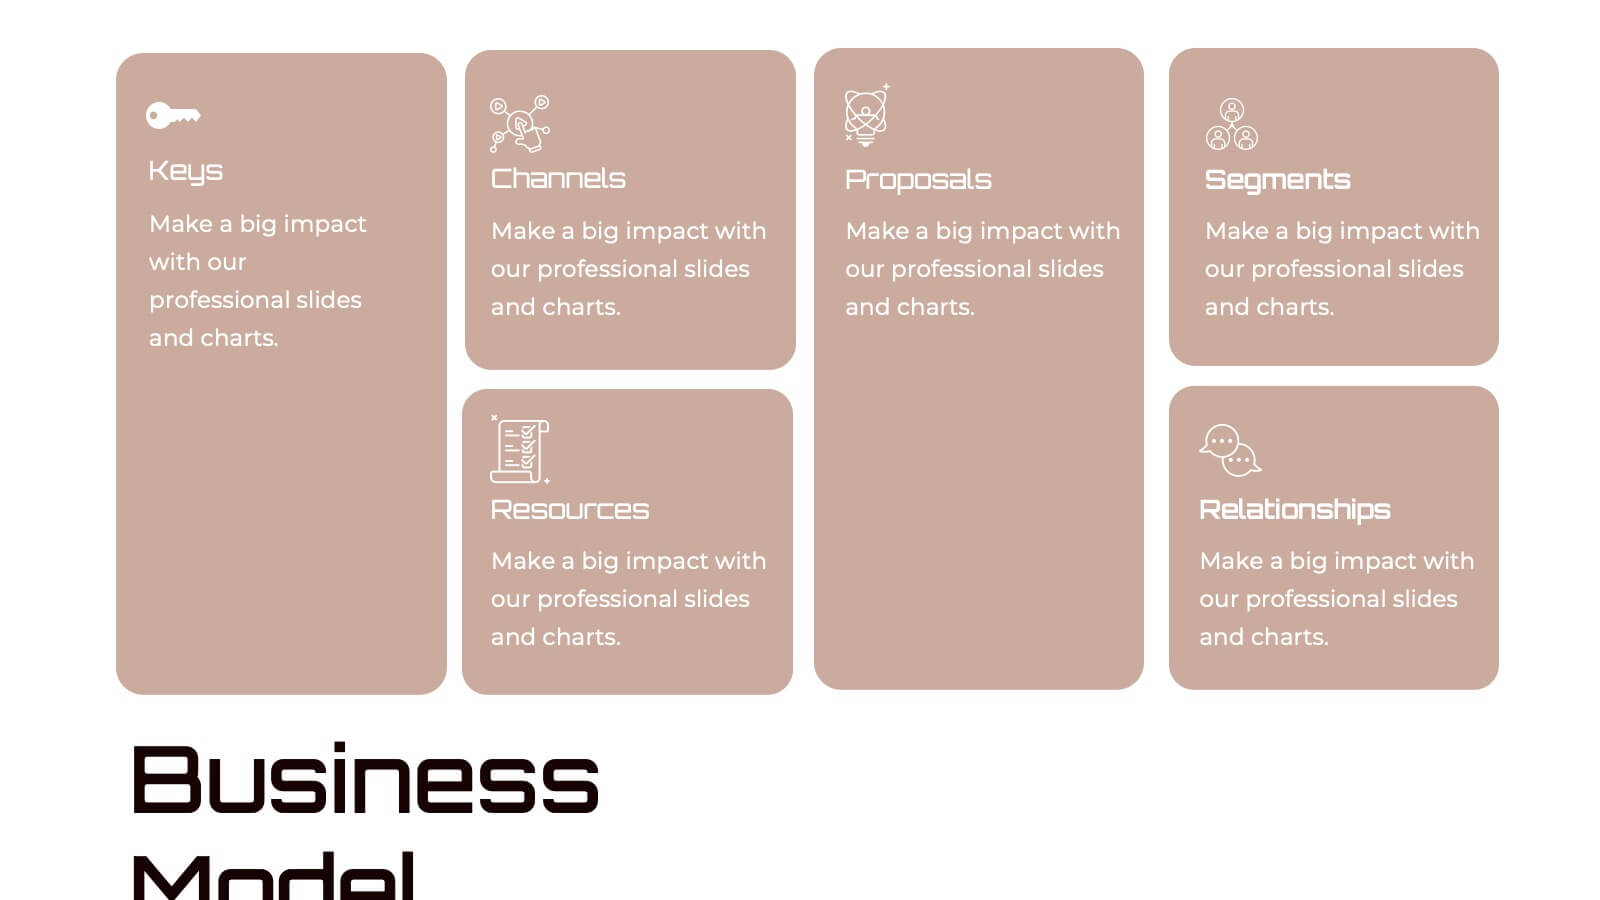
Pyramid-Triangle Visual Logic Presentation
Present interconnected concepts with clarity using the Pyramid-Triangle Visual Logic Presentation. This layout uses a hexagonal pyramid structure to show relationships between six ideas or categories, making it ideal for strategy models, balanced frameworks, or multi-step solutions. Each section includes a title, icon, and editable content block to ensure clarity and customization. Compatible with PowerPoint, Keynote, and Google Slides.


6 diapositivas
Professional Company Portfolio Presentation
Showcase Your Business Success with a Sleek Portfolio! The Professional Company Portfolio template is designed to highlight key achievements, performance metrics, and strategic insights with a modern, image-driven layout. Featuring three visually appealing sections, this template allows you to present KPIs, revenue growth, and business milestones in a compelling and structured way. Fully customizable in PowerPoint, Keynote, and Google Slides, this portfolio template is perfect for presentations, investor updates, and corporate showcases.


5 diapositivas
Risk Mitigation Strategies Presentation
Effectively identify, assess, and prevent risks before they escalate. This Risk Mitigation Strategies template offers a structured way to visualize potential risks, proactive responses, and resilience planning. Ideal for risk managers, business strategists, and decision-makers. Fully editable and compatible with PowerPoint, Keynote, and Google Slides for seamless integration into your workflow.


6 diapositivas
Modern Agriculture Industry Trends
Highlight key data and insights with this visually engaging agriculture-themed slide. Designed with circular data visuals and crop illustrations, it's perfect for showcasing percentages, trends, or growth stats in modern farming, agri-tech, and sustainability initiatives. Fully editable in PowerPoint, Keynote, and Google Slides.


4 diapositivas
Core Company Value Mapping Presentation
Spotlight your business strengths with the Core Company Value Mapping Presentation. This slide design helps you break down and compare key value drivers using a structured visual format—ideal for internal strategy discussions, executive briefings, or stakeholder updates. Highlight metrics, priorities, or departments with side-by-side percentage comparisons and icon indicators. Fully editable in PowerPoint, Keynote, and Google Slides. A must-have for operations teams, consultants, and leadership presentations.


4 diapositivas
Risk Impact Matrix Grid Presentation
Visualize project risk with this customizable impact matrix grid. Designed for quick risk assessment, it helps you map likelihood versus impact using color-coded indicators and clean grid layouts. Ideal for strategic planning, audits, or compliance meetings. Compatible with PowerPoint, Google Slides, and Keynote for seamless editing and professional presentations.


4 diapositivas
Professional Team Member Slides Presentation
Meet your team in a fresh, dynamic way with a layout that highlights personalities, roles, and key contributions at a glance. This presentation helps introduce members clearly, supporting stronger collaboration and professional communication across any project. Fully customizable and compatible with PowerPoint, Keynote, and Google Slides.


7 diapositivas
Breast Cancer Day Infographic Presentation Template
National breast cancer day is on October 13th. Every October, people all over the world show their support for everyone affected by breast cancer. This template was designed to help inspire, support and bring awareness to breast cancer. This presentation template was made to help promote the cause and bring awareness to breast cancer. With a focus on pink, this template has lots of space for messaging, as well as opportunities for brand exposure. Easy to modify, and perfect for your next project this template is inspiring to use on your personal website, blog and more to show others.


23 diapositivas
Soundburst Business Idea Pitch Deck Presentation
The Pitch Deck Presentation Template delivers a professional, modern design with 23 slides tailored for startups and businesses. Covering company overview, solutions, market opportunities, and financials, it's fully customizable for your unique vision. Compatible with PowerPoint, Keynote, and Google Slides, this template ensures impactful, investor-ready presentations.


5 diapositivas
Attention to Action Model Framework Presentation
This sleek presentation visualizes the four key stages—Attention, Interest, Desire, and Action—in a clear, pyramid-based layout. Ideal for marketing, sales, or behavioral strategy discussions. Each step is color-coded for emphasis, making it easy to follow and present. Fully editable in Canva to fit your brand and messaging needs.


10 diapositivas
Home Office Scenes and Teamwork Presentation
Capture the modern remote work environment with this clean and visual layout. Featuring an illustrated home office scene on one side and four color-coded percentage blocks with text on the other, this template is ideal for presenting team productivity metrics, remote collaboration stats, or flexible work insights. Fully customizable in PowerPoint, Keynote, and Google Slides to match your brand.