


Características


¿Tienes alguna pregunta?
Recomendar


5 diapositivas
Final Thoughts and Project Recap Presentation
Wrap up your presentation with clarity using this Final Thoughts and Project Recap Presentation. Designed with a modern vertical hexagon layout, this slide highlights four key conclusions or reflections with matching icons and clean text alignment. It's perfect for summarizing insights, actions, or final outcomes. Fully editable in PowerPoint, Keynote, Google Slides, and Canva.


26 diapositivas
Becka Presentation Template
Becka is a modern and powerful template for people who want to present themselves in a professional but bold way. Perfect for the CEO or company executive who wants to have a strong presence on screen. Made with clear and crisp typography, with added bold colors that appeal to both men and women which can evoke powerful emotions and confidence. This template contains easy to edit maps, charts and image place holders that are ready to use. The dynamic slides make it quick and easy to create the perfect presentation.


5 diapositivas
Business Overview and Highlights Summary
Summarize your company’s key milestones with this Business Overview and Highlights Summary slide. Featuring a clean layout with a bold briefcase visual and four spotlight areas, it’s ideal for showcasing achievements. Fully editable in PowerPoint, Keynote, and Google Slides.


5 diapositivas
Executive Leadership Development Plan
Showcase leadership growth with the Executive Leadership Development Plan Presentation. Designed to visualize a clear progression of skills or initiatives, this four-stage layout uses diagonal segments and icons to represent each development milestone. Ideal for HR, executive coaching, or talent management presentations. Compatible with PowerPoint, Keynote, and Google Slides.


6 diapositivas
Efficient Workflow Management
Highlight process optimization, task delegation, or team productivity strategies using this linear gear-style workflow design. Perfect for operations leaders, project managers, or consultants presenting step-by-step plans. Fully customizable in PowerPoint, Keynote, and Google Slides—edit icons, text, and colors to fit your message.


4 diapositivas
Types of Cloud Services Presentation
Turn technical concepts into clear, engaging visuals with this sleek and modern template. Perfect for showcasing digital platforms, cloud solutions, and service models, it helps you simplify complex data while maintaining a professional tone. Fully editable and compatible with PowerPoint, Keynote, and Google Slides for easy customization.


6 diapositivas
Table of Content Layout Presentation
Kick off your presentation with a clean, modern layout that instantly guides your audience through each section with clarity and style. This design highlights key topics in a structured, easy-to-follow sequence, making navigation simple and intuitive. Fully compatible with PowerPoint, Keynote, and Google Slides for seamless use.


21 diapositivas
Aquamarine Creative Portfolio Presentation
Dive into creativity with this stunning aquamarine-inspired portfolio presentation! Perfect for showcasing your creative work, this template allows you to highlight your projects, skills, and achievements with a refreshing and modern design. Its clean and dynamic layout enhances your portfolio's impact. Compatible with PowerPoint, Keynote, and Google Slides.


6 diapositivas
Circular Concept Diagram for Strategy Presentation
Visualize interconnected ideas with this circular concept diagram, ideal for showcasing six key strategic pillars or processes. Each segment is clearly labeled and icon-supported, creating an easy-to-follow layout. Perfect for business planning, marketing strategies, or organizational models. Compatible with PowerPoint, Keynote, and Google Slides for full customization.


6 diapositivas
Supply Chain Risk Infographic
Supply chain risk refers to the potential disruptions, vulnerabilities, and uncertainties that can negatively impact the flow of goods, services, and information within a supply chain network. This infographic aims to provide a clear overview of the different types of risks that can disrupt the supply chain and the strategies to mitigate those risks effectively. This infographic is designed to help businesses and supply chain managers understand and manage potential vulnerabilities in their supply chains. This template is fully customizable and compatible with Powerpoint, Keynote, and Google Slides.


5 diapositivas
Medical Services Infographics
Navigate the complexities of healthcare information with our medical services infographics. Rendered in a life-affirming palette of blue and red, these infographics elucidate various facets of medical services. The template serves as a lifeline for healthcare professionals, and public health advocates by providing a clear, visual narrative of services, processes, and advancements in the medical field. Compatible with Powerpoint, Keynote, and Google Slides. Its creative yet informative style, enhanced with relevant graphics and icons, ensure that critical information catches the eye, improves understanding, and encourages engagement.


6 diapositivas
Veterinary Clinic Service Guide Presentation
Bright, friendly, and professional—this clean infographic layout helps present veterinary services with clarity and warmth. Perfect for showcasing treatments, care plans, and clinic highlights, it brings a welcoming touch to any animal care presentation. Fully customizable and compatible with PowerPoint, Keynote, and Google Slides for effortless editing and presentation.


6 diapositivas
Framework Architect Infographics
Explore the role of a Framework Architect with our customizable infographic template. This template is fully compatible with popular presentation software like PowerPoint, Keynote, and Google Slides, allowing you to easily customize it to illustrate and communicate the responsibilities and key aspects of a Framework Architect's role. The Framework Architect infographic template offers a visually engaging platform to define and explain the responsibilities, skills, and contributions of a Framework Architect within the field of software development or architecture. Whether you're a software architect, IT professional, or simply interested in understanding this role, this template provides a user-friendly canvas to create informative presentations and educational materials. Deepen your understanding of the Framework Architect role with this SEO-optimized infographic template, thoughtfully designed for clarity and ease of use. Customize it to highlight key responsibilities, architectural frameworks, collaboration methods, and the importance of this role in software development projects. Ensure that your audience gains valuable insights into the world of Framework Architecture. Start crafting your personalized infographic today to explore the role of a Framework Architect in greater depth.


21 diapositivas
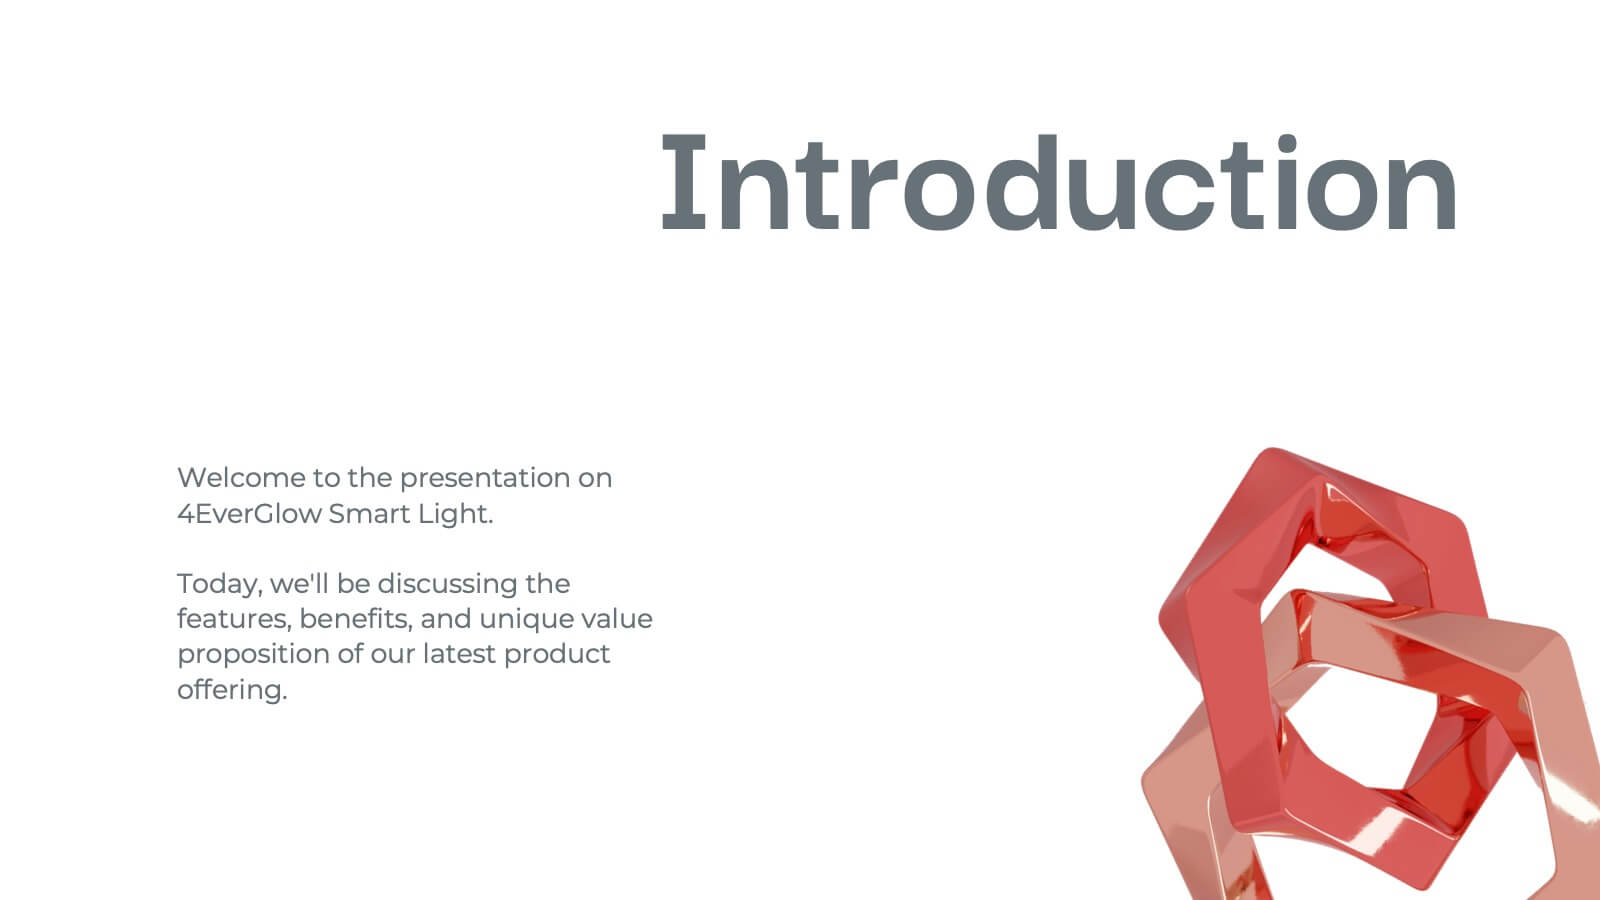
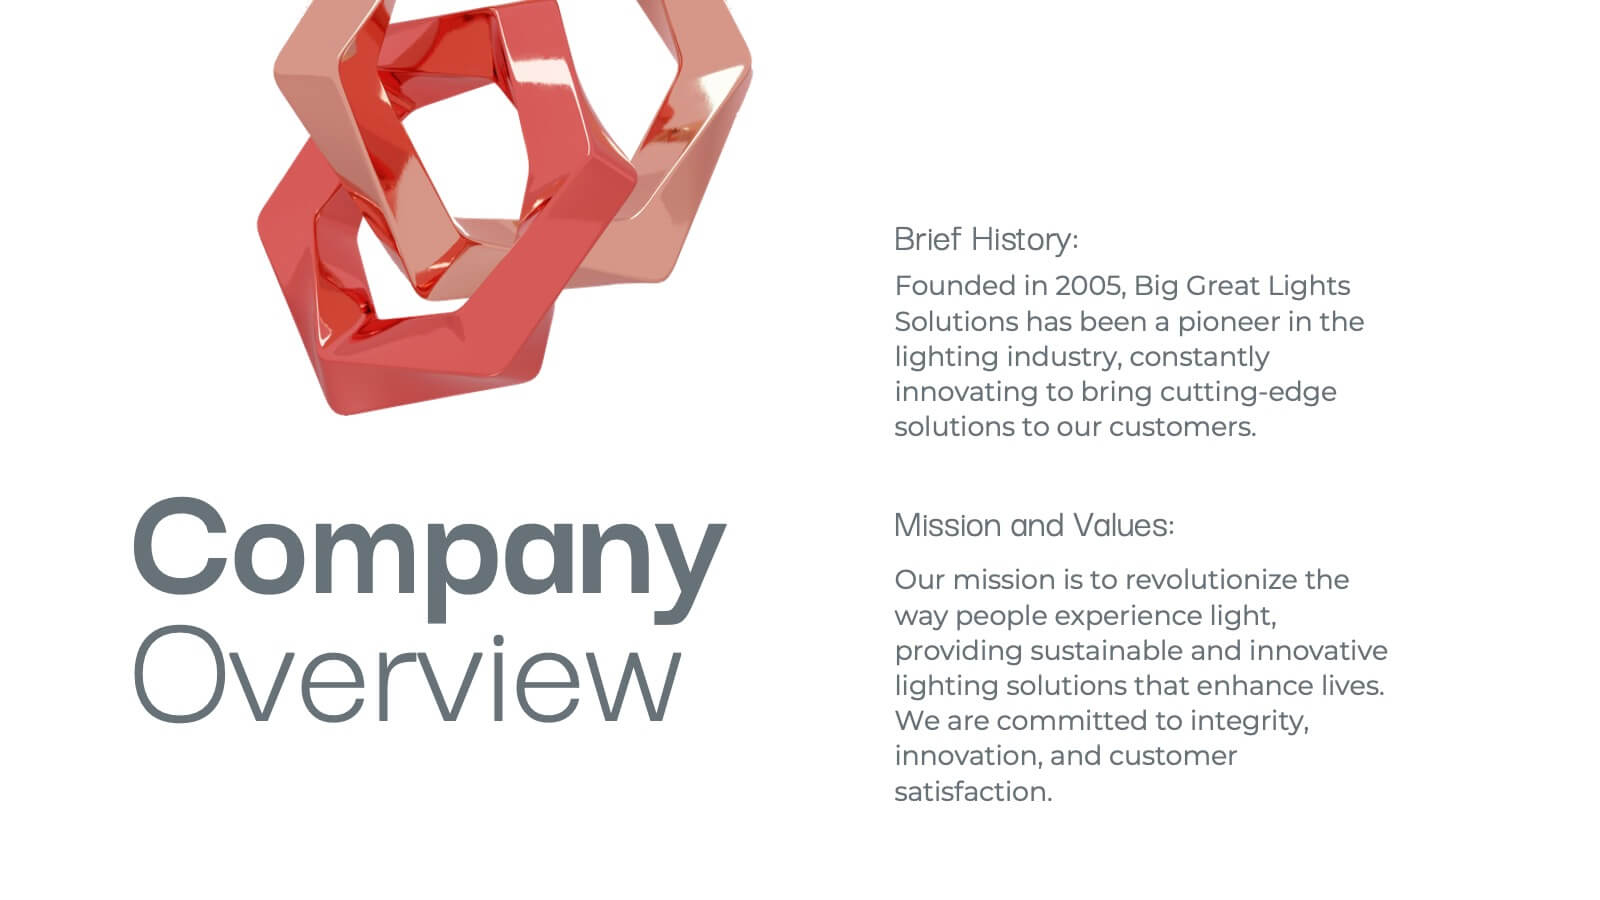
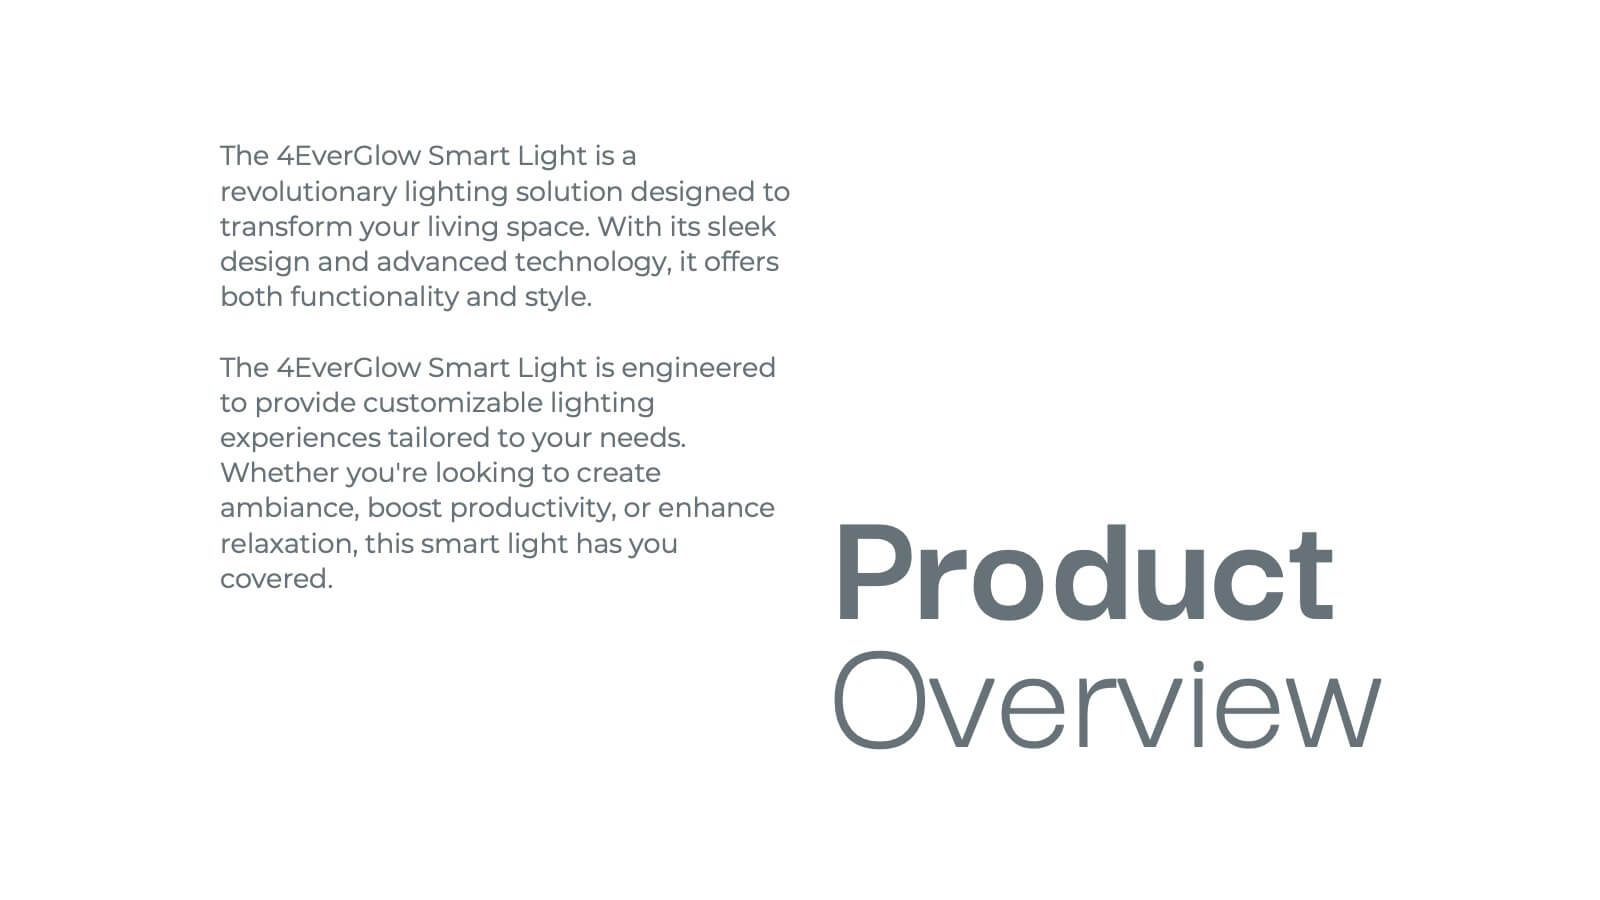
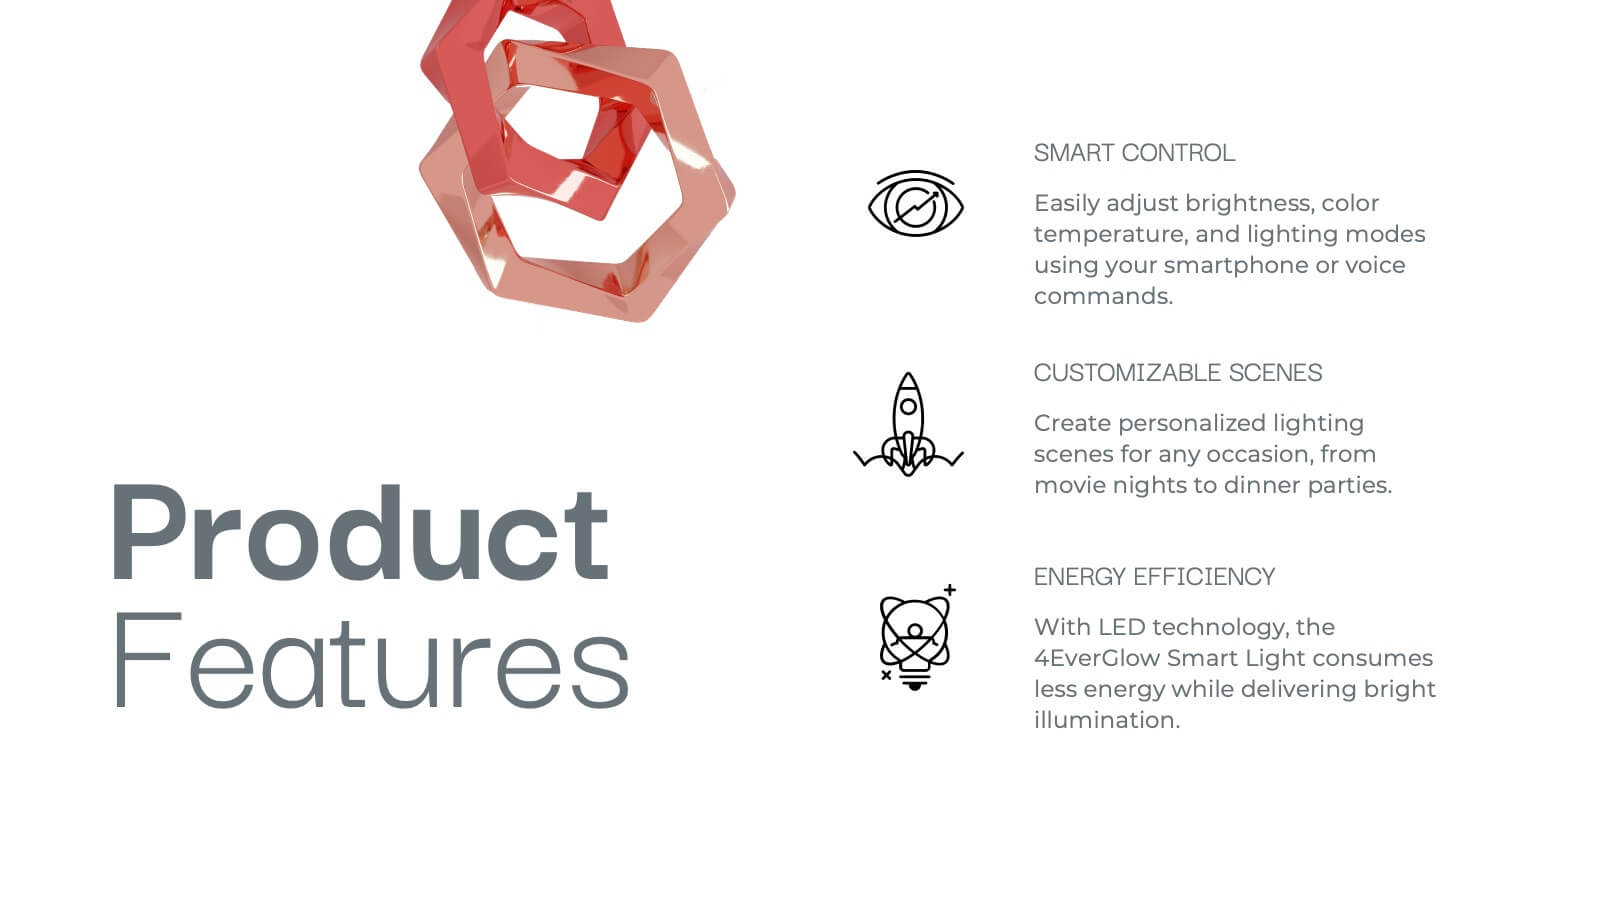
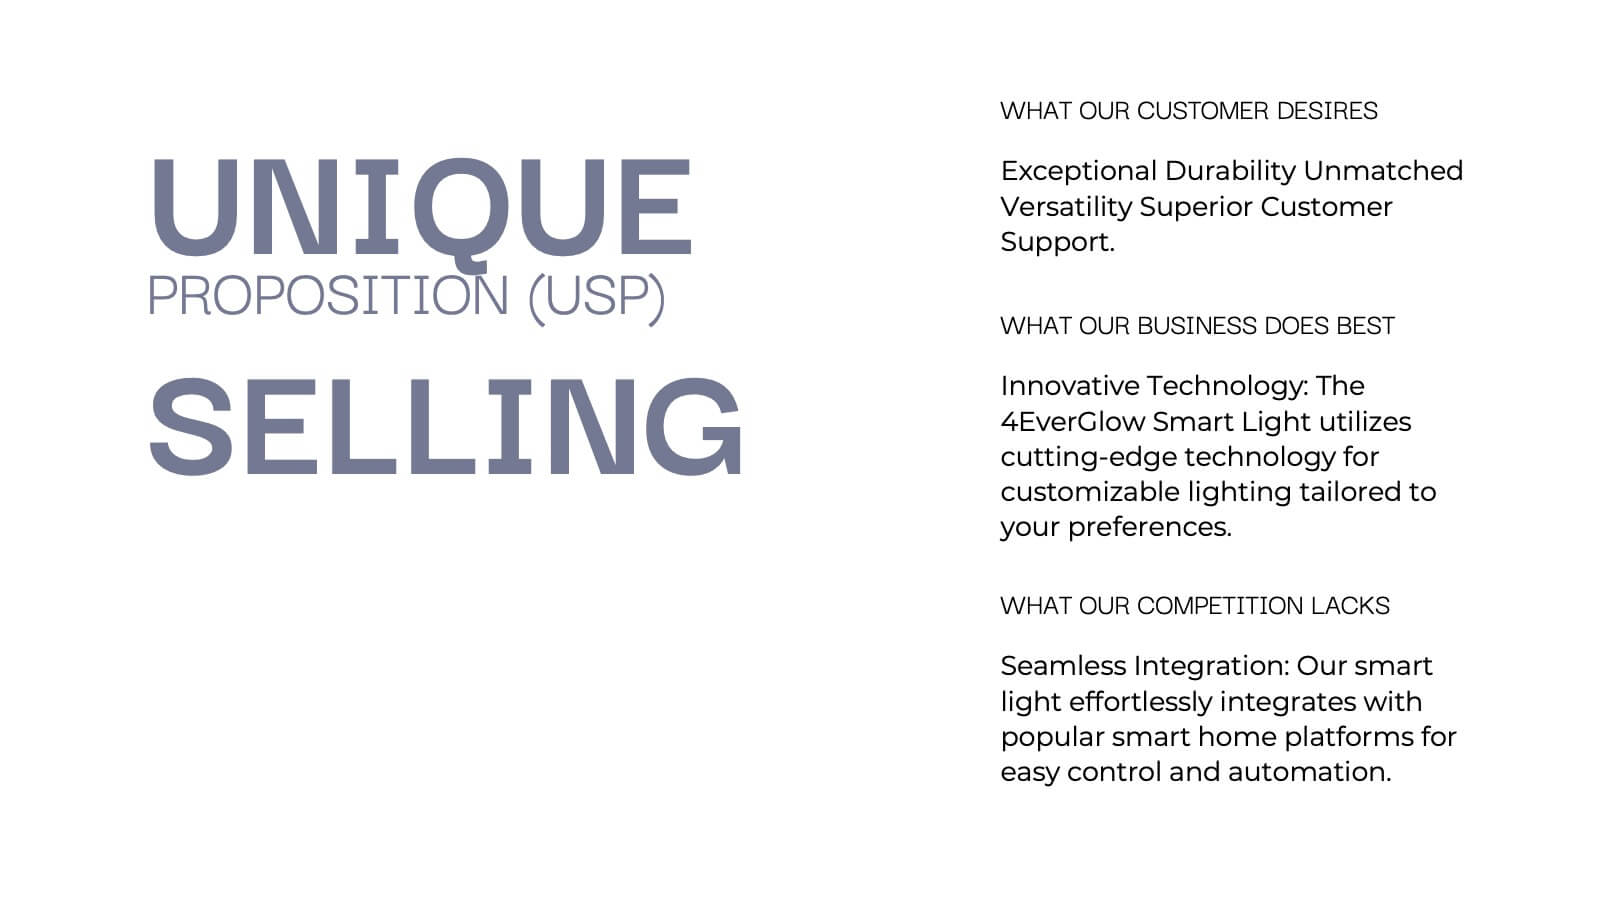
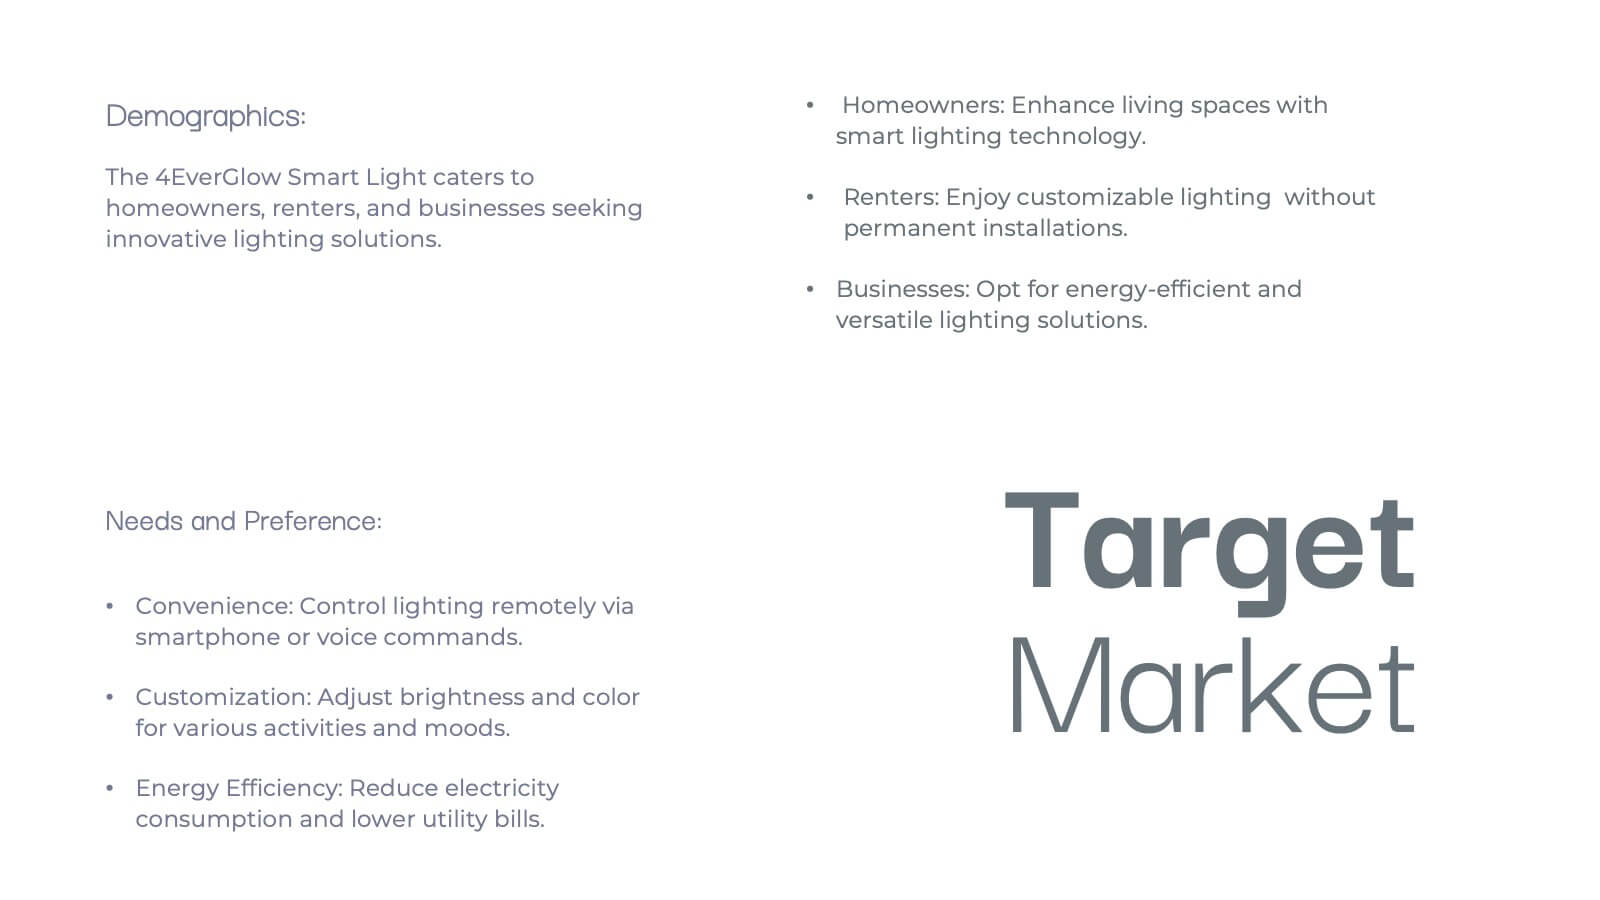
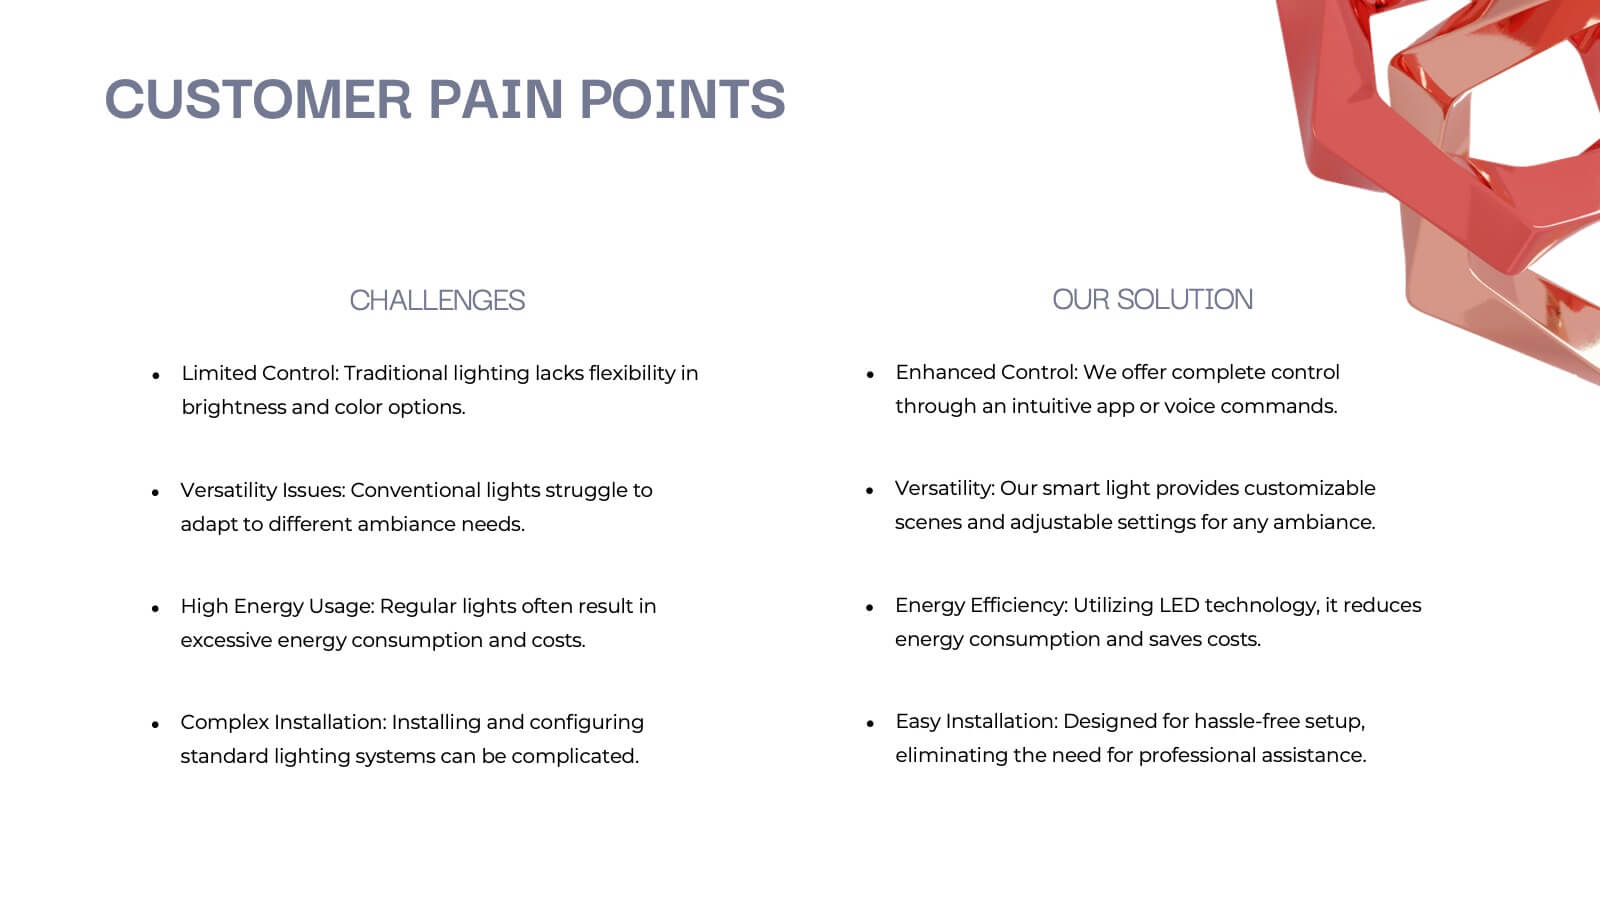
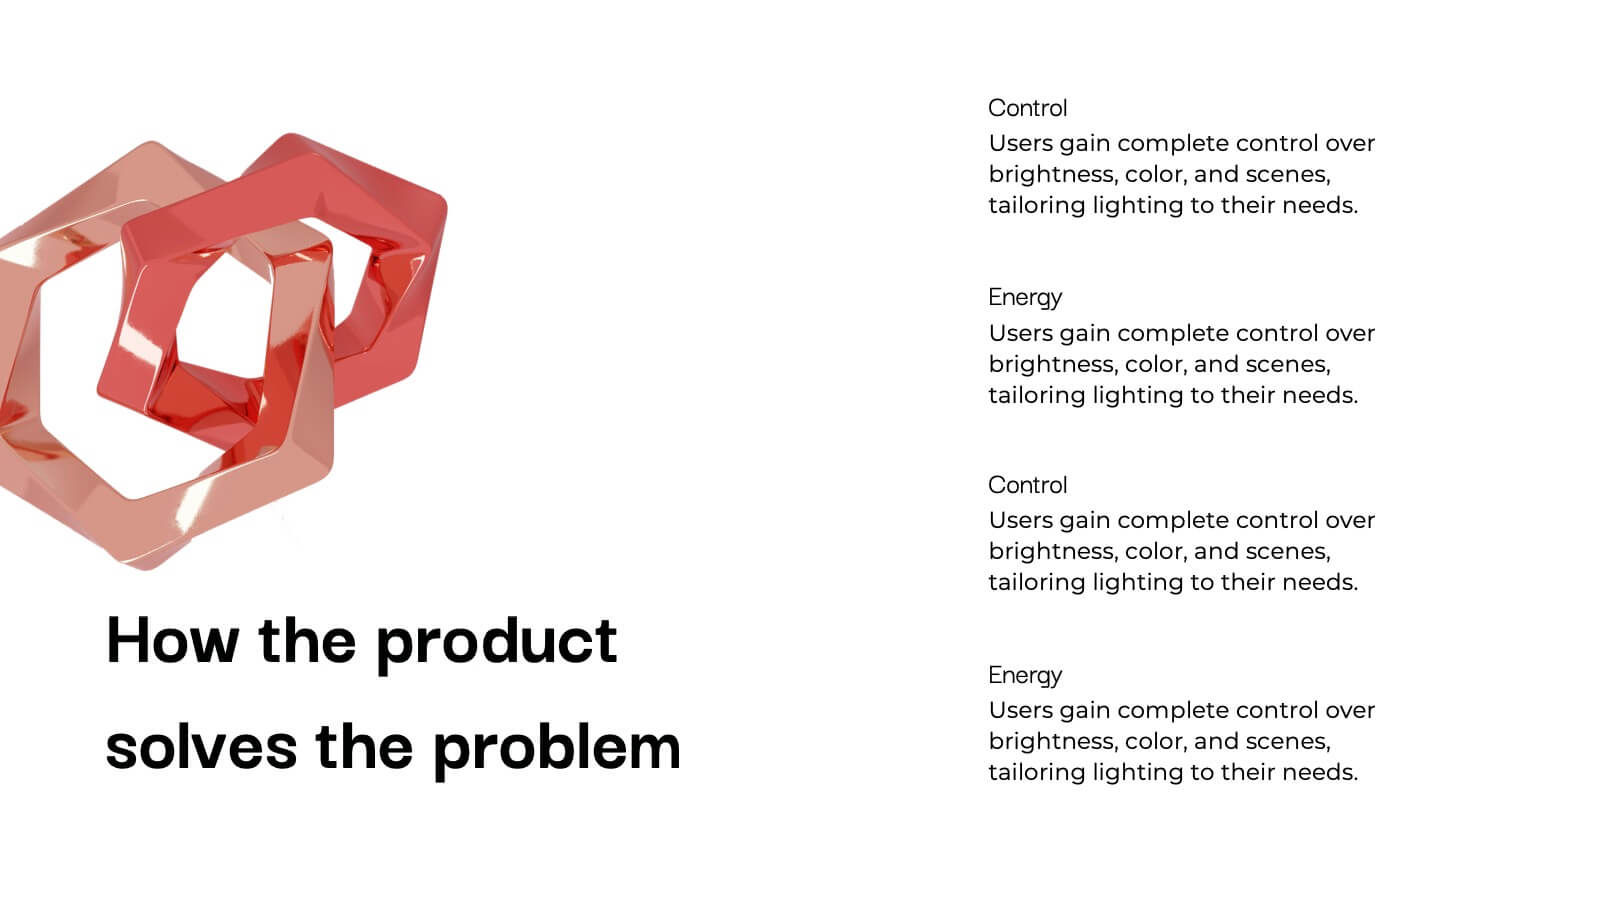
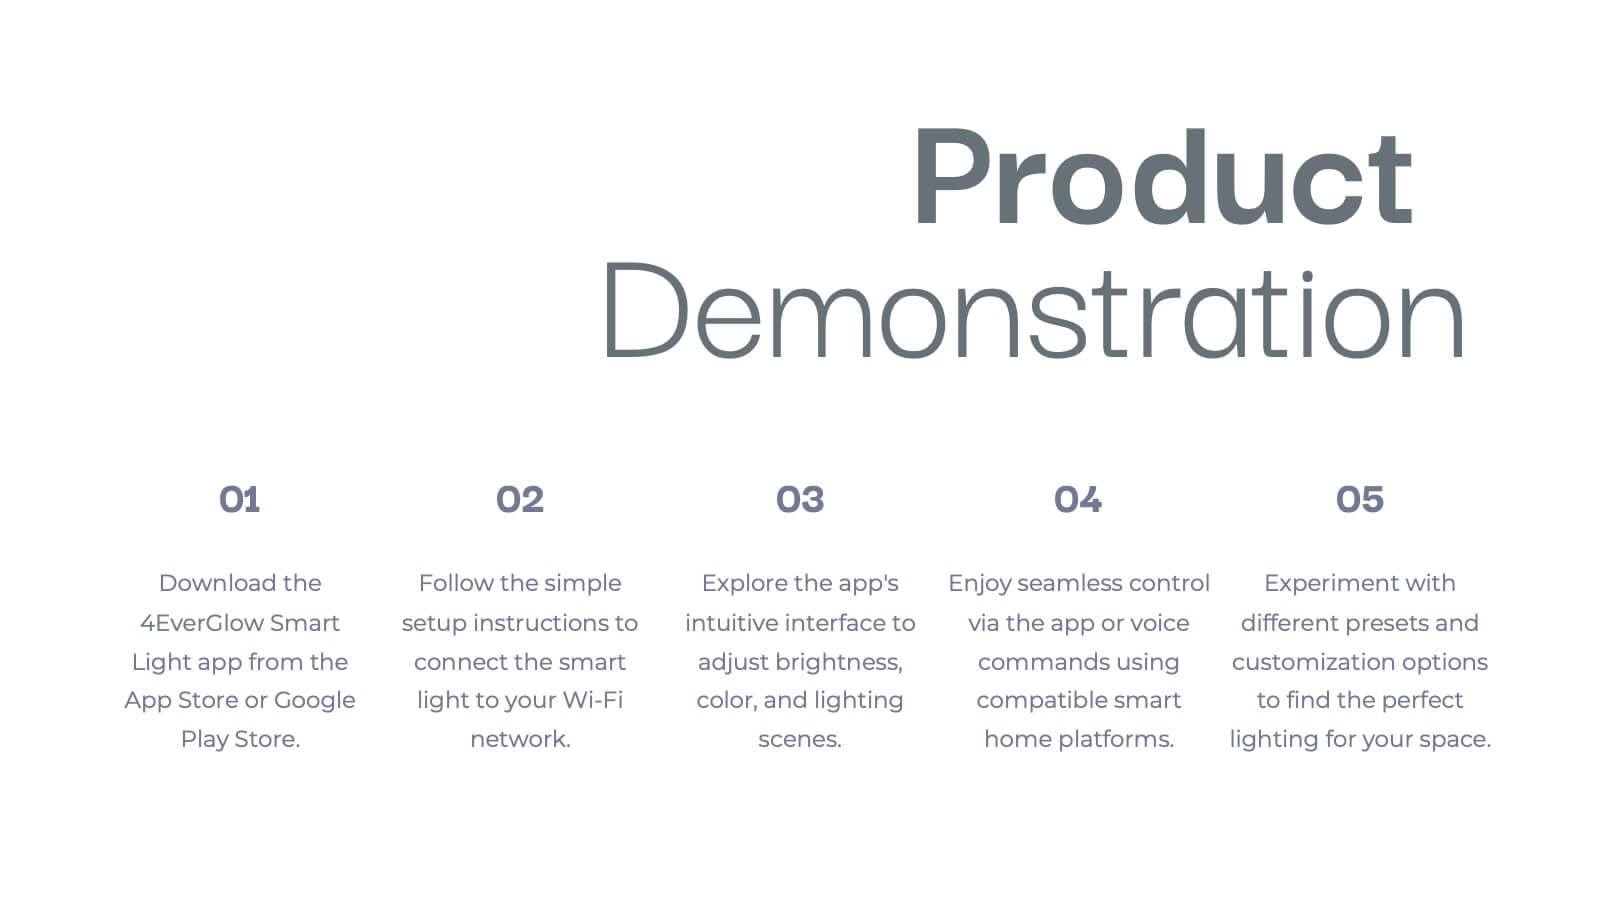
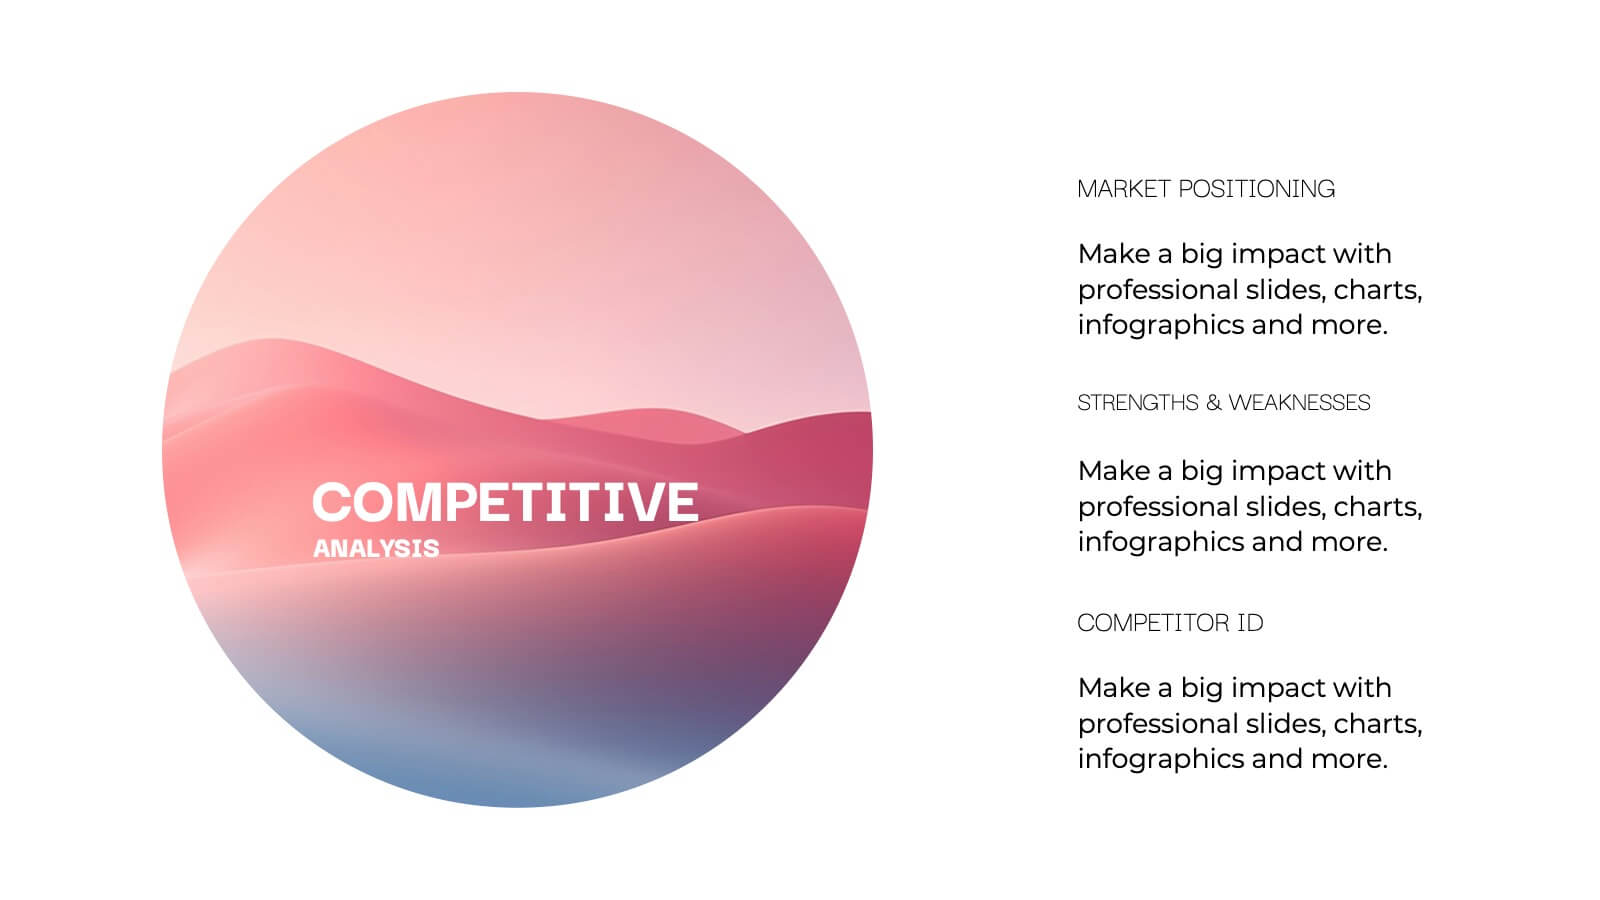
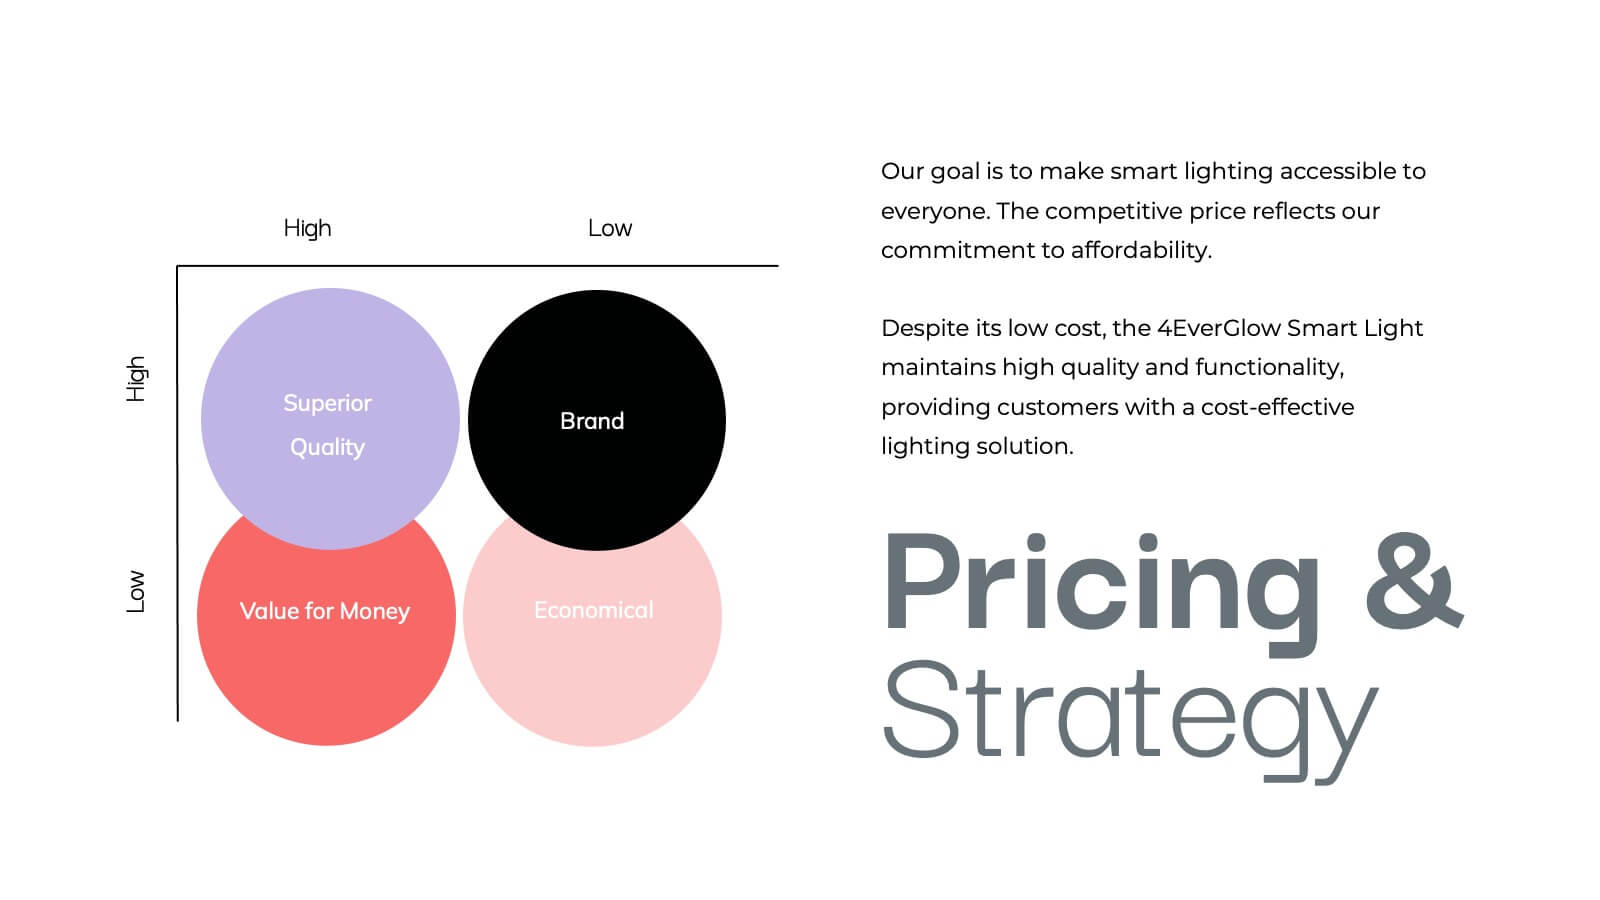
Vulcan New Product Proposal Presentation
Launch your next product with confidence using this comprehensive presentation template! Covering everything from product features and target market to pricing strategy and customer pain points, this template ensures a smooth and engaging flow for your audience. It’s ideal for product proposals, demonstrations, and marketing strategies. Compatible with PowerPoint, Keynote, and Google Slides for seamless presentations.


7 diapositivas
Budget Planner Infographic Presentation
A Budget Forecasting Infographic is a visual representation of the projected financial performance of a business or organization over a specific period of time. This template is a perfect way to communicate complex financial information in a simplified and visually engaging way, allowing stakeholders to better understand the financial health and future prospects of the organization. This budget forecasting infographic includes table, charts, graphs, and other visual elements that illustrate key financial metrics, such as revenue, expenses, and profits, over the forecast period.


8 diapositivas
Legal Framework for Corporations
Visualize corporate compliance and governance structures with this balanced legal framework slide. Featuring a scale diagram with adjustable sections, it’s perfect for explaining regulations, policies, and corporate ethics. Ideal for law firms, corporate teams, and compliance officers. Fully editable and compatible with PowerPoint, Keynote, and Google Slides.


8 diapositivas
Survey Poll Results Visualization Presentation
Easily showcase your survey or poll data with this bold and modern results visualization slide. Designed with eye-catching circular charts, it helps your audience quickly grasp key insights at a glance. Perfect for business reviews, feedback summaries, or internal reports. Compatible with PowerPoint, Keynote, and Google Slides.