


Características


¿Tienes alguna pregunta?
Recomendar


5 diapositivas
Customer Loyalty Program Strategy
Design a winning rewards system with this engaging loyalty program infographic. Featuring a vertical layout with five customizable stages alongside a gift icon, this slide is perfect for outlining incentives, customer tiers, or retention plans. Fully editable in PowerPoint, Keynote, and Google Slides.


4 diapositivas
HR Policies and Employee Management Presentation
Clearly outline your workplace strategies with this HR Policies and Employee Management slide. Featuring four color-coded segments alongside an illustration of employee analysis, this layout is ideal for presenting onboarding steps, employee benefits, internal policies, or training procedures. Fully editable and compatible with PowerPoint, Keynote, and Google Slides for seamless customization.


6 diapositivas
Strategic PESTEL Presentation
Kickstart smarter strategy sessions with a clean, colorful layout that makes external factor analysis feel effortless. This presentation helps teams map trends, identify risks, and understand the broader environment shaping business decisions. Clear visuals keep insights organized and actionable. Fully compatible with PowerPoint, Keynote, and Google Slides.


6 diapositivas
Venn Diagram
A Venn diagram is a visual representation of the relationships between different sets or groups. This infographic template consists of overlapping circles, each representing a specific set, and the overlapping parts indicates the elements that belong to multiple sets. Use this infographic to illustrate the relationships between different sets of data or concepts. The main components of the infographic are the circles or ellipses that represent the sets being compared. The size and position of the circles can be adjusted to reflect the data accurately. This infographic is fully customizable and compatible with Powerpoint, Keynote, and Google Slides.


5 diapositivas
Energy Sector Analysis Infographics
The Energy Sector refers to the industry and activities related to the production, generation, distribution, and consumption of energy. This template is a simple and informative tool that allows you to present key information and statistics about the energy sector in an engaging manner. This template is designed to help you showcase data, trends, and insights related to aspects of the energy sector, including renewable energy, fossil fuels, and environmental impacts. Its customizable design and informative layouts make it an ideal choice for educational presentations, or raising awareness and understanding of this and its various dimensions.


7 diapositivas
Competitive Analysis Using Strategy Wheel
Highlight your competitive edge with this dynamic strategy wheel diagram. Designed to visually compare up to six business components, this slide is ideal for showcasing strengths, weaknesses, or market positioning. Perfect for strategic planning sessions, it’s fully editable in PowerPoint, Keynote, and Google Slides.


7 diapositivas
Butterfly Visualization Layout Presentation
Bring balance and clarity to your data storytelling with a sleek, symmetrical design that connects ideas seamlessly. This presentation is ideal for visualizing comparisons, workflows, or interconnected topics in a clean and engaging format. Fully customizable and compatible with PowerPoint, Keynote, and Google Slides.


6 diapositivas
Remote Work Productivity Presentation
The "Remote Work Productivity" presentation template features a clean and modern design, ideal for showcasing strategies and statistics related to remote work efficiency. Each slide allows for the display of key data points and statistics, supported by visual elements like percentage indicators and progress bars that enhance the presentation’s readability and impact. This template is perfect for businesses looking to improve remote operations or present data-driven insights into remote work performance, making it easier for viewers to grasp the effectiveness of remote work policies and tools.


21 diapositivas
Thistlewood Strategic Planning Report Presentation
This comprehensive template is ideal for strategic planning, featuring slides for market analysis, SWOT evaluation, growth opportunities, and resource allocation. Showcase timelines, milestones, risk management, and communication strategies. Fully customizable, it’s perfect for delivering professional insights. Compatible with PowerPoint, Keynote, and Google Slides.


6 diapositivas
Search Engine Optimization Campaign Overview Presentation
Kick off your digital strategy with a clean, modern layout that makes every key insight feel connected and actionable. This presentation helps you explain campaign goals, highlight SEO priorities, and break down essential tasks in a structured, visual flow. Fully compatible with PowerPoint, Keynote, and Google Slides.


22 diapositivas
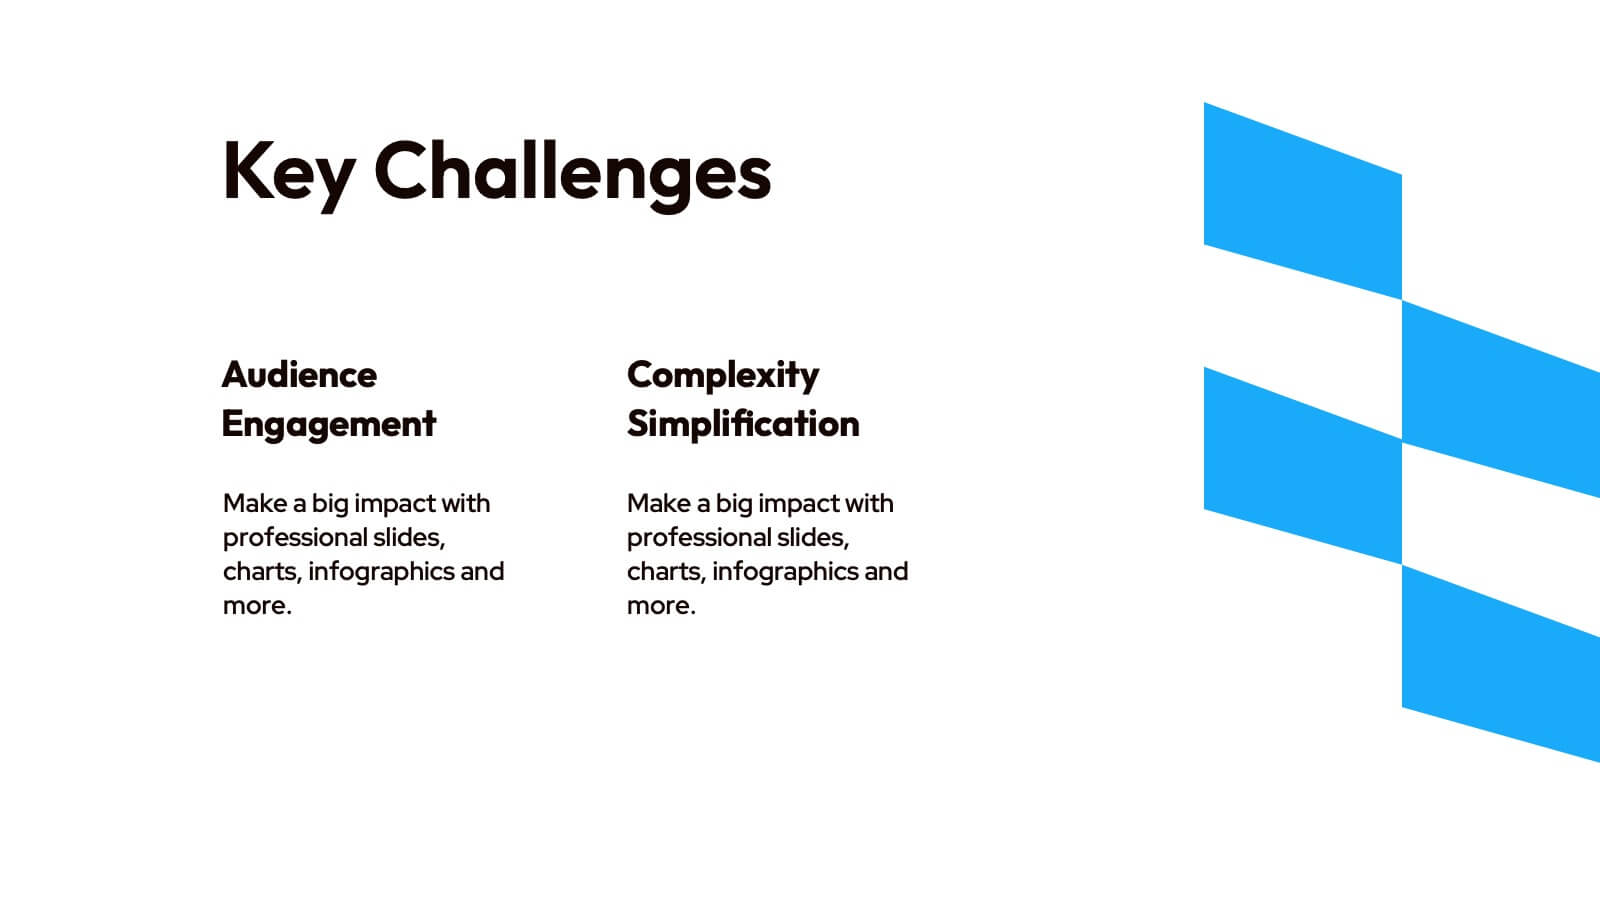
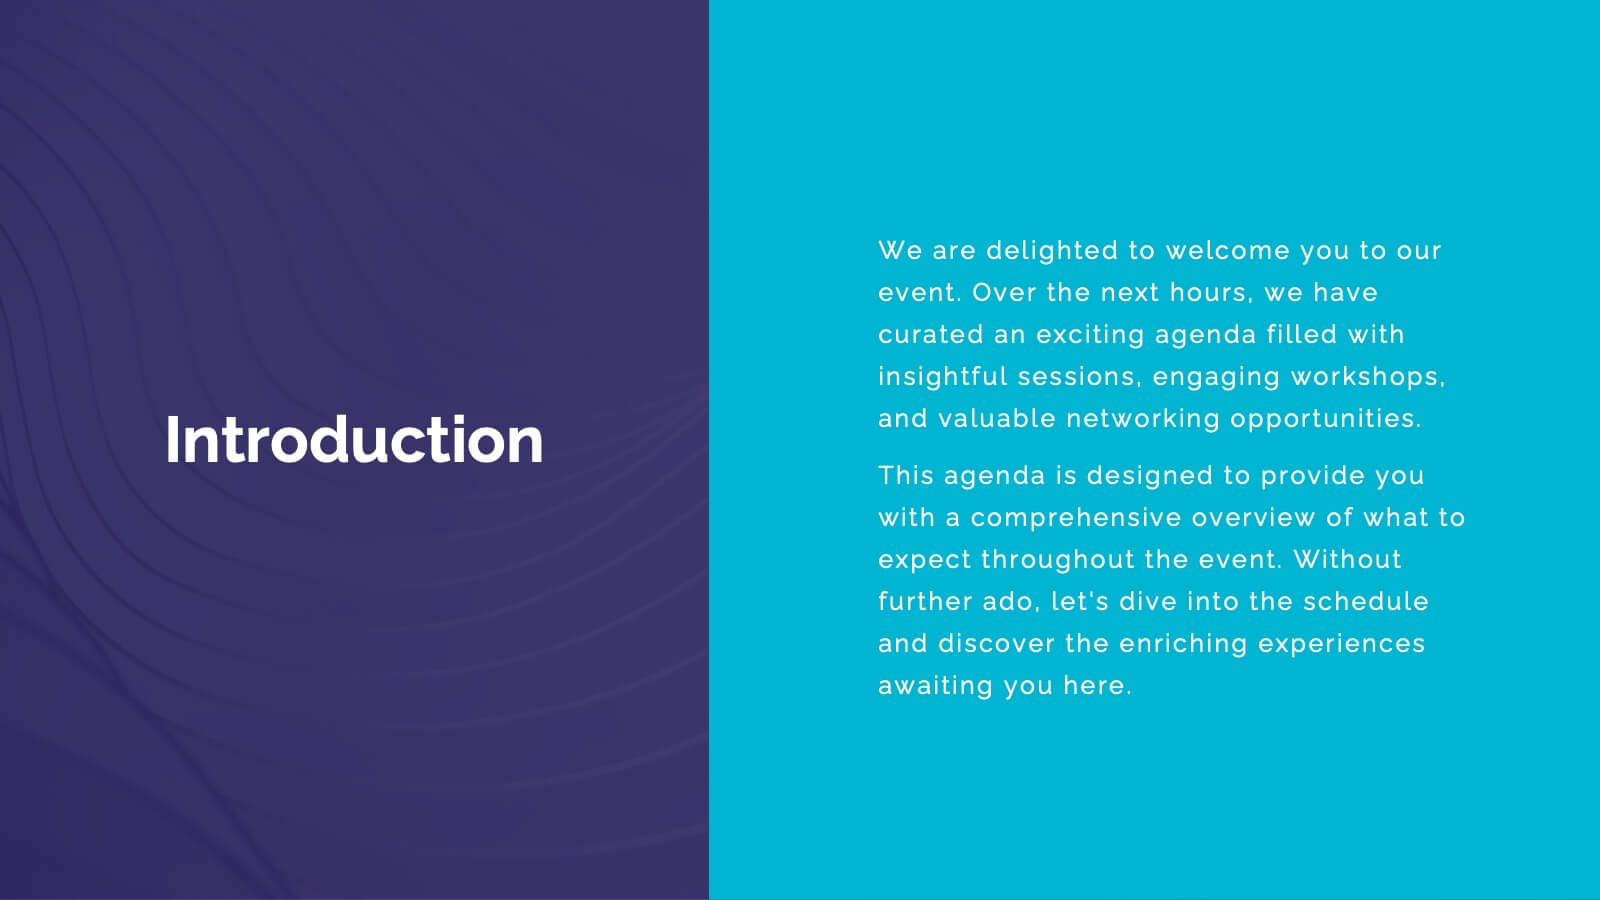
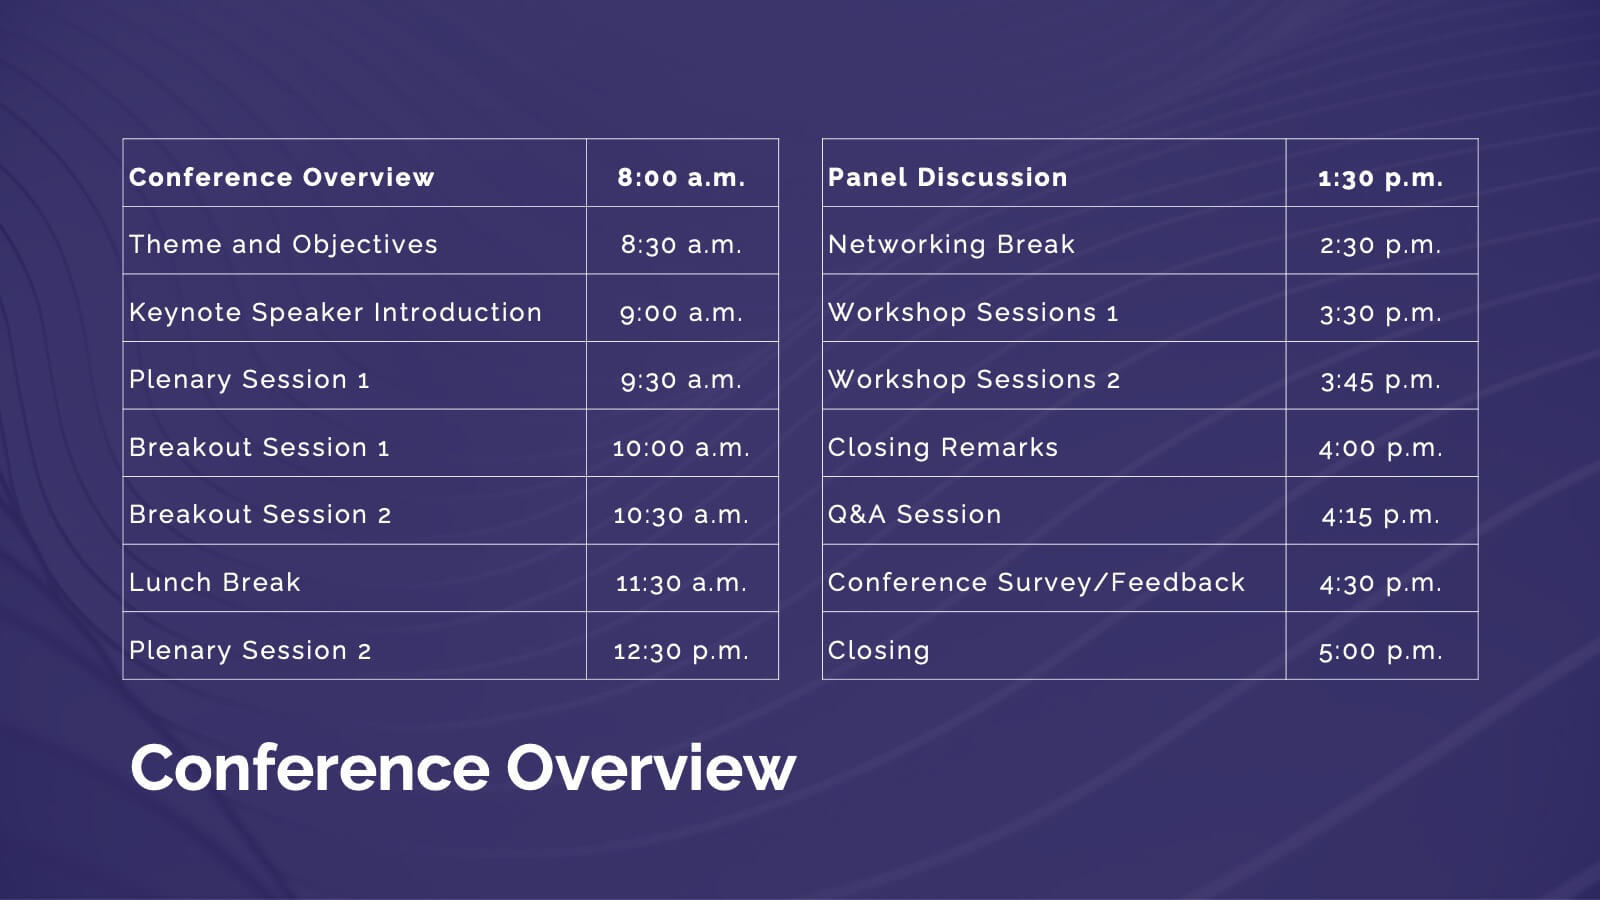
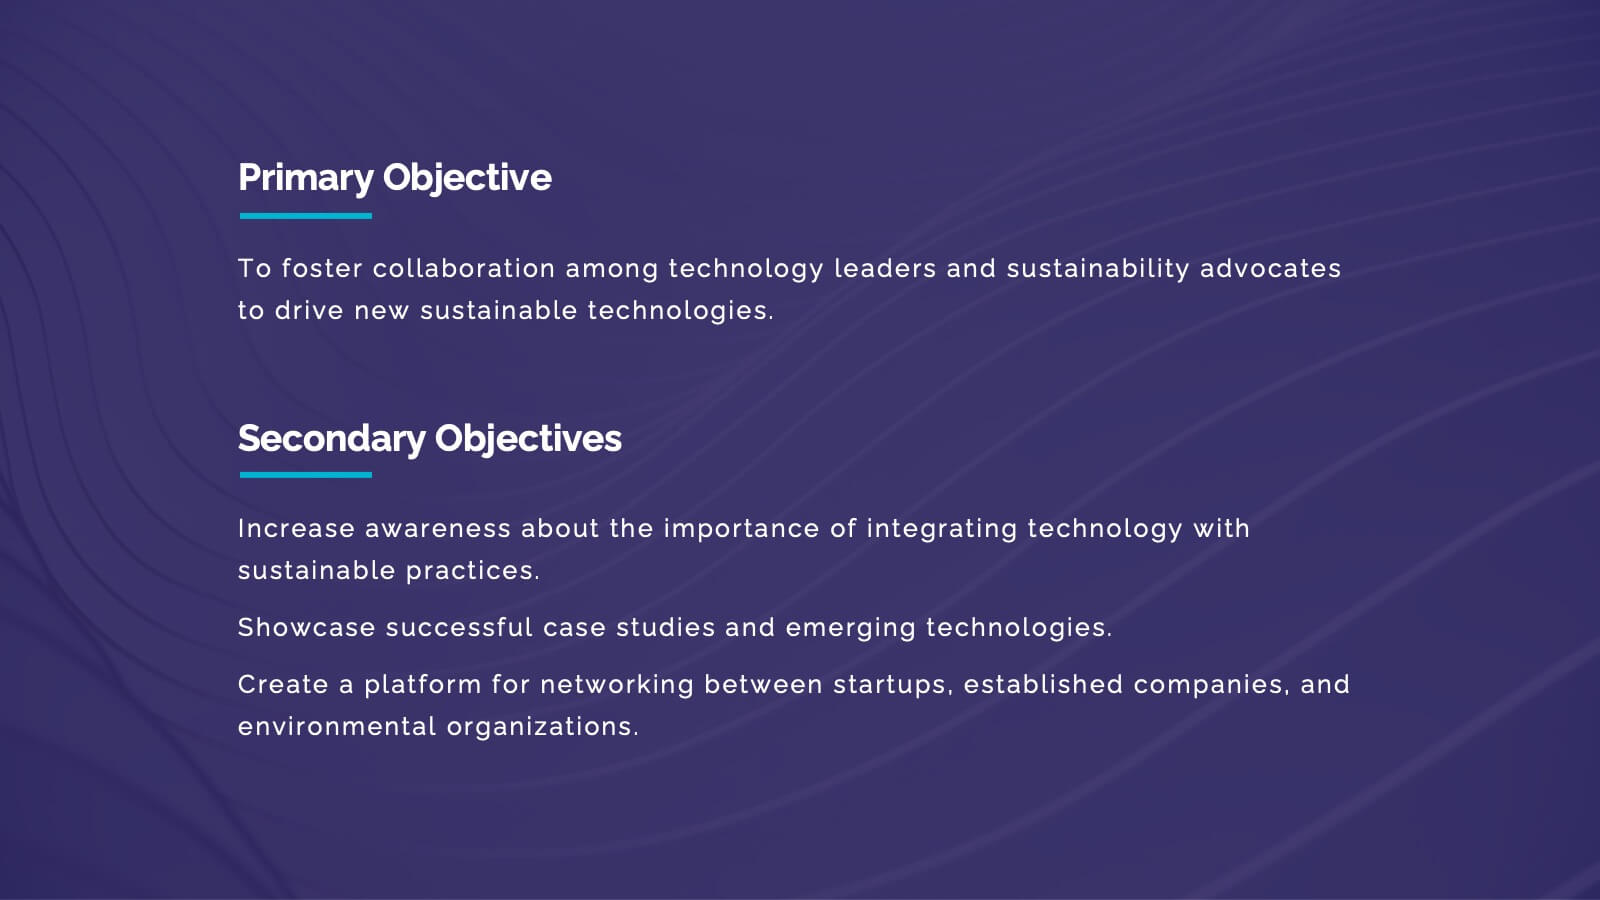
Nimbus Business Development Proposal Presentation
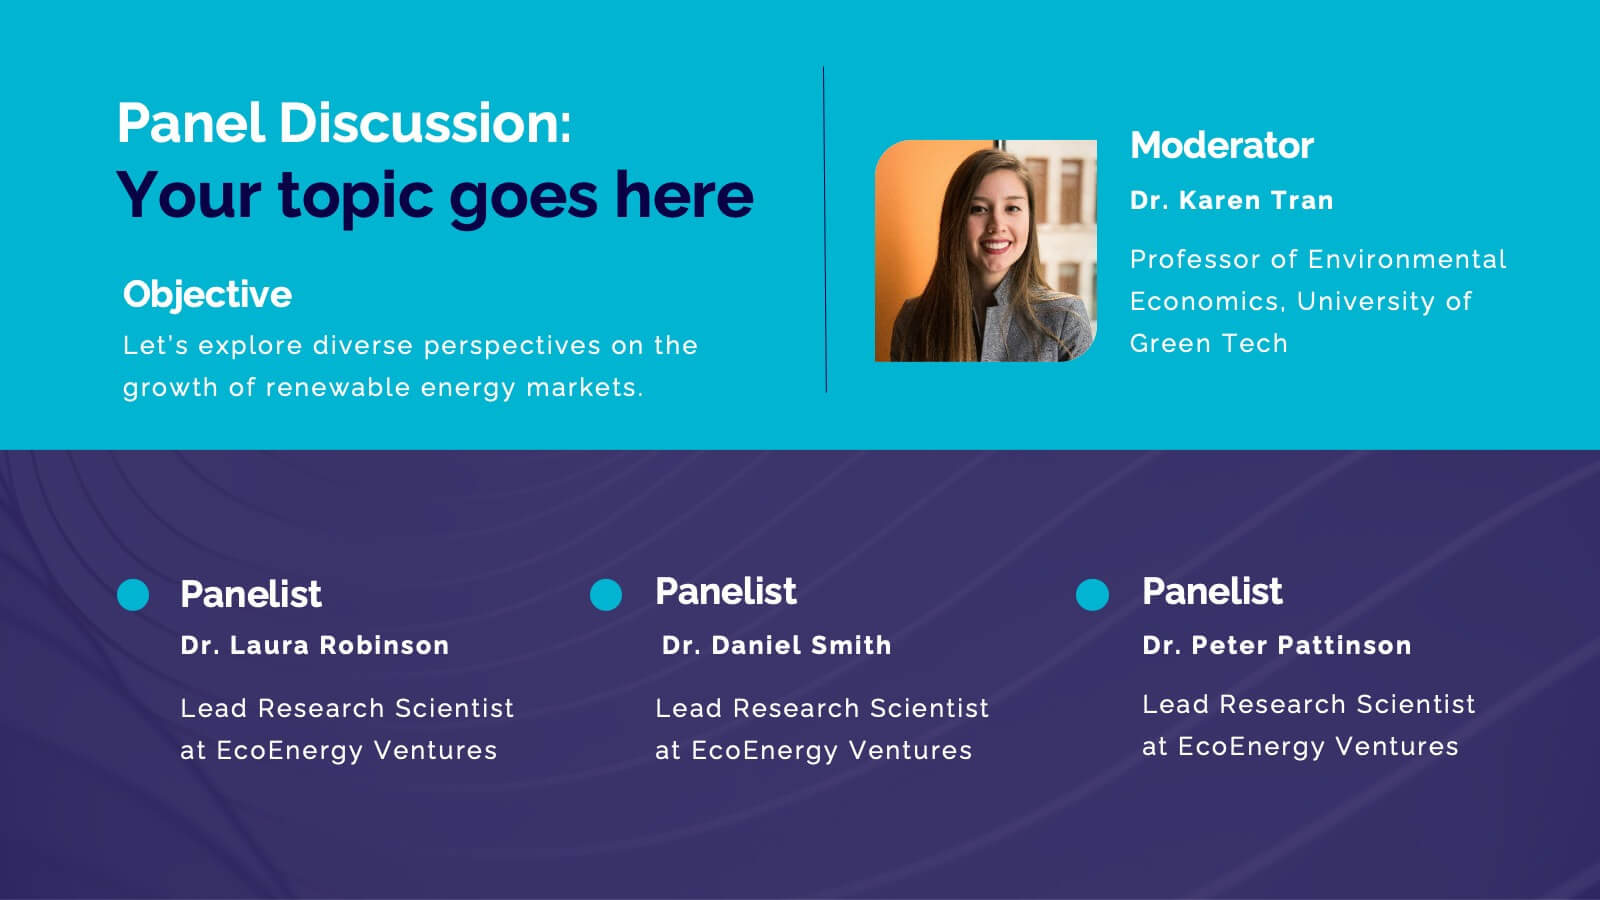
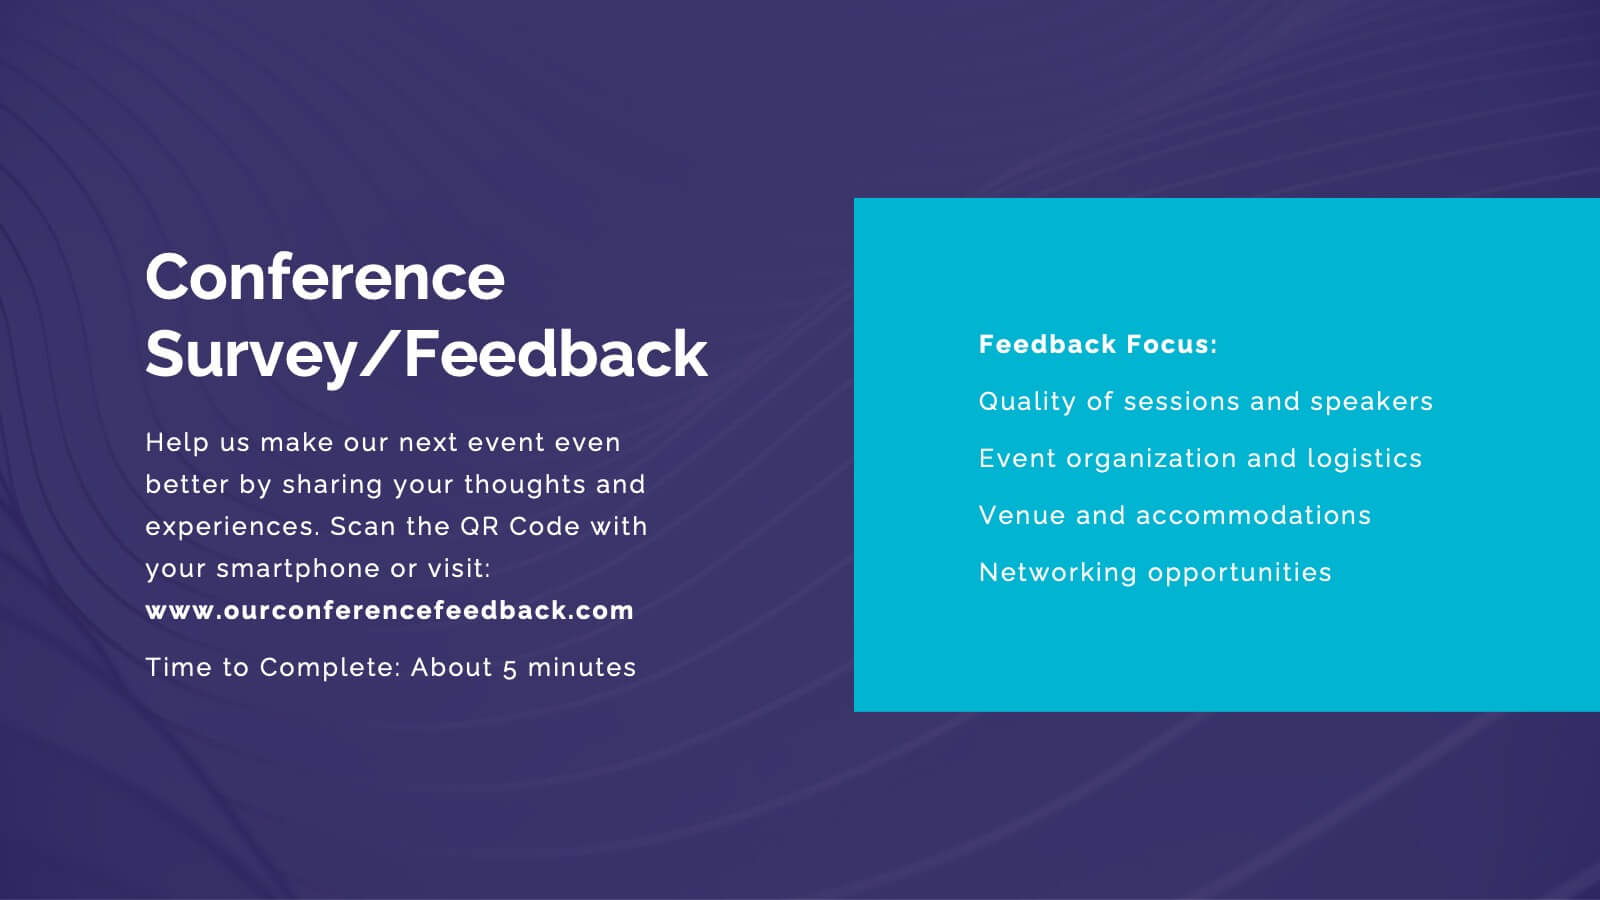
Boost your business presentations with this vibrant, professional template designed for business development proposals. Perfect for detailing conference overviews, themes, objectives, and keynotes, it features a clean and engaging layout. Highlight critical sessions and networking opportunities to captivate your audience. Compatible with PowerPoint, Keynote, and Google Slides, it ensures seamless presentations on any platform.


8 diapositivas
Geographic Heat Map Analysis Presentation
Bring your data to life with a vibrant map that instantly reveals regional patterns and performance differences. Ideal for presenting location-based insights, sales metrics, or demographic trends, this presentation combines clarity with visual impact. Fully compatible with PowerPoint, Keynote, and Google Slides for easy editing and professional results.


6 diapositivas
Business Strategy Wheel Model Presentation
Present your key strategic components in a clear, circular layout with this wheel model template. Ideal for outlining interconnected steps, departments, or initiatives, this design allows you to visualize all six elements of your strategy at once. Fully customizable in PowerPoint, Keynote, and Google Slides.


26 diapositivas
Building Community Networks Presentation
Strengthen connections and foster collaboration with this engaging presentation on building community networks. Covering key topics like social engagement, resource sharing, grassroots initiatives, and digital networking, this template helps highlight strategies for creating meaningful relationships. Fully customizable and compatible with PowerPoint, Keynote, and Google Slides for a seamless and impactful presentation experience.


26 diapositivas
Boost Presentation Template
Our Boost Crossfit Gym Presentation is a great template for getting your target audience motivated. With it, you can create an attractive and informative presentation that contains the most relevant information about your business. This template has an appealing design that will help you convey your message in a professional and interesting way. Our template comes with a ton of customizable sections, which will help you achieve all your presentation goals. You can easily customize this template to match your brand, add some unique header slides and get your own unique style going!


6 diapositivas
Value Chain Optimization and Analysis
Highlight each step that powers your business with this clean and modern value chain template. Ideal for mapping processes, identifying improvement areas, and aligning strategy with operations, this layout makes analysis simple and visual. Fully compatible with PowerPoint, Keynote, and Google Slides.


21 diapositivas
Cineris Product Roadmap Presentation
Present your product vision and strategy with this professional and modern product roadmap presentation template. Covering key aspects such as product overview, features, competitive analysis, pricing strategy, and production process, this template helps you communicate your plan effectively. Designed for easy customization, it’s perfect for internal team alignment, stakeholder presentations, and strategic planning. Compatible with PowerPoint, Keynote, and Google Slides.