


Características


¿Tienes alguna pregunta?
Recomendar


7 diapositivas
Union Venn Diagram Infographic
Venn Diagrams are a great way to display your data in an organized, aesthetically pleasing way. This infographic template is perfect for any presentation that requires a Venn Diagram. This template is designed to visually demonstrate the impact of your company's efforts. Use this to show how different teams work to achieve goals, or how different departments work together to create something new. Compatible with Powerpoint, Keynote, and Google Slides. This infographic uses a cool, bold color scheme and fun imagery to show the relationship between two or more sets of data in a way that will help you easily explain it to your target audience.


5 diapositivas
Global Nonprofit Help Infographics
A global nonprofit organization is a type of organization that operates on an international scale and focuses on making a positive impact on a global scale. These vertical infographics focuses on the impact and importance of nonprofit organizations worldwide. This is ideal for showcasing the achievements and goals of nonprofits in addressing various global issues, such as poverty, healthcare, and environmental conservation. The infographics include a collection of captivating icons and illustrations related to nonprofit work. These slides allow you to present compelling stories, case studies, and success stories that demonstrate the real-world impact of nonprofit work.


6 diapositivas
Cloud Computing Infrastructure Overview Presentation
Break down complex systems with ease using the Cloud Computing Infrastructure Overview slide. This layout features a central cloud icon with multiple surrounding components, perfect for mapping out services, connections, or infrastructure layers. Fully editable in PowerPoint, Keynote, and Google Slides.


10 diapositivas
Employee Retention and HR Strategy Presentation
Present your HR initiatives with a clean, puzzle-inspired visual in this Employee Retention and HR Strategy slide. This layout features a silhouette icon alongside a 5-step vertical format—each step with its own icon and title box—to illustrate key elements like onboarding, employee engagement, recognition programs, and more. Fully editable and compatible with PowerPoint, Keynote, and Google Slides.


23 diapositivas
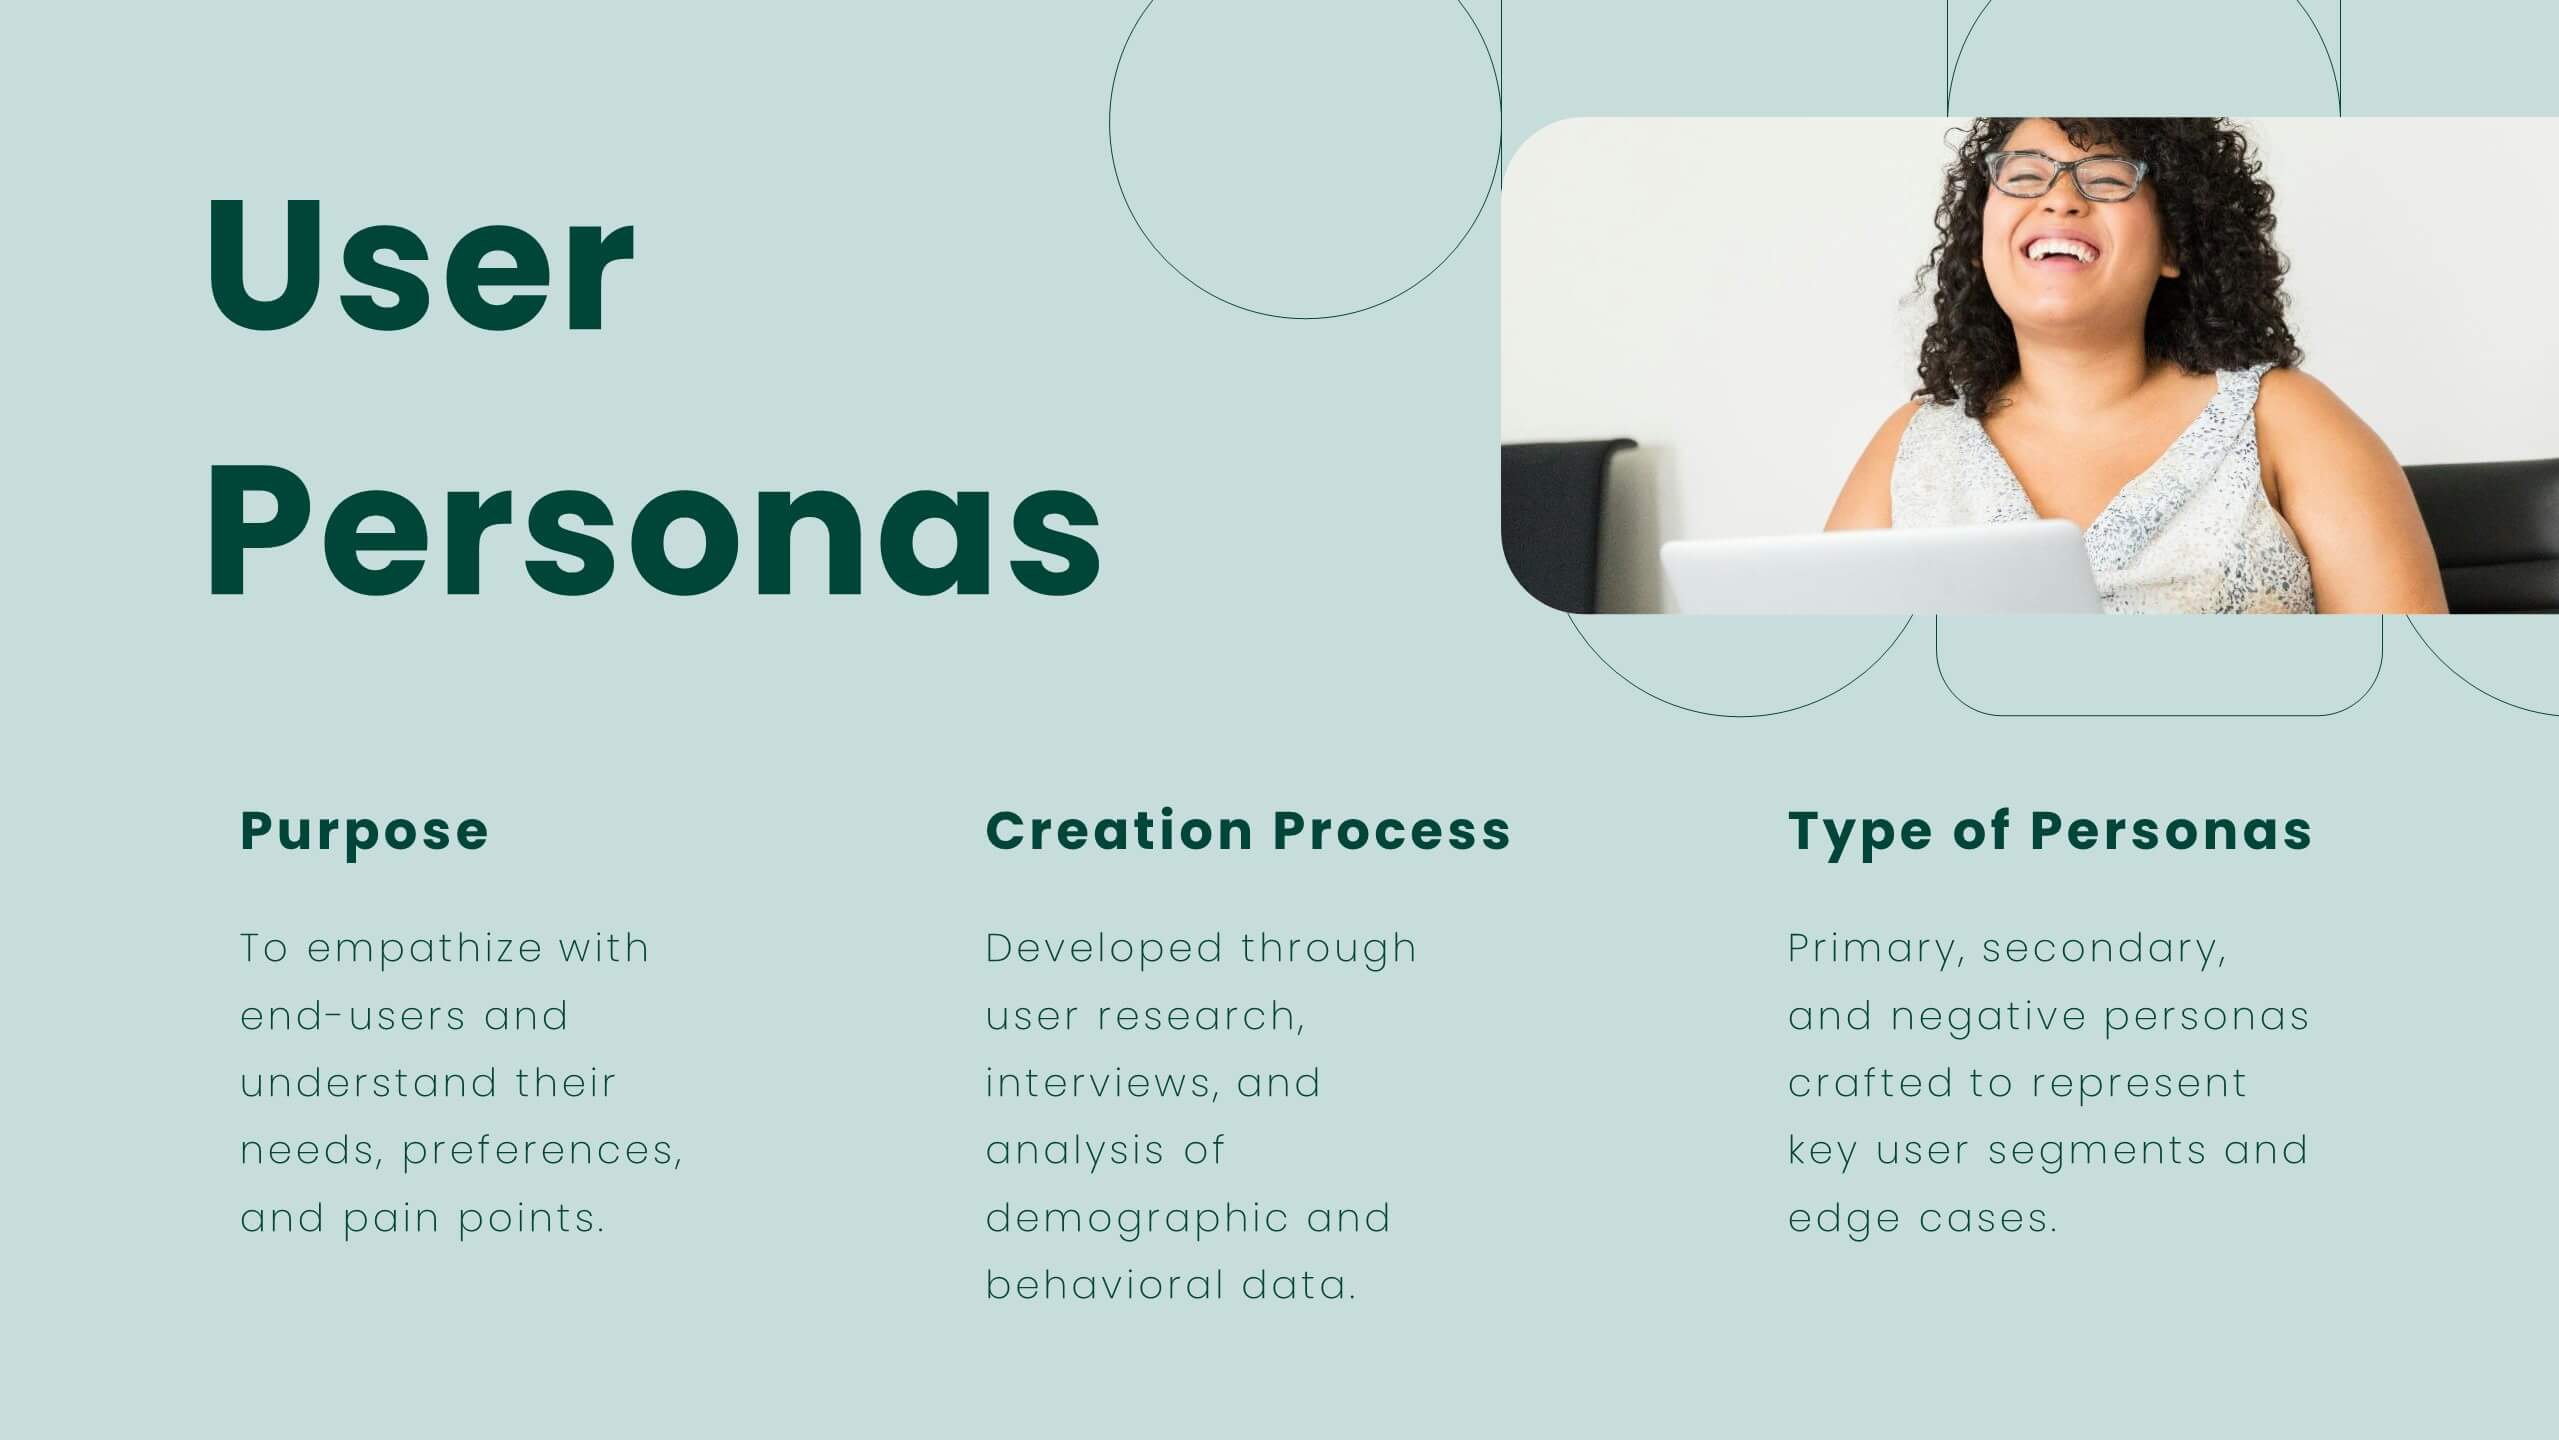
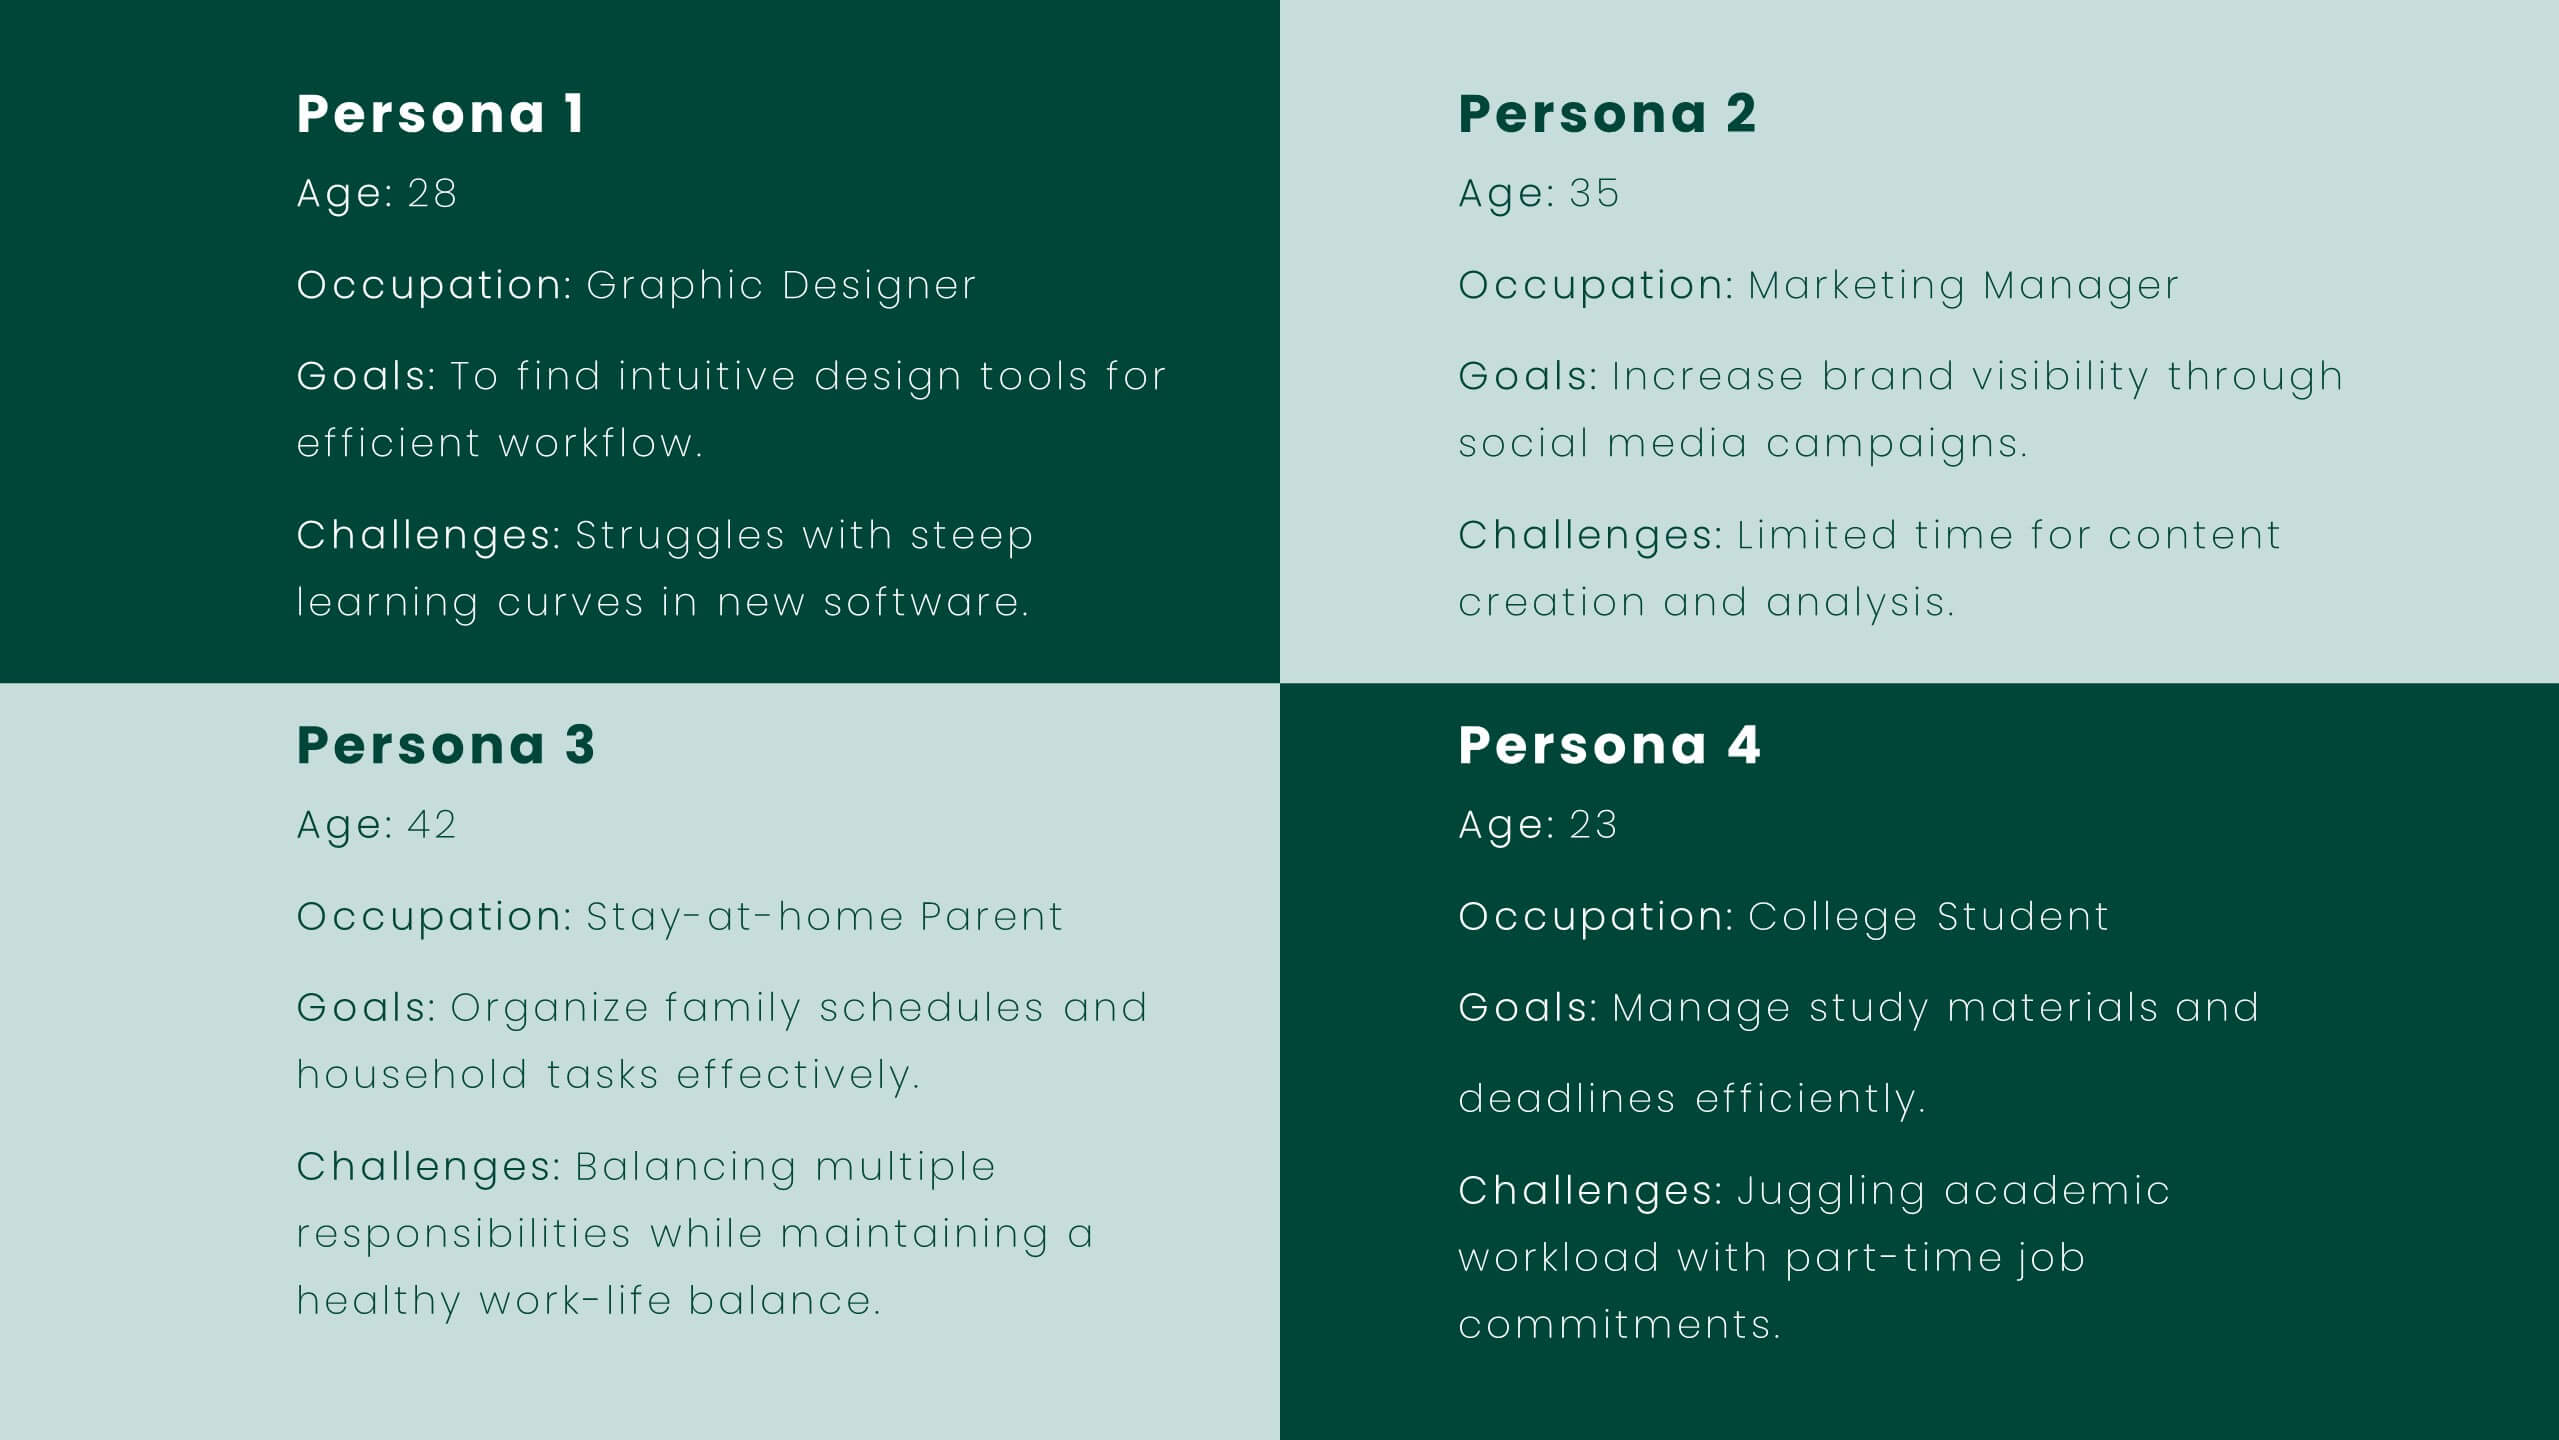
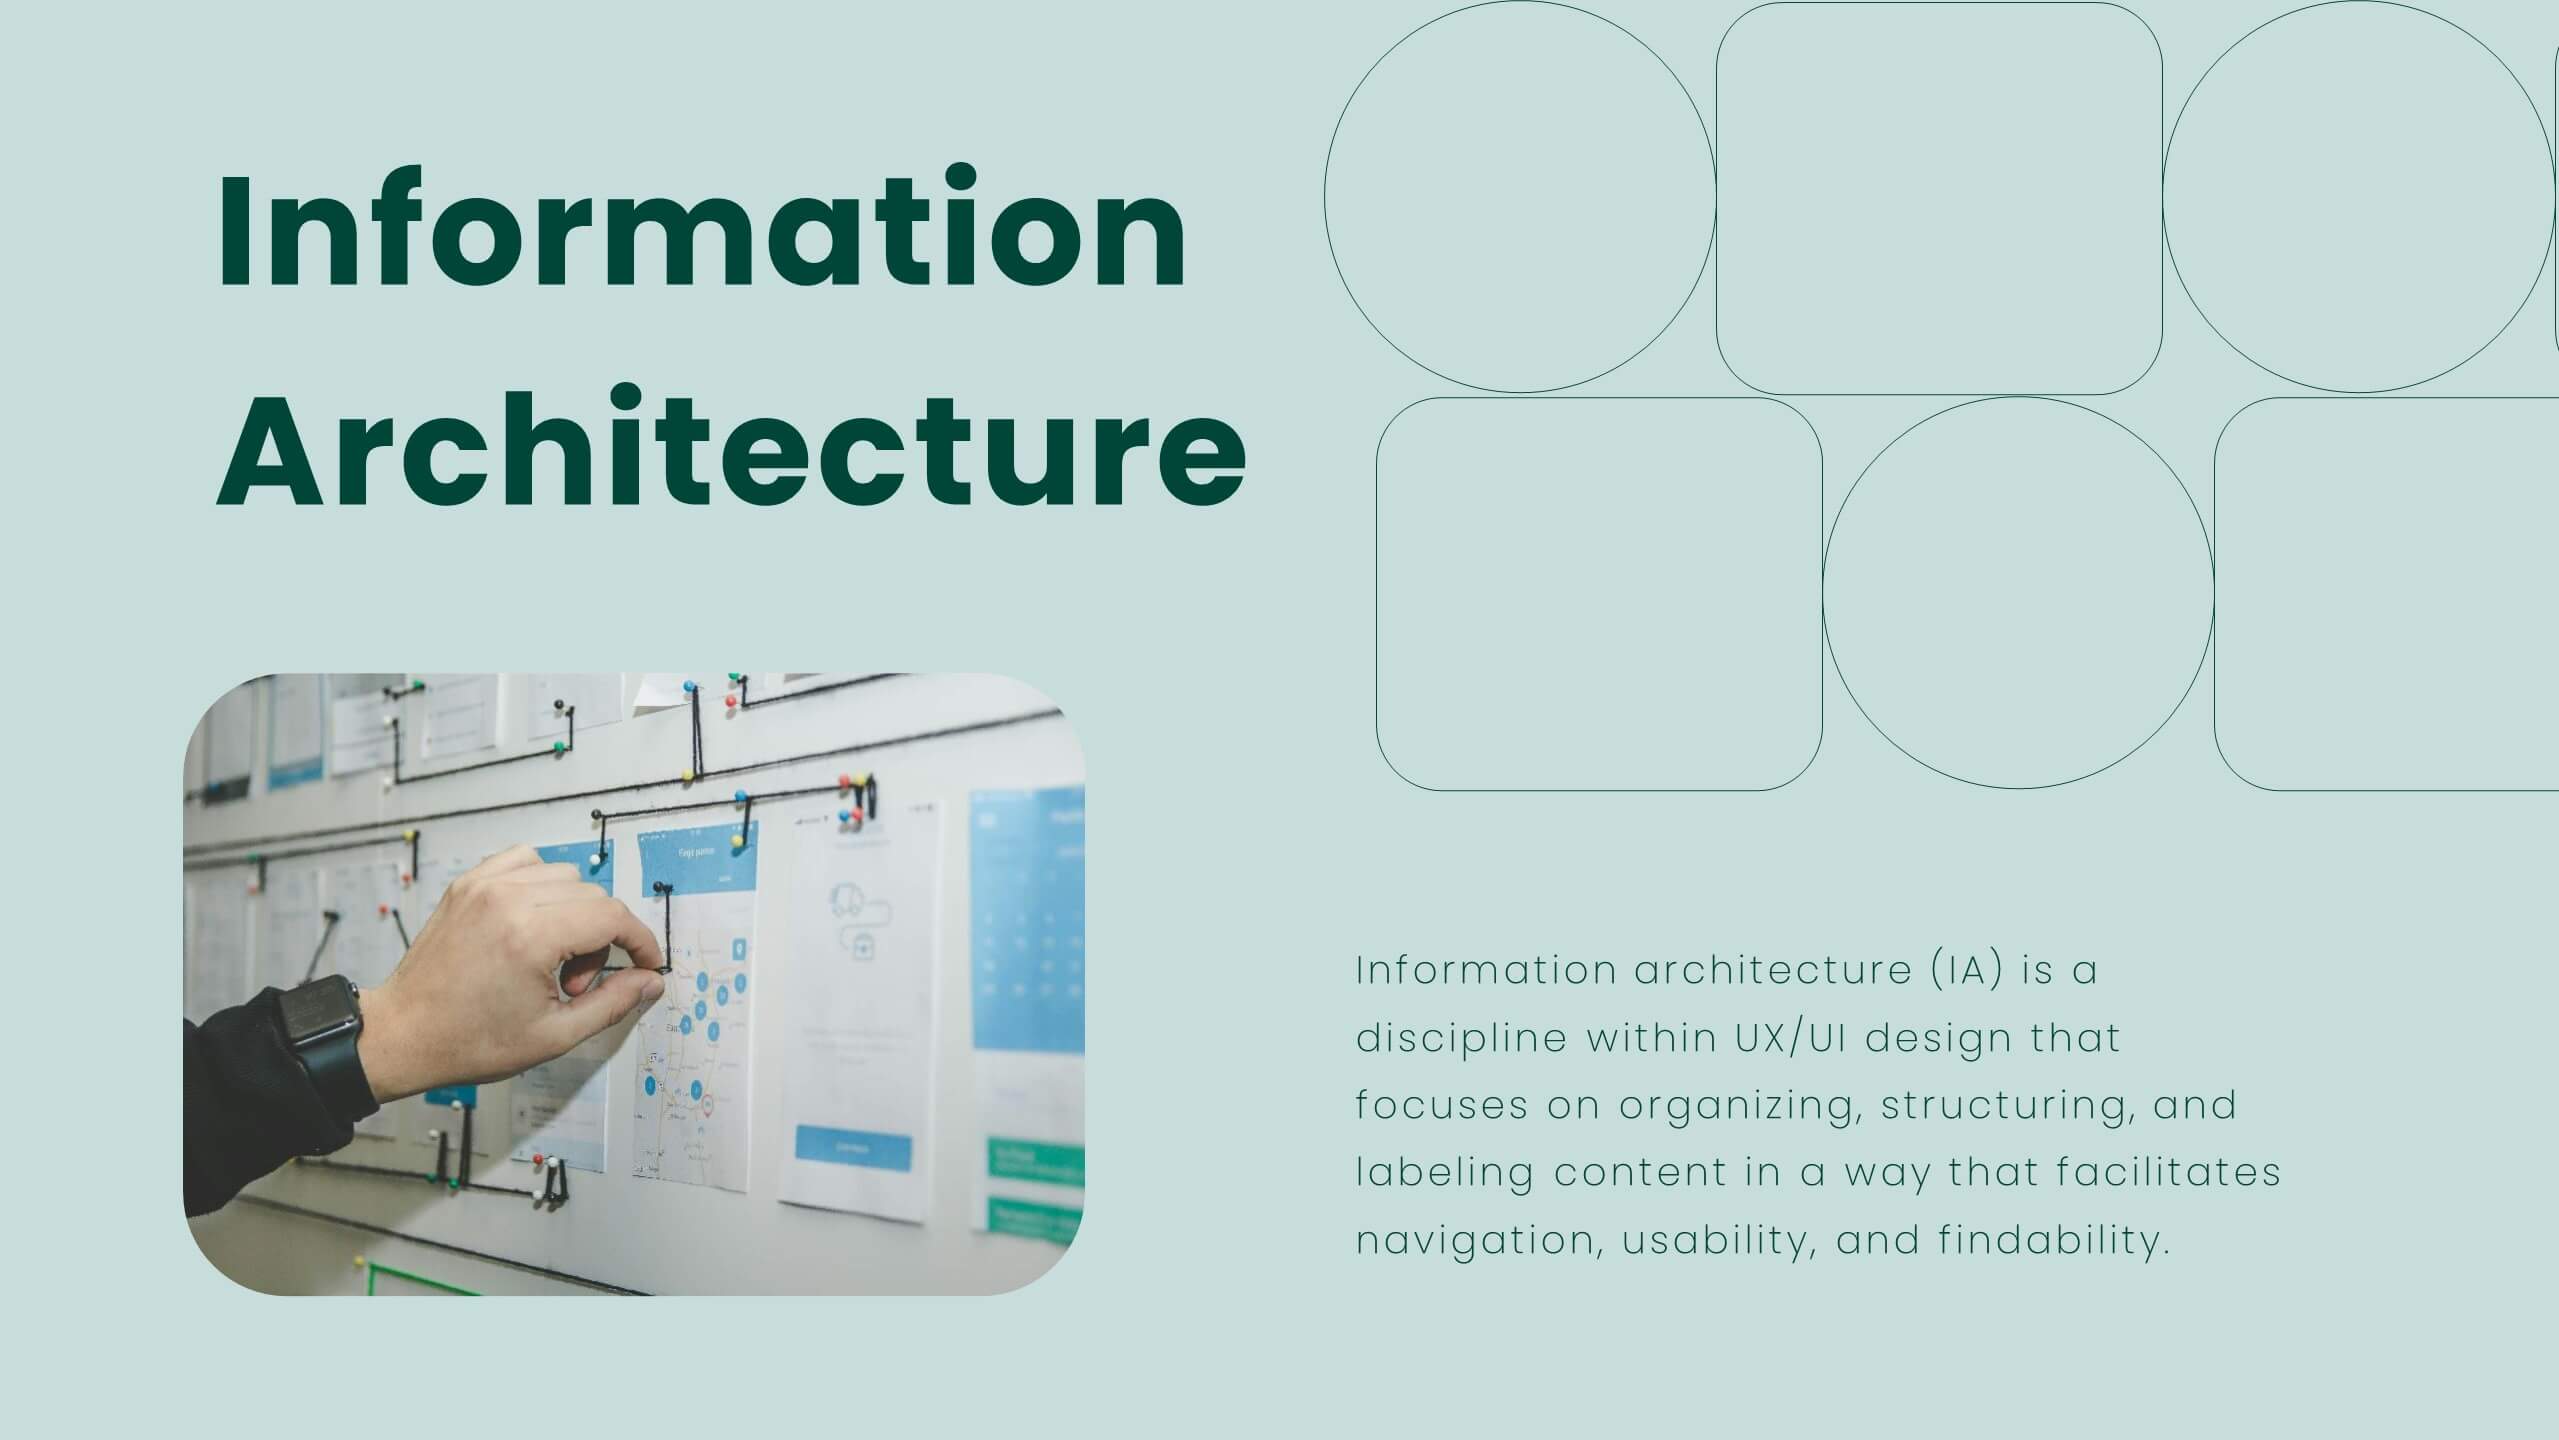
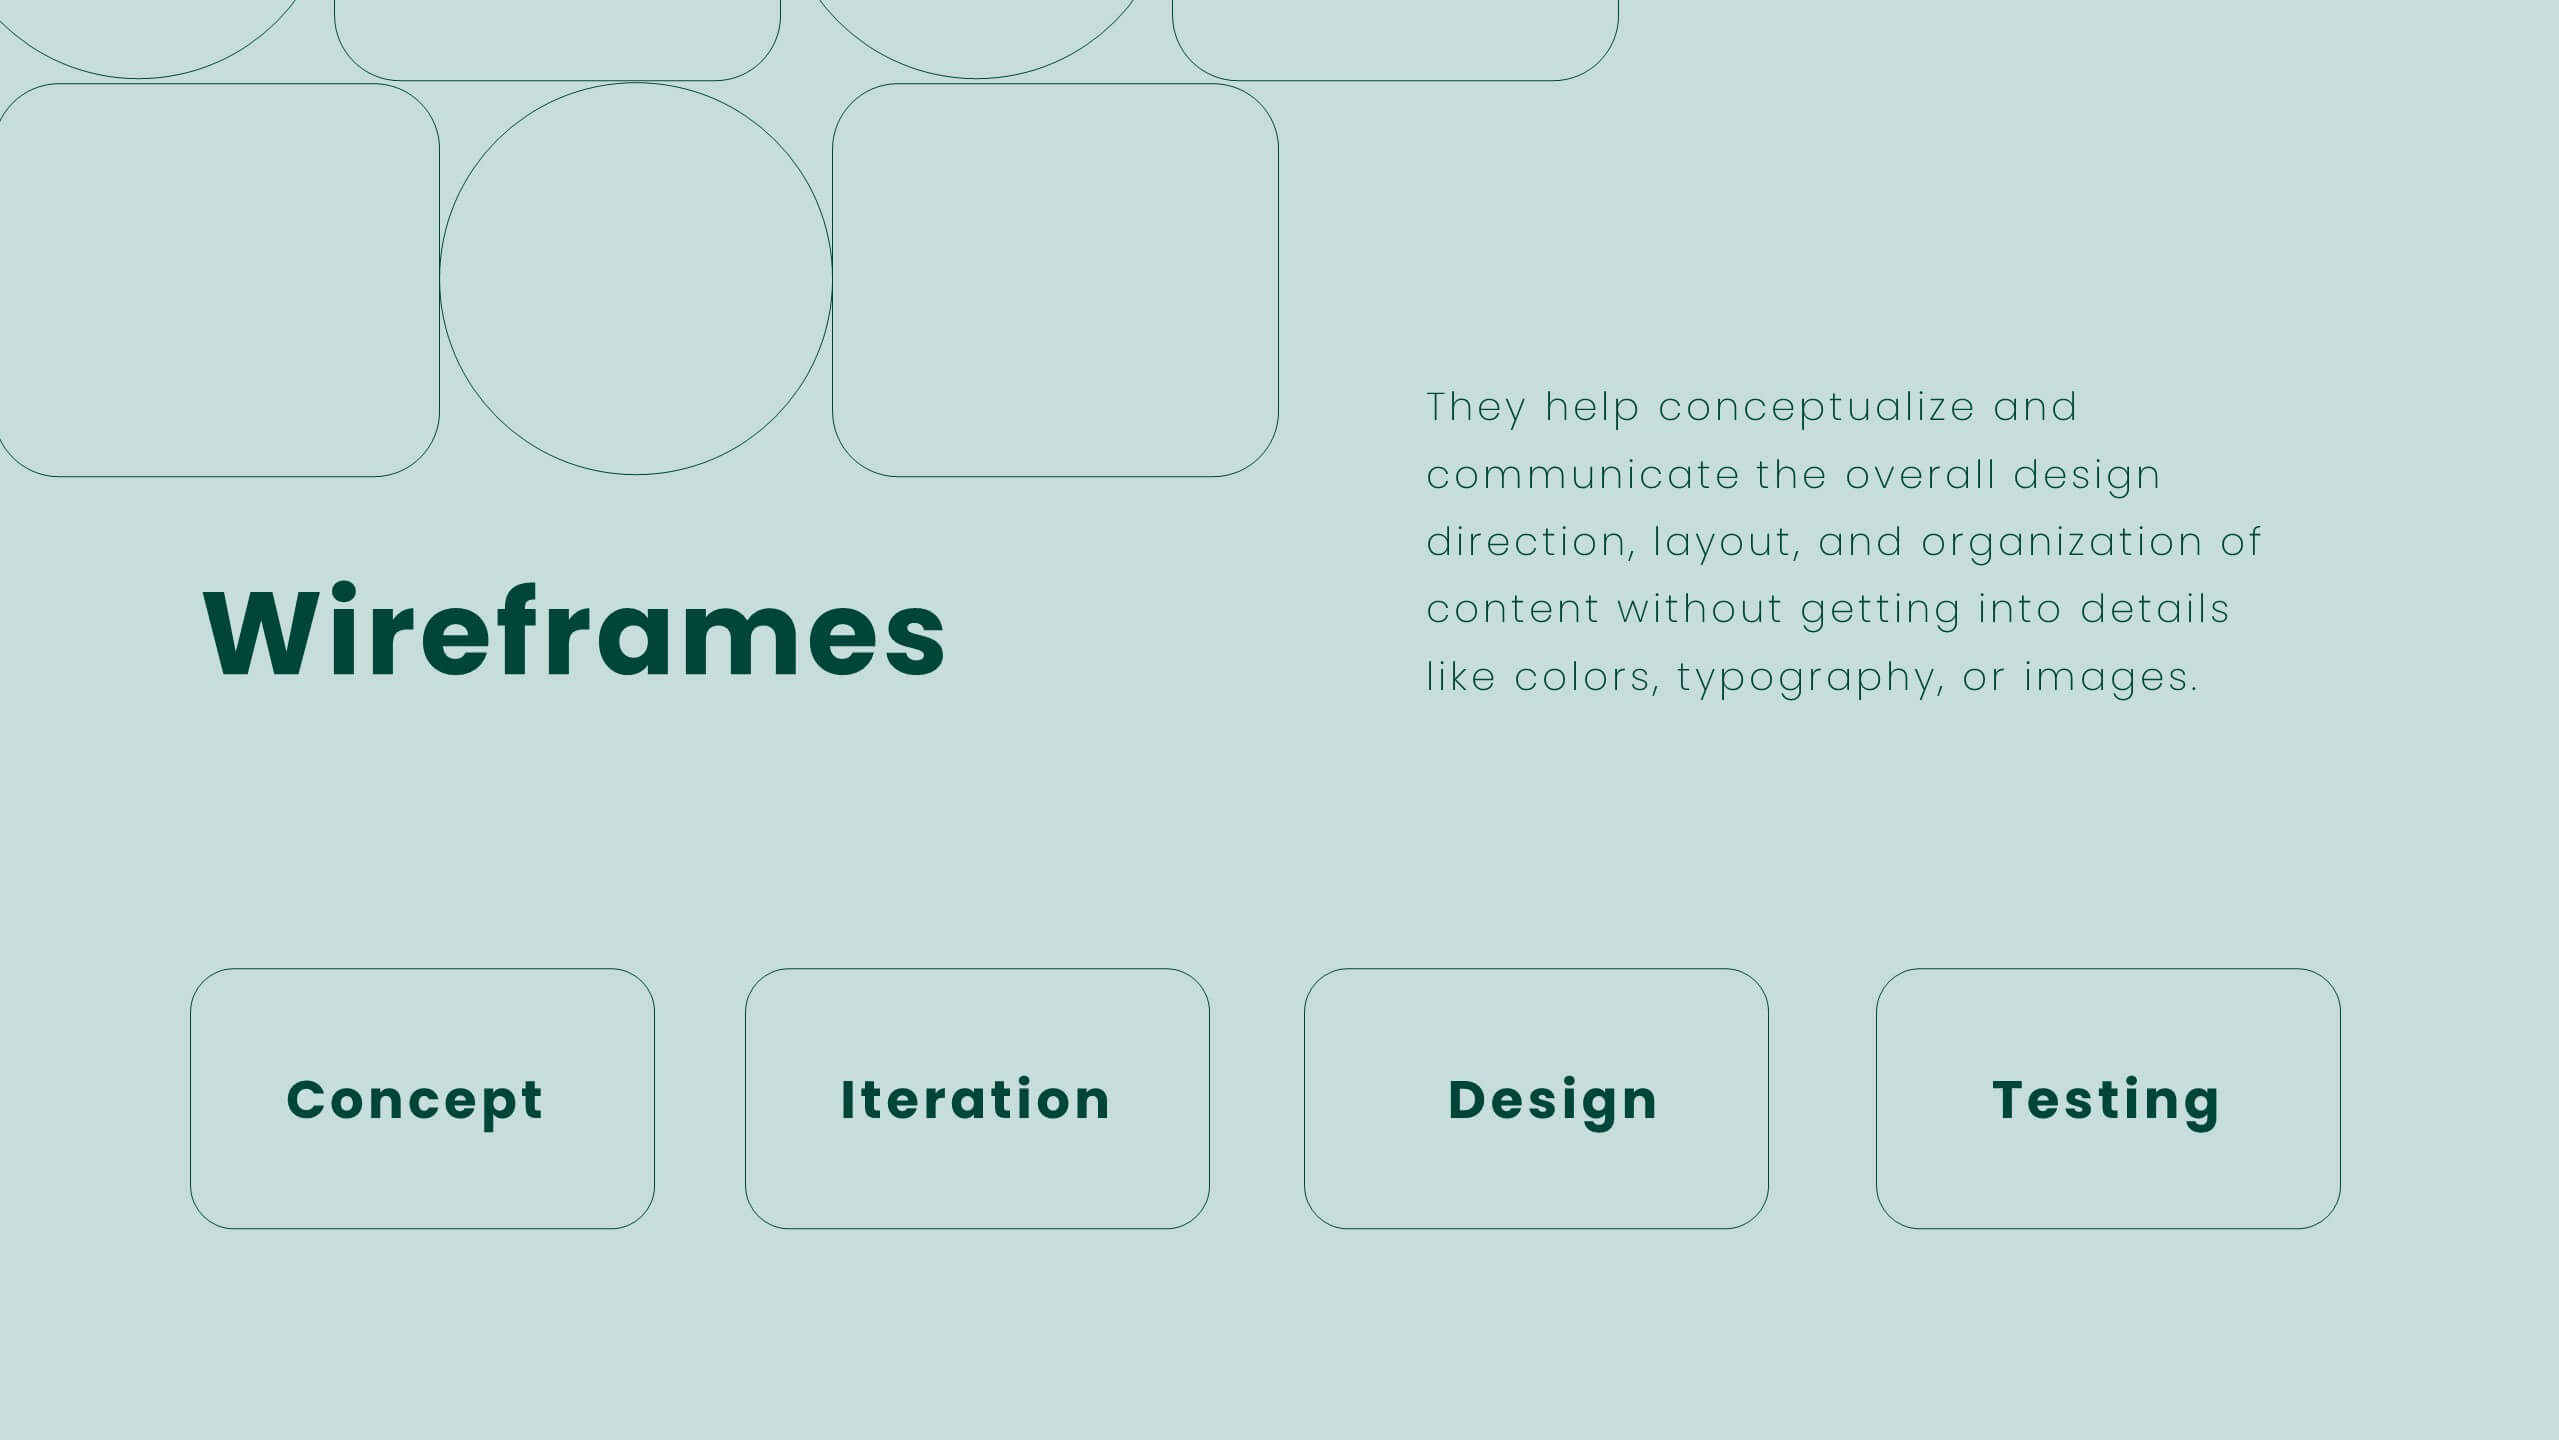
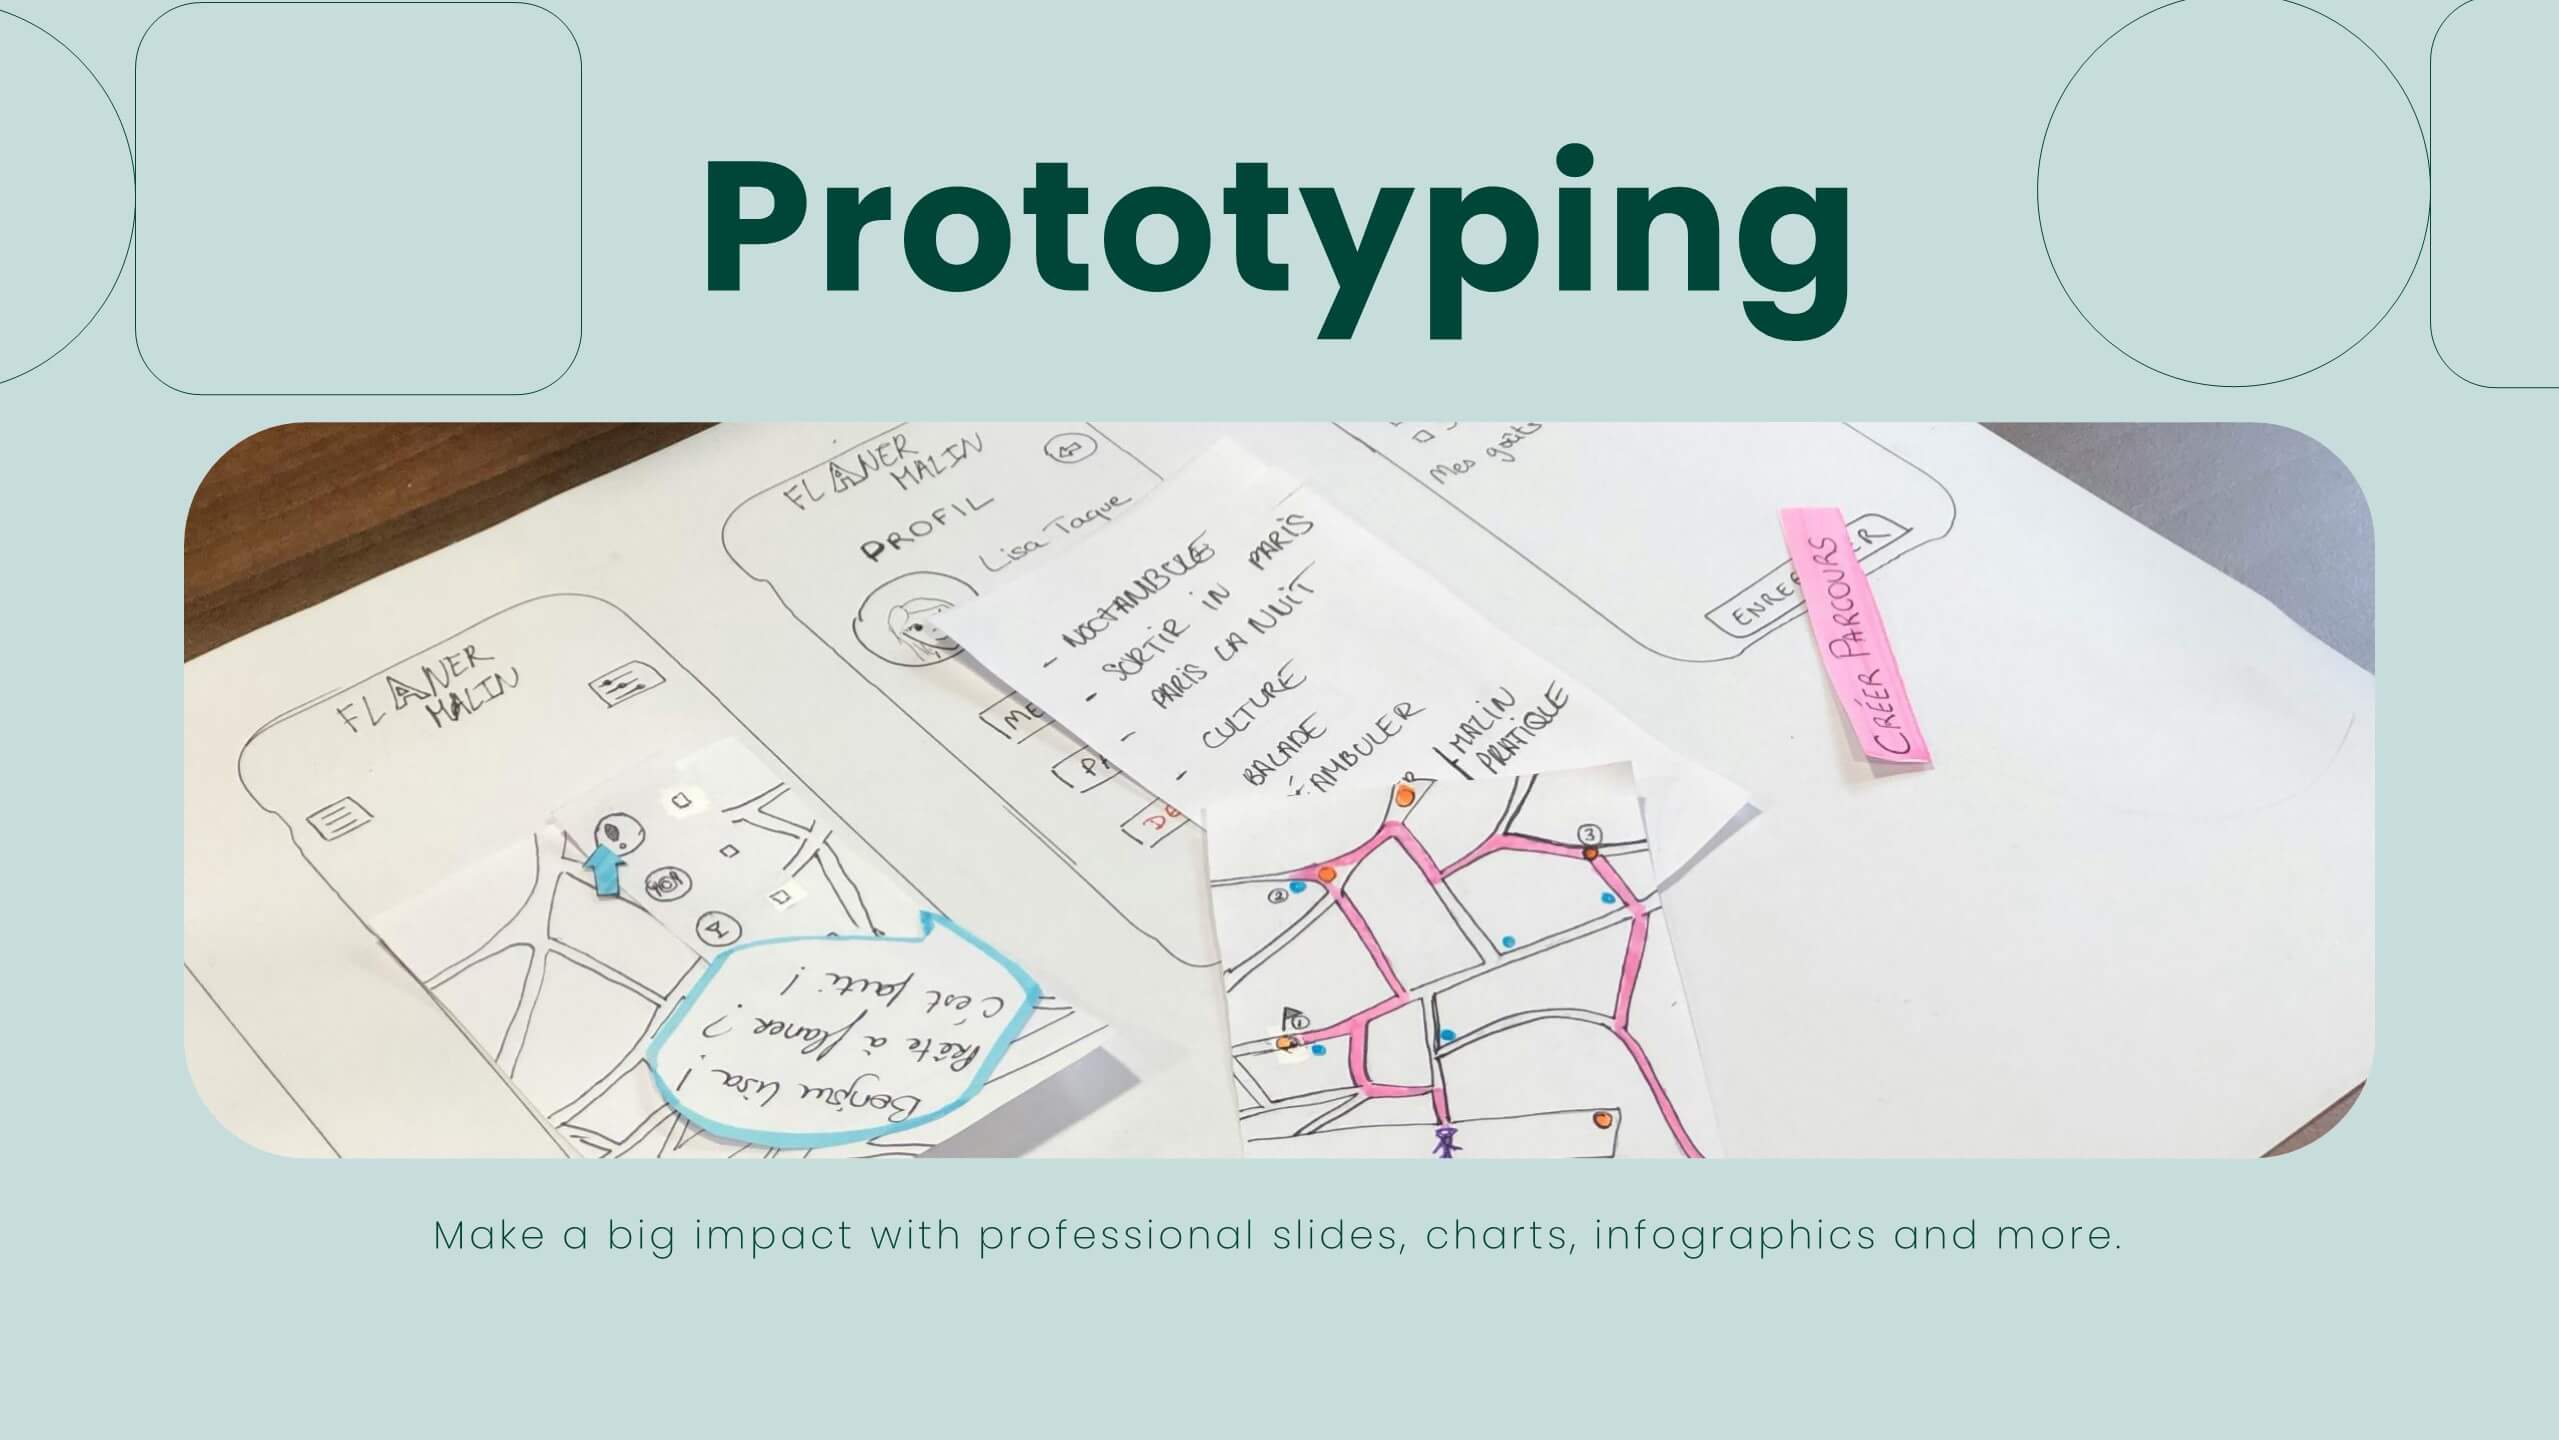
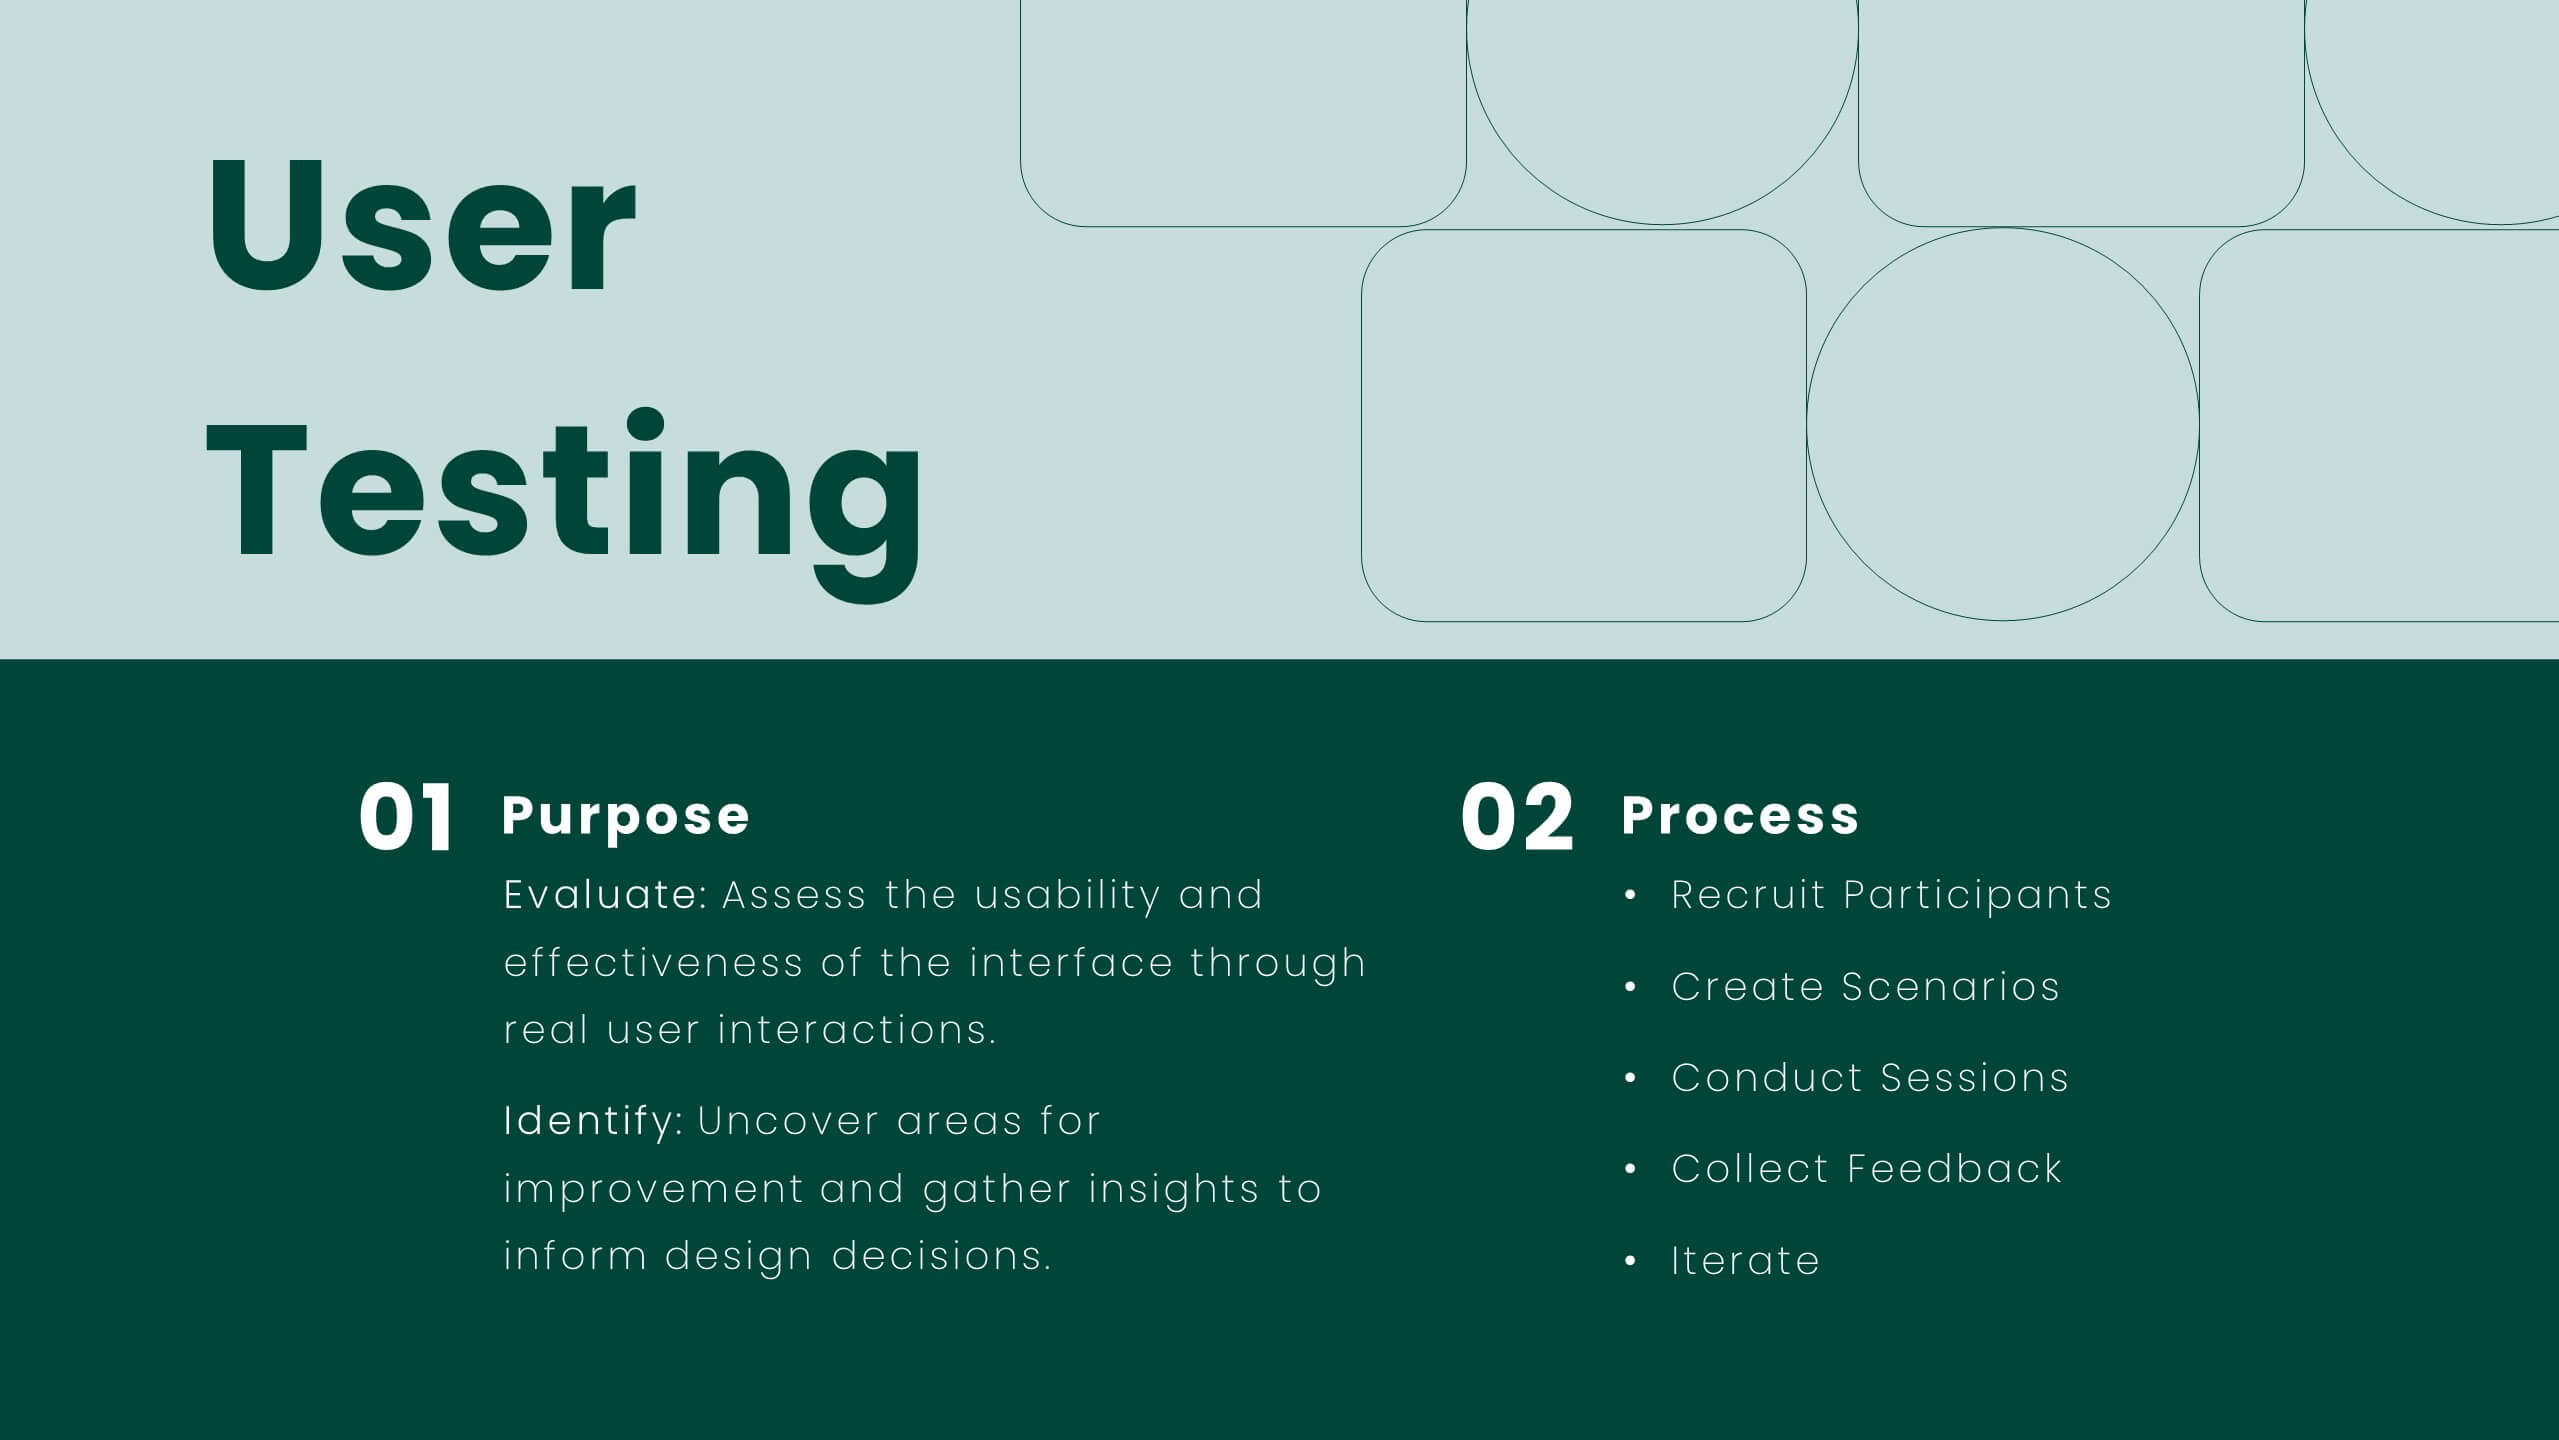
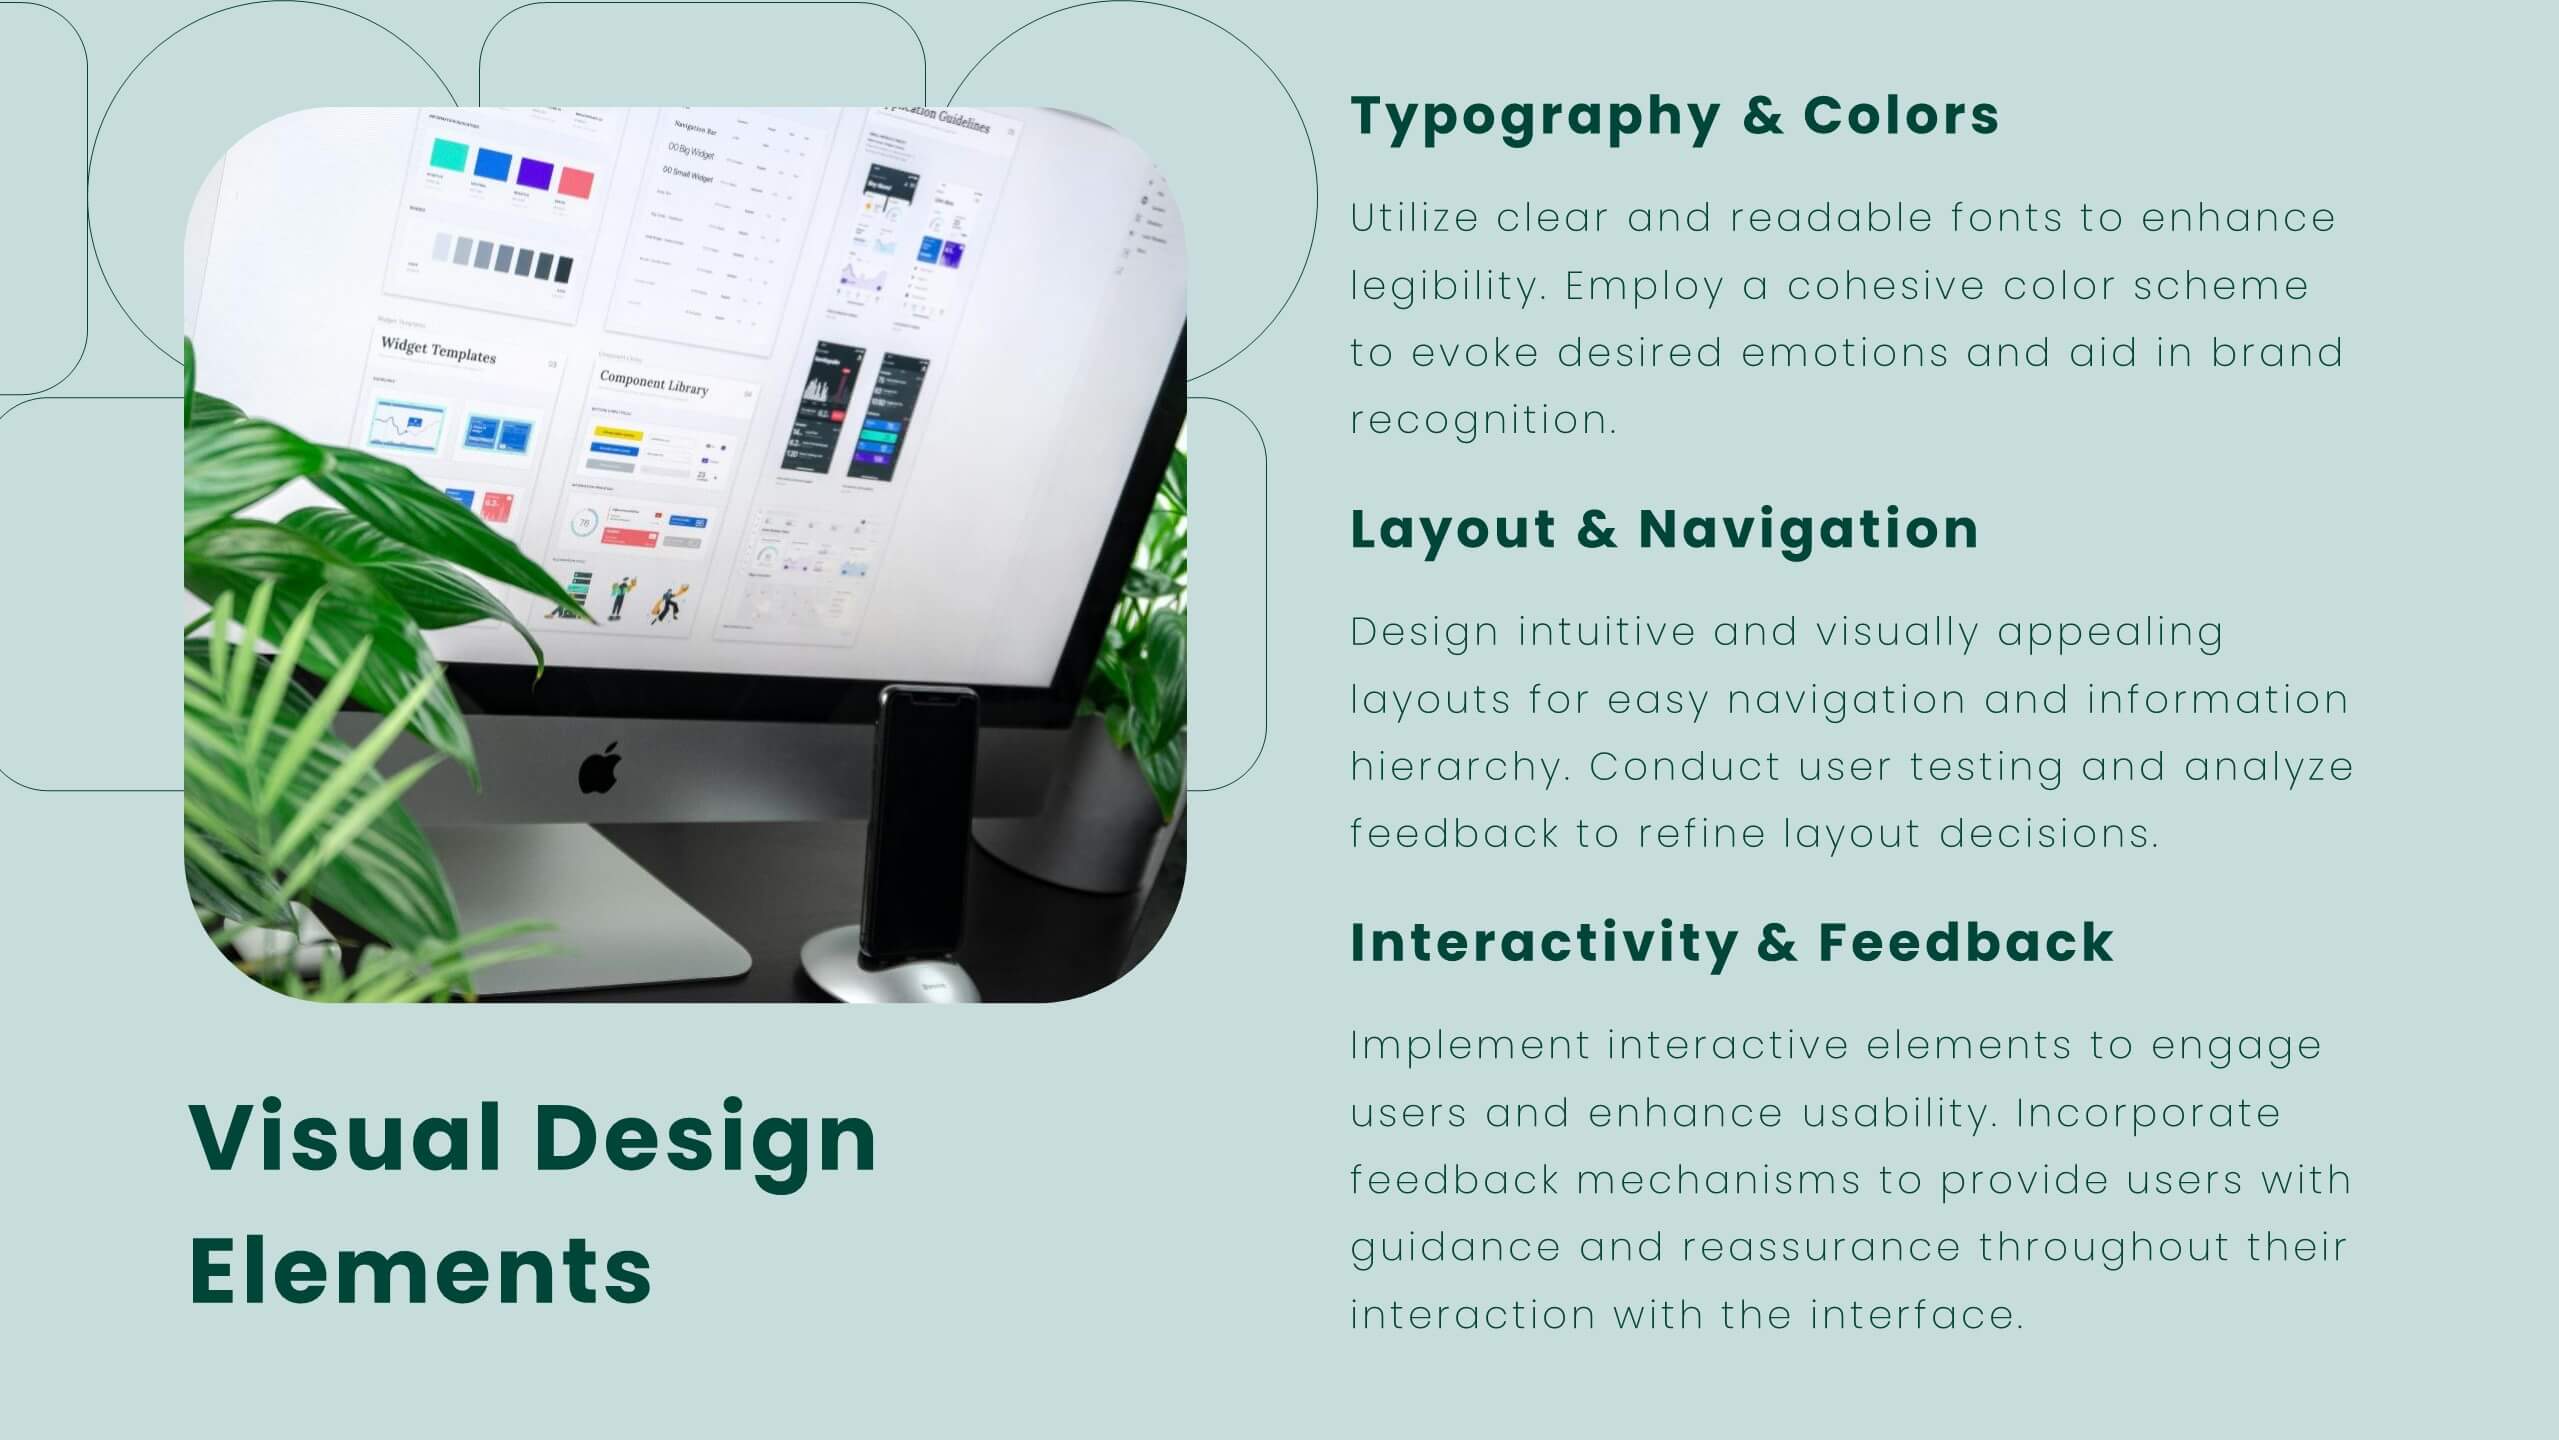
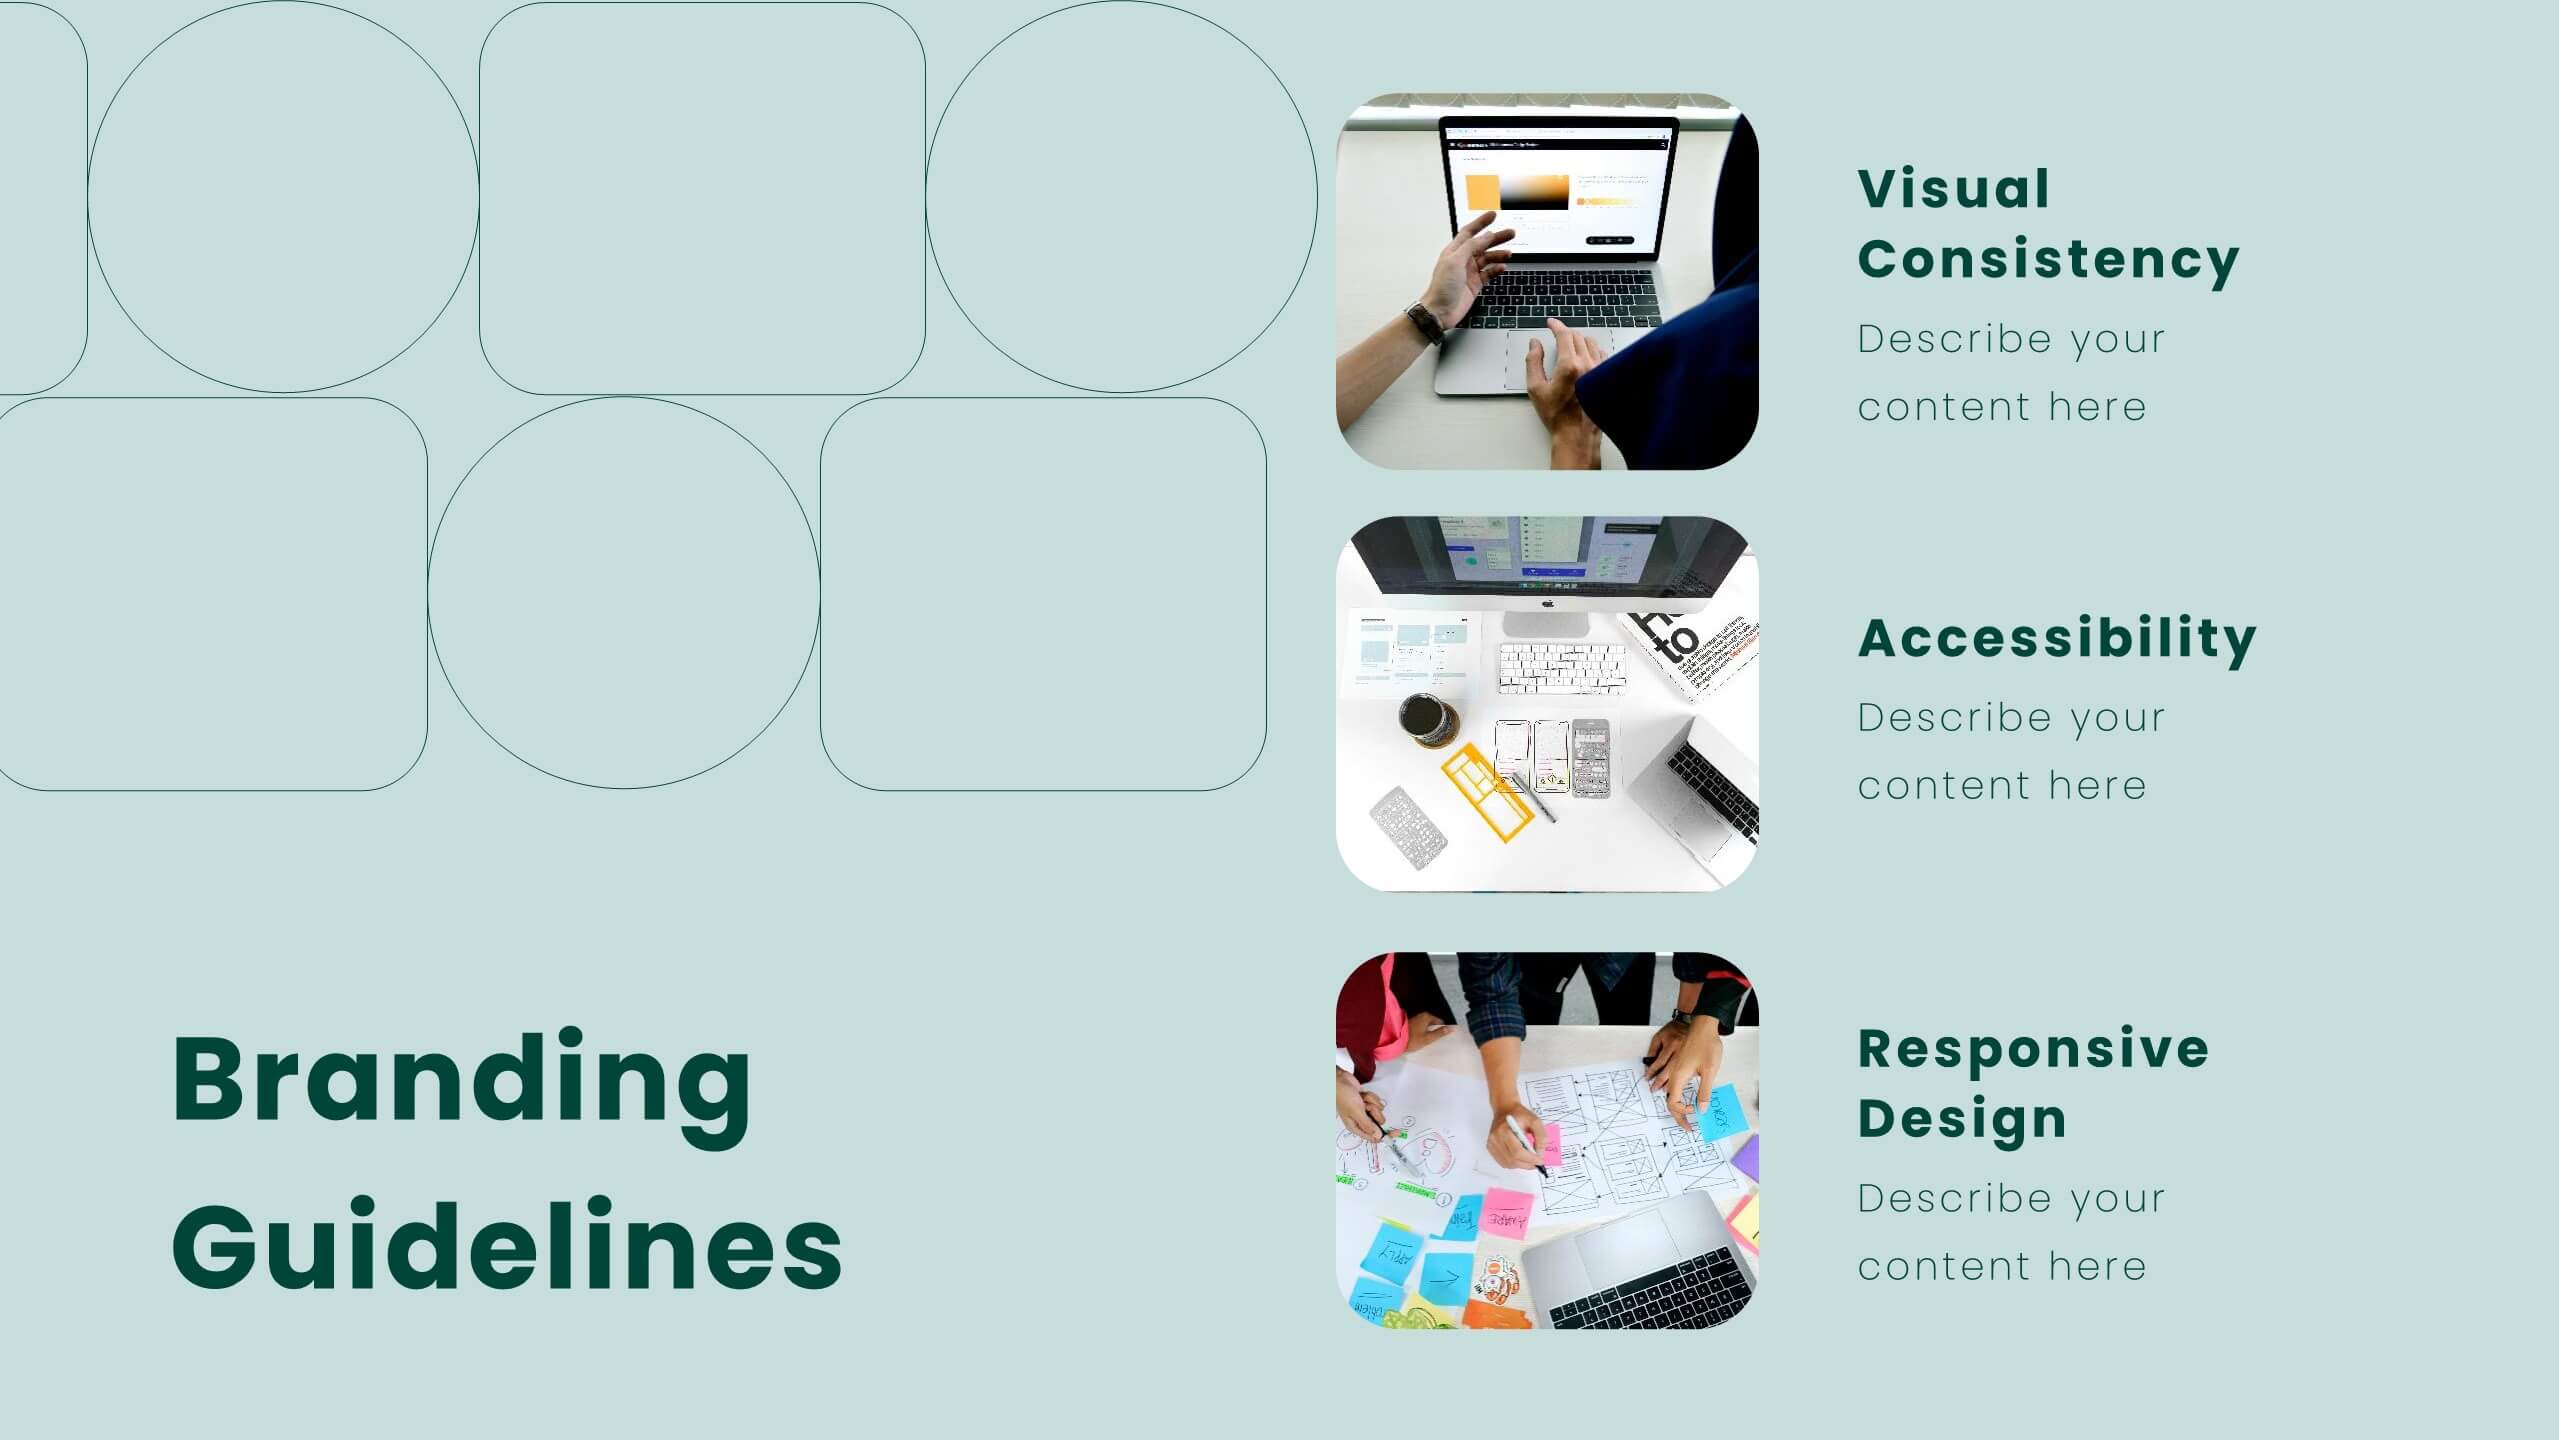
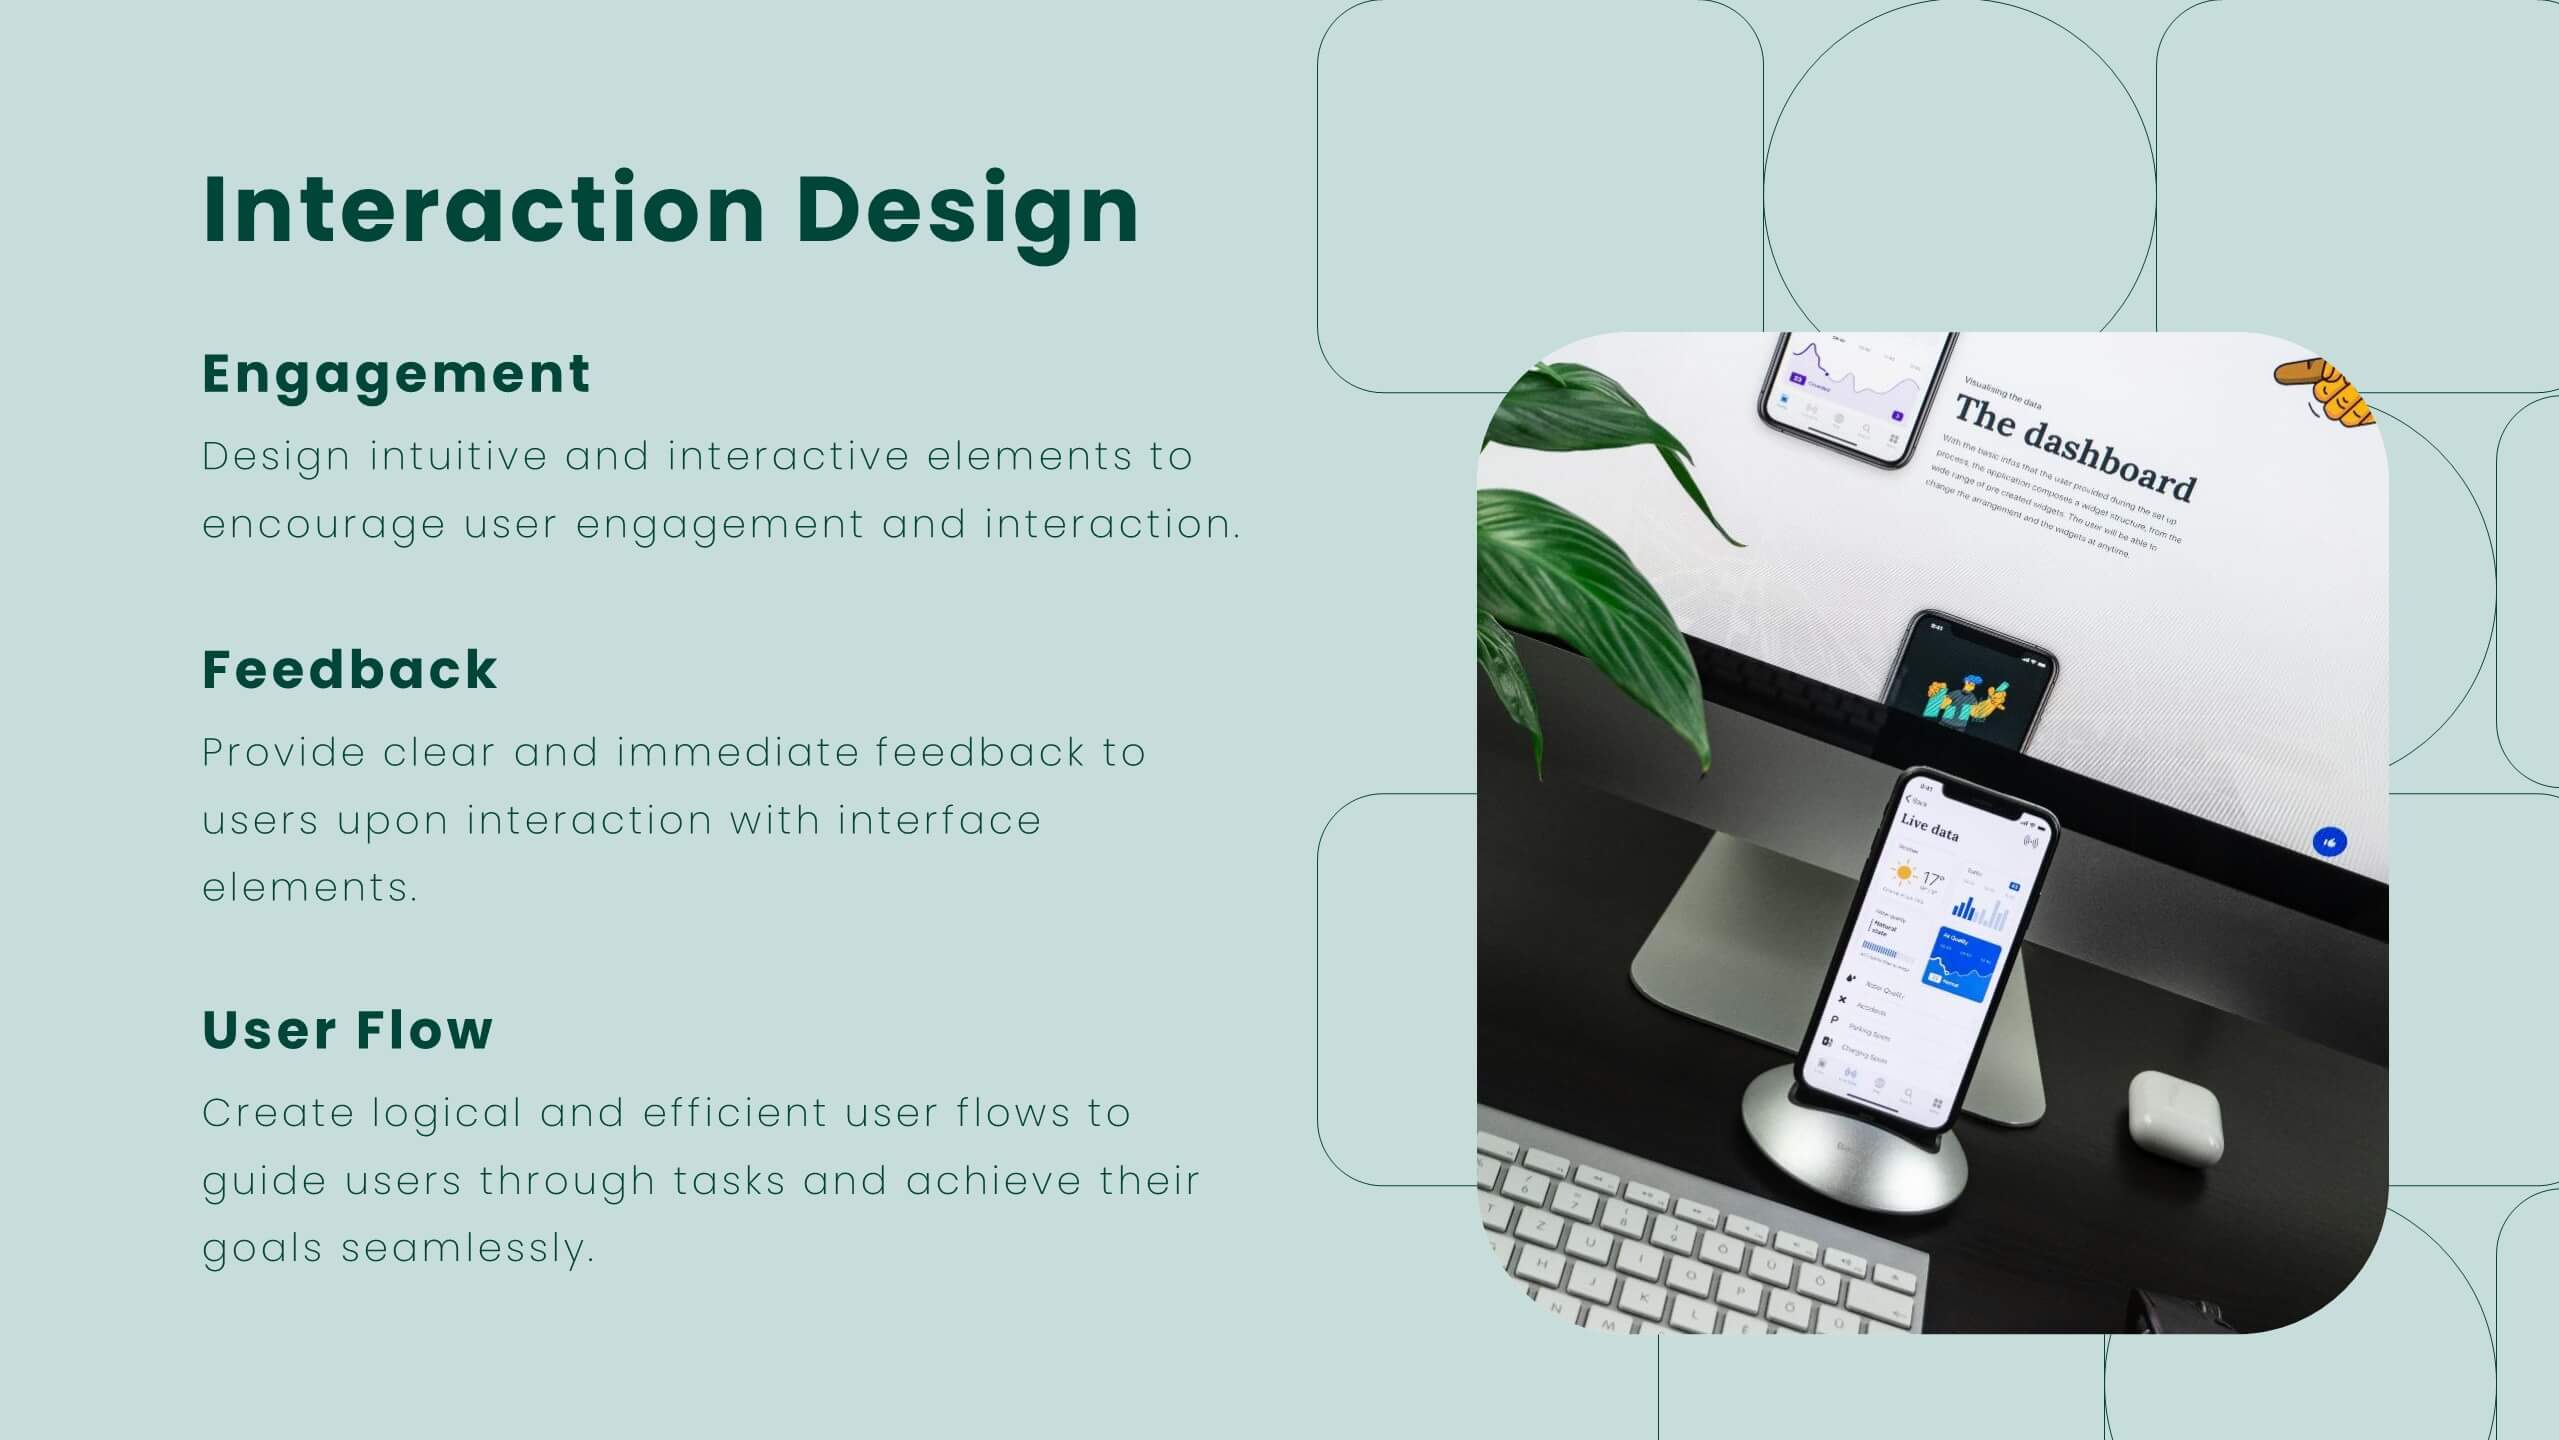
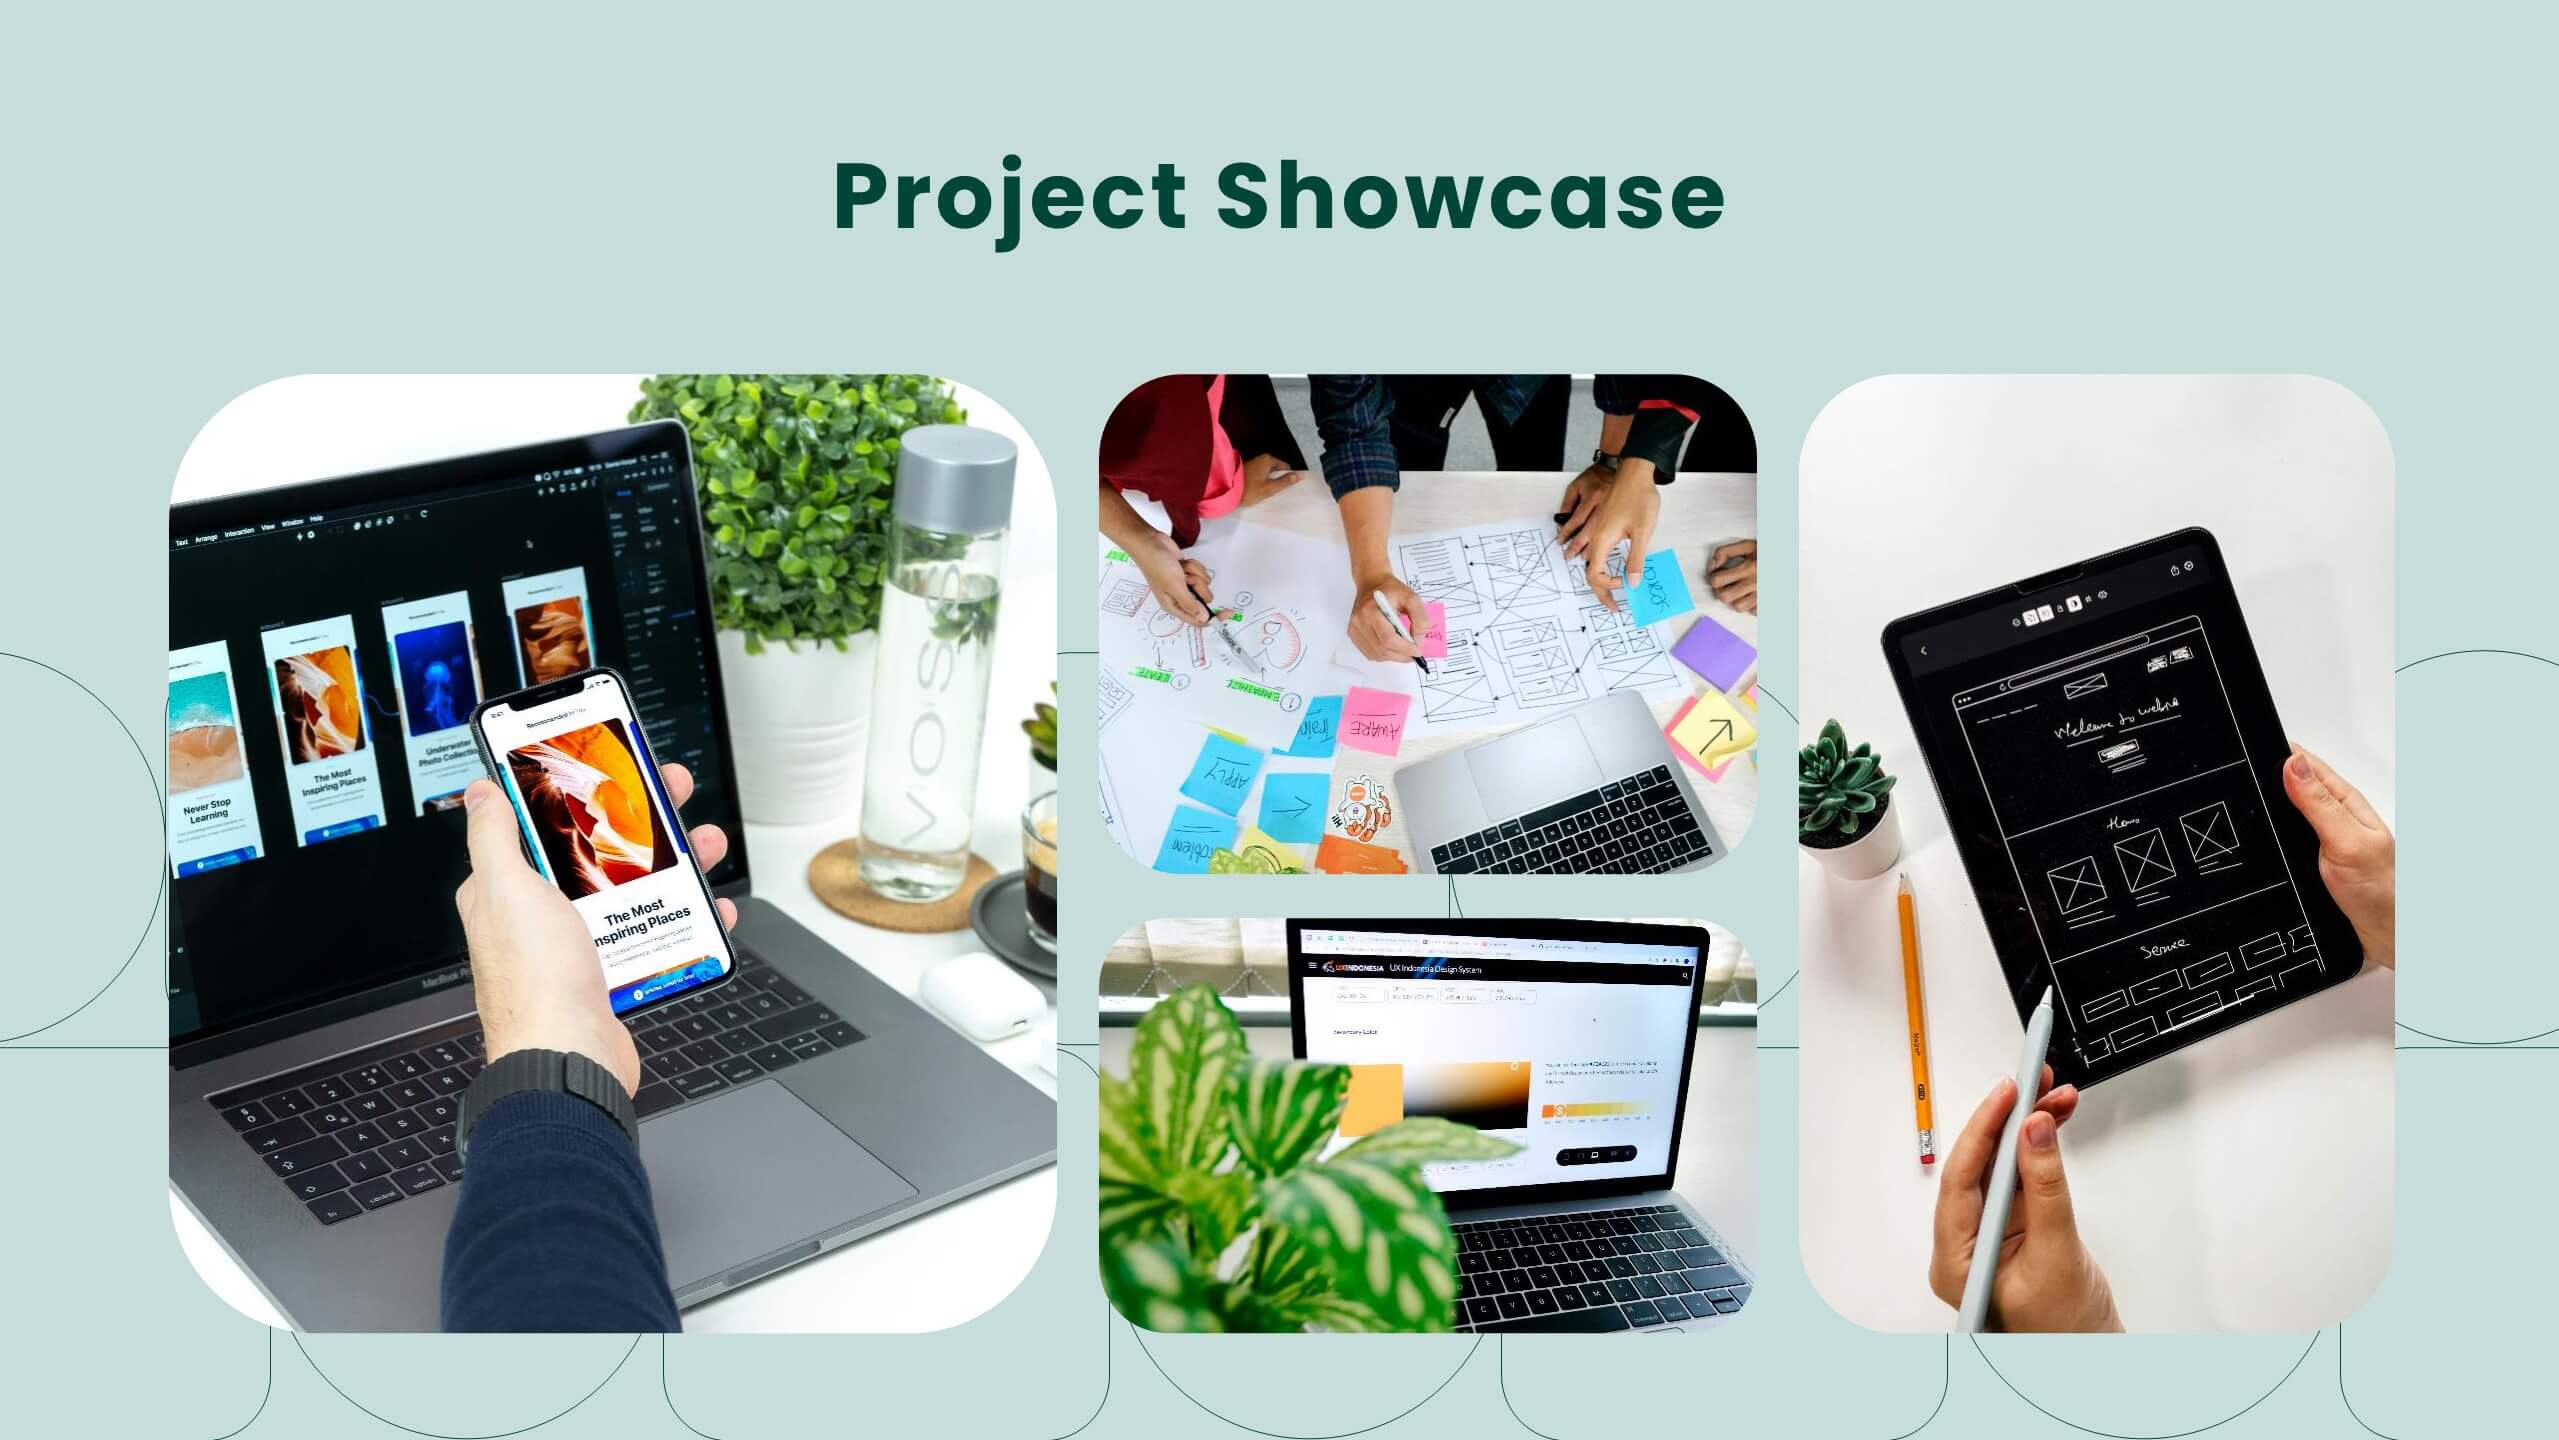
Lumina UX Case Study Presentation
Create compelling UX case studies with this modern template. Cover user research, personas, wireframes, and prototyping. Perfect for showcasing UI design principles, responsive design, and usability guidelines. Highlight feedback, iteration, and project showcase. Compatible with PowerPoint, Keynote, and Google Slides. Elevate your UX presentations and impress stakeholders with clear, detailed insights.


6 diapositivas
Education and Learning Strategy Presentation
Enhance educational planning with the Education and Learning Strategy Presentation template. This structured and visually compelling layout is designed to outline learning initiatives, training programs, and academic strategies effectively. Ideal for educators, trainers, and institutions, this template ensures clarity and engagement. Fully customizable and compatible with PowerPoint, Keynote, and Google Slides for seamless presentation creation.


26 diapositivas
Remote Work Strategies Presentation
Enhance your team's flexibility with our Remote Work Strategies presentation template, designed for use with PowerPoint, Keynote, and Google Slides. This template is an invaluable asset for team leaders, HR professionals, and business consultants dedicated to cultivating a productive remote work culture. Our template is tailored to provide an in-depth analysis of remote work best practices, offering slides that cover essential strategies for communication, collaboration, and project management in a virtual environment. It also includes insights on setting up a successful home office, maintaining work-life balance, and leveraging technology for seamless remote operations. With customizable elements, you can illustrate the advantages of remote work, share success stories, and provide actionable tips to maximize team efficiency from afar. This template is SEO-optimized to ensure your presentation reaches those seeking to optimize their remote work operations and foster a thriving digital workplace.


7 diapositivas
Watercolor Plan Infographic
A watercolor plan infographic refers to an infographic design or style that incorporates elements of watercolor painting. Dive into the world of dreams and aspirations with our watercolor plan infographic template. This artistic and visually captivating infographic guides you through your plans and goals with the fluidity and creativity of watercolors. This infographic is a visually stunning and inspiring template that transforms the process of goal setting into an artistic masterpiece, encouraging individuals to paint their dreams with vivid hues of determination and creativity.


4 diapositivas
Multi-Stage Process Hexagon Infographic Presentation
Showcase your workflows clearly with the Multi-Stage Process Hexagon Infographic Presentation. This template features a sleek chain of hexagons, ideal for visualizing linear steps, sequential planning, or project phases. Each stage is editable, color-coded, and easy to customize in PowerPoint, Keynote, or Google Slides—perfect for teams, educators, or project managers.


10 diapositivas
Customer Market Segmentation Strategy Presentation
Define and visualize your audience with the Customer Market Segmentation Strategy Presentation. This slide layout helps you categorize customer types using clean iconography and a central persona model. Ideal for marketing teams, sales strategists, or startup pitches. Customize easily in Canva, PowerPoint, Google Slides, or Keynote.


26 diapositivas
Natlea Presentation Template
Need help presenting your next travel destination? This template is a unique and sophisticated way to present your travel destination. The Natlea travel template is a fun, surprisingly sophisticated and easy to use template that allows you to list all the details of your trip. With bold colors, charts, budget slides and venn diagrams this template has it all. It's simple yet fun design makes it stand out and at the same time keep your audience engaged. This is the perfect choice for marketers, tourism professionals or anyone who needs to make a great looking presentation on their next trip.


5 diapositivas
Digital Strategy and Online Campaigns Presentation
Aim for success with the Digital Strategy and Online Campaigns Presentation. This template uses a dynamic target and arrow graphic to represent strategic goals, campaign directions, and marketing focus. Ideal for showcasing KPIs, digital initiatives, and performance insights. Fully customizable in PowerPoint, Keynote, and Google Slides.


4 diapositivas
Real Estate Market Trends
Present housing data and property growth insights with this ascending building chart layout. Perfect for realtors, investors, and market analysts, this template helps visualize real estate performance over time. Fully editable in PowerPoint, Keynote, and Google Slides.


7 diapositivas
Thank You Card Infographic
Celebrate the art of gratitude with this sophisticated collection, perfectly blending contemporary design with a personal touch. Each layout is crafted with aesthetic finesse, featuring subtle color palettes, elegant typography, and thoughtful placement of visual elements that enhance the warmth of your message. Offering a variety of designs from minimalist to richly textured backgrounds, this collection provides a unique backdrop for expressing thanks. Customize these cards for any occasion, whether it's professional gratitude towards colleagues and clients, or personal appreciation for friends and family. Ideal for both digital expressions and printed notes, this set ensures your message of thanks is received with the sentiment it’s intended. It’s a wonderful way to convey appreciation and leave a memorable impression on its recipients.


5 diapositivas
Marketing Strategies Infographics
Marketing Strategies refer to the plans and tactics implemented by businesses and organizations to promote their products, services, or brand to their target audience and achieve their marketing objectives. These infographics focuses on various marketing strategies used by businesses to promote their products or services. This provides a comprehensive overview of key marketing strategies, their benefits, and how they can be implemented effectively. These will help you convey the key concepts and benefits of various marketing strategies. Fully compatible with Powerpoint, Keynote, and Google Slides.


8 diapositivas
Insurance Market Trends Presentation
Stay Ahead in the Insurance Industry with this Insurance Market Trends Presentation template. Designed with a modern roadmap layout, this slide helps illustrate key trends, policy changes, and industry insights in an engaging and structured way. Ideal for insurance professionals, financial analysts, and business strategists, this fully customizable template is compatible with PowerPoint, Keynote, and Google Slides, making it easy to adapt to your specific needs.


4 diapositivas
Team Alignment and Discussion Summary Presentation
Foster collaboration and keep everyone on the same page with the Team Alignment and Discussion Summary presentation. This template highlights discussion points, action items, and key takeaways alongside a professional image layout—perfect for recaps, team syncs, and leadership updates. Fully editable in PowerPoint, Keynote, and Google Slides.