


Características


¿Tienes alguna pregunta?
Recomendar


5 diapositivas
Alcohol Effects Infographics
Alcohol can have various effects on the body and mind, depending on the amount consumed, the individual's tolerance, and other factors. These unique vertical Infographics provide information about the physical, psychological, and social effects of alcohol use. They are designed to educate people about the risks of drinking too much and the consequences of alcohol abuse. To help you present your data these include statistics, illustrations, and other visual aids to help your audience understand the impact of alcohol on their health. By providing information about the effects of alcohol, this helps people make informed decisions about alcohol use.


6 diapositivas
Future Trends in Tech Presentation
Forecast innovation with clarity using this Future Trends in Tech Presentation. Designed with a modern silhouette head and brain visualization, this slide emphasizes key trend comparisons using icon-labeled callouts and bold percentage highlights. Ideal for tech forecasting, AI adoption, or market prediction topics. Fully editable in PowerPoint, Keynote, and Google Slides—available in both light and dark modes.


10 diapositivas
Project Budget Breakdown Presentation
The "Project Budget Breakdown Presentation" template offers a clear and efficient way to visualize budget allocations within a project. It uses a visually appealing color scheme that highlights four different budget segments, each represented by a different color to ensure quick readability and easy understanding. The template allows you to illustrate percentages and corresponding financial values, making it straightforward for stakeholders to grasp budget allocations at a glance. This template is highly beneficial for project managers, financial analysts, and business executives who need to present and discuss budgetary details clearly and concisely in project meetings or budget reviews. It is adaptable for use in various industries, including construction, IT, marketing, and research development, supporting effective budget management and transparency.


13 diapositivas
Market Segmentation and Consumer Demographics Presentation
Visualize your audience breakdown with this clean, data-driven demographic infographic slide. Featuring customizable male and female icons, percentage metrics, and bar charts for segment analysis, this layout is perfect for showcasing consumer insights, behavior patterns, and target group comparisons. Ideal for marketing reports, business plans, and audience research decks. Fully editable in PowerPoint, Keynote, and Google Slides.


5 diapositivas
Dynamic SWOT Quadrant Assessment Presentation
Present your strategy with clarity using the Dynamic SWOT Quadrant Assessment Presentation. This clean, four-quadrant layout organizes your Strengths, Weaknesses, Opportunities, and Threats in a visually balanced format, perfect for strategic reviews and planning workshops. The bold quadrant visuals help guide the audience’s focus while allowing for detailed commentary alongside each factor. Fully customizable in PowerPoint, Keynote, and Google Slides.


6 diapositivas
Numeric Data Slide Layout Presentation
Bring your numbers to life with a clean, flowing visual that turns data into an easy-to-follow story. This presentation guides viewers through each step of your process, helping them understand key insights without overwhelm. Ideal for analytics, reporting, and planning. Fully compatible with PowerPoint, Keynote, and Google Slides.


6 diapositivas
Personal Goals Infographics
The "Personal Goals" infographic template is a highly motivational and visually engaging resource, crafted specifically for PowerPoint, Keynote, and Google Slides. This template is perfect for life coaches, educators, and individuals looking to visually articulate their personal objectives and action plans. This template adeptly encapsulates key facets of personal goal setting, including short-term and long-term objectives, milestones, and strategies for achievement. The design promotes a clear depiction of each goal, along with the steps and timelines necessary for success. This makes it an invaluable tool for personal development workshops, coaching sessions, or even individual self-reflection and planning. The aesthetic of the template is uplifting and focused, with a color scheme that inspires positivity and determination. This not only makes the presentation visually appealing but also resonates with the theme of personal growth and ambition. Whether used for motivational seminars, educational purposes, or personal planning, this template ensures that the journey towards personal goals is laid out in a visually stimulating, organized, and inspiring manner.


7 diapositivas
Asia Population Infographic Presentation
An Asia Map infographic is a visual representation of the Asian continent, highlighting its geographic features, population, culture, history, and other relevant information. Use this template as a graphic representation of Asia that combines text, data, and images in a visually appealing and informative way. This template can be used as a political or physical maps, regional map, thematic maps, or a combination of these. They may also include charts, graphs, illustrations, photographs, or other visual elements to convey information effectively. This template is completely customizable.


20 diapositivas
Windsong Sales Proposal Presentation
Craft a persuasive sales proposal with this sleek and professional template. Perfectly suited for communicating your value proposition, this design includes slides for introductions, company overviews, and a detailed service summary. Address critical business factors with sections for target markets, competitive analysis, and clearly defined sales objectives. Highlight your sales process, showcase the team's expertise, and build trust through customer testimonials. Dedicated slides for pricing strategies, promotions, and discounts allow you to present a compelling financial offer. Wrap up with an actionable next steps plan and a feedback section to reinforce client engagement. Fully customizable and compatible with PowerPoint, Google Slides, and Keynote, this template combines modern design with functional layouts to ensure your proposal stands out. Ideal for creating a lasting impression.


8 diapositivas
Cloud Data Storage and Security Presentation
Visualize cloud security effortlessly with this Cloud Data Storage and Security template. Designed for IT teams, cybersecurity professionals, and cloud architects, this slide simplifies complex data protection strategies, storage models, and access controls. Featuring a modern cloud-based layout with clear, structured elements, it ensures easy interpretation of key security components. Fully editable and compatible with PowerPoint, Keynote, and Google Slides for seamless presentations.


4 diapositivas
Startup Business Plan Slide Deck Presentation
Kickstart your pitch with a clean, modern slide deck that guides your audience through your startup’s core ideas with clarity and confidence. This presentation outlines key business concepts, supporting strategy, goals, and planning in an easy-to-follow structure. Fully compatible with PowerPoint, Keynote, and Google Slides.


6 diapositivas
Amortization Schedule Infographic
An amortization schedule is a detailed table that outlines the repayment of a loan over time. This infographic can be a helpful way to visually explain the repayment schedule of a loan or mortgage. Divide it into sections, including an introduction, explanation of terms, example calculations, and key takeaways. Compatible with Powerpoint, Keynote, and Google Slides. Use icons or visuals to represent loan-related concepts, such as a house for mortgages, a money bag for payments, or a graph for interest rates. The line graphs included can show the decreasing principal balance over time, with interest and principal portions highlighted.


21 diapositivas
Lunaris Sales Proposal Presentation
An engaging and professional presentation designed to showcase sales proposals effectively. It features slides for objectives, market analysis, pricing strategies, team introductions, and performance metrics. The vibrant design ensures impactful communication with stakeholders. Fully editable and compatible with PowerPoint, Keynote, and Google Slides for seamless customization and presentation delivery.


5 diapositivas
Public Health and Wellness Strategy Presentation
Present a comprehensive Public Health and Wellness Strategy with this visually engaging template. Designed with a segmented circular diagram, it effectively outlines key areas such as healthcare infrastructure, mental well-being, preventive care, and emergency response. Ideal for health professionals, policy-makers, and organizations aiming to communicate community health initiatives and strategies. Fully customizable and compatible with PowerPoint, Keynote, and Google Slides.
20 diapositivas
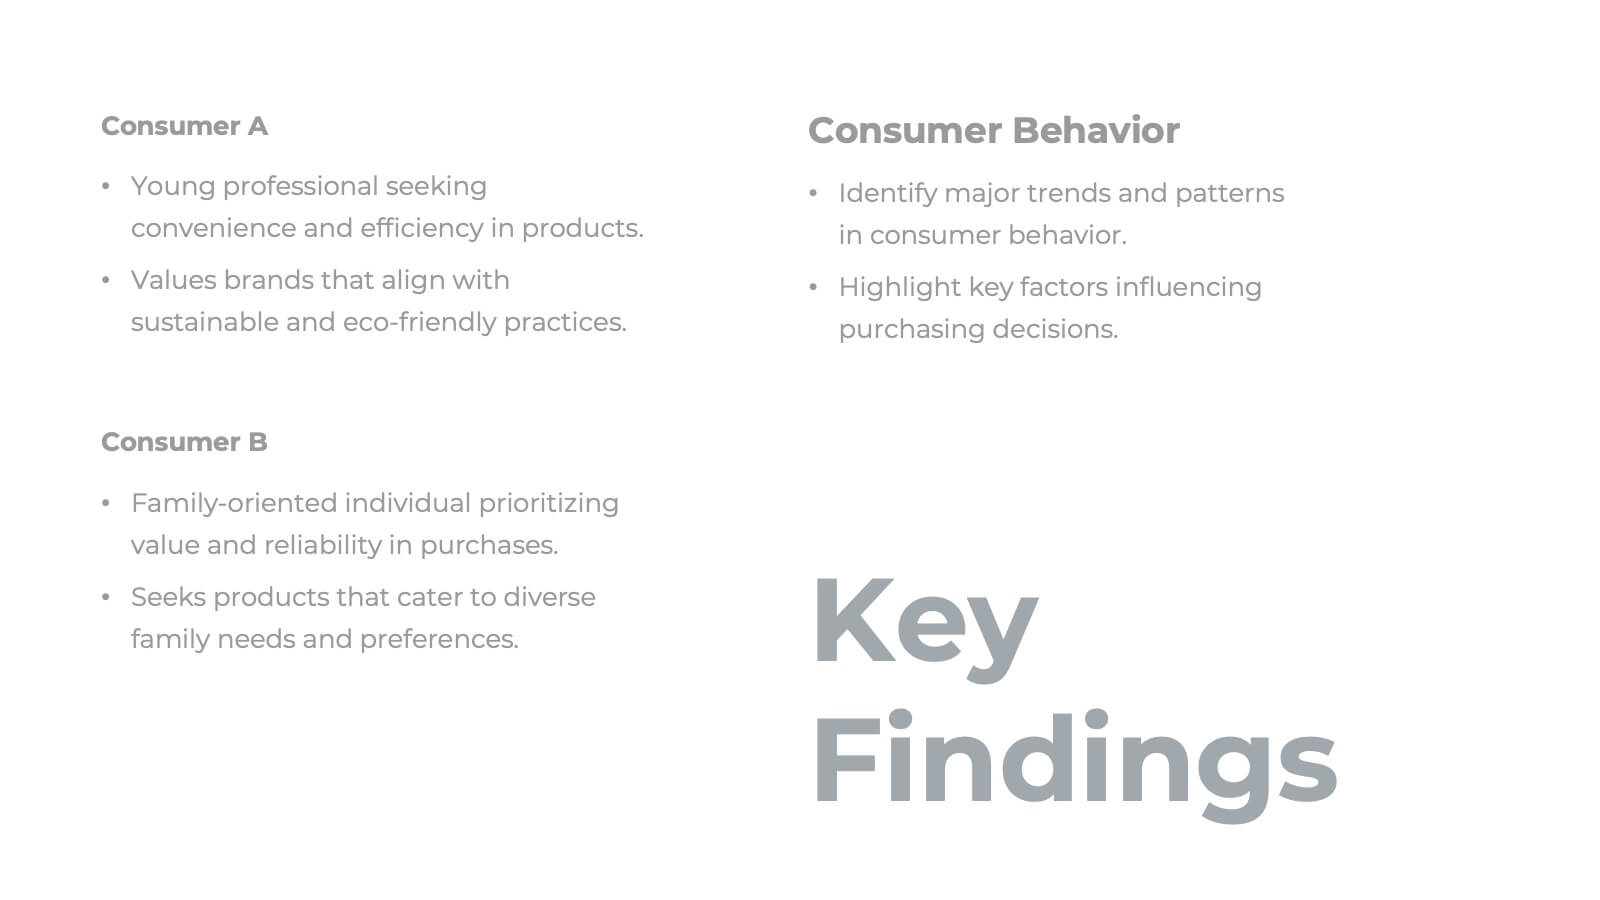
Malachite Research Proposal Presentation
Present your research findings with clarity and professionalism using this structured research presentation template! Covering all essential elements, from research objectives and methodology to key findings and implications, this template ensures your work is communicated effectively. It's perfect for academic, corporate, or scientific presentations. Compatible with PowerPoint, Keynote, and Google Slides, it's versatile and ready for your next project.


21 diapositivas
Journey Sales Proposal Presentation
Get ready to seal the deal with the Journey Sales Proposal Presentation template! This template is designed to help you craft compelling sales proposals that captivate and convince. With a clean, modern design, it allows you to showcase your products or services, highlight your competitive edge, and present your pricing strategies effectively. Each slide is thoughtfully designed to guide your audience through the sales process, from introduction to final agreement. Whether you're pitching to potential clients or presenting to stakeholders, this template provides the perfect structure to outline your objectives, strategies, and key metrics. It also includes sections for team introductions, customer testimonials, and future opportunities, making it a comprehensive tool for any sales professional. The Journey template is fully customizable and compatible with PowerPoint, Keynote, and Google Slides, ensuring you can easily tailor it to fit your brand and message. Start closing more deals with style and confidence!


9 diapositivas
Business Dashboard Infographics
A business dashboard, often referred to as a business intelligence dashboard, is a visual representation of an organization's key performance indicators and critical business metrics. Empower your business analysis and strategy with our Infographic. This dynamic template enables you to present key business metrics, performance indicators, and trends in a clear and impactful manner. Compatible with Powerpoint, Keynote, and Google Slides. This template is a powerful tool to visualize your business progress, identify opportunities, and communicate your success story to viewers, clients, or team members.