


Características


¿Tienes alguna pregunta?
Recomendar

21 diapositivas
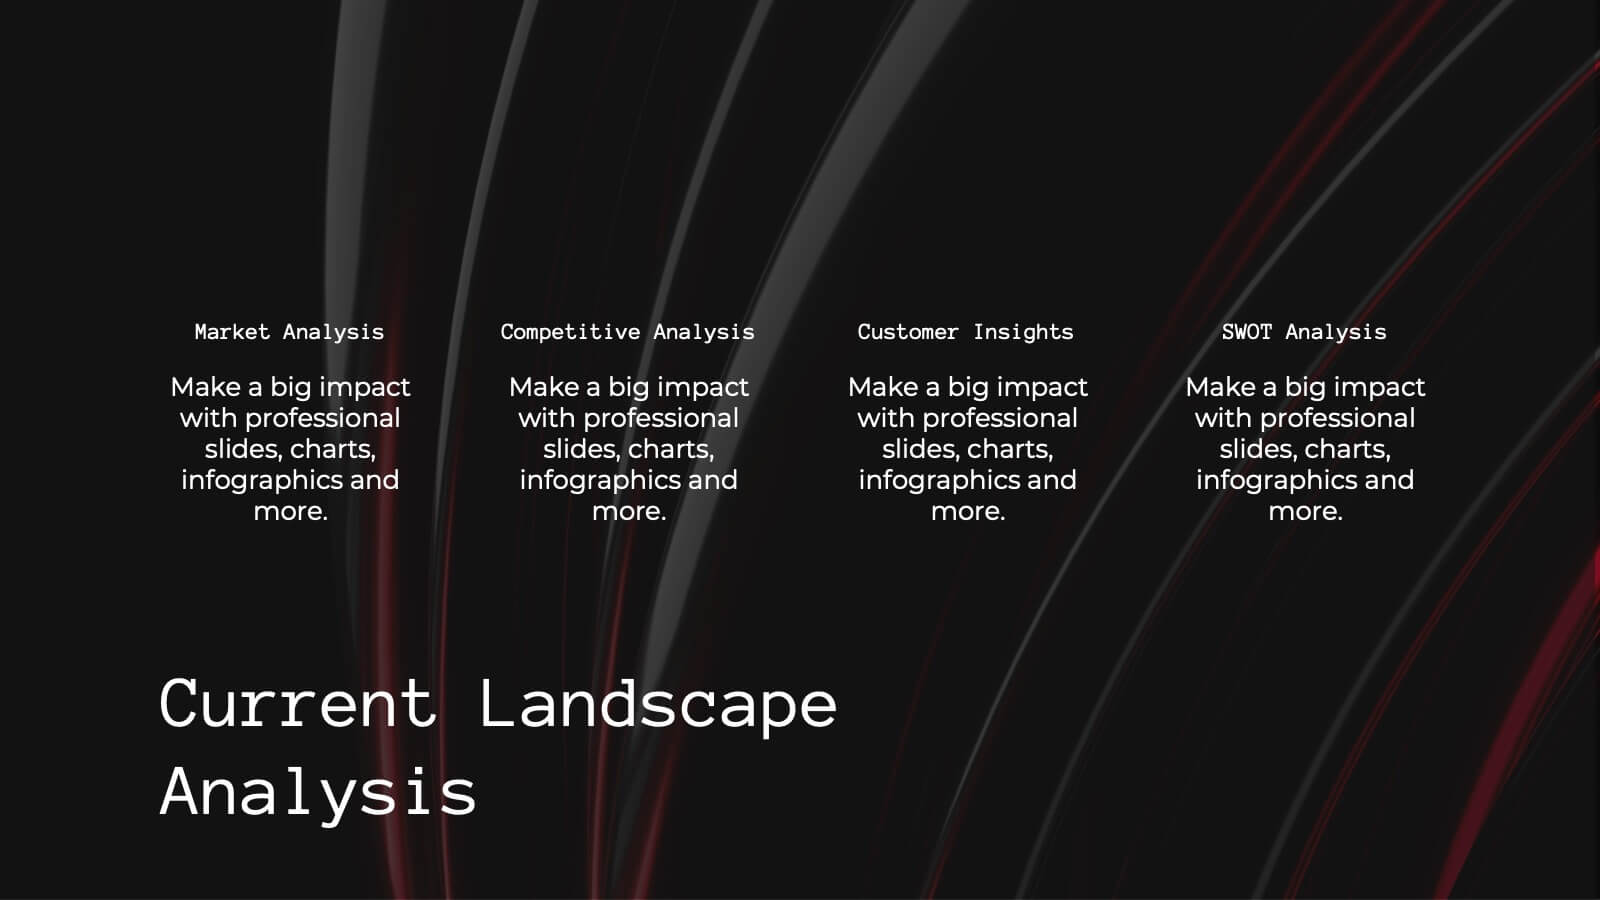
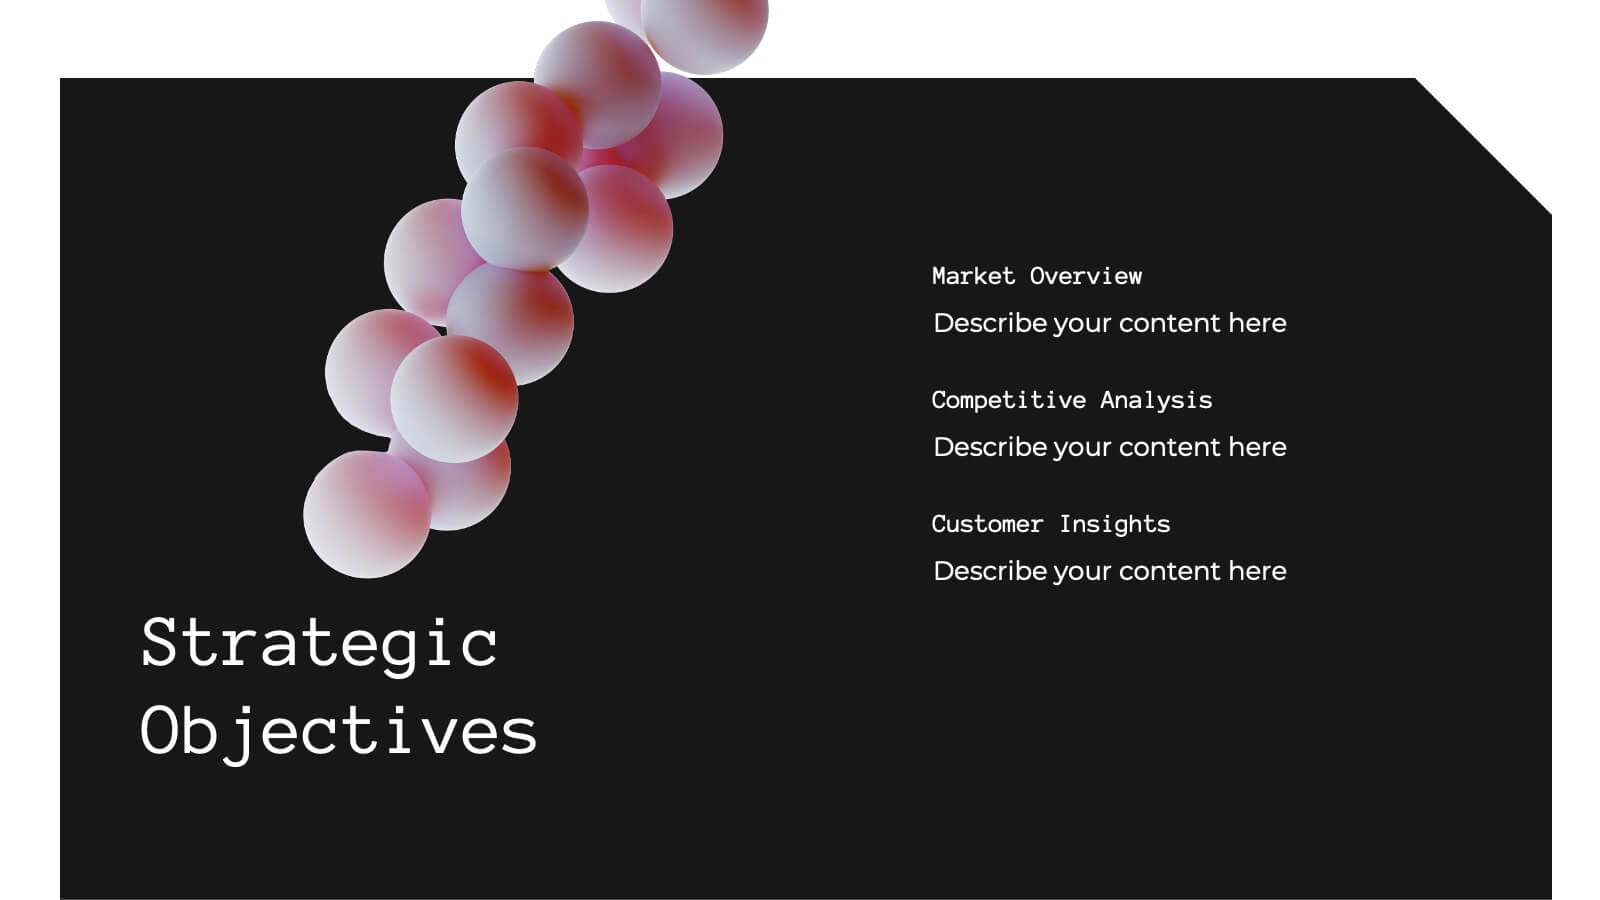
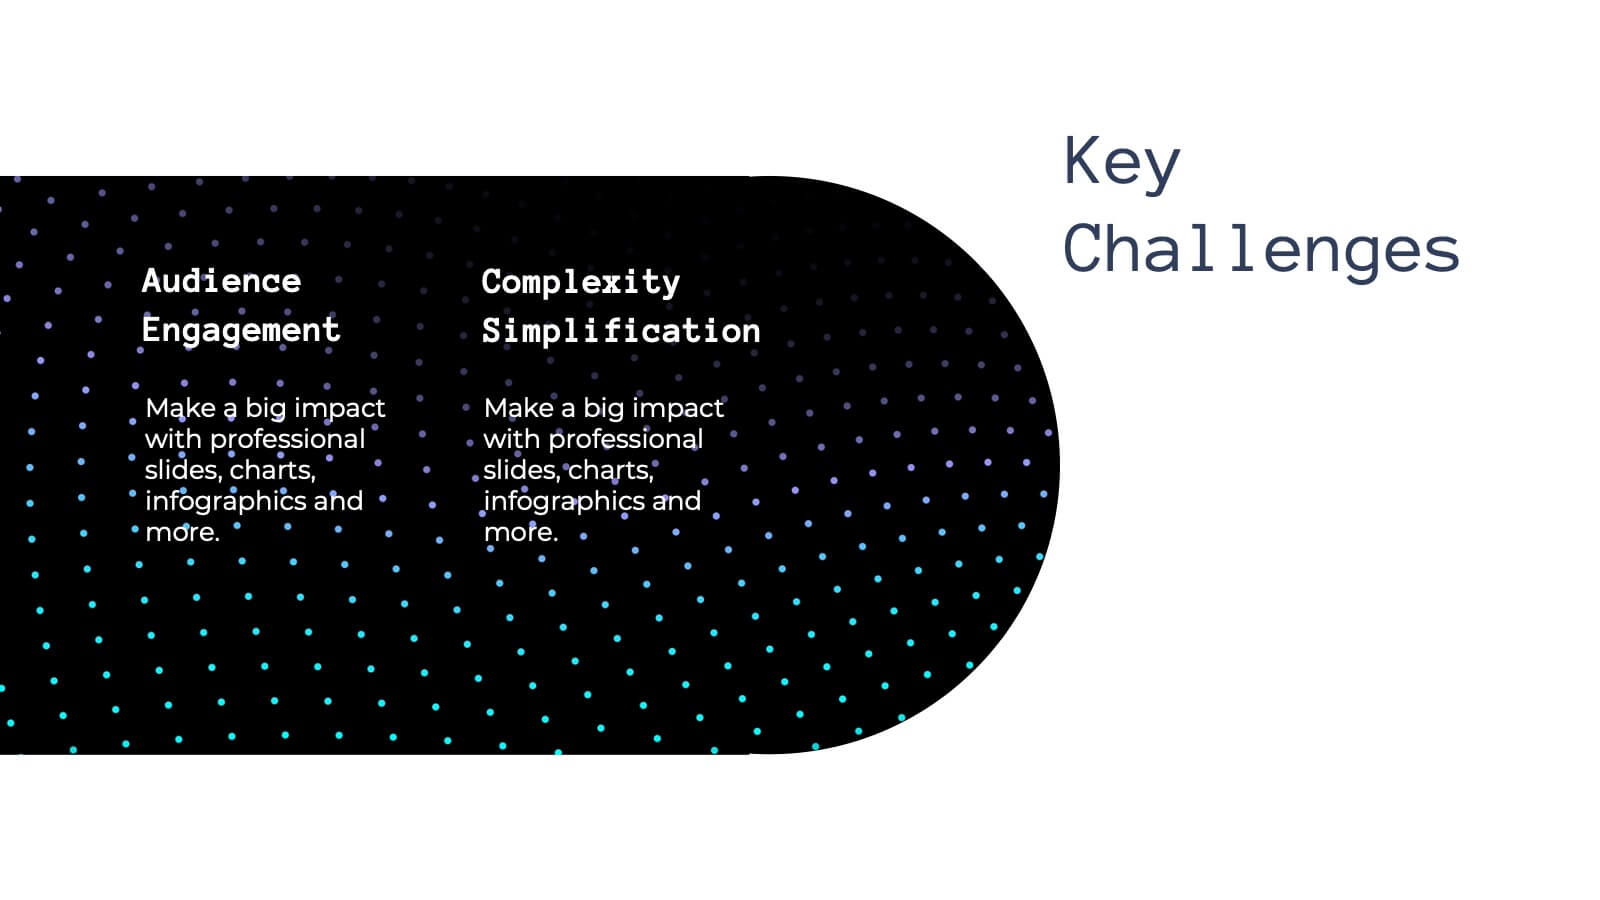
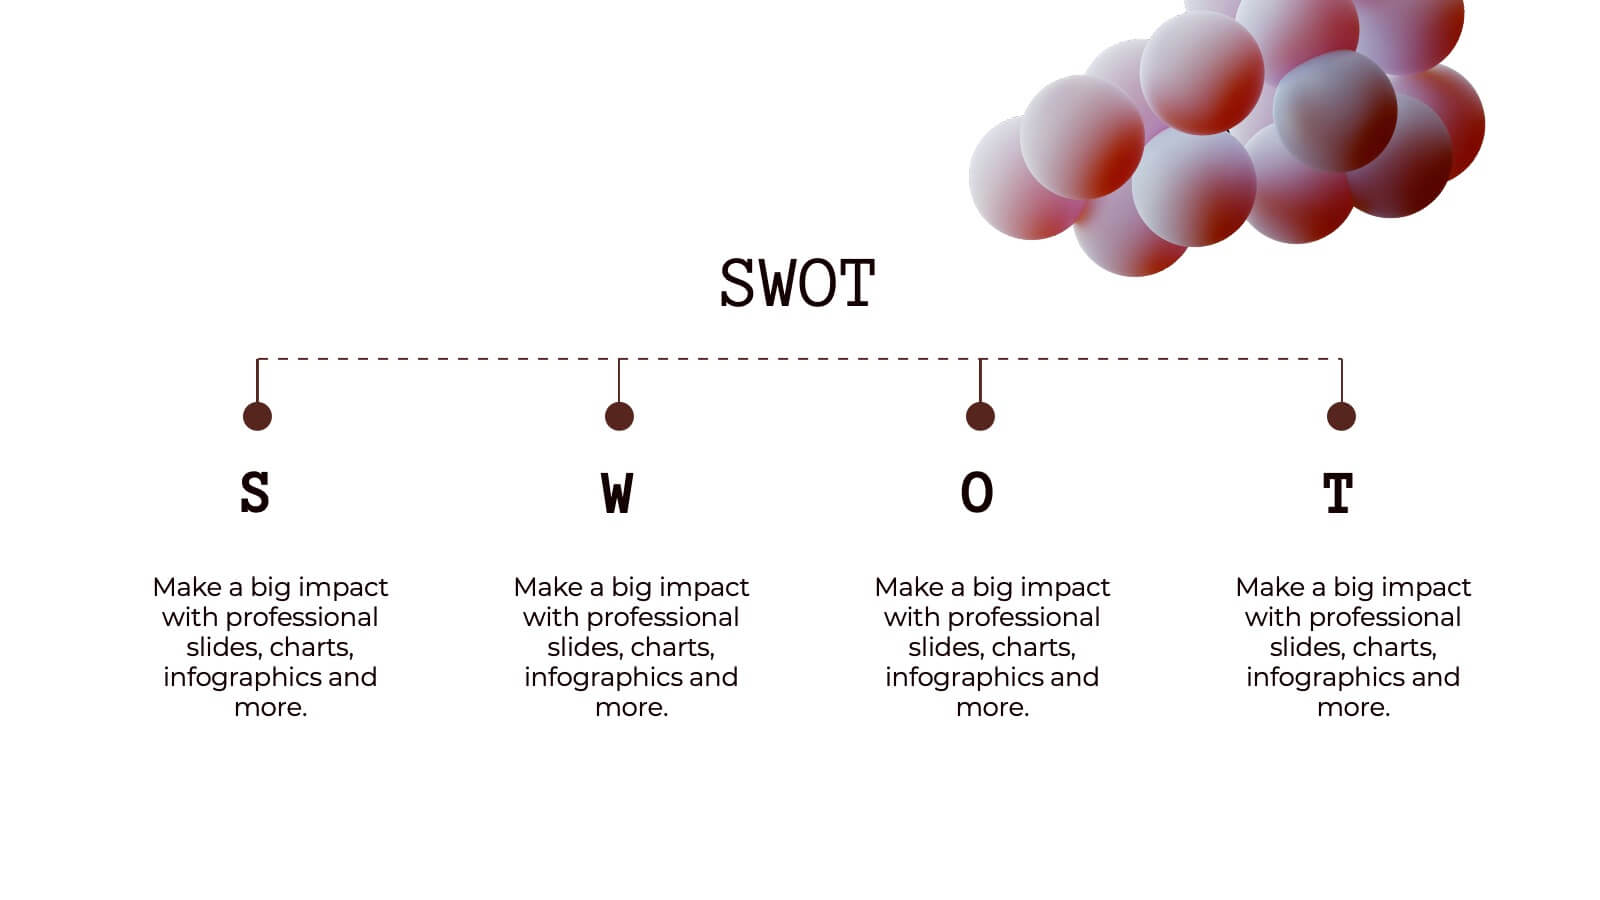
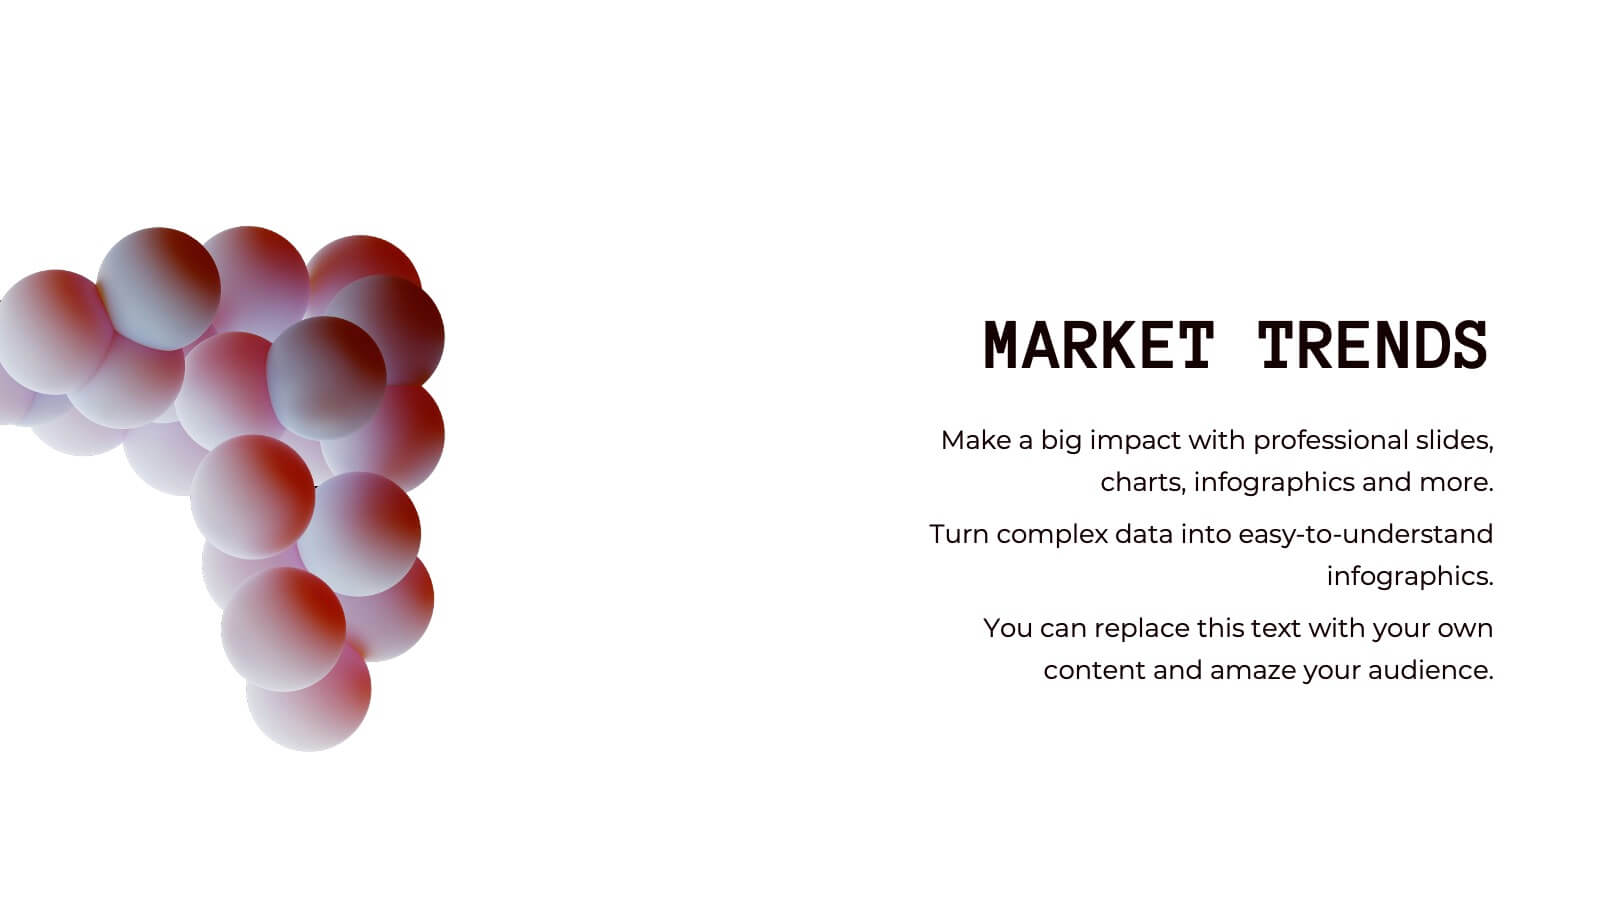
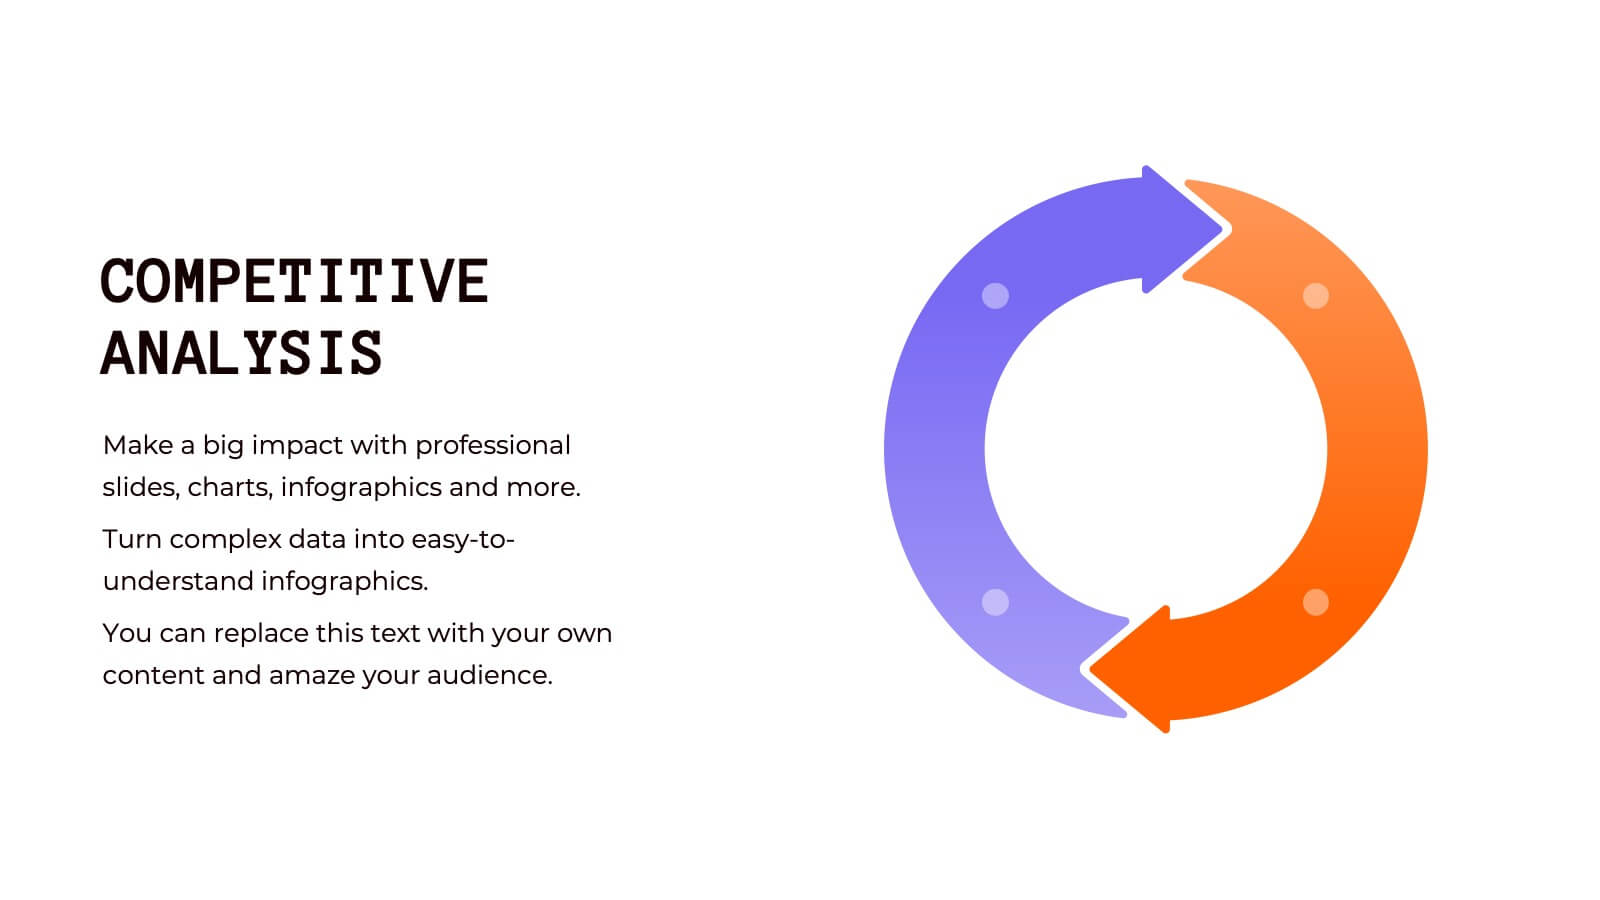
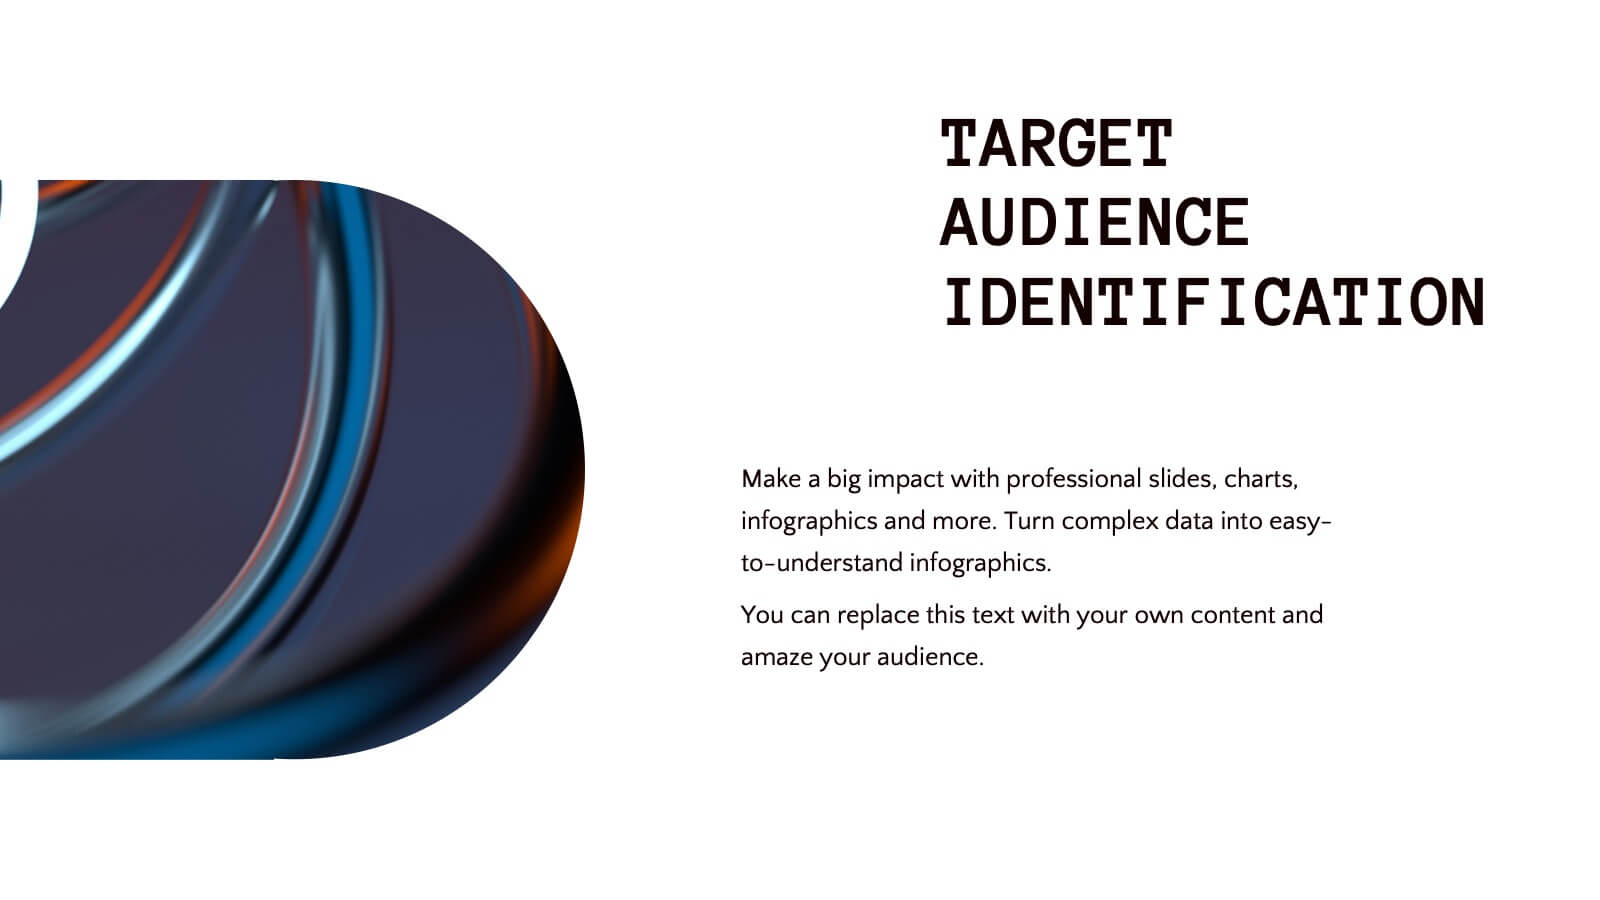
Mermaid Corporate Strategy Proposal Presentation
Present your corporate strategy with confidence using this sleek, modern proposal template! It covers strategic objectives, market trends, SWOT analysis, and resource allocation, ensuring a comprehensive overview of your plan. Fully customizable and compatible with PowerPoint, Keynote, and Google Slides, this template is ideal for launching new initiatives and achieving business goals.


8 diapositivas
Business Problem Solution Presentation
Turn complex challenges into clear, visual insights with this sleek diagram designed to outline problems, root causes, and actionable solutions. Ideal for strategy meetings or proposal decks, it helps you communicate ideas with structure and impact. Fully compatible with PowerPoint, Keynote, and Google Slides for easy customization and presentation use.


4 diapositivas
Agile Workflow Presentation
Bring energy and motion to your process overview with a clean, loop-based flow that makes each stage easy to follow. This presentation is designed to clarify steps, illustrate iterations, and support clear decision-making for any project. Fully customizable and compatible with PowerPoint, Keynote, and Google Slides.


7 diapositivas
Flow Chart Diagram Presentation
Flow charts are important because they provide a visual representation of a process or system, which helps to simplify complex information and make it easier to understand. Our Infographic flow charts are easy to use because they combine visual elements such as icons, and colors with concise text, making complex information more digestible and memorable. These highly adaptable flow charts are ideal due to their complete customizability, allowing for universal utilization to cater to the unique requirements of any individual. Do not waste any more precious time and get started right away.


6 diapositivas
Business Structure Outline Presentation
Visualize your company’s framework with this modern business structure slide. Perfect for showcasing team roles, departments, or organizational functions, it helps simplify complex relationships into a clear overview. Easily editable in Canva, PowerPoint, and Google Slides—ideal for presentations, planning sessions, or onboarding new employees with a professional, easy-to-follow design.


21 diapositivas
Argentis UX Strategy Plan Presentation
Craft a seamless user experience with this professional UX strategy plan presentation. Covering key topics like user research, interaction design, wireframes, and accessibility considerations, this template helps you present a structured and insightful design approach. Fully customizable and compatible with PowerPoint, Keynote, and Google Slides for a smooth and impactful presentation.


5 diapositivas
Consideration in Contract Law Infographics
Navigate the complexities of contract law with our consideration in contract law infographics. Crafted with a vintage aesthetic, using a palette of brown, tan, and blue, this sophisticated template radiates a classic legal ambiance. Ideal for law students, legal professionals, and educators, this collection aids in dissecting intricate contractual principles with clarity and elegance. Compatible with Powerpoint, Keynote, and Google Slides. The creative, vintage-themed design, adorned with graphics and icons, not only enriches your presentation but also serves as a compelling educational tool, transforming legal jargon into accessible information.


8 diapositivas
Executive Summary Business
Present key insights clearly with this modern Executive Summary slide. Designed for impact, it highlights core data points alongside four strategic pillars—perfect for quarterly updates, board meetings, or business reviews. Fully editable in PowerPoint, Keynote, and Google Slides. Clean layout, customizable icons, and sleek visuals ensure a professional finish.


6 diapositivas
RACI Matrix Management Infographics
Streamline your project management with our RACI Matrix Management infographic template, compatible with PowerPoint, Keynote, and Google Slides. This template is a valuable tool for project managers, team leaders, and professionals involved in collaborative projects. Our template distinctly outlines the four key roles of RACI - Responsible, Accountable, Consulted, and Informed. Each section is clearly demarcated, making it easy to assign and display roles and responsibilities within your team. This structured approach ensures that everyone involved in a project understands their tasks and the hierarchy of accountability. The color scheme of the template is subtle and business-like, ideal for a corporate environment. It enhances readability and comprehension, ensuring that the RACI matrix is not only informative but also visually appealing. This template is an essential asset for efficient team management, enabling clear communication and organization in any project.


5 diapositivas
Fitness Trainings Infographics
Fitness Training refers to structured physical activities or exercises designed to improve and maintain physical fitness, overall health, and athletic performance. Using these infographic templates, you can effectively educate your audience about different fitness training techniques, inspire them to adopt a healthy and active lifestyle, and provide them with practical tips and guidance for their fitness journey. These are designed to showcase various fitness training concepts, techniques, and tips. Whether you're a fitness instructor, personal trainer, or fitness enthusiast, this template is a valuable resource to educate and motivate your audience about fitness training.


7 diapositivas
Flow Chart Diagram
A flowchart diagram is a visual representation that illustrates a process or system by using different symbols and shapes to depict the steps, decisions, and actions involved. Our flow chart diagram infographic is the compass to navigate your concepts into concrete actions. It's a visual roadmap that simplifies complex processes, helping you illustrate the steps in a sequence. This Infographic is your trusted tool for transforming processes into a visually appealing and understandable journey. This tool is designed to be used in various fields, including software development, business process analysis, education, and more, to depict the logical flow.


8 diapositivas
Risk Analysis Bowtie Diagram
Clarify your risk management strategy with the Risk Analysis Bowtie Diagram Presentation. This visual framework helps you analyze causes and consequences of a hazardous event using the bowtie model. The left side details potential causes and preventive controls, while the right outlines possible consequences and mitigating defenses. With bold "Before" and "After" labels, this slide makes complex risk pathways easy to understand. Fully editable in PowerPoint, Keynote, and Google Slides, with multiple highlighting variations to focus on either threats or outcomes.


7 diapositivas
Porter's Five Forces Analysis Infographic
Unveil the key elements influencing your industry with Porter's Five Forces Analysis Infographic. Drenched in vibrant shades of yellow, blue, and white, this template offers a lucid visualization of the five crucial forces that determine the competitive intensity in the market. Ideal for business analysts, strategy planners, or management students, it offers a nuanced understanding of market dynamics. Its engaging design captures attention while facilitating comprehensive discussions on potential opportunities or threats. With compatibility across PowerPoint, Keynote, and Google Slides, it promises smooth transitions during presentations.


5 diapositivas
Online Advertising and SEO Marketing Presentation
Elevate your digital marketing strategy with this engaging infographic template! Designed for clarity, it simplifies online advertising and SEO concepts, covering key metrics, trends, and strategies. Perfect for teams, clients, or stakeholders, it’s fully customizable and compatible with PowerPoint, Keynote, and Google Slides for seamless presentations that captivate and inform.


7 diapositivas
Loves Travel Infographic Presentation
Travel is an opportunity to get out of our comfort zones and be inspired to try new things, it changes our perspective on the world. Use this template to give your audience an overview of a trip and prepare them for what they will be experiencing. This template features an infographic style design, with plenty of room to describe the locations and activities as well as instructions and tips. Build your own infographic with this template, and add it to your presentations. You can easily add your own content in PowerPoint, Keynote, or Google slides and turn it into a fun presentation in minutes.


6 diapositivas
Project Cycle Infographics
The "Project Cycle" infographic template is a meticulously designed resource, ideal for project managers, team leaders, and business analysts. This template facilitates a clear and comprehensive presentation of the various stages involved in a project, from initiation to completion. This template encompasses essential elements of the project cycle, including project initiation, planning, execution, monitoring, and closure. The structured design ensures each phase is distinctly represented, allowing for detailed exploration of timelines, resource allocation, and milestone achievements. This makes it an excellent tool for project planning meetings, stakeholder briefings, and team workshops. The design is professional and methodical, featuring a color scheme that is both engaging and indicative of progression and clarity. This not only enhances the visual appeal of the presentation but also aids in effectively communicating the sequential and cyclical nature of project management. Whether it's used in corporate boardrooms or educational settings, this template guarantees that your project cycle is presented in a detailed, visually compelling, and easily understandable manner.


10 diapositivas
Project Launch in 4 Structured Phases Presentation
Present your roadmap with clarity using this four-phase launch diagram. Designed for planning, strategy, or product rollout presentations, each step is illustrated in a 3D layered format with editable text sections. Fully customizable in PowerPoint, Keynote, and Google Slides—ideal for project managers and teams outlining sequential development or launches.