


Características


¿Tienes alguna pregunta?
Recomendar


5 diapositivas
Business Growth Cycle Presentation
Illustrate your company’s journey with the Business Growth Cycle slide. This dynamic layout features four sleek arrow segments that represent each phase of growth—from initiation to expansion. Color-coded steps and minimalist icons help guide the audience through your strategy clearly and efficiently. Ideal for outlining roadmaps, business stages, or workflow transitions. Fully editable and compatible with PowerPoint, Keynote, and Google Slides.


5 diapositivas
Medical Technology Infographics
Medical Technology refers to the use of innovative technologies, devices, and systems in healthcare to improve patient care, diagnosis, treatment, and overall healthcare delivery. These infographics are comprehensive and visually appealing designs that allow you to showcase the advancements and impact of medical technology in the healthcare industry. This template is perfect for presentations, reports, or educational materials related to medical technology. The template includes various vertical infographic elements that allow you to highlight the benefits, applications, and advancements in medical technology.


21 diapositivas
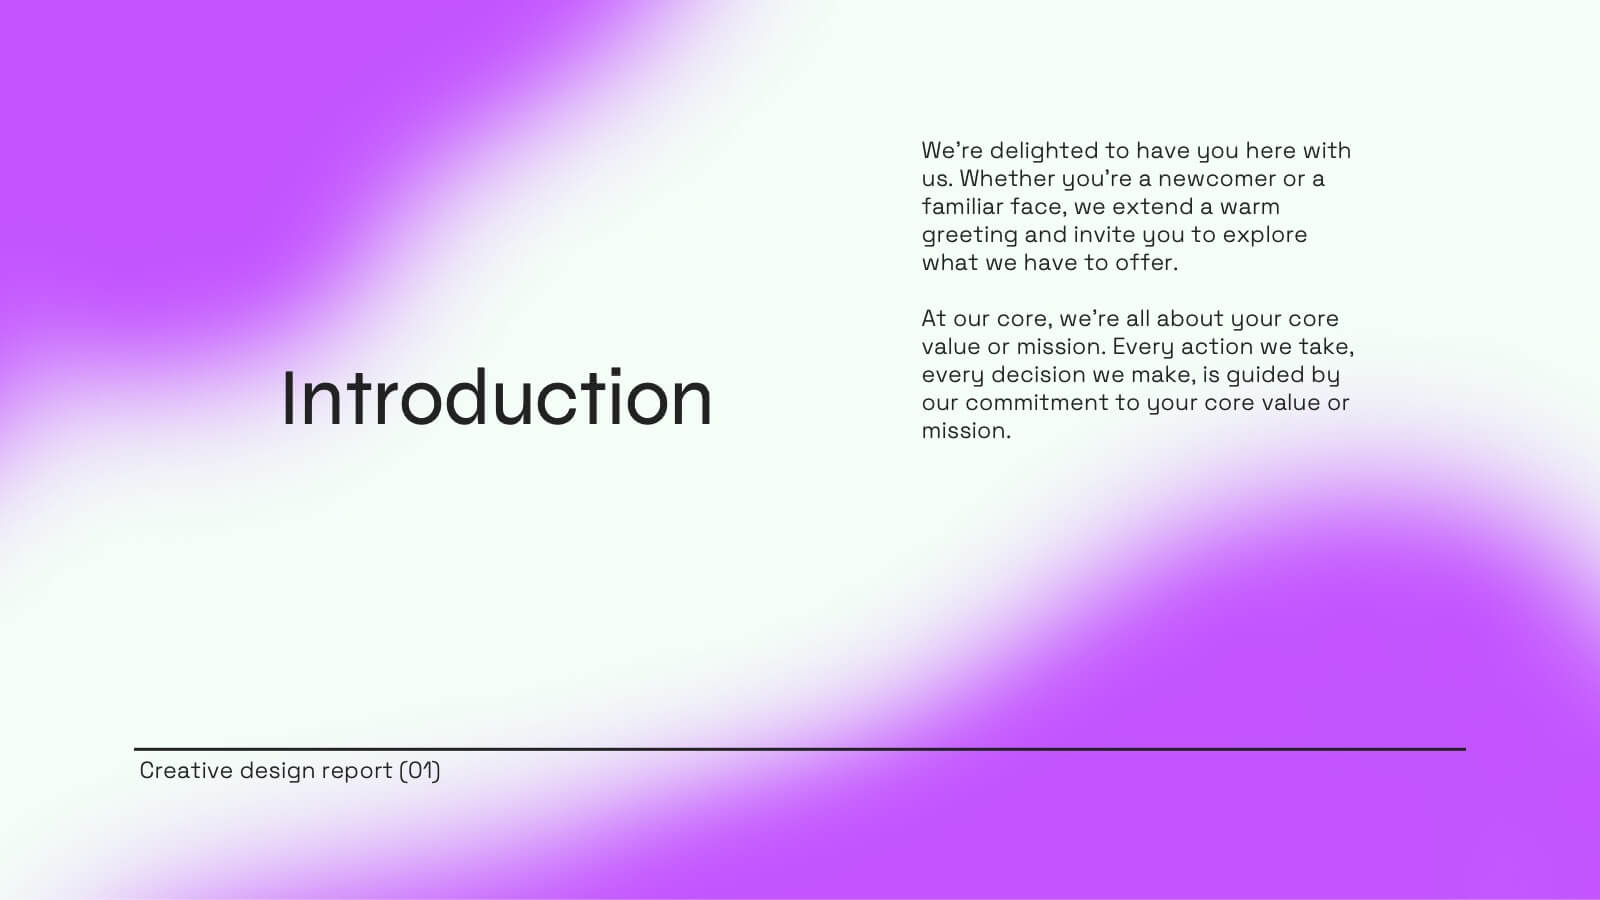
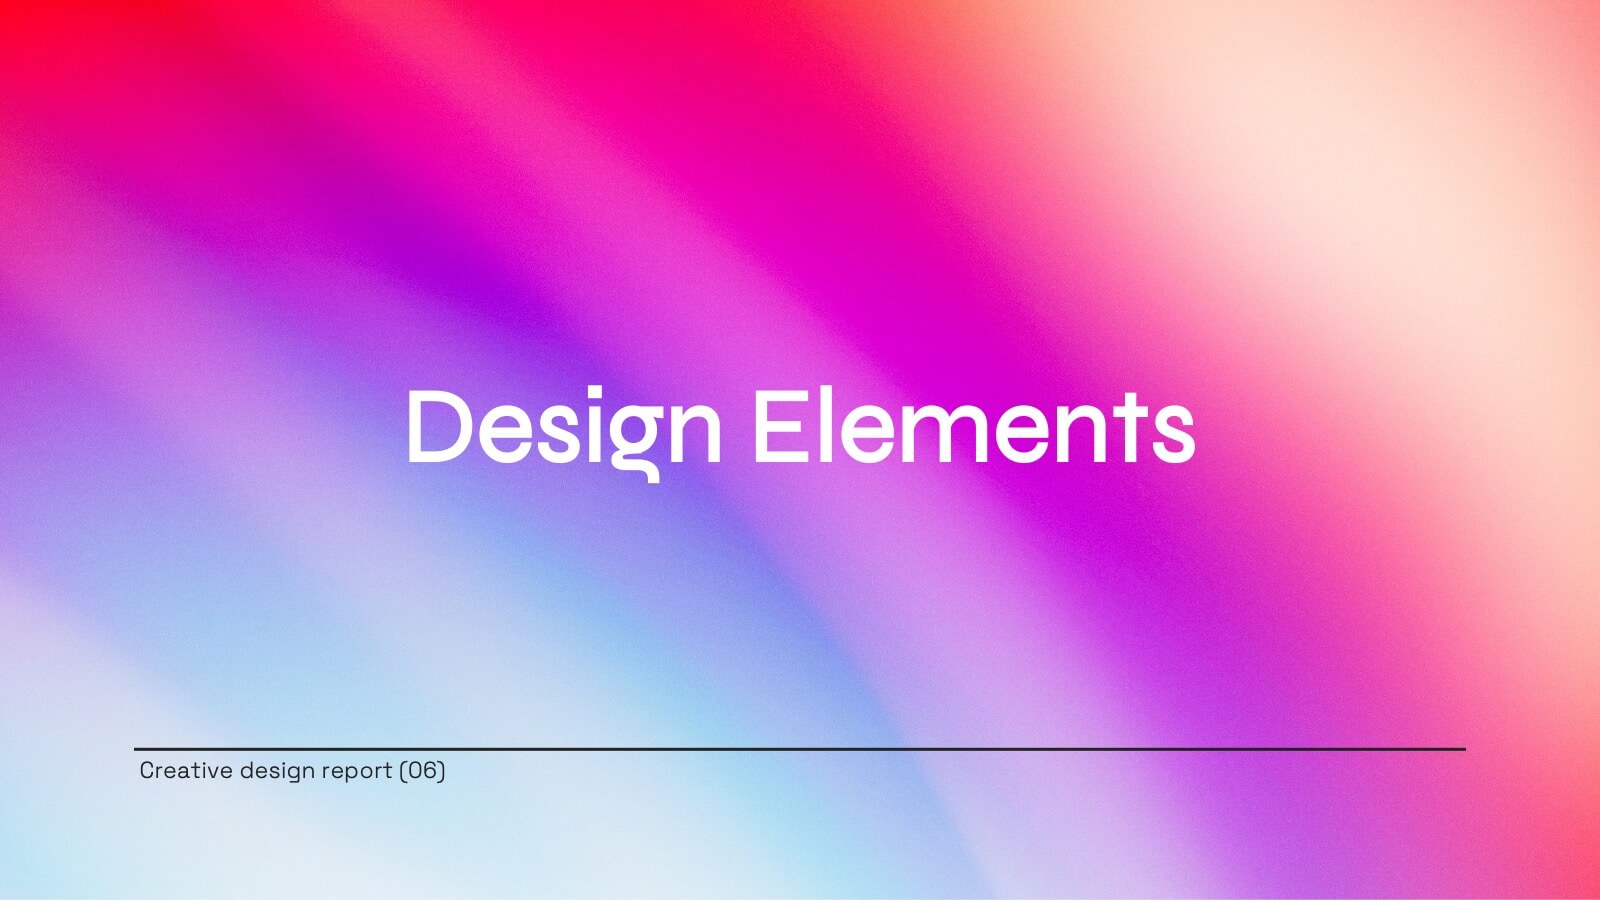
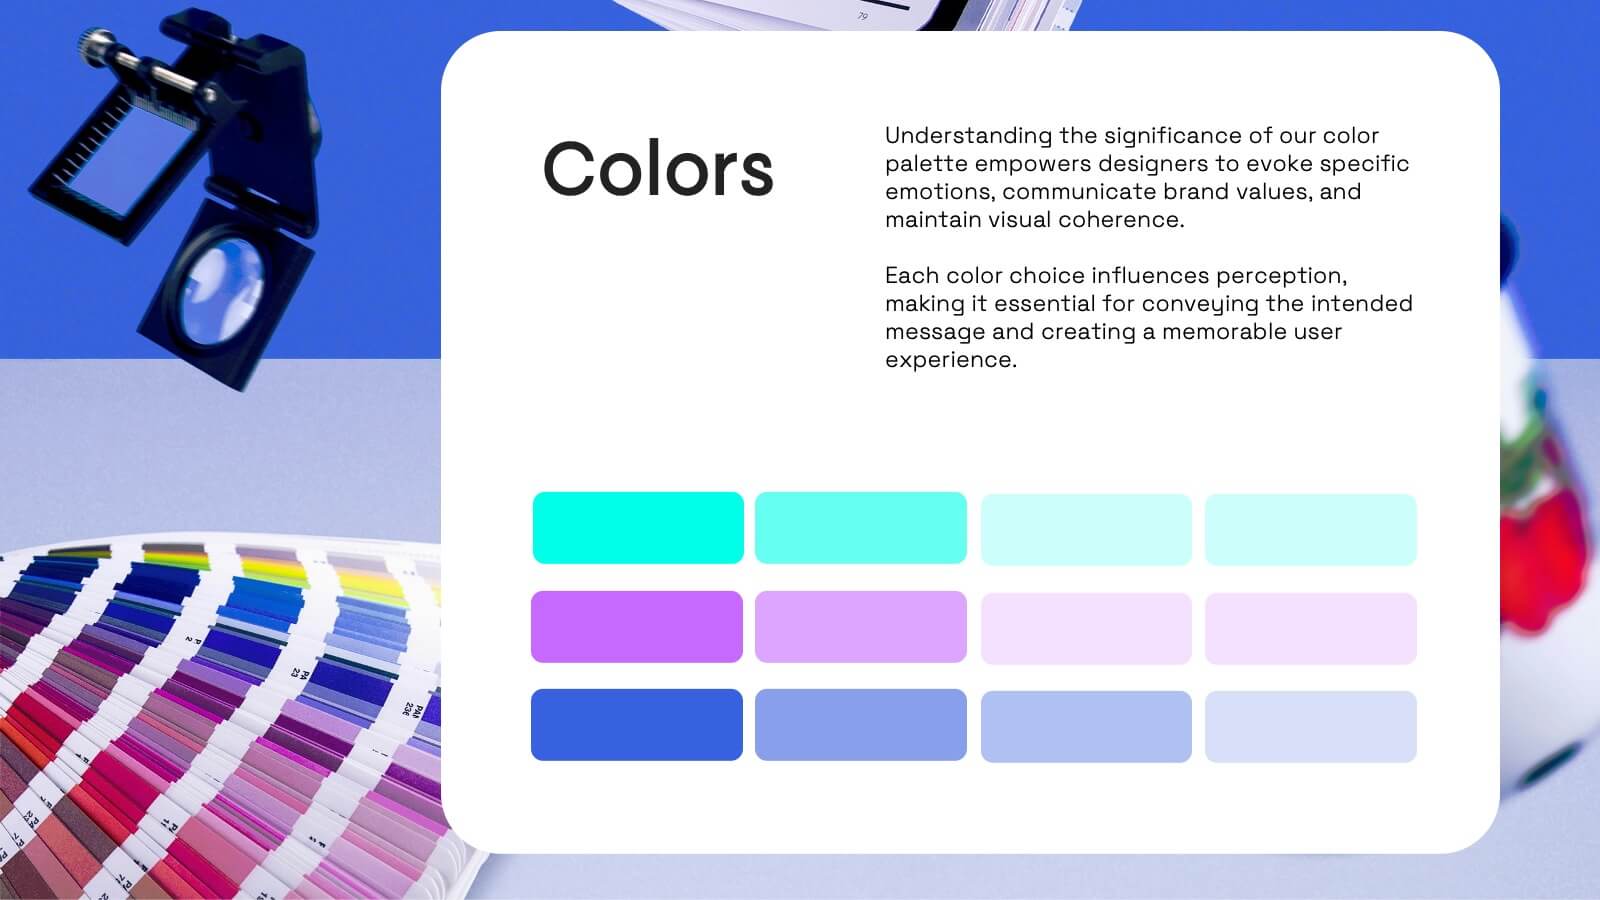
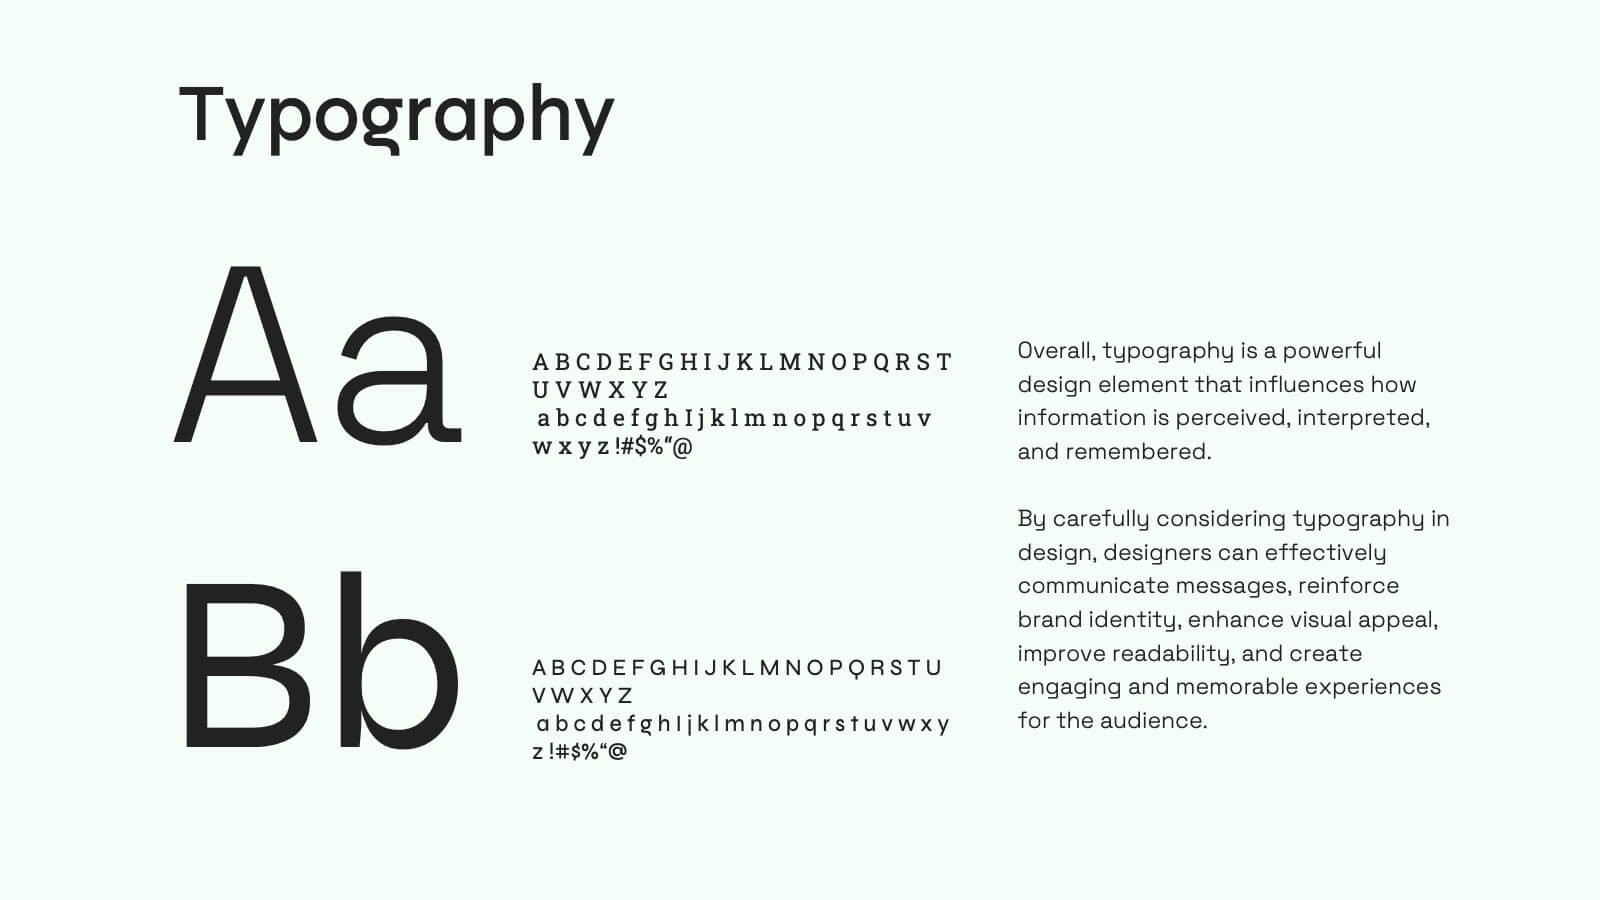
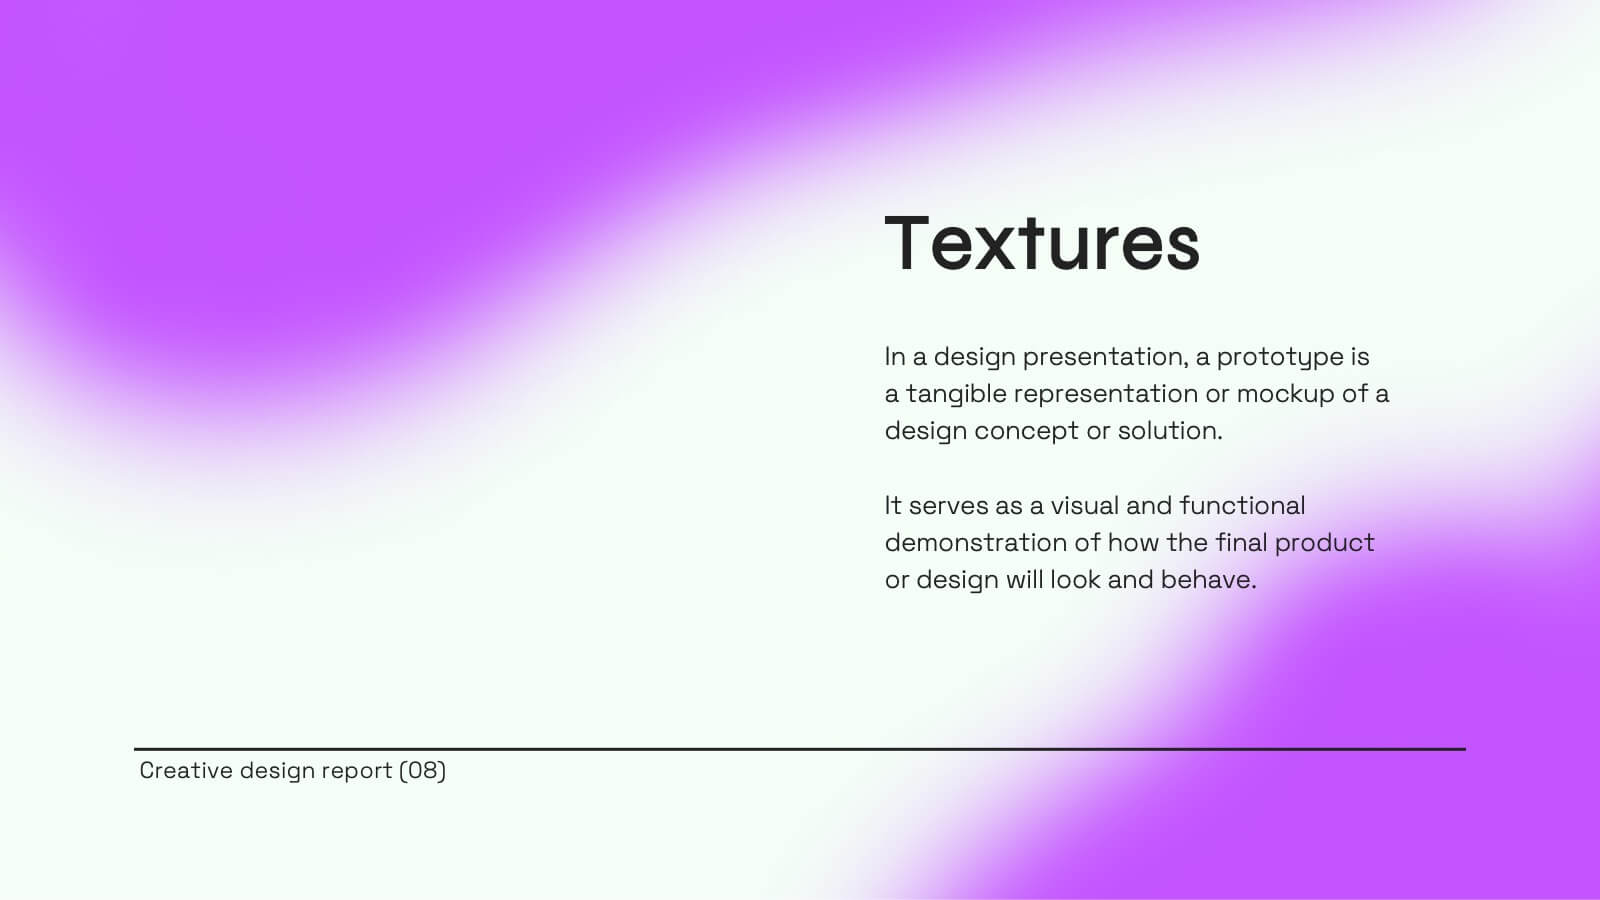
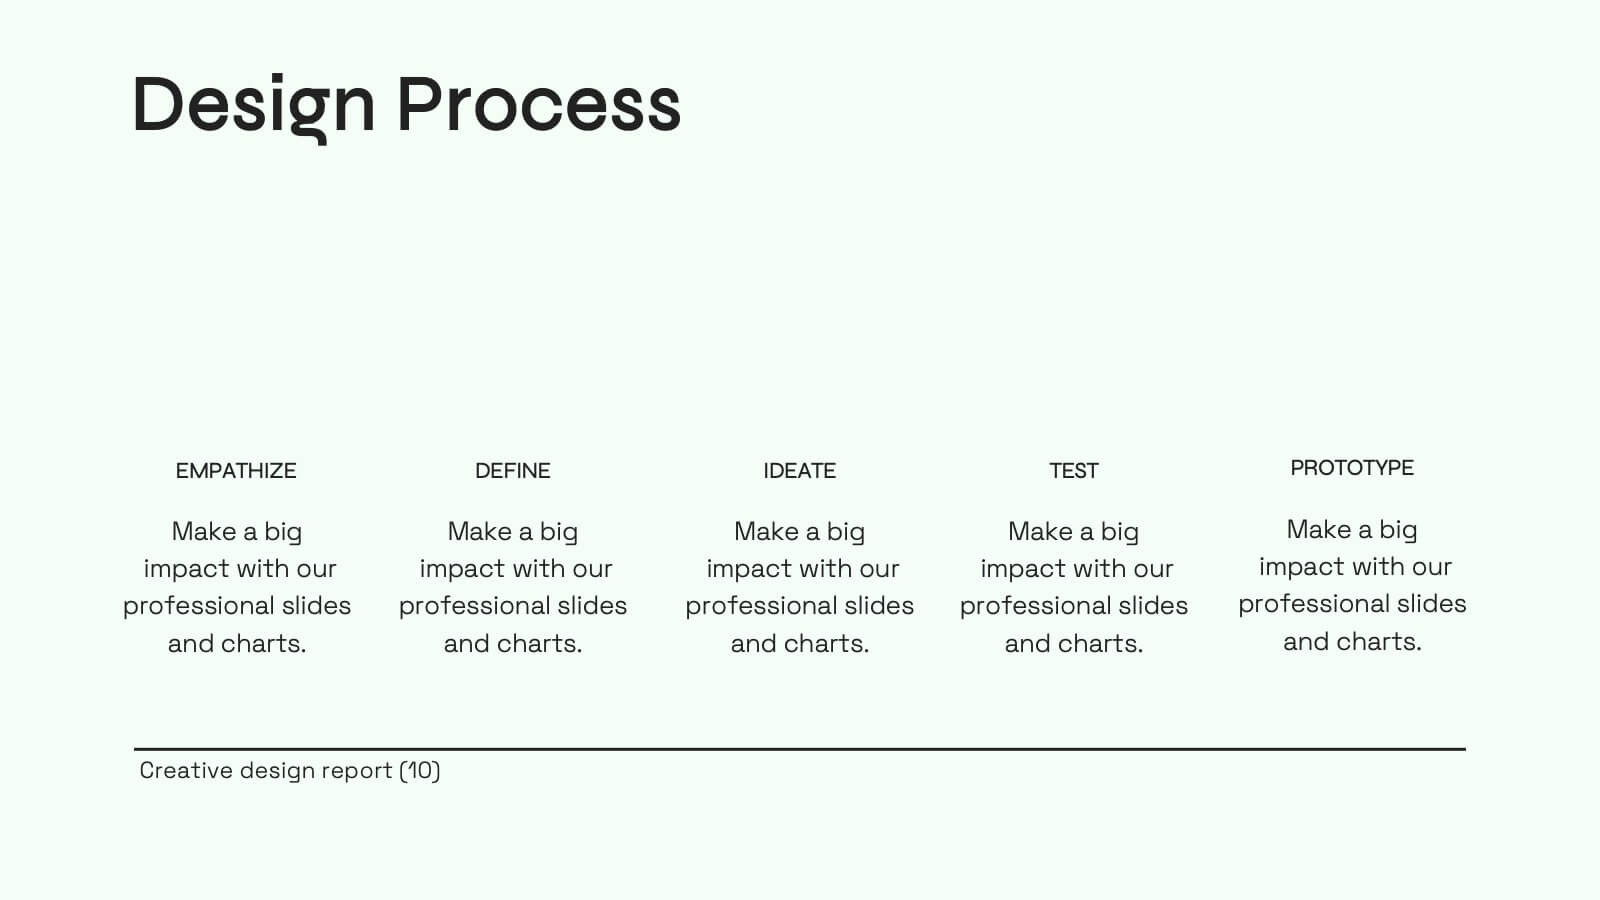
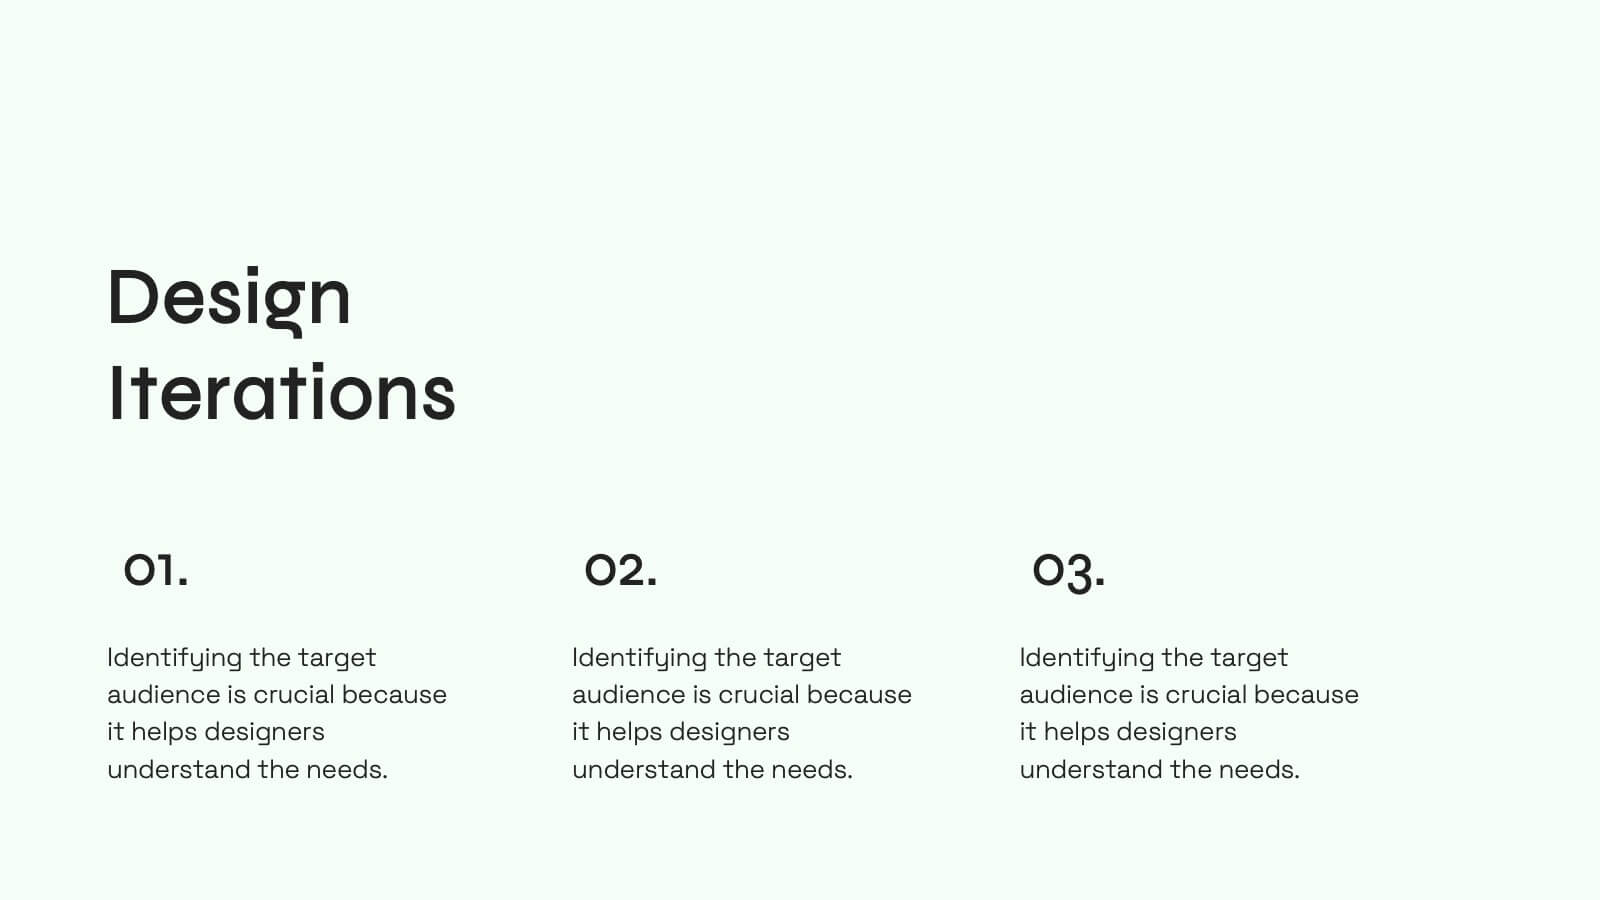
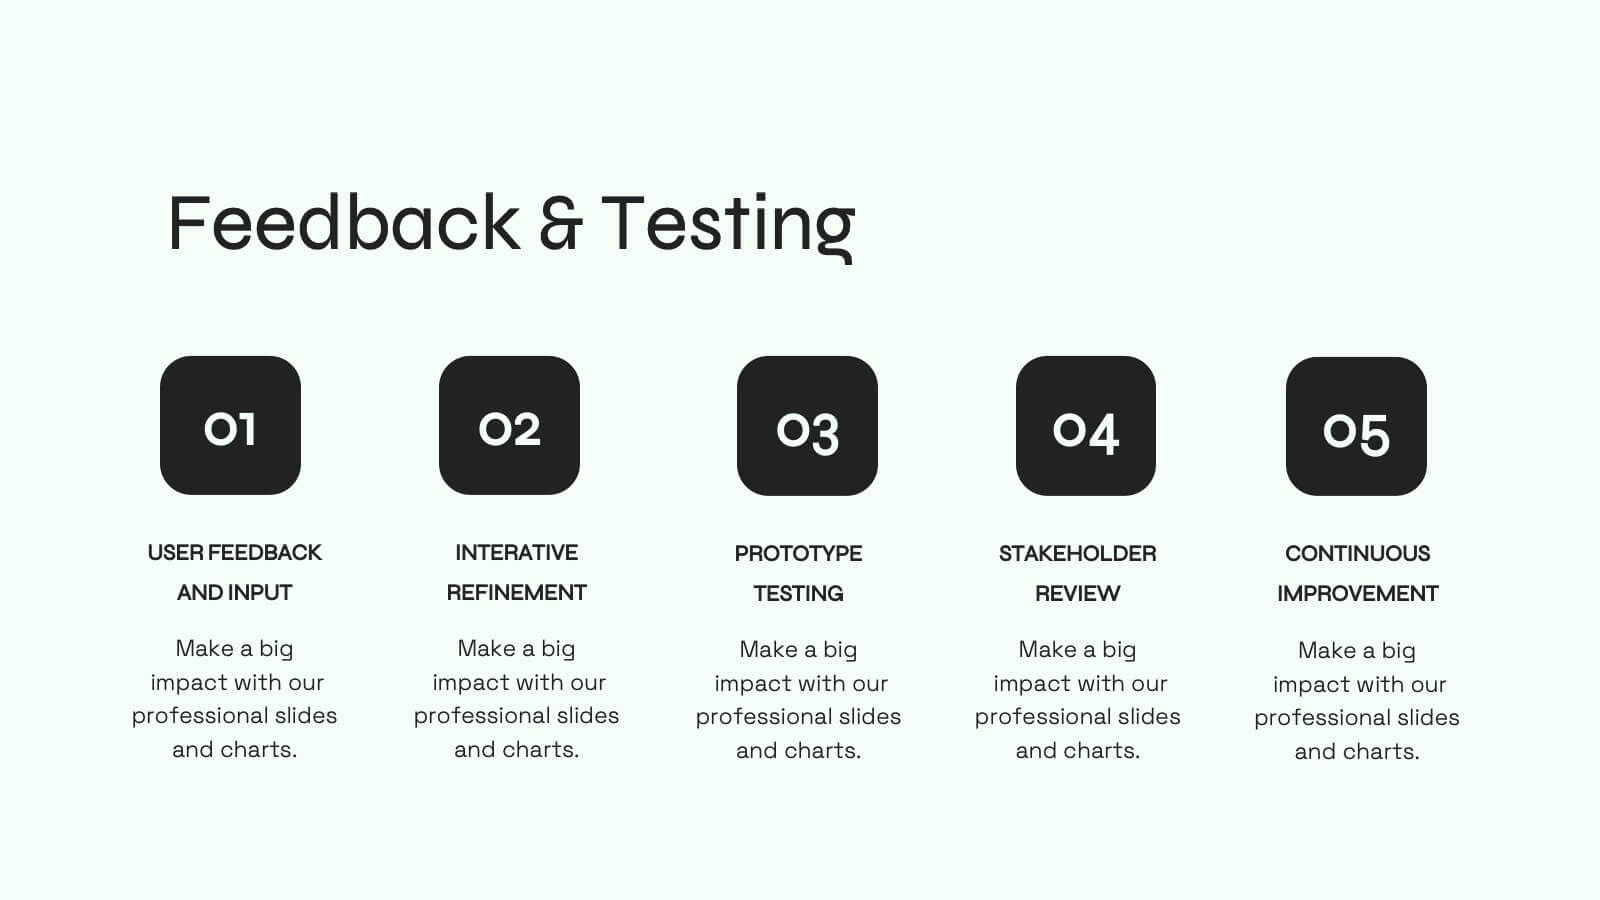
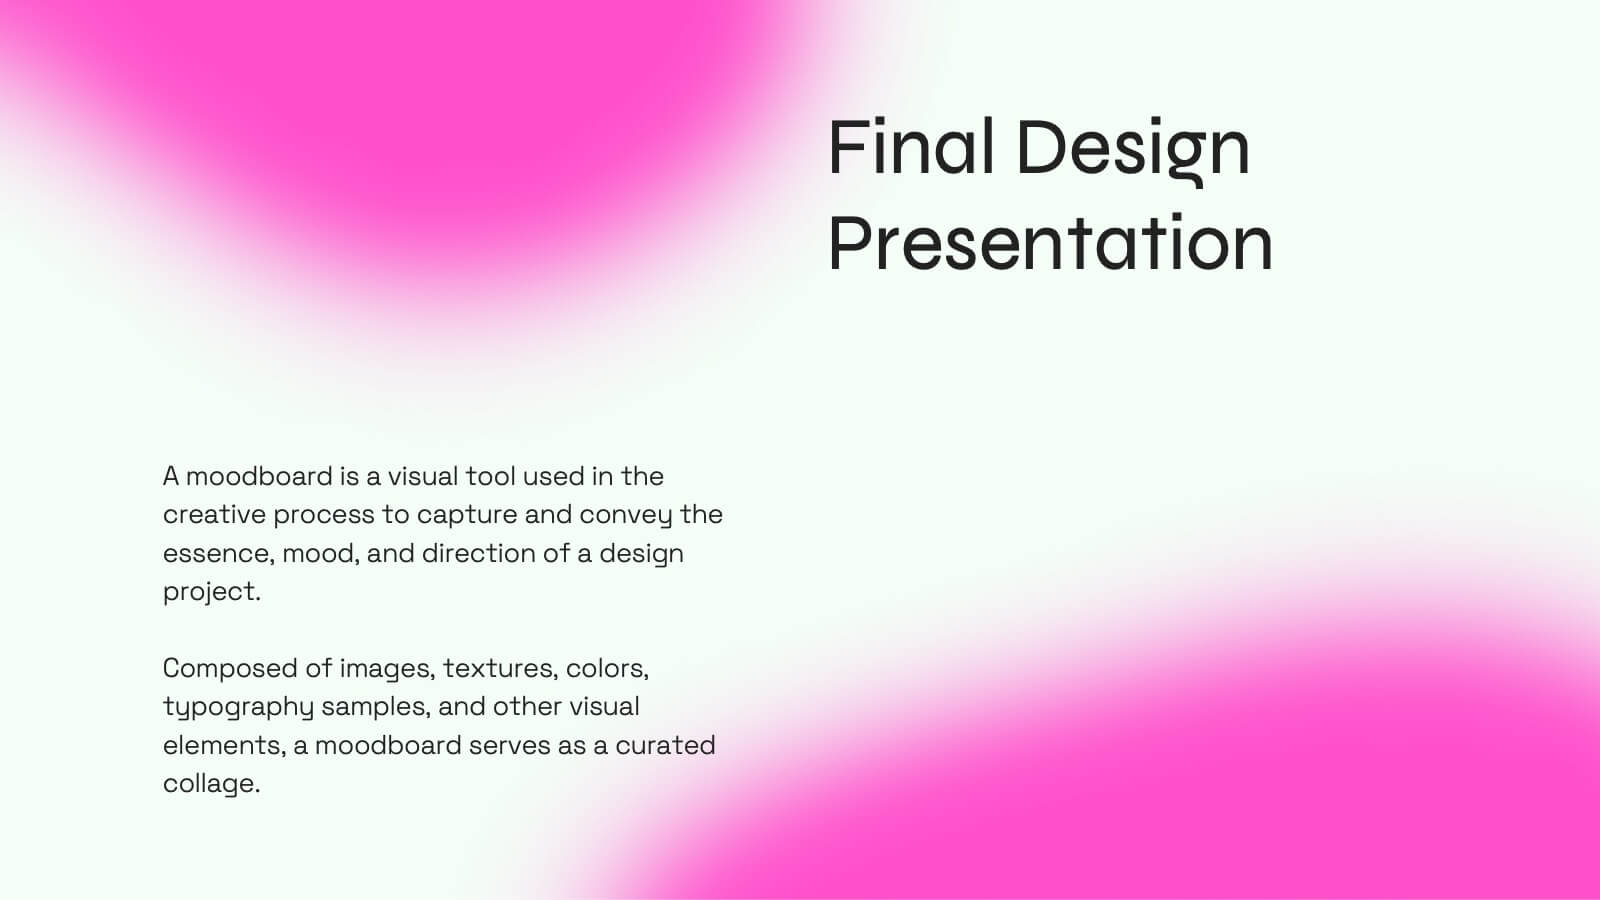
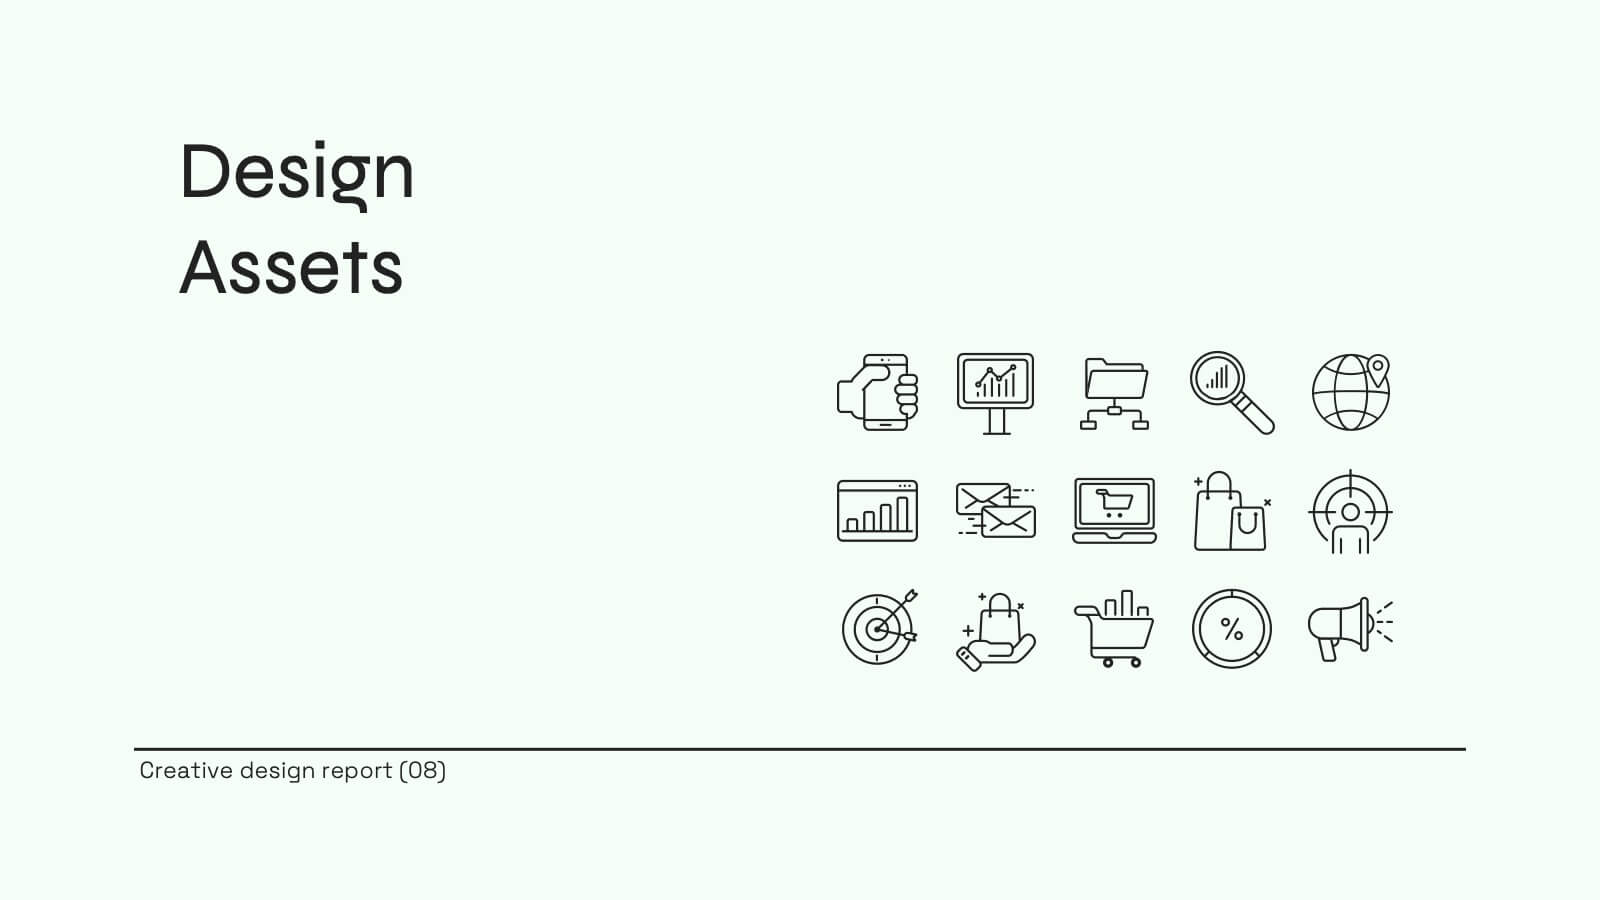
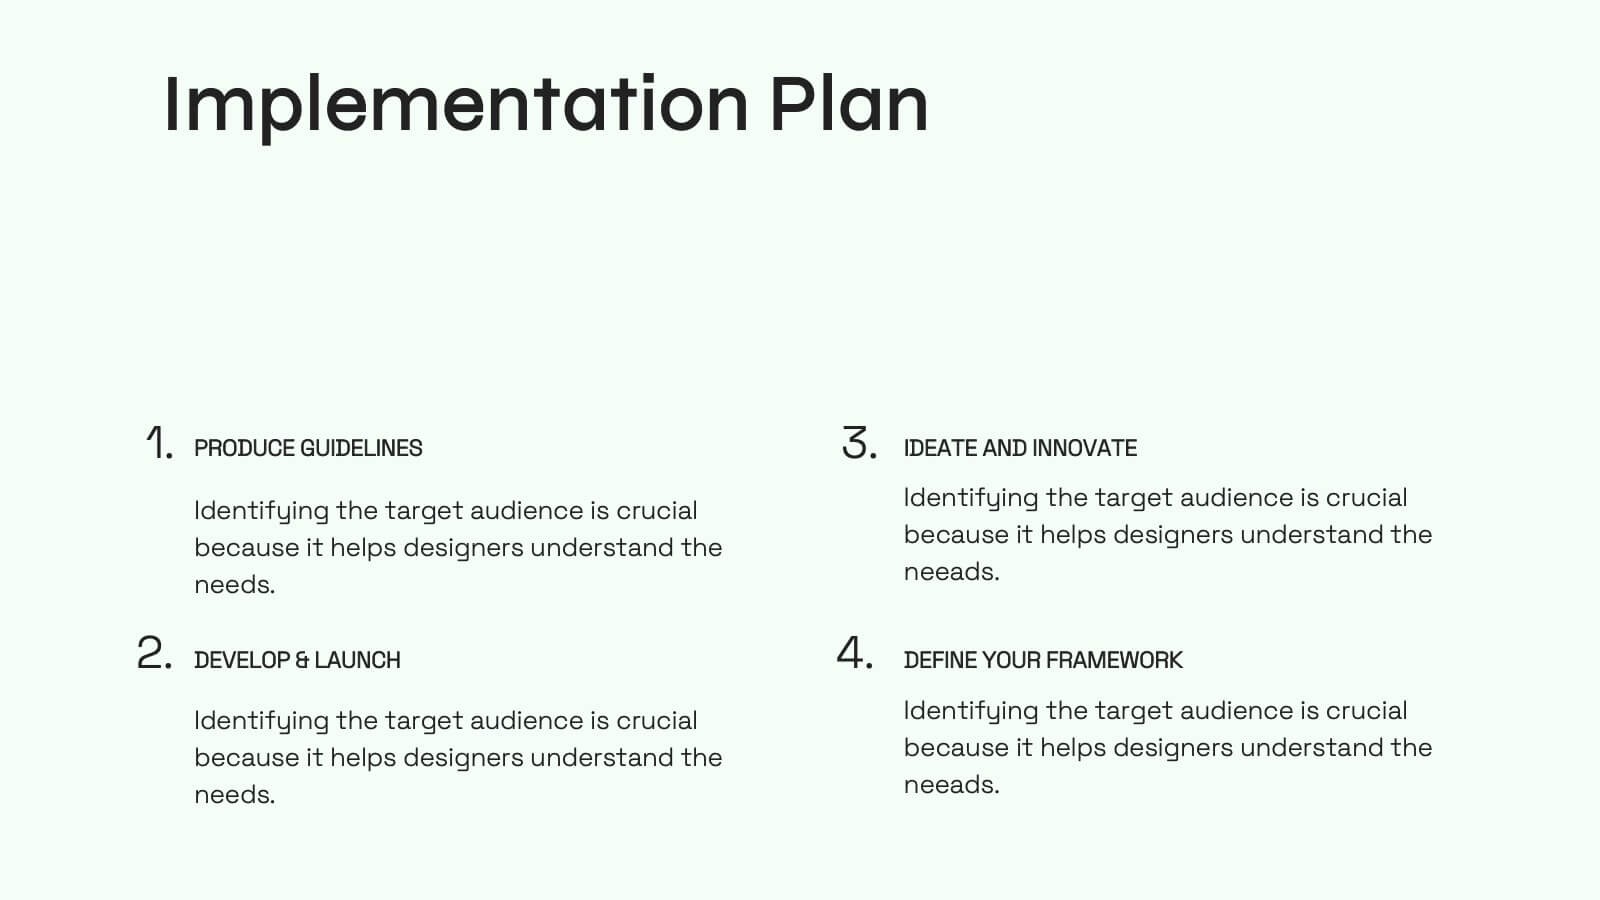
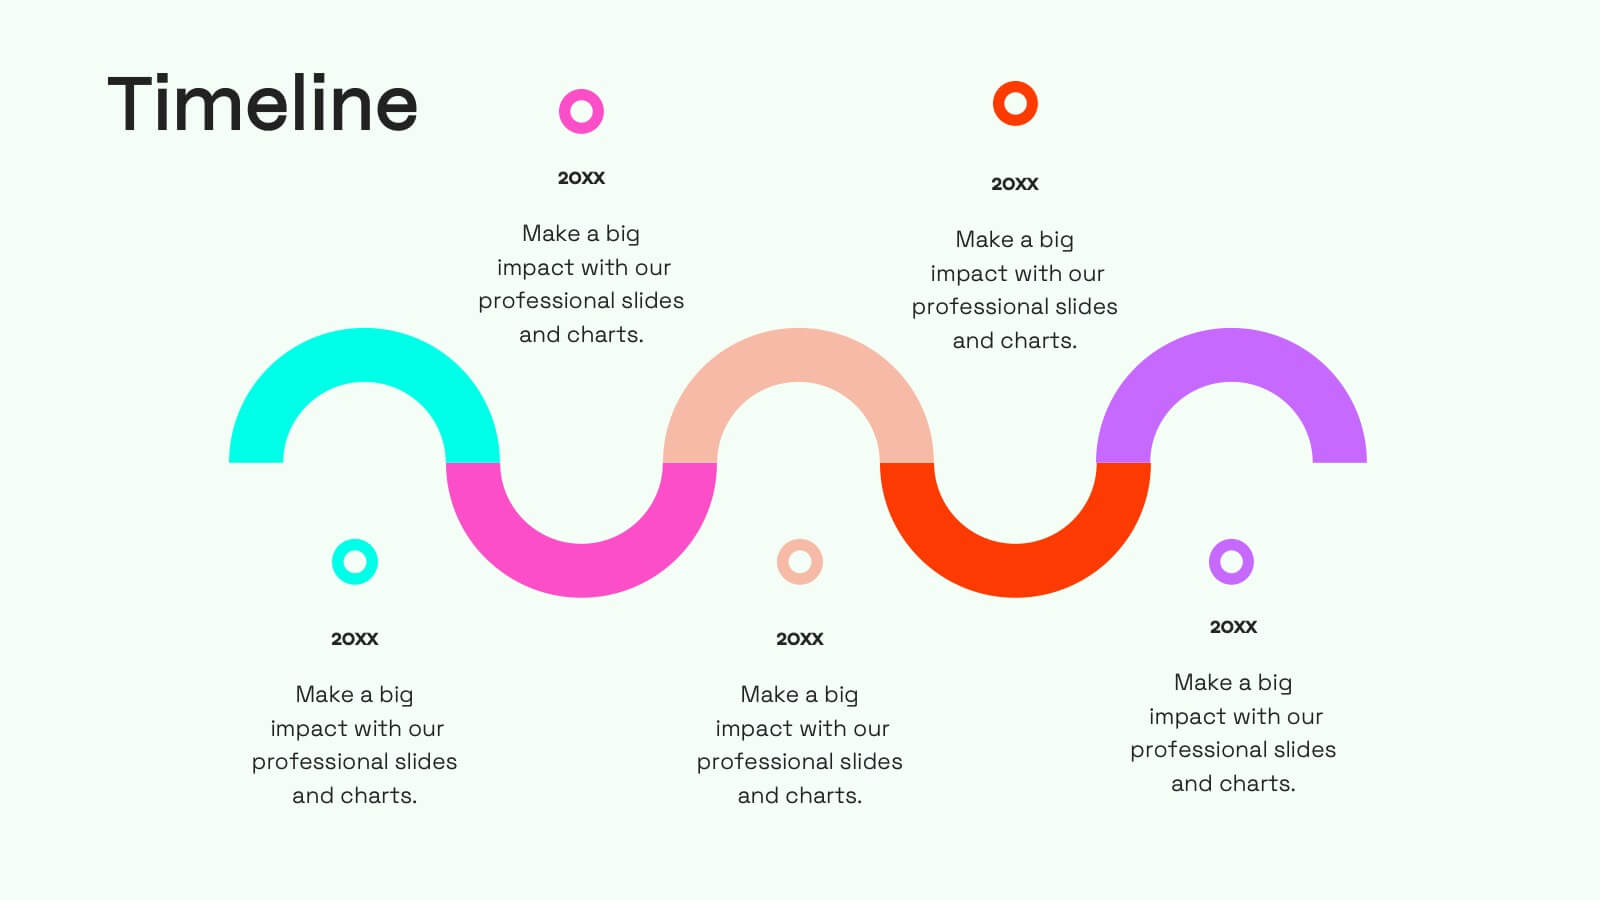
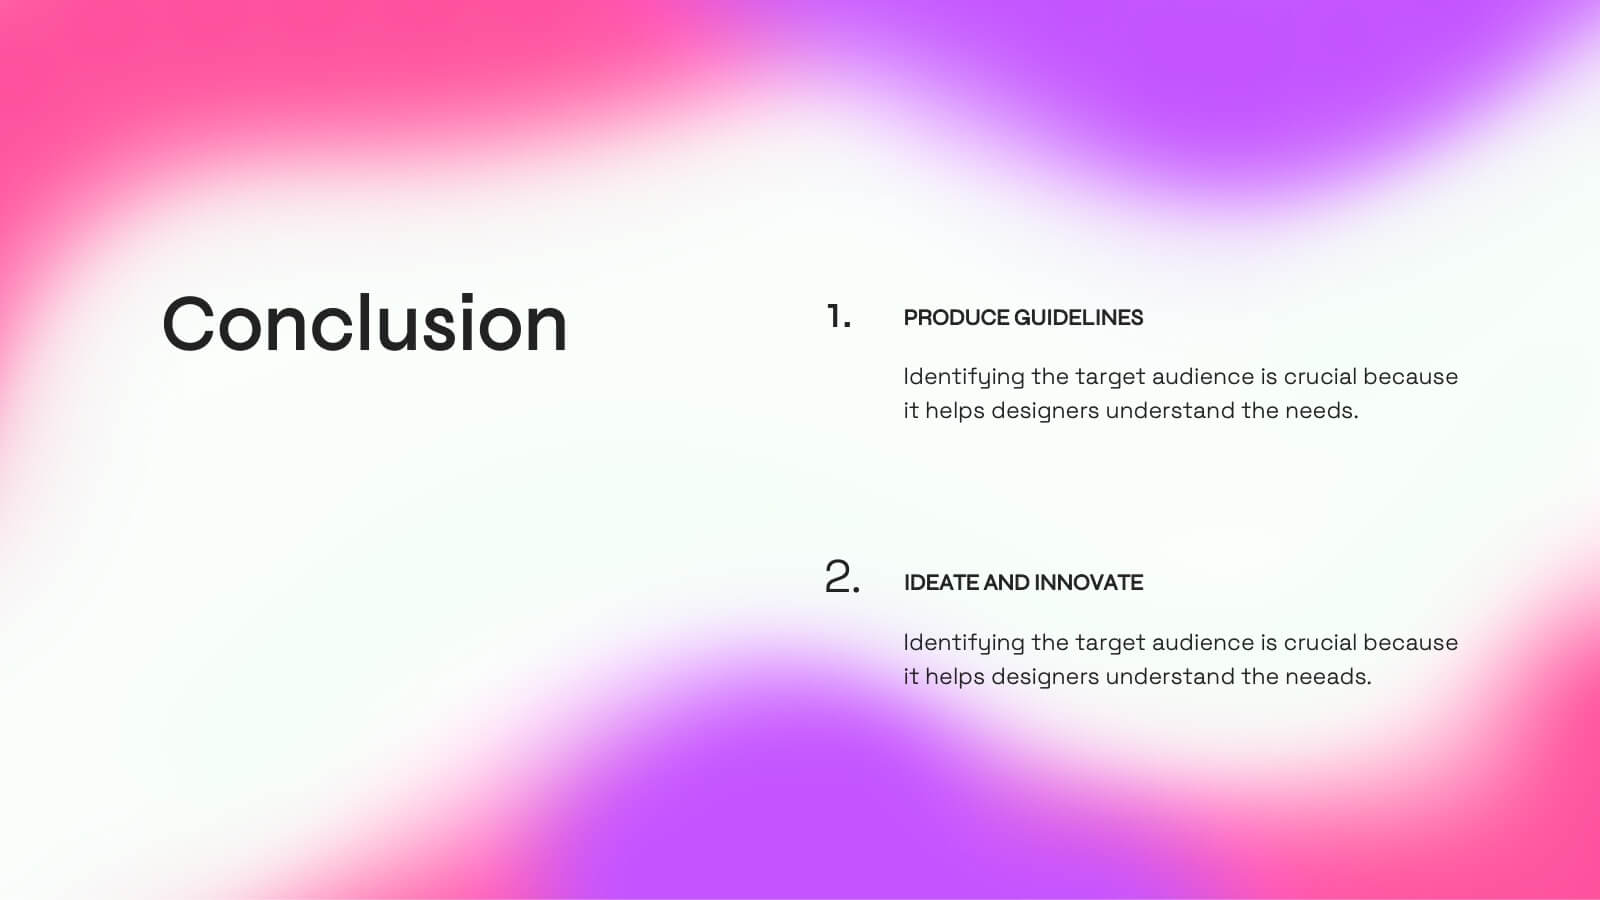
Jade Creative Design Report Presentation
Transform your design report into a captivating visual experience with this elegant jade-themed presentation template! Ideal for showcasing your creative projects, it effectively highlights key concepts, methodologies, and outcomes in a polished format. With its striking design, your work will impress clients and stakeholders alike. Compatible with PowerPoint, Keynote, and Google Slides.


6 diapositivas
Performance Evaluation Infographic
Performance evaluation is a process used by organizations to assess and measure the performance of employees, teams, departments, or the overall organization. This infographic template aims to evaluate how well individuals and groups are meeting their goals and objectives, and involves the use of metrics to quantify performance. This template is designed to provide an overview of the employee's strengths, areas for improvement, and overall performance rating. This infographic is perfect for managers, HR professionals, and organizations for performance reviews to communicate feedback and progress to employees.


8 diapositivas
Mission Objectives and Long-Term Goals Presentation
Clearly define your roadmap with this Mission Objectives and Long-Term Goals presentation. This clean, step-by-step layout is ideal for showcasing strategic milestones, vision pillars, or future goals. Each point is visually aligned for logical progression, making it perfect for planning sessions. Fully editable in Canva, PowerPoint, or Google Slides.


5 diapositivas
Quarterly Revenue and Sales Strategy Presentation
Present your financial focus with clarity using the Quarterly Revenue and Sales Strategy Presentation. This template features a modern donut chart in the center with five labeled segments, making it easy to highlight sales goals, performance metrics, or revenue streams. Ideal for quarterly reviews, growth plans, or stakeholder updates. Fully editable in Canva, PowerPoint, and Google Slides.


5 diapositivas
Climate Change Awareness Presentation
Deliver impactful environmental messages with this thermometer-style infographic layout. Ideal for visualizing temperature rise, emissions levels, or awareness metrics, each slide segment represents a stage of climate impact. Perfect for educators, NGOs, sustainability experts, or policy presentations. Fully customizable in PowerPoint, Keynote, and Google Slides.


8 diapositivas
Corporate Risk Assessment and Planning Presentation
Navigate business uncertainties with the Corporate Risk Assessment and Planning template, offering a vivid and structured layout designed for professionals to meticulously detail and analyze potential risks in various business scenarios. It uses hexagonal and circular elements to emphasize the interconnectedness of various risk factors, supporting clear visualization and effective strategic planning. This template is compatible with PowerPoint, Keynote, and Google Slides, making it a versatile tool for comprehensive risk management presentations.


6 diapositivas
Annual Report Company Infographic
An annual report is a comprehensive document that provides an overview of a company's performance and financial activities over the course of a year. This Infographic template is a great way to present key highlights, accomplishments, and data from a year in a visually engaging and concise format. Designing an Annual Report Infographic can effectively convey the year's achievements and progress to stakeholders, investors, clients, and employees in a visually compelling and concise manner. This is designed to gather feedback from colleagues, team members, or stakeholders and make any necessary revisions to enhance the clarity and impact of the infographic.


3 diapositivas
Project Summary Data Report Presentation
Track and visualize project progress with the Project Summary Data Report template. This slide includes structured sections for project names, financial data, team size, duration, and task completion rates, making it ideal for business reviews and team meetings. Fully customizable and compatible with PowerPoint, Keynote, and Google Slides.


6 diapositivas
Product Development Roadmap Presentation
Visualize your innovation journey with this Product Development Roadmap template. Perfect for outlining each stage from concept to launch, it keeps teams aligned on goals and timelines. Ideal for startups, tech teams, or product managers. Fully editable in PowerPoint, Keynote, and Google Slides for flexible, streamlined use.


6 diapositivas
IT Infrastructure and Services Management Presentation
Visualize key operations clearly with the IT Infrastructure and Services Management Presentation. This slide features a circular diagram paired with five editable content blocks—perfect for mapping infrastructure elements like networks, servers, and tools. The icon-ring design adds clarity and structure to complex workflows. Fully compatible with PowerPoint, Keynote, and Google Slides.


7 diapositivas
Problem Infographic
These slides focus on presenting problem statements and their contexts in a professional and accessible format. The use of a soft, consistent color palette helps to keep the presentation visually appealing while ensuring that the content remains the focal point. Each slide is designed with ample space for text and icons, which aids in breaking down complex issues into understandable segments. The variety of layouts ensures that you can tailor the presentation to the nature of the problem being addressed, whether it requires more textual explanations or benefits from the use of infographics and icons. These templates are well-suited for business meetings, academic presentations, or any scenario where clear communication of challenges is necessary. They can be effectively used to initiate discussions, brainstorm solutions, or simply to highlight issues that need attention in a structured and organized manner.


20 diapositivas
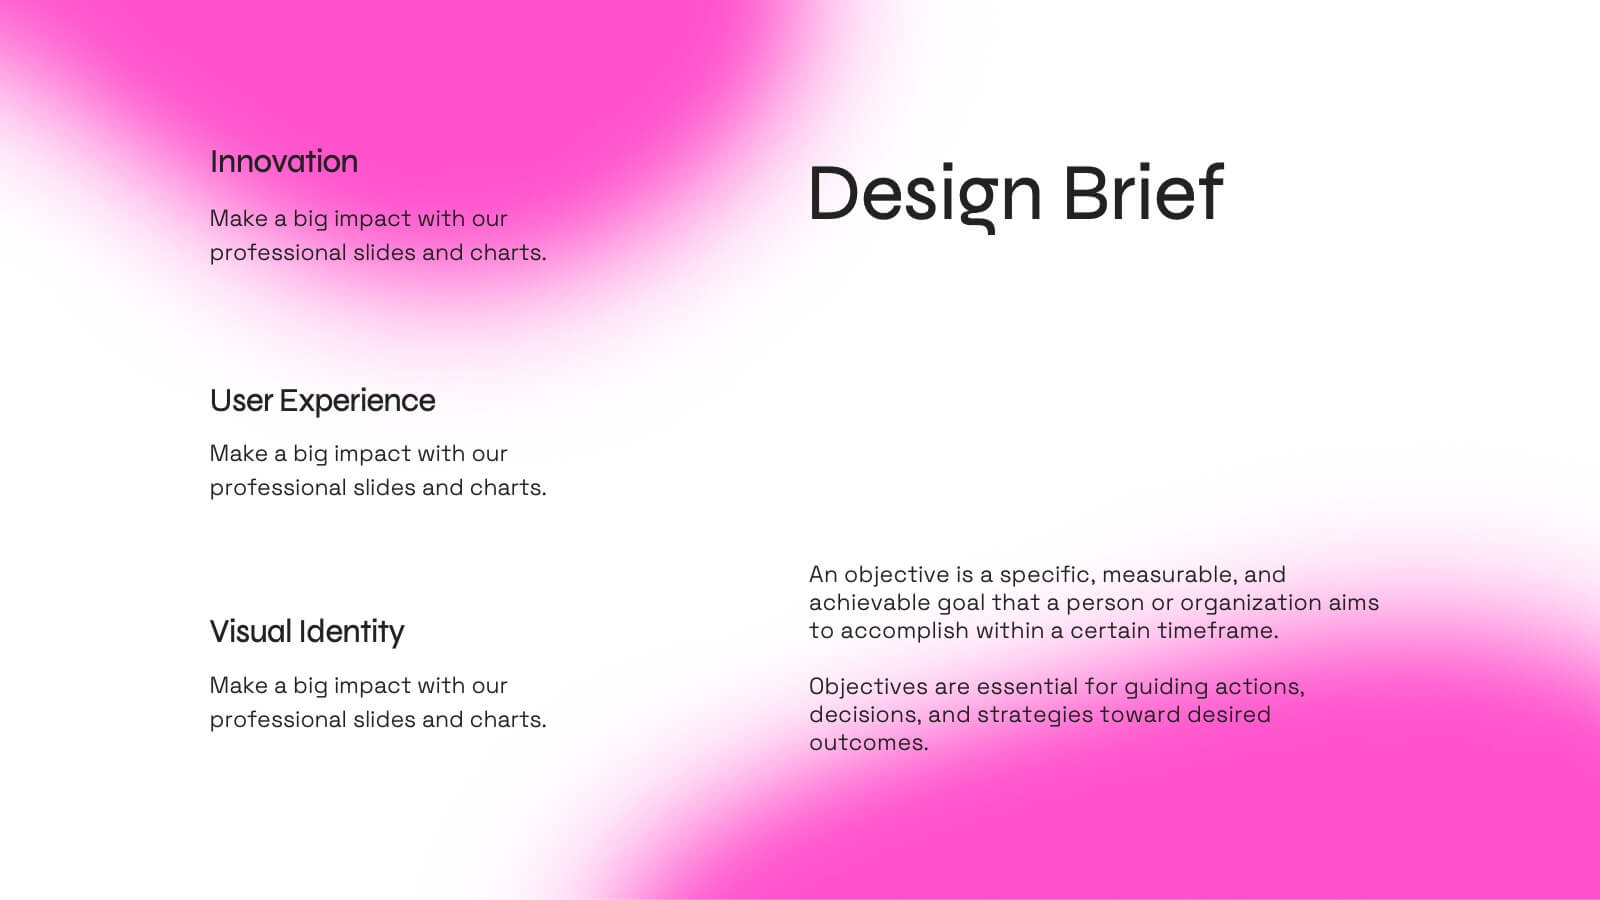
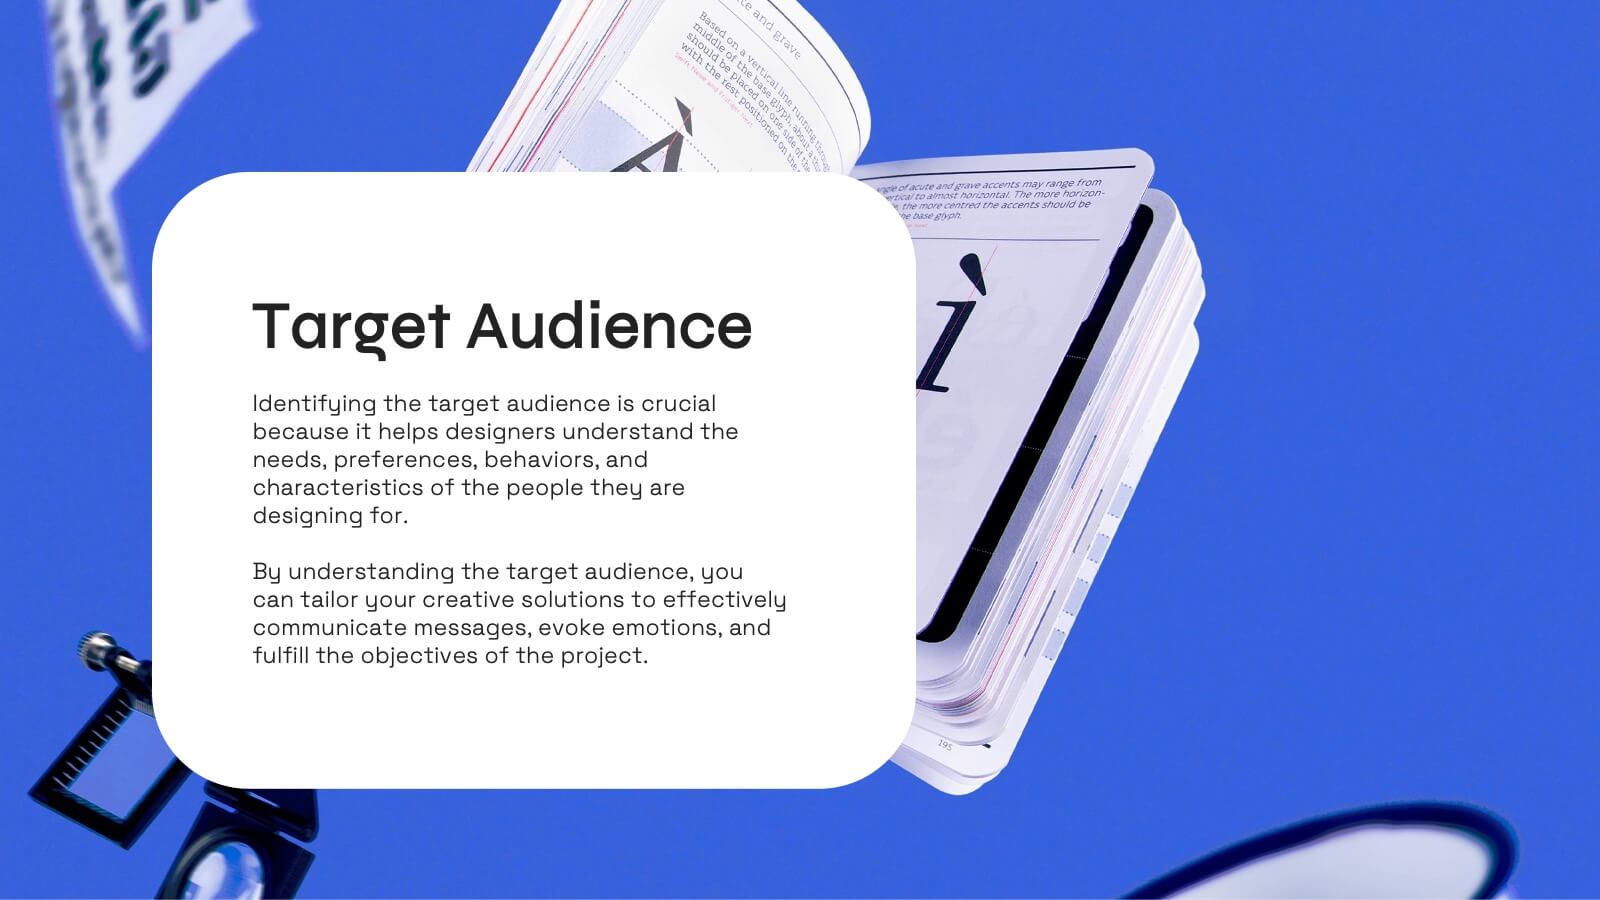
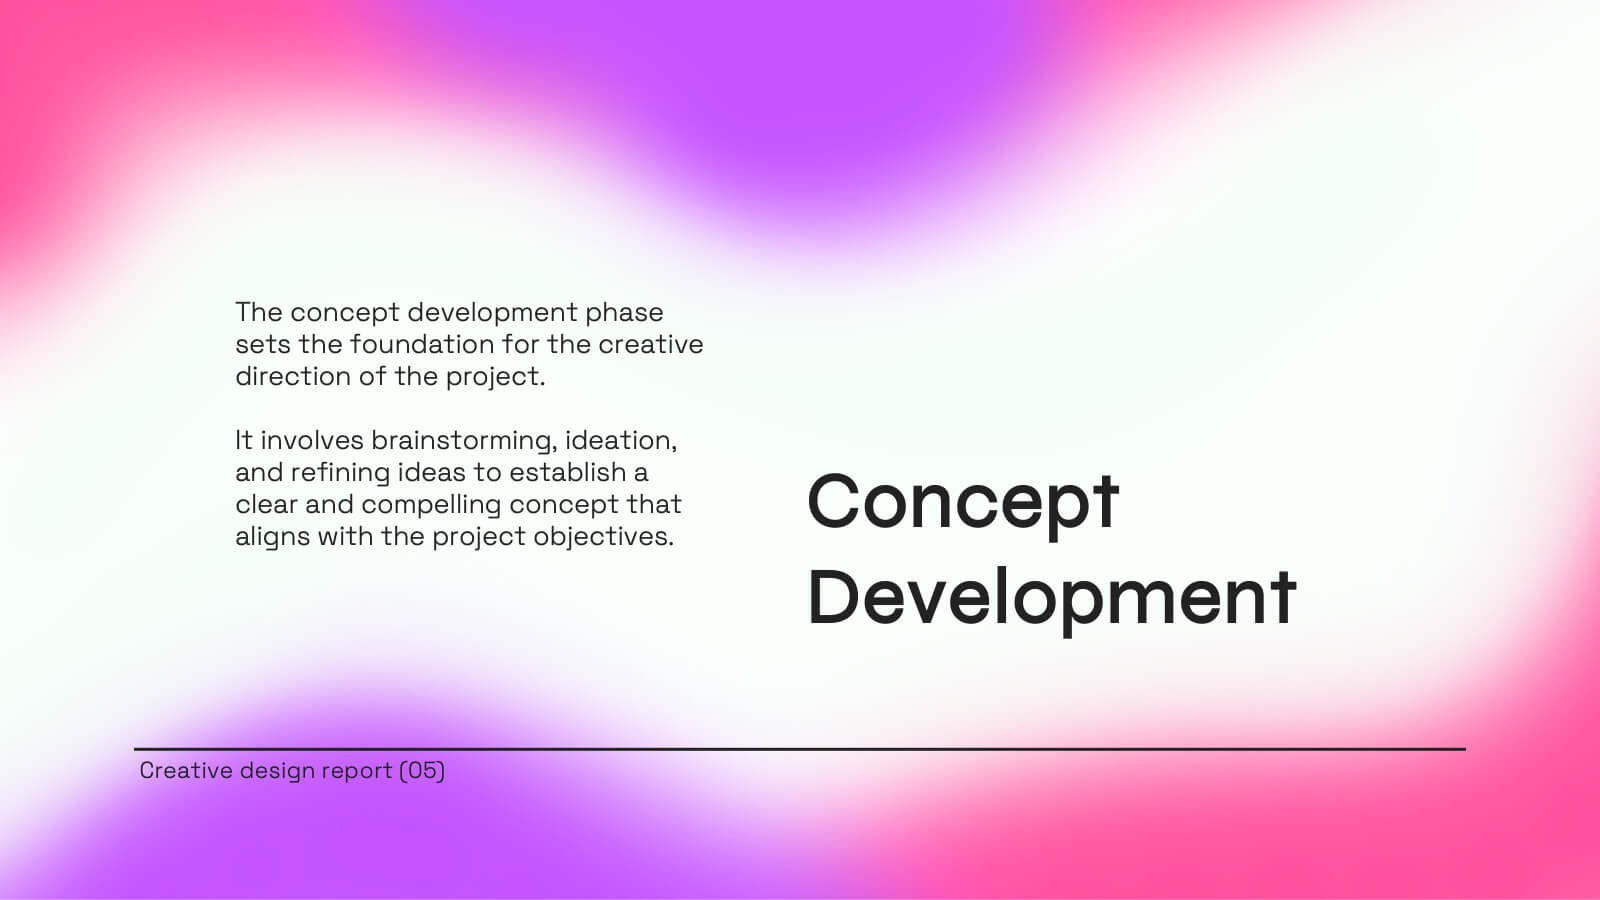
Ascent Design Strategy Proposal Presentation
A minimalist and sleek template ideal for presenting design strategy and development. Includes sections for design brief, audience insights, concept development, design elements, prototyping, and feedback. Suitable for design professionals to showcase visual direction and project timelines. Fully customizable in PowerPoint, Keynote, and Google Slides for versatile presentations.


4 diapositivas
Step-by-Step 30-60-90 Milestones Presentation
Present clear onboarding or strategic progressions with the Step-by-Step 30-60-90 Milestones Presentation. This layout is ideal for showcasing phased plans, goal tracking, and employee integration milestones over time. Each segment highlights a distinct 30-, 60-, and 90-day focus, helping visualize stepwise achievement clearly. Fully editable in PowerPoint, Keynote, and Google Slides.


6 diapositivas
12-Month Calendar Overview Presentation
Kick off your planning with a clean, colorful layout that makes every month easy to visualize at a glance. This presentation helps you map timelines, milestones, and deadlines in a structured format ideal for yearly planning. Fully editable and compatible with PowerPoint, Keynote, and Google Slides.


4 diapositivas
Corporate Role Hierarchy Structure Presentation
Visualize your company’s reporting structure with this modern corporate role hierarchy diagram. Perfect for team overviews, leadership charts, or onboarding sessions. Each role node is clearly connected for easy understanding. Fully editable in Canva, PowerPoint, or Google Slides—ideal for HR teams, managers, or organizational planning presentations.