


Características


¿Tienes alguna pregunta?
Recomendar


4 diapositivas
Product Launch Schedule Timeline Presentation
Showcase your product rollout with this vertical rocket-themed timeline. Ideal for startups, marketing teams, or product managers, it highlights four key stages with icons and editable text. The cloud-based design adds visual flair while maintaining clarity. Fully customizable in PowerPoint, Keynote, and Google Slides to suit your launch plan.


21 diapositivas
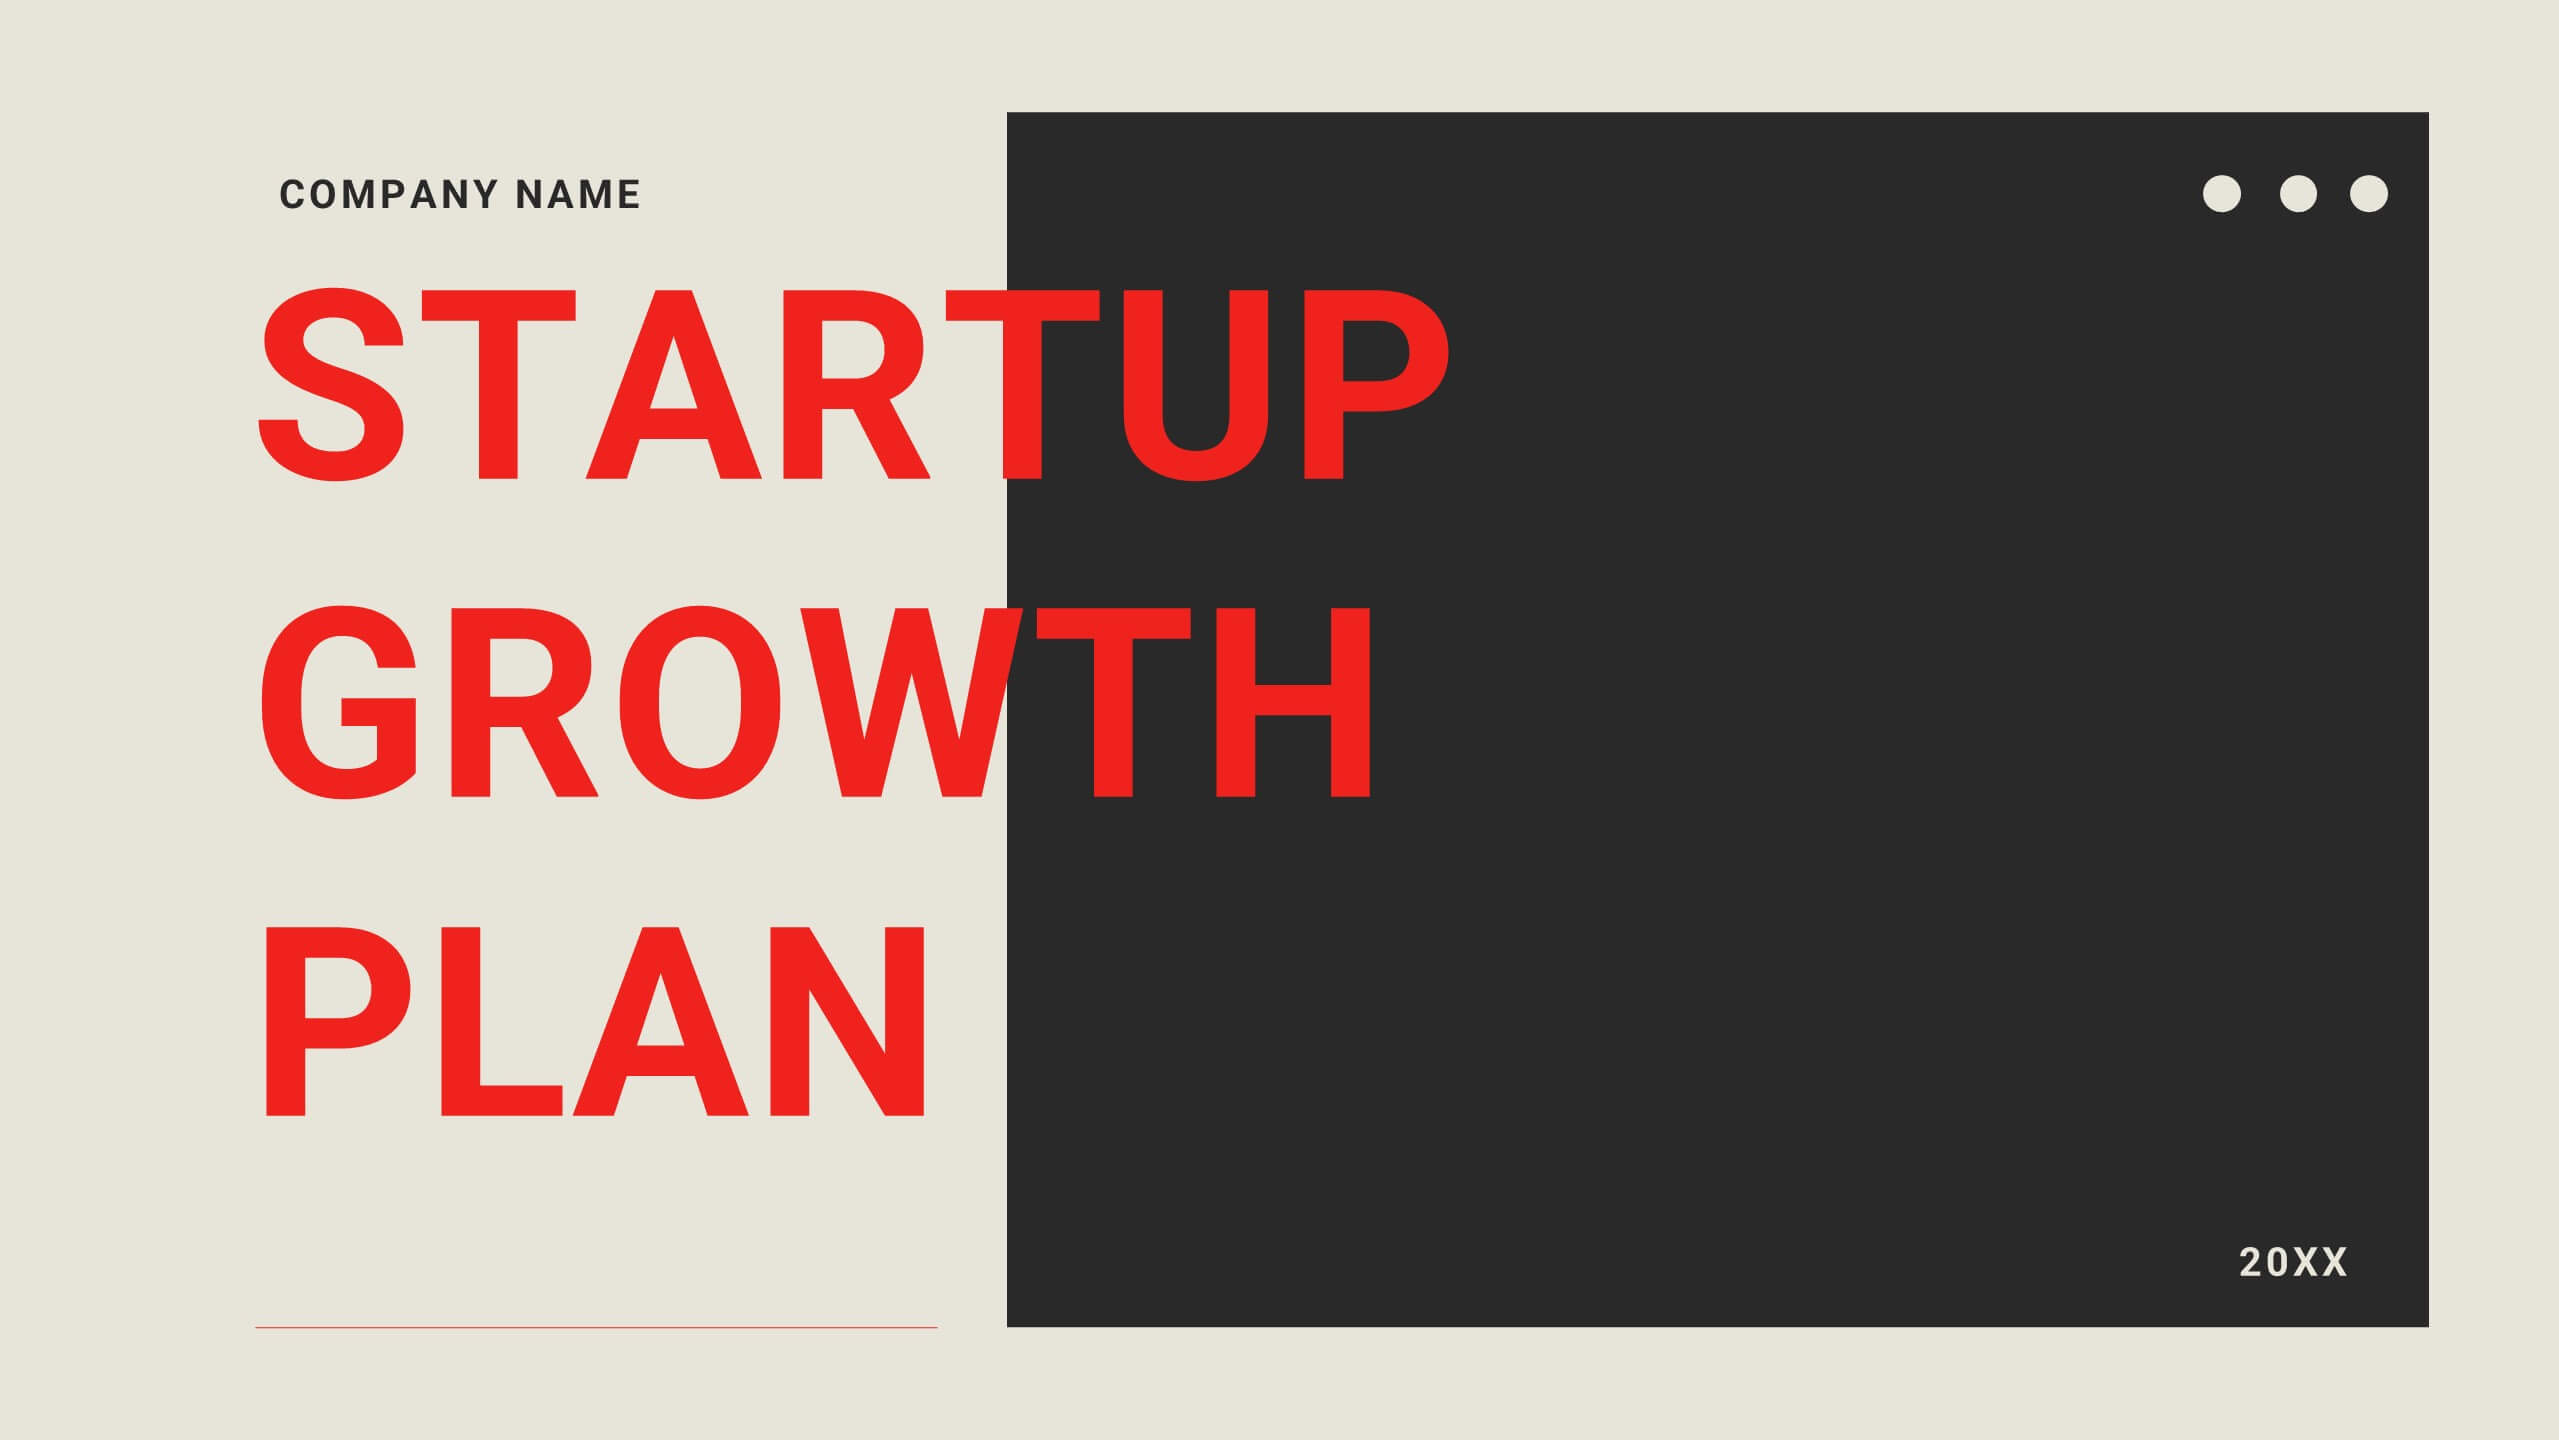
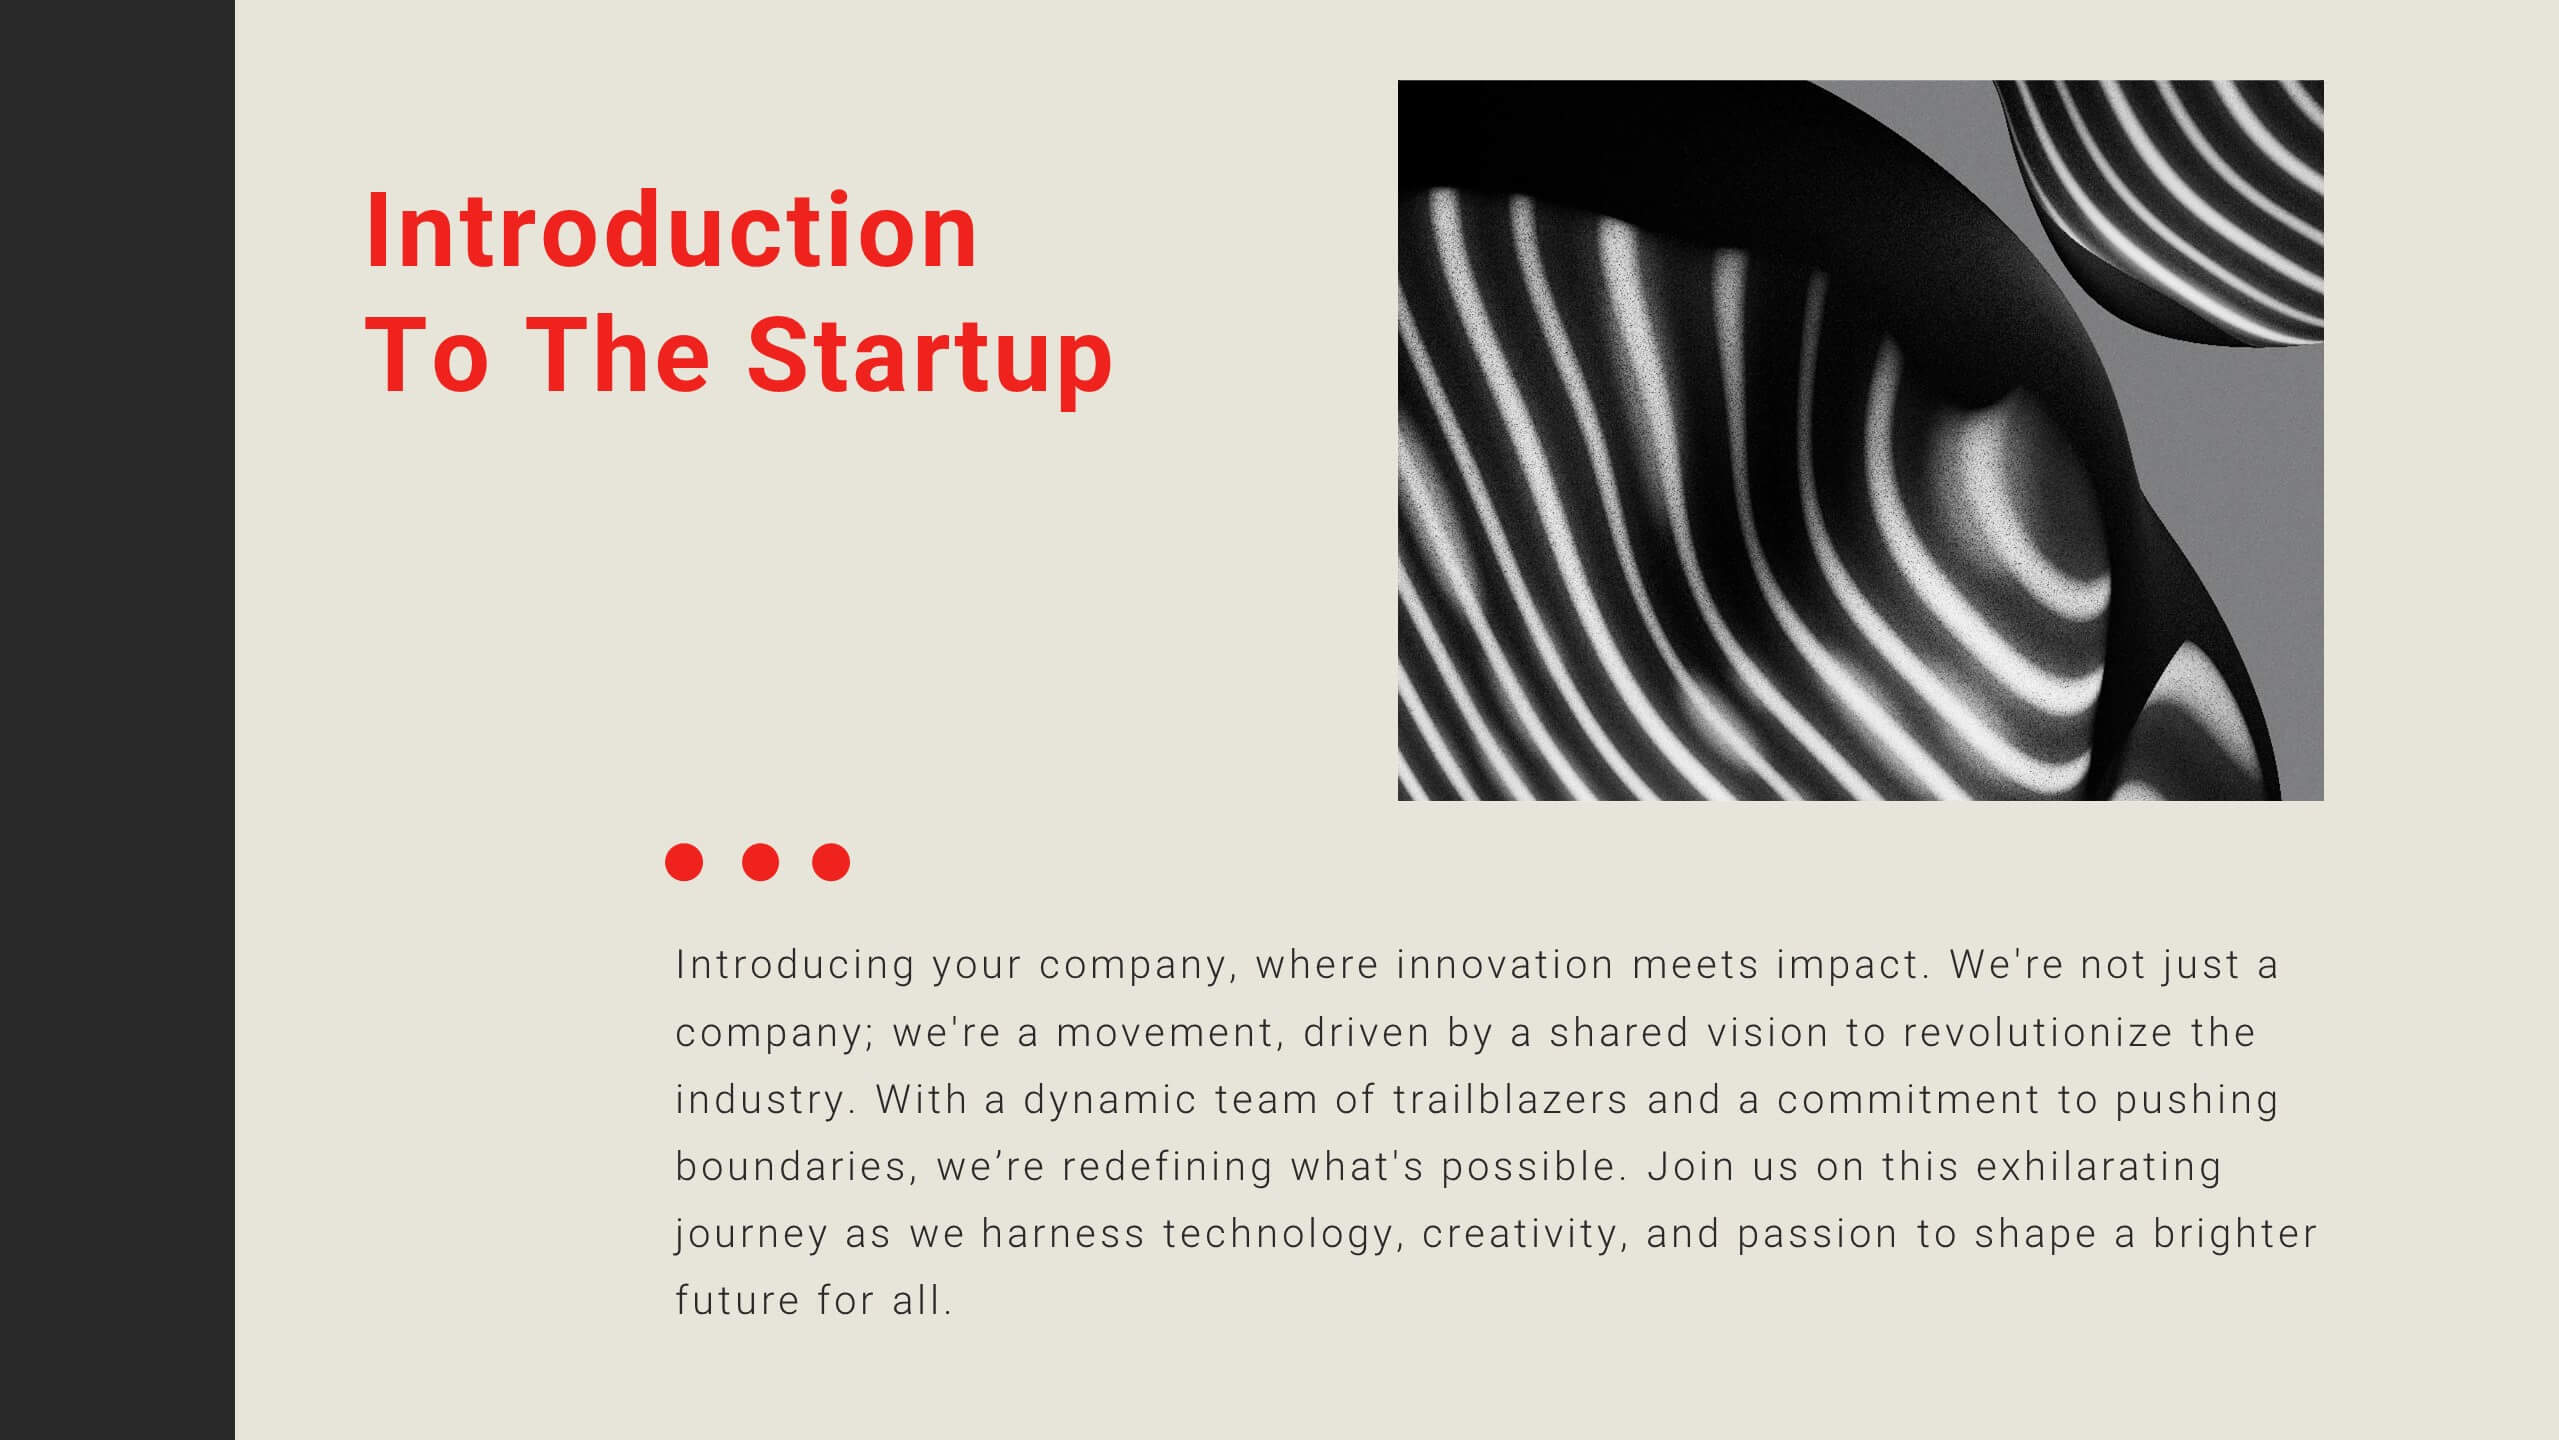
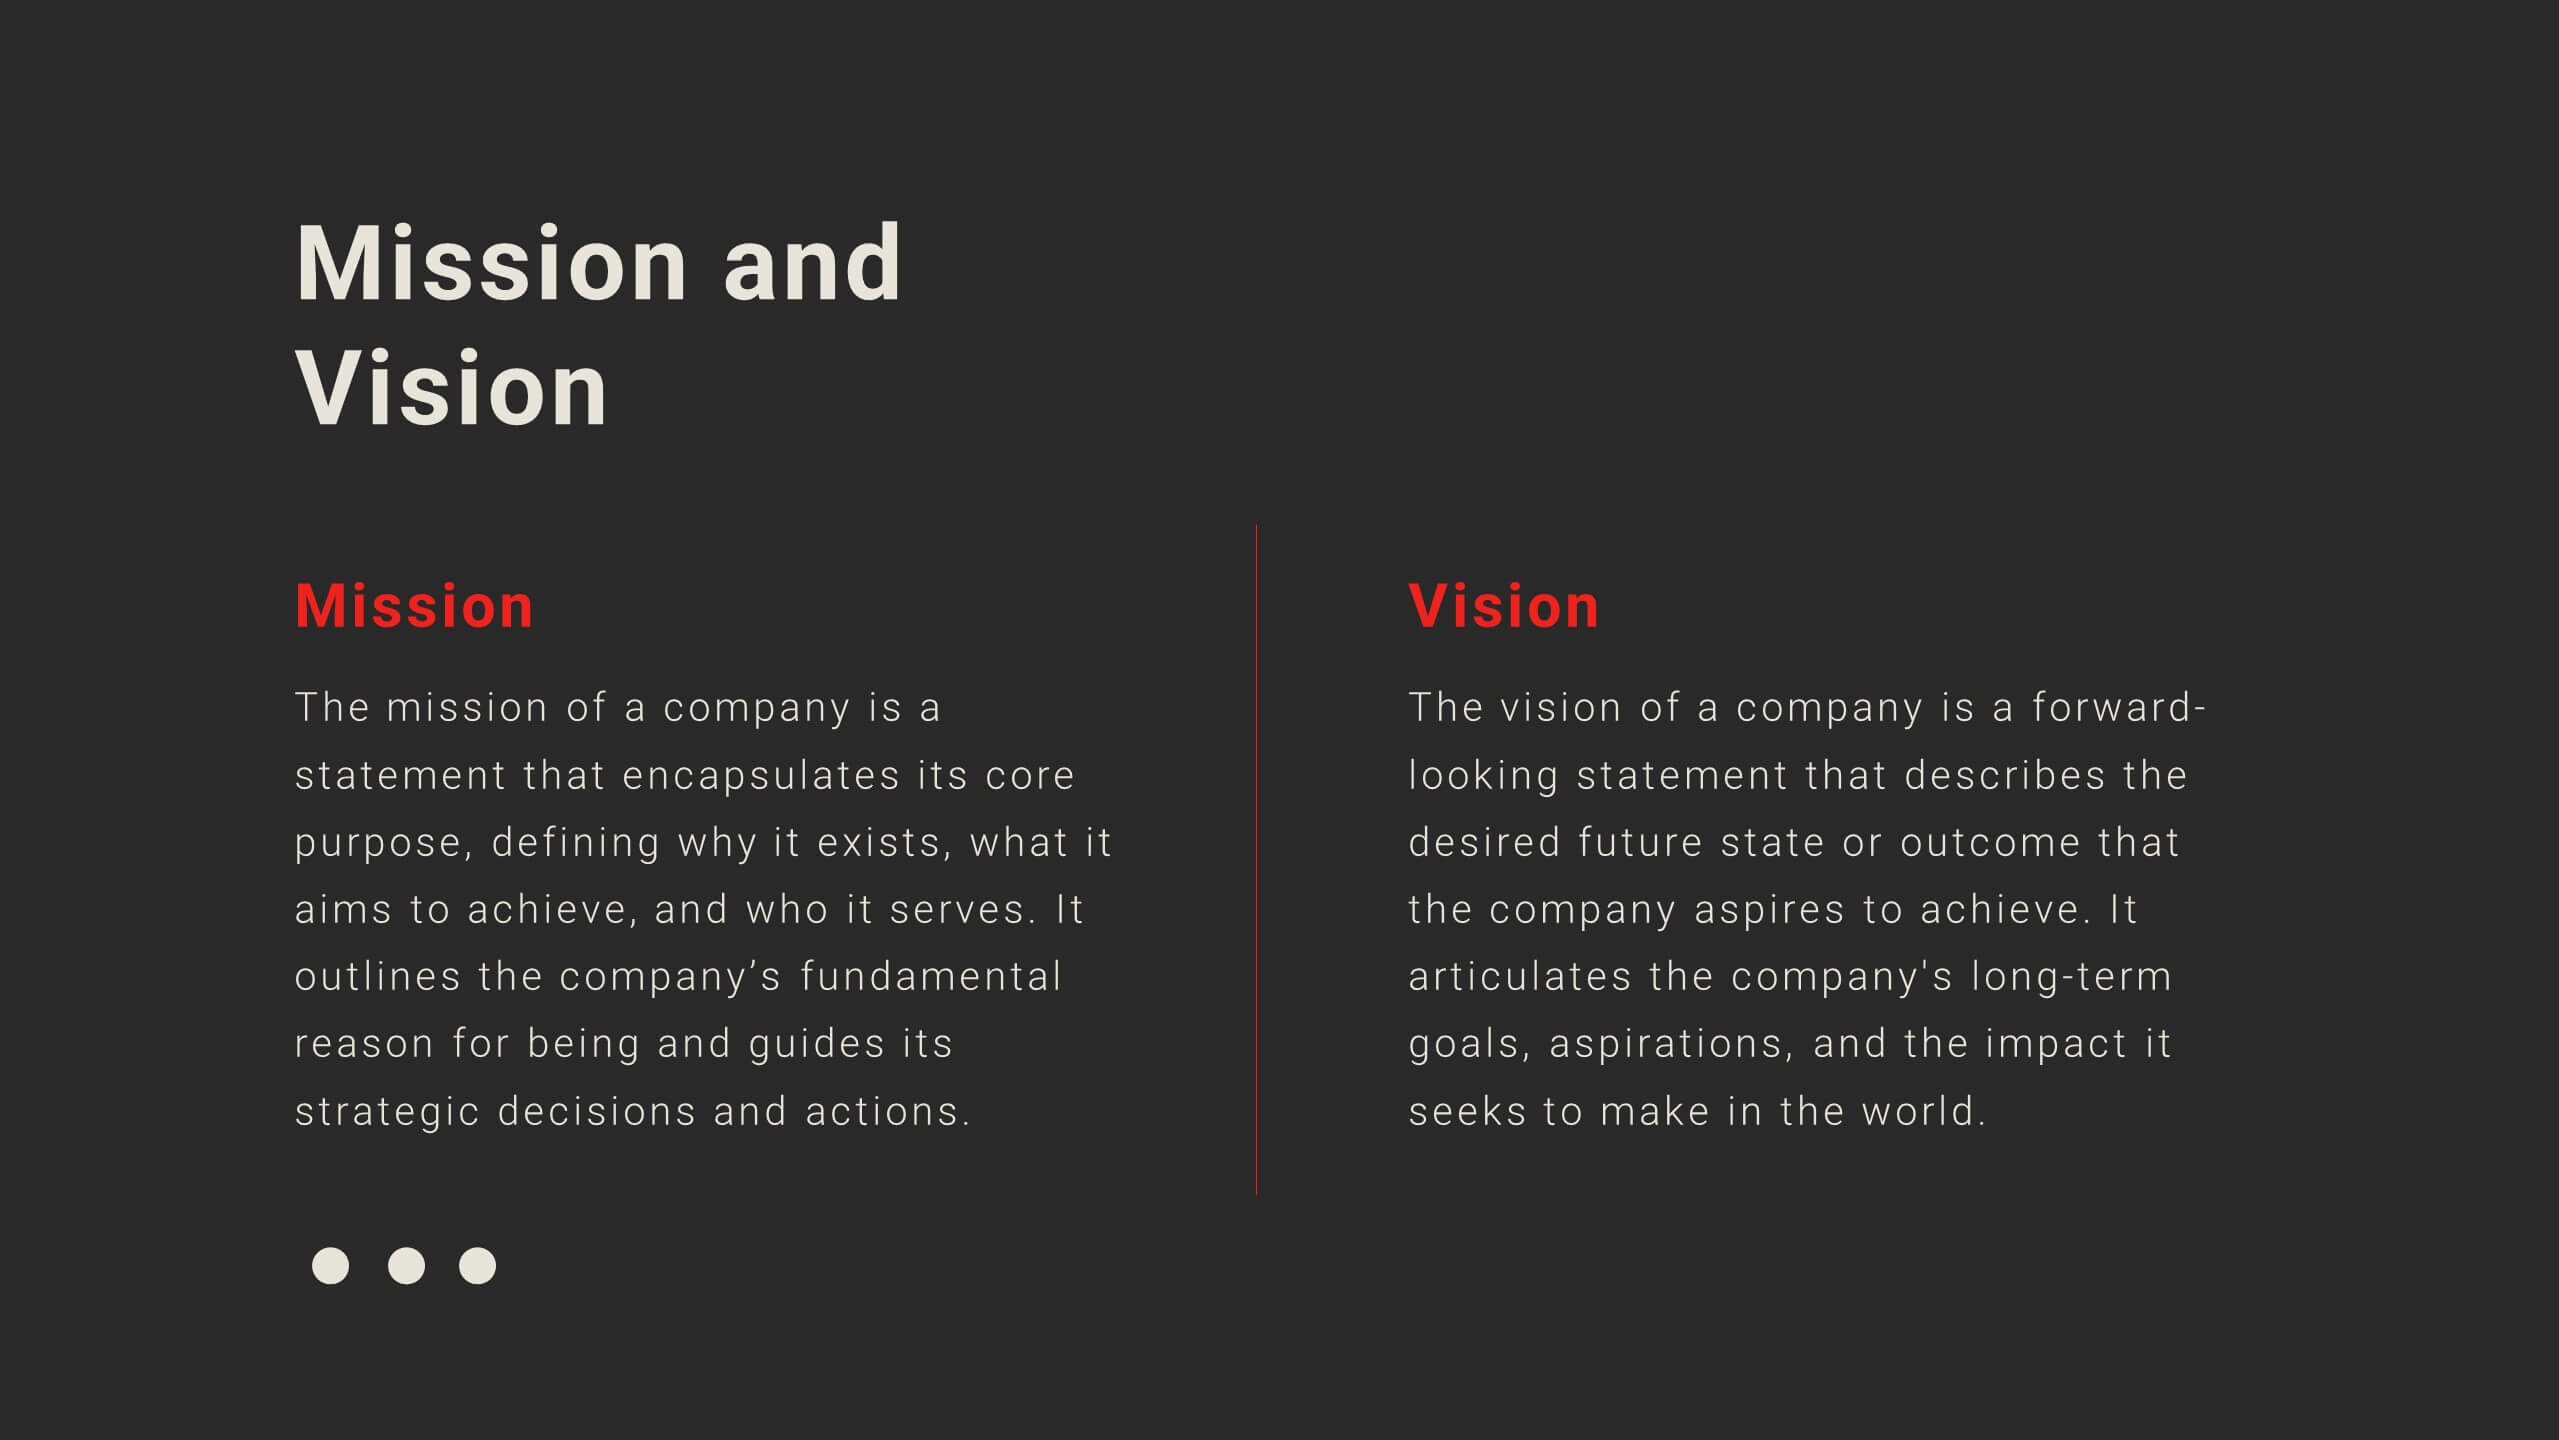
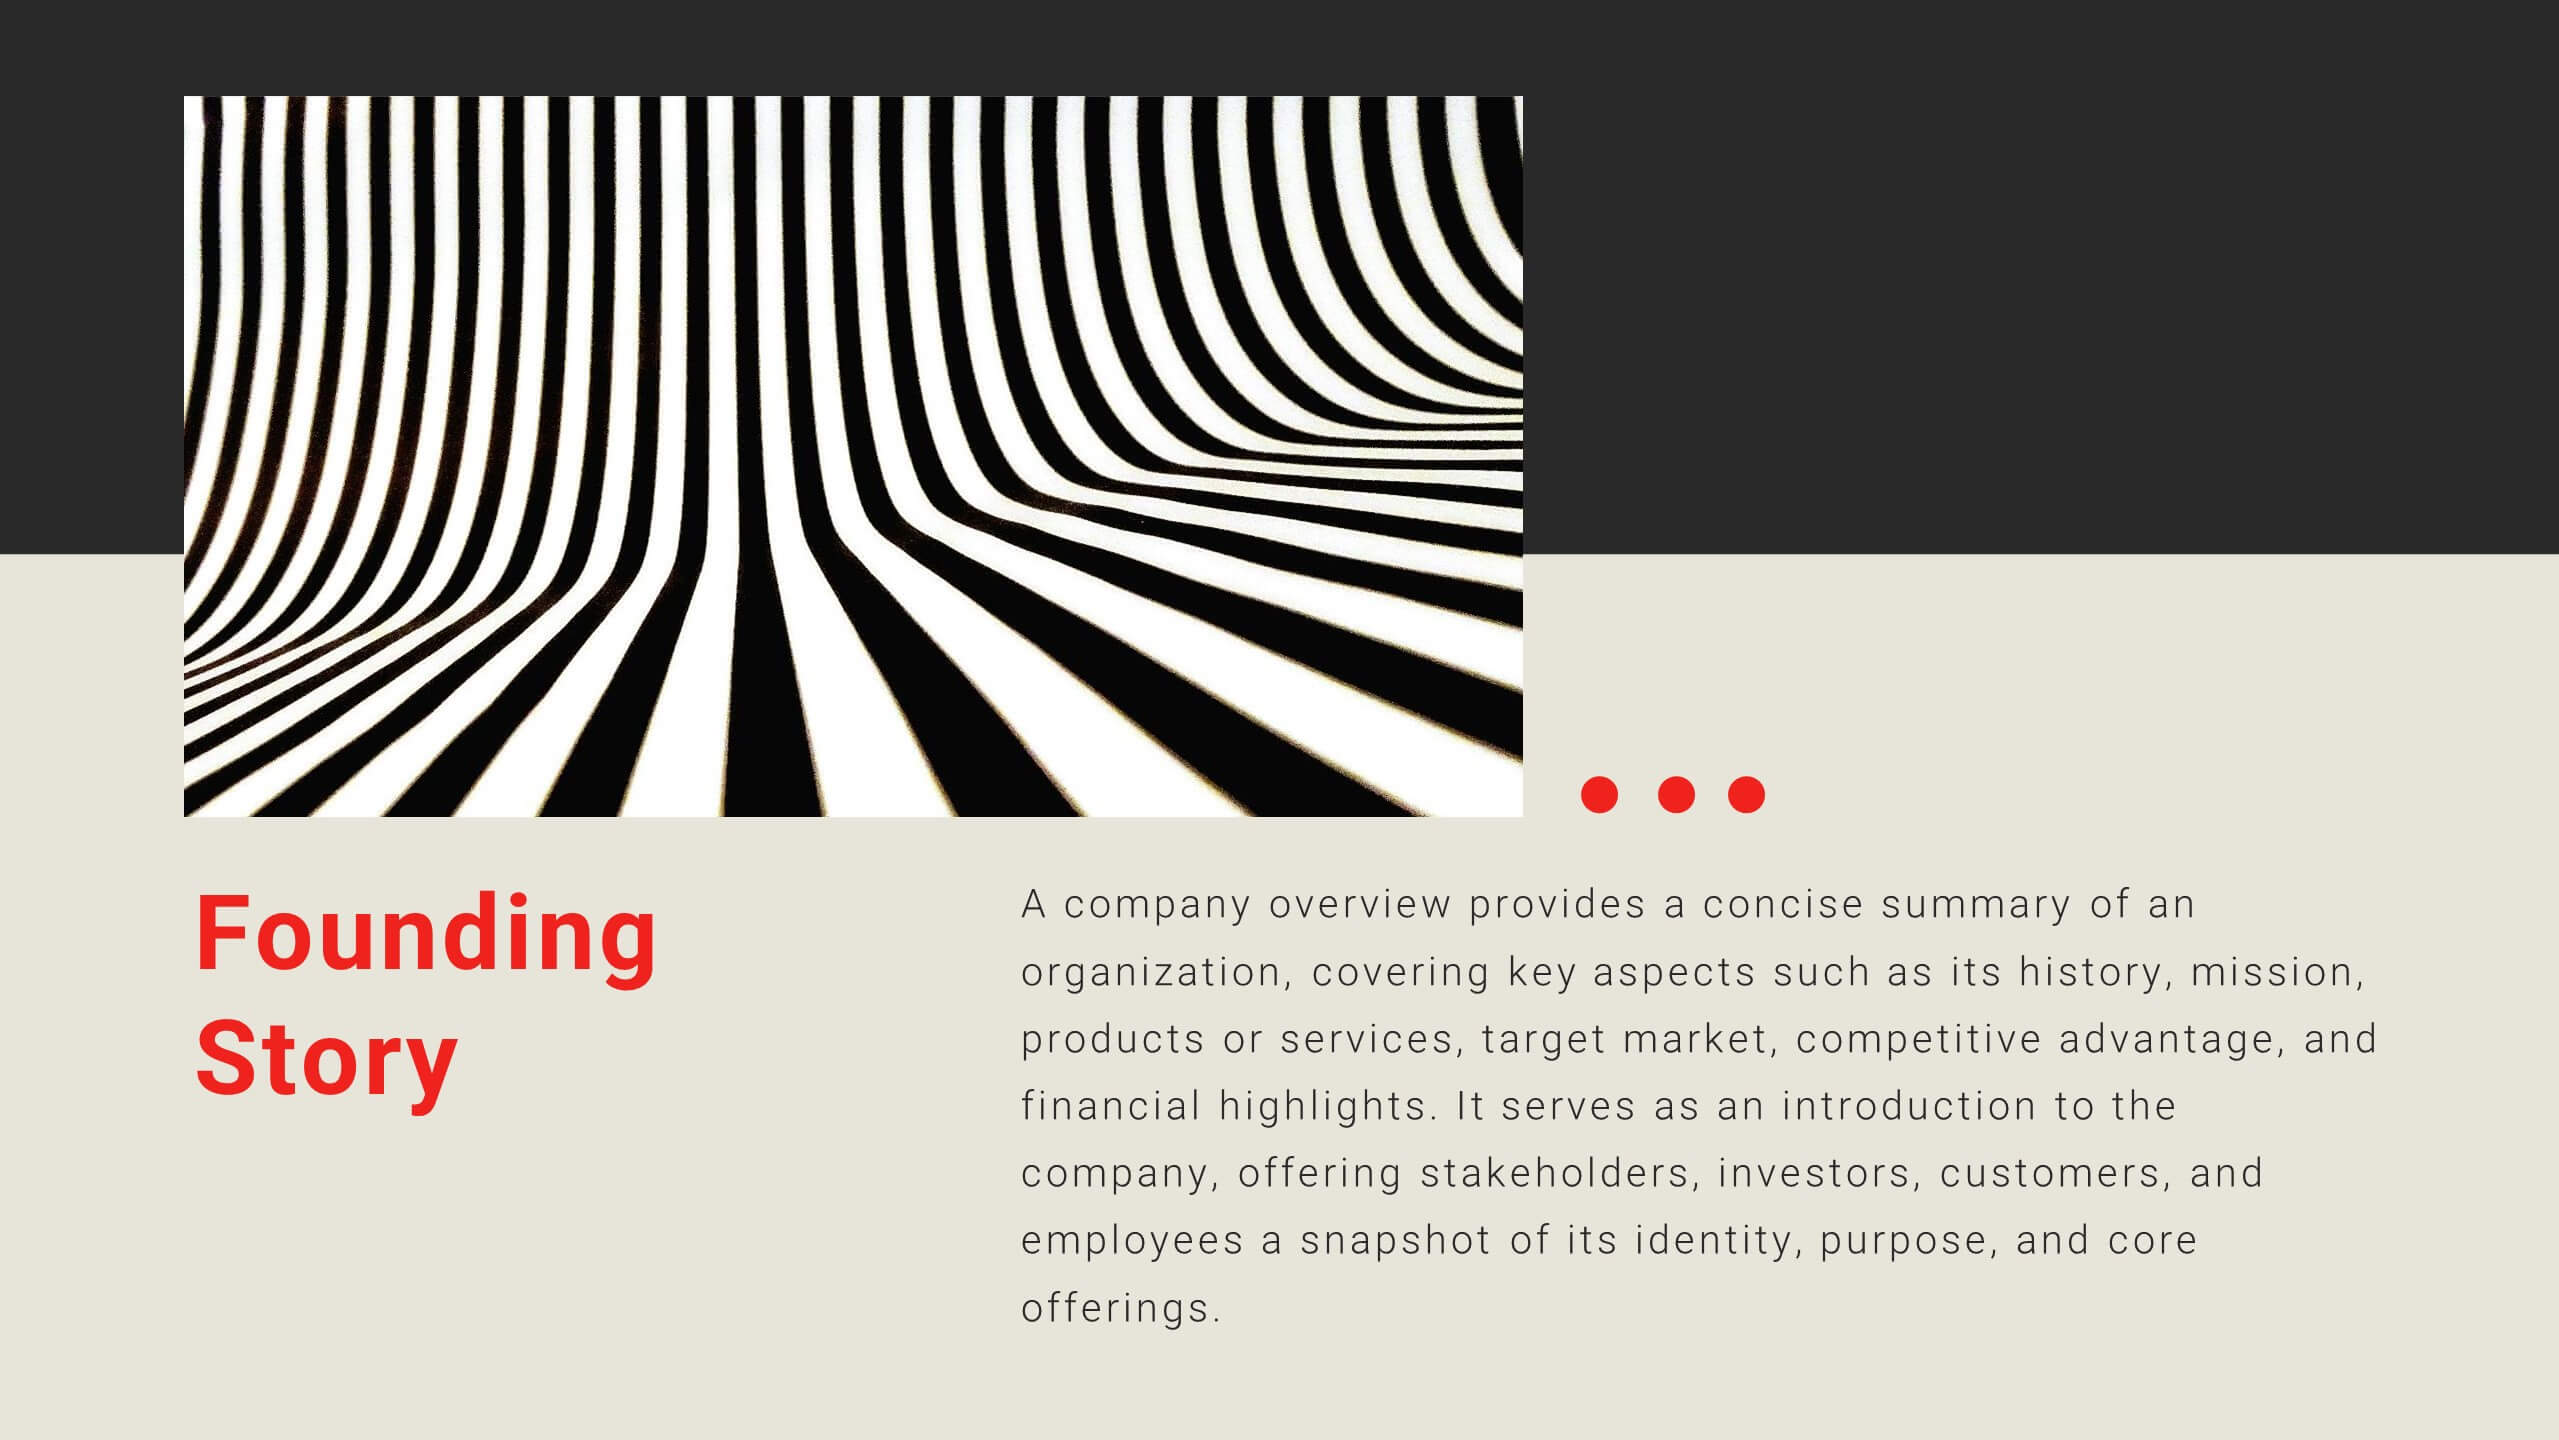
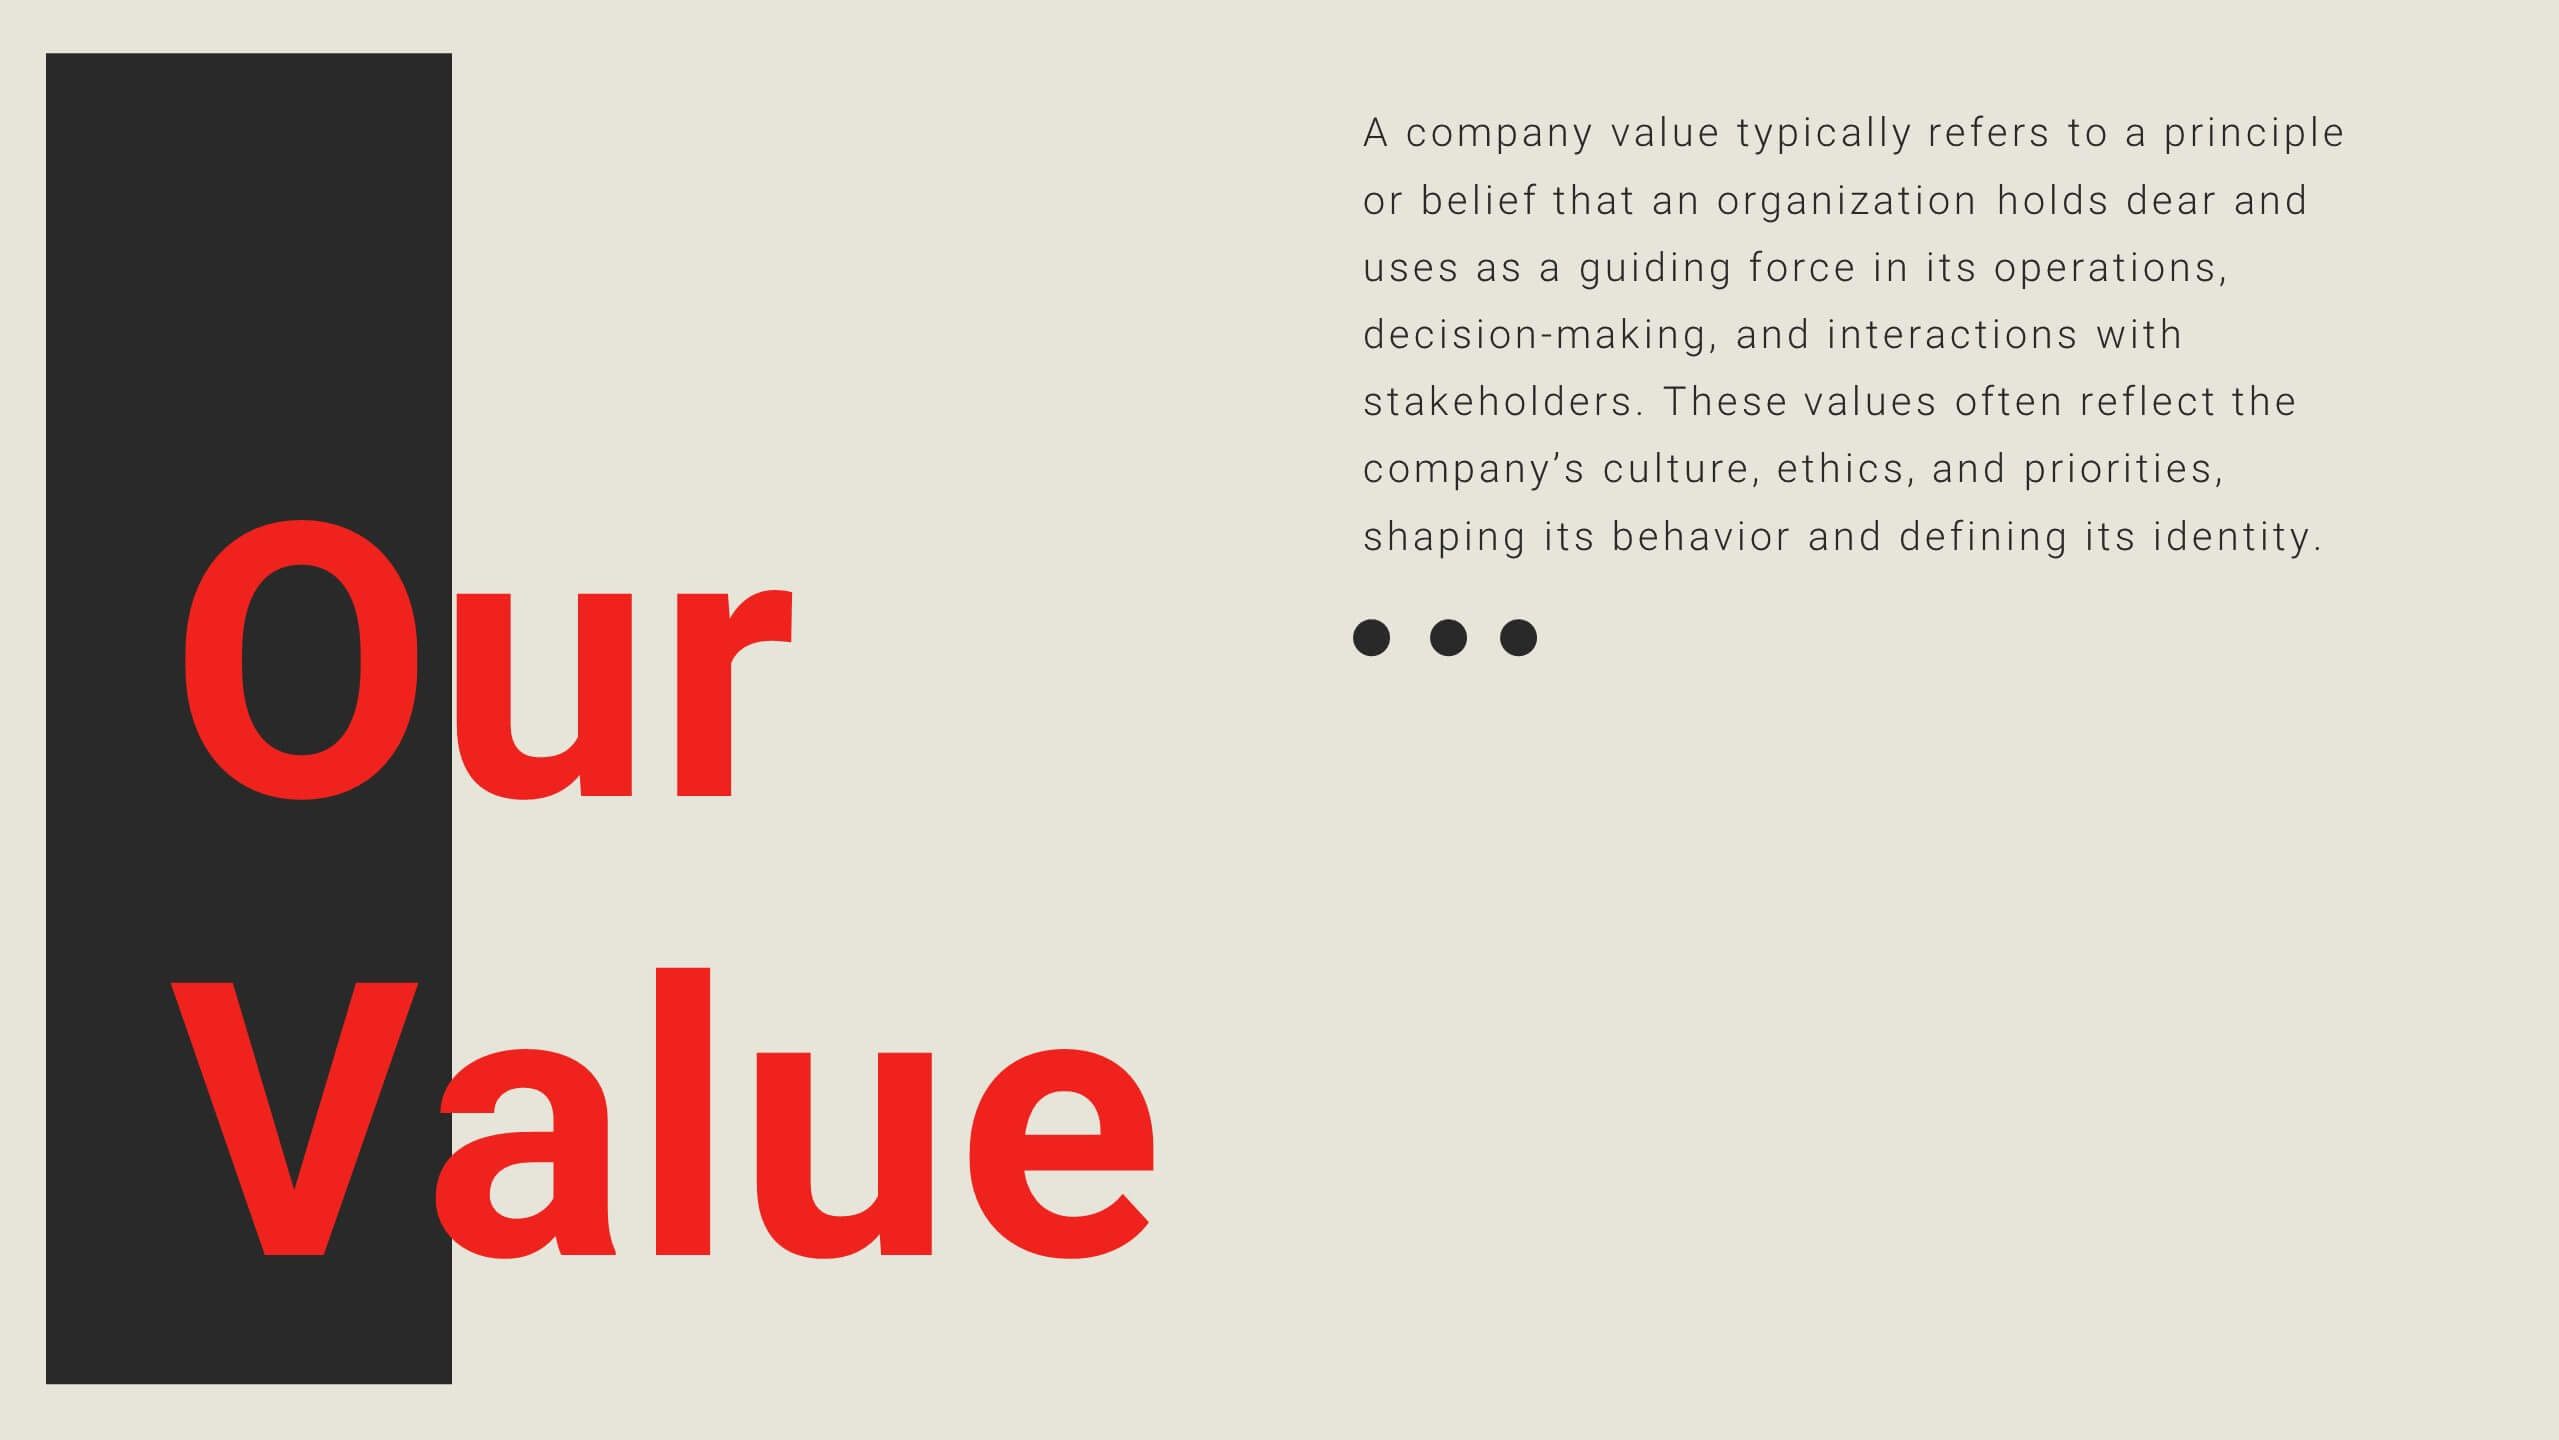
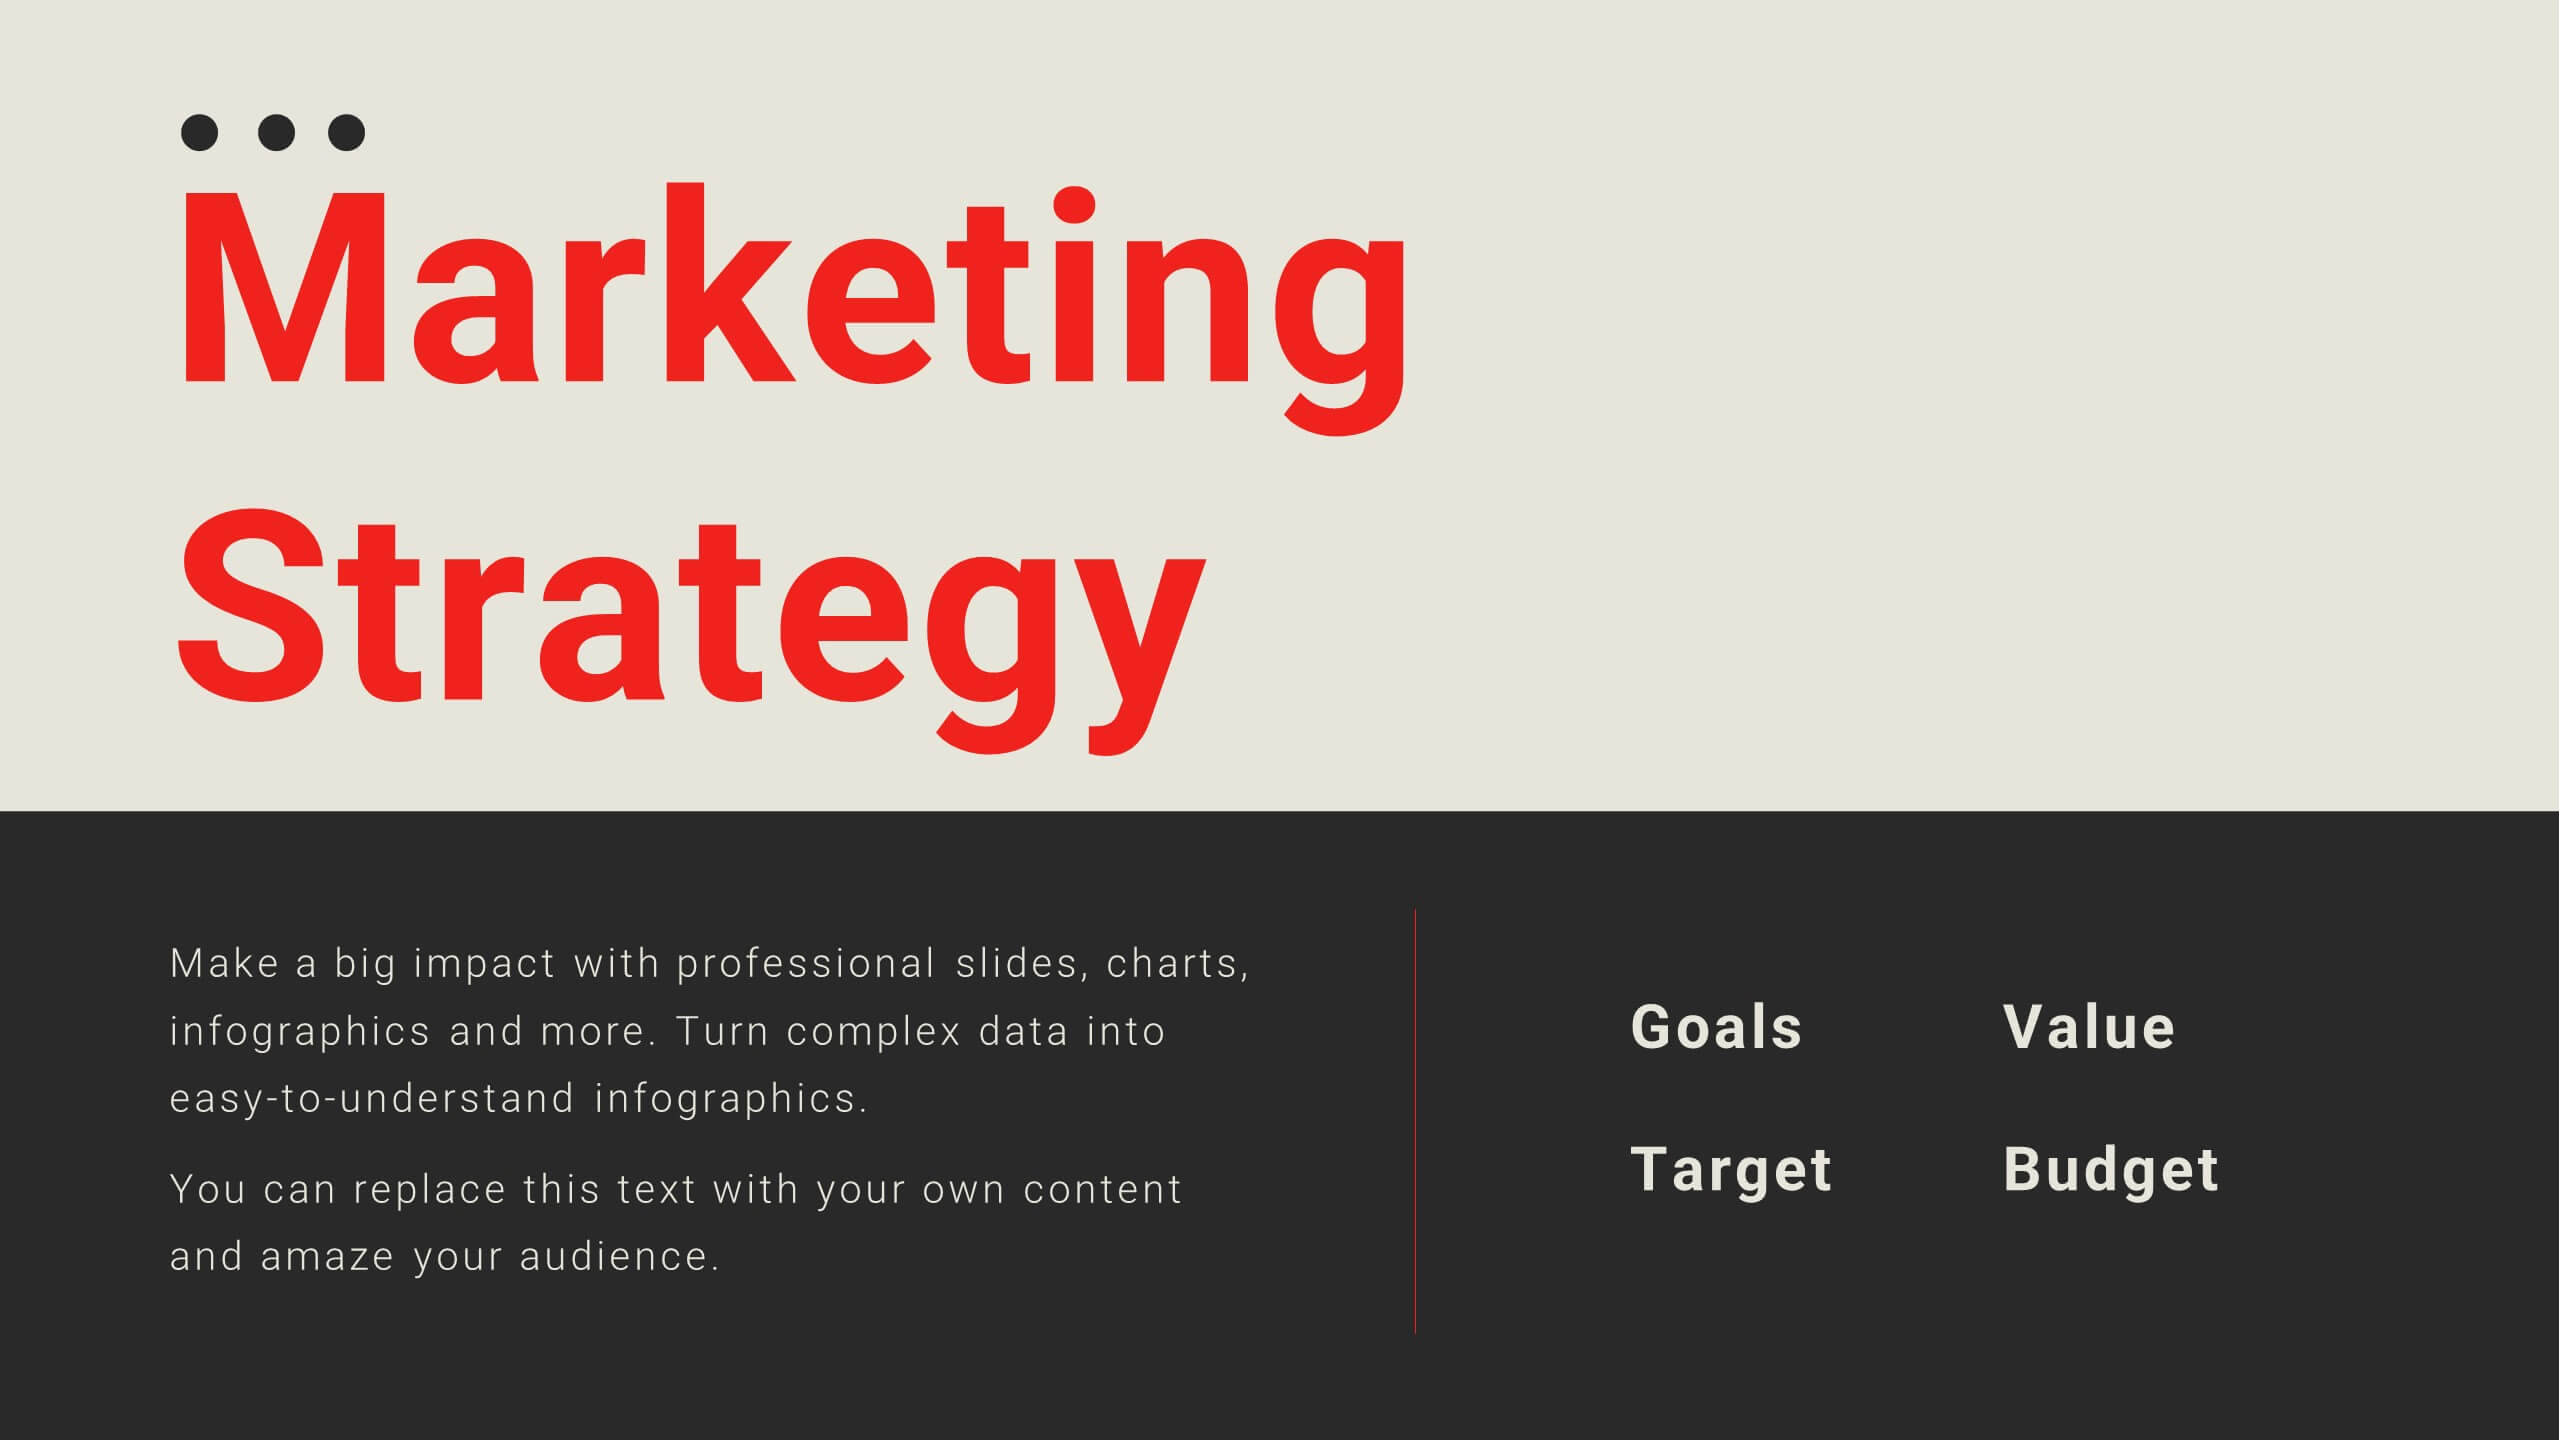
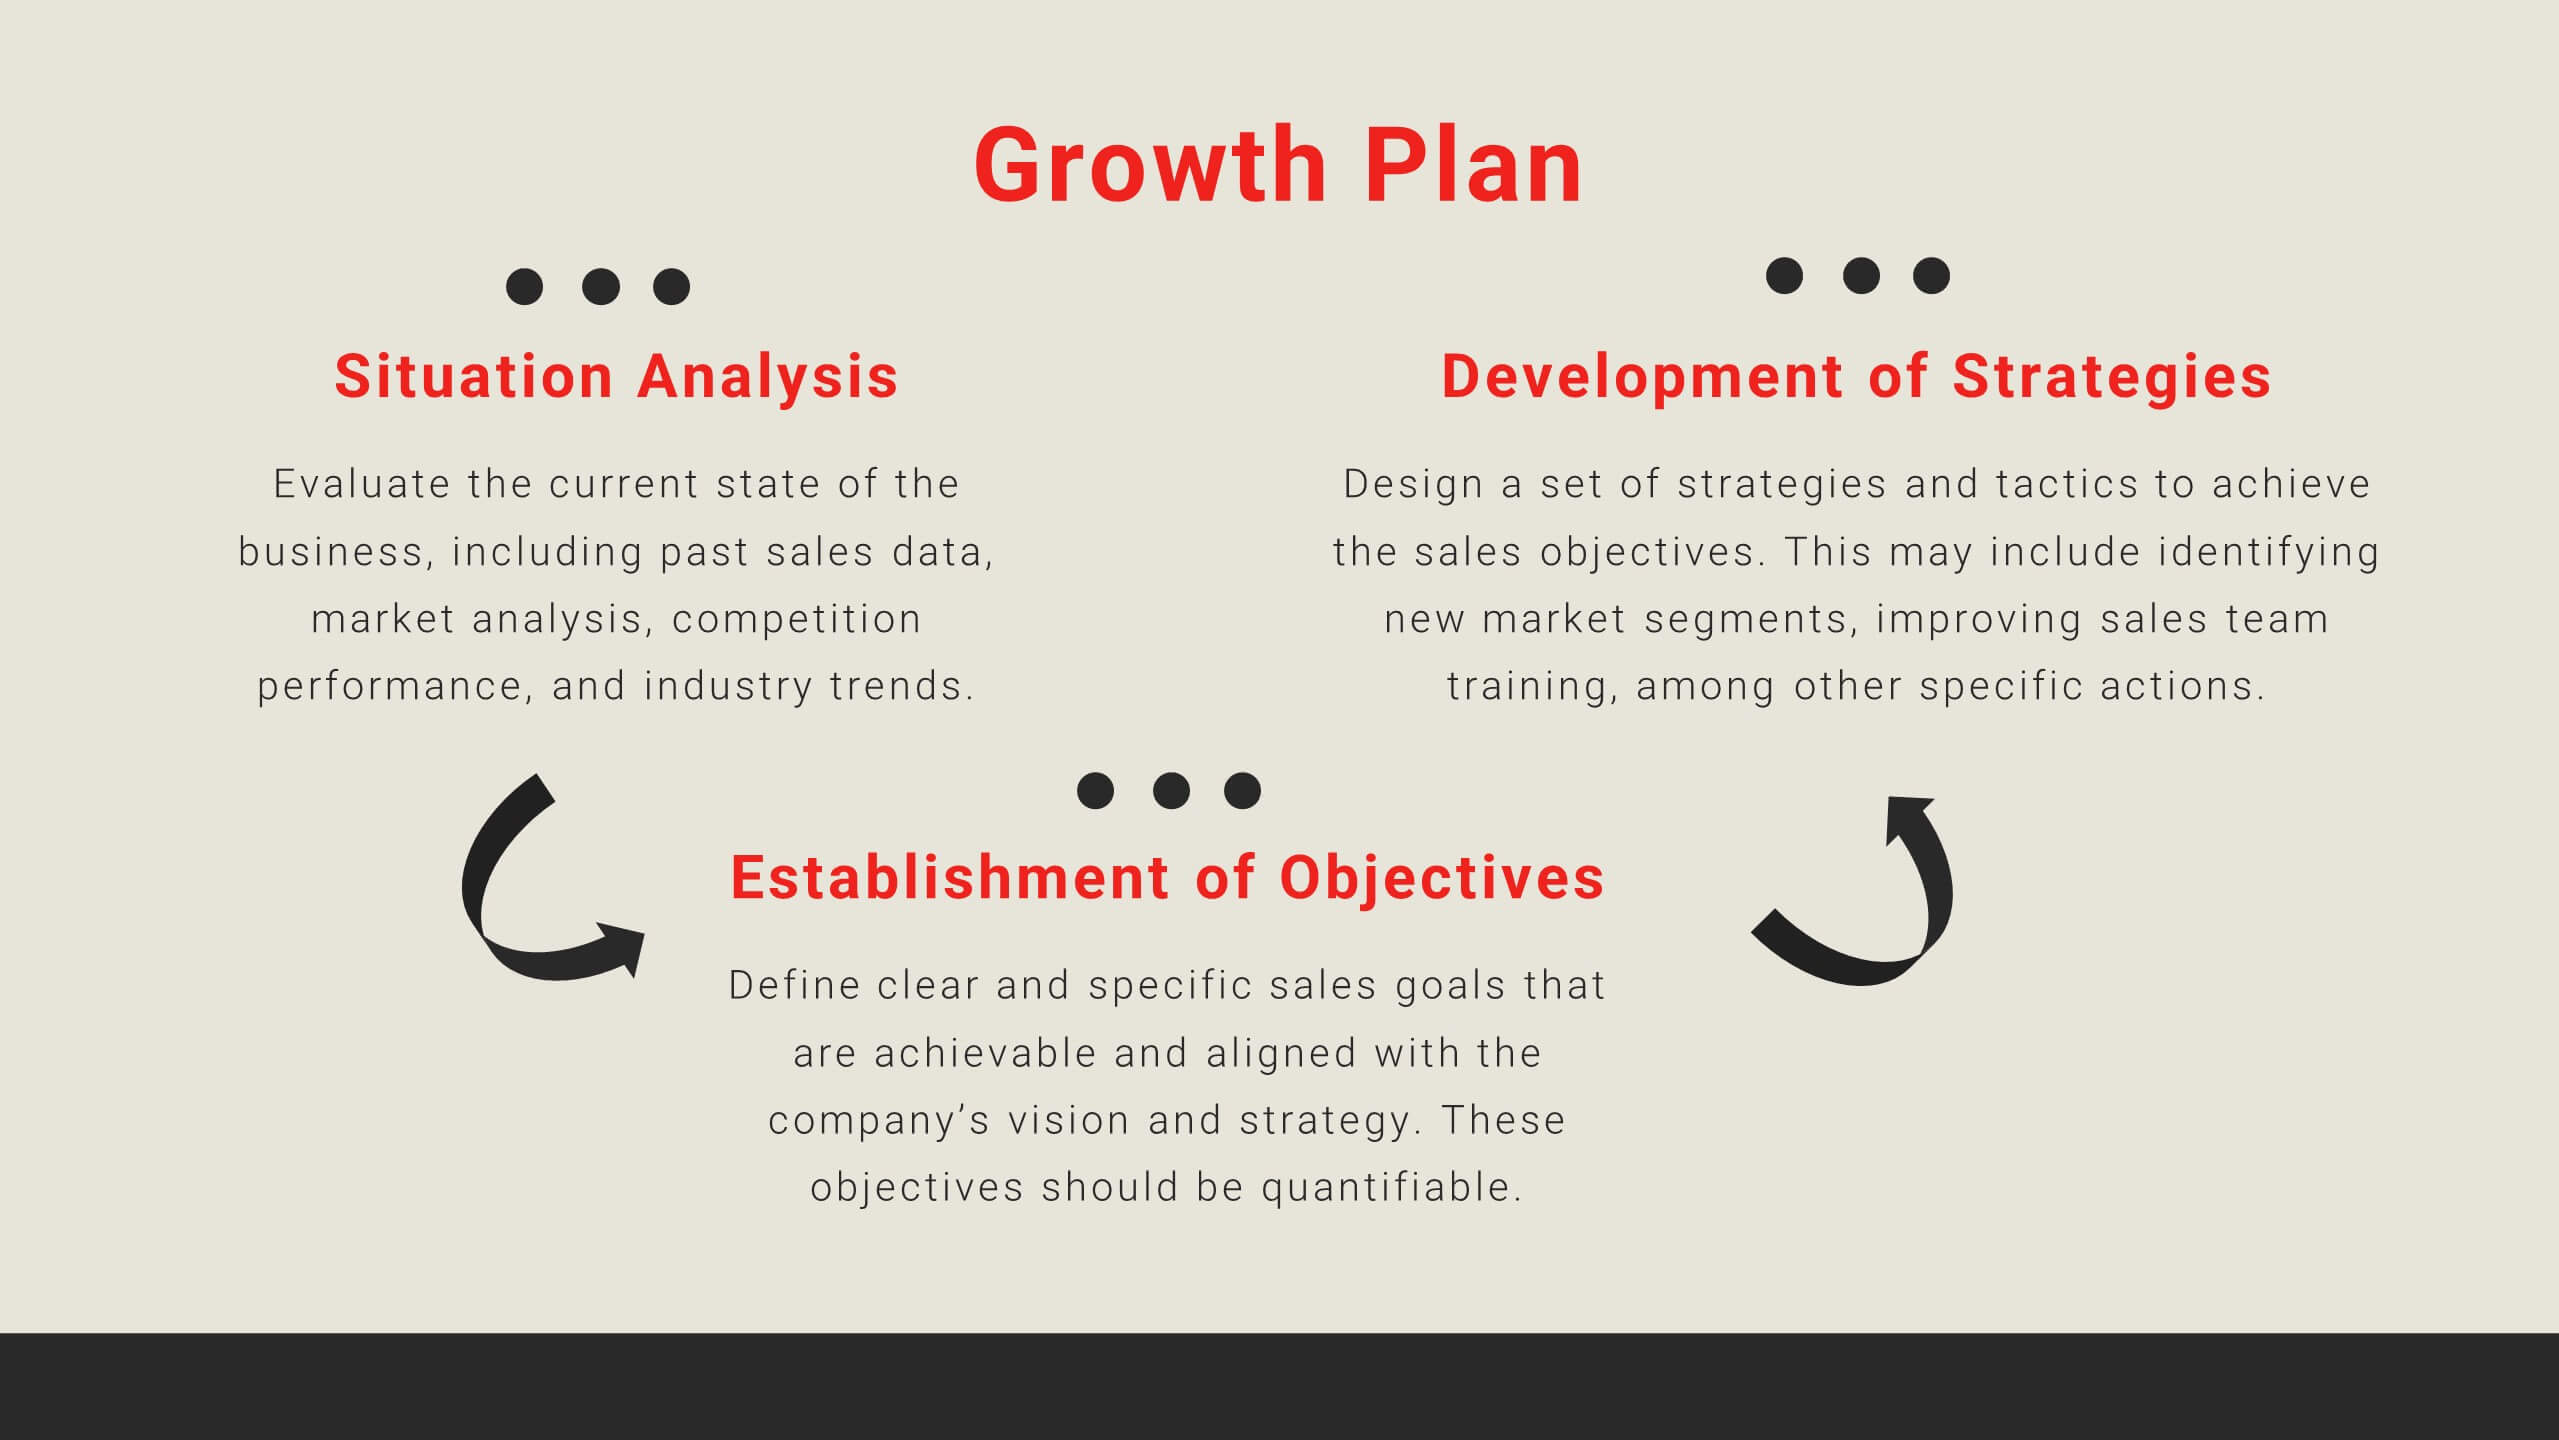
Velocity Startup Growth Plan Presentation
Accelerate your startup's growth with this dynamic plan template! Perfect for outlining your mission, vision, business model, and marketing strategy. Ideal for entrepreneurs aiming to secure funding and drive success. Compatible with PowerPoint, Keynote, and Google Slides, this template ensures your growth plan is clear, professional, and compelling. Achieve your startup goals today!


5 diapositivas
Dual Axis Butterfly Diagram Presentation
Give your data the spotlight it deserves with a modern layout designed for clarity and balance. This presentation is perfect for comparing two perspectives, processes, or variables side by side in a visually appealing way. Fully customizable and compatible with PowerPoint, Keynote, and Google Slides.


6 diapositivas
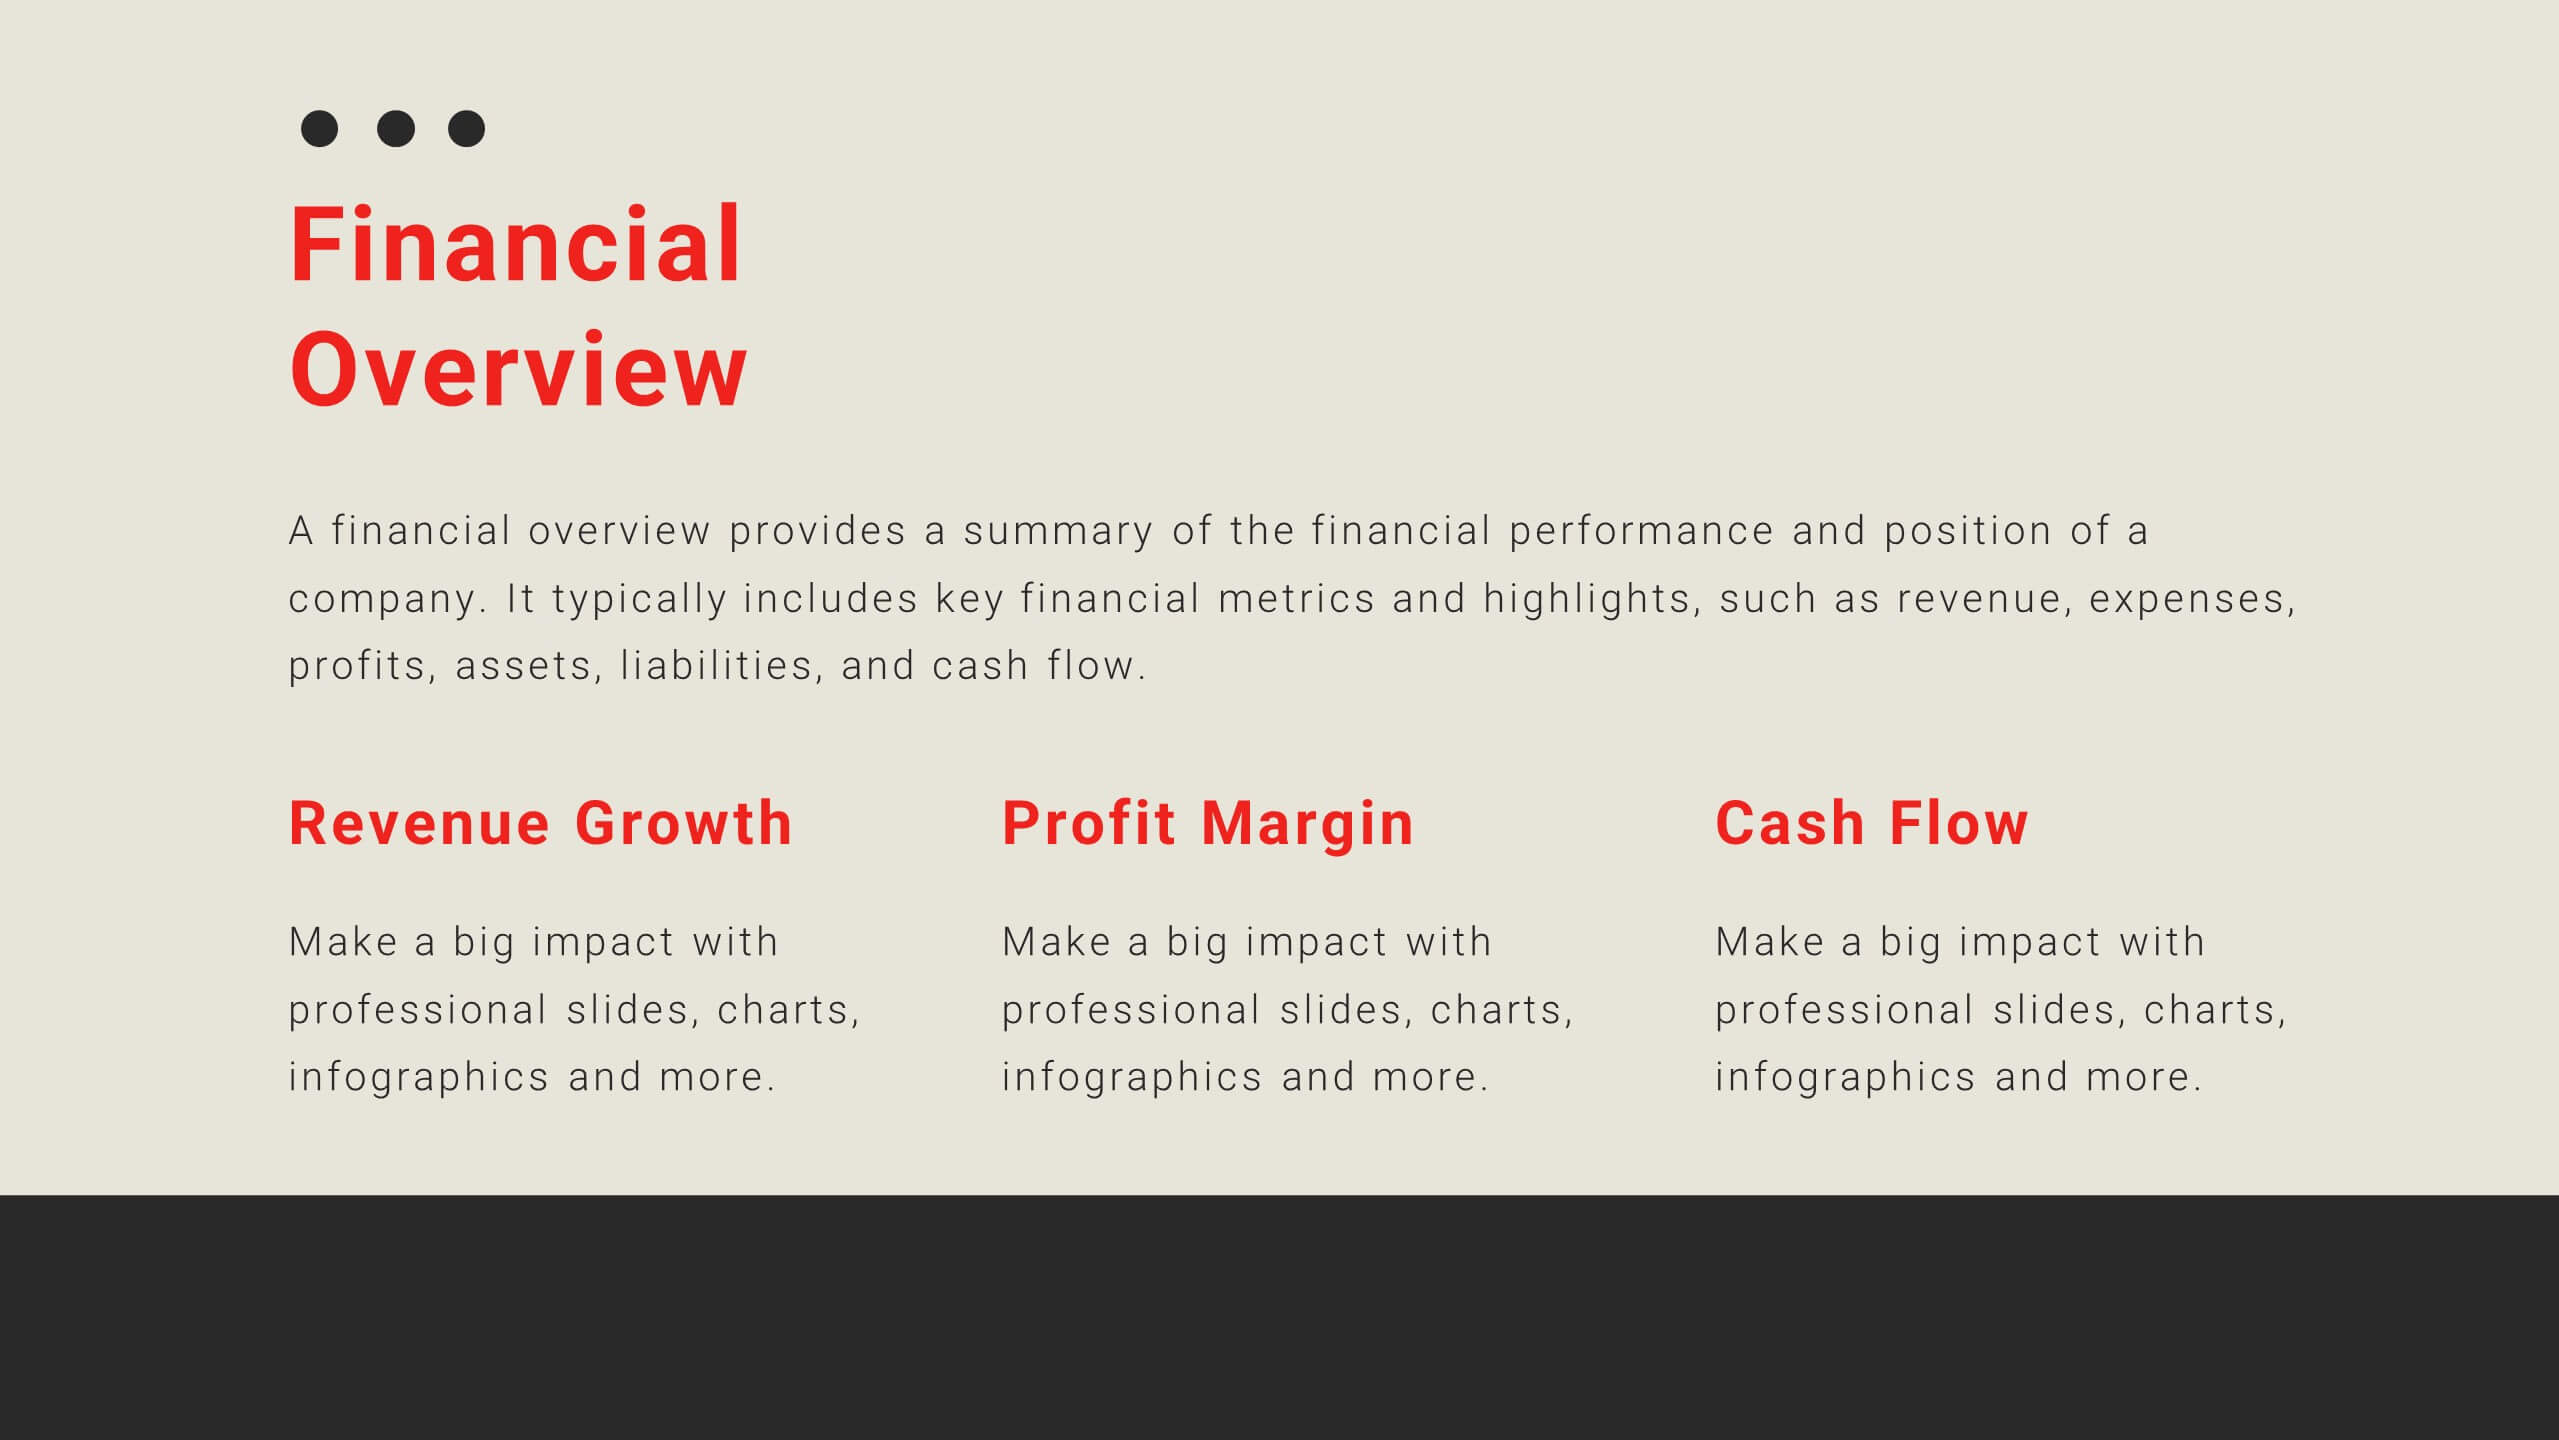
Professional Company Portfolio Presentation
Showcase Your Business Success with a Sleek Portfolio! The Professional Company Portfolio template is designed to highlight key achievements, performance metrics, and strategic insights with a modern, image-driven layout. Featuring three visually appealing sections, this template allows you to present KPIs, revenue growth, and business milestones in a compelling and structured way. Fully customizable in PowerPoint, Keynote, and Google Slides, this portfolio template is perfect for presentations, investor updates, and corporate showcases.


6 diapositivas
Problem Definition and Solution Path
Illuminate your strategy with this lightbulb-themed slide—ideal for mapping out challenges and presenting actionable solutions. Each bulb symbolizes a step on your path from problem to resolution. Fully editable in PowerPoint, Keynote, and Google Slides.


6 diapositivas
Demographic Data Analysis Presentation
The "Demographic Data Analysis" presentation effectively visualizes demographic splits using a simple yet engaging pie chart. The template features a clean layout with distinct sections labeled for different demographic metrics, represented by the percentage splits of 35% and 65%. Each section includes placeholder text for inserting detailed insights, making it an excellent tool for presentations that need to communicate demographic data clearly and attractively. The design is versatile and can be adapted for various analysis needs in business or research contexts.


5 diapositivas
Agile Scrum Task Board Workflow Presentation
Simplify your Agile process with this task board workflow diagram. Clearly outline backlog, sprint planning, task execution, and delivery steps in a visually engaging format. Perfect for Agile teams, project managers, or software developers. Fully customizable in PowerPoint, Keynote, and Google Slides to fit your sprint and scrum documentation needs.


20 diapositivas
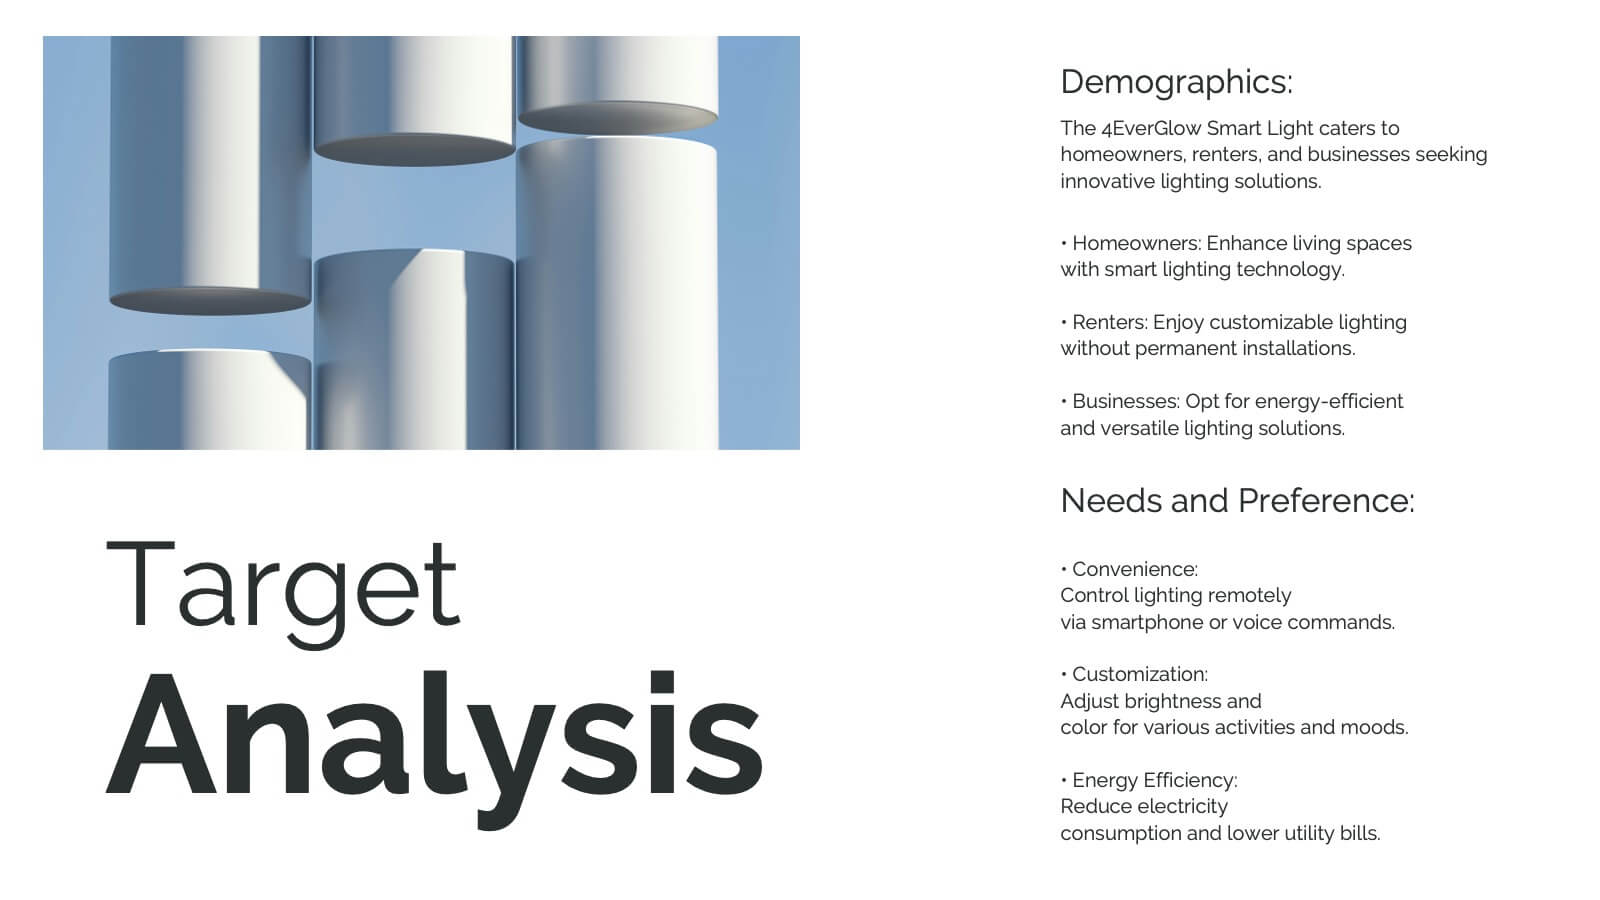
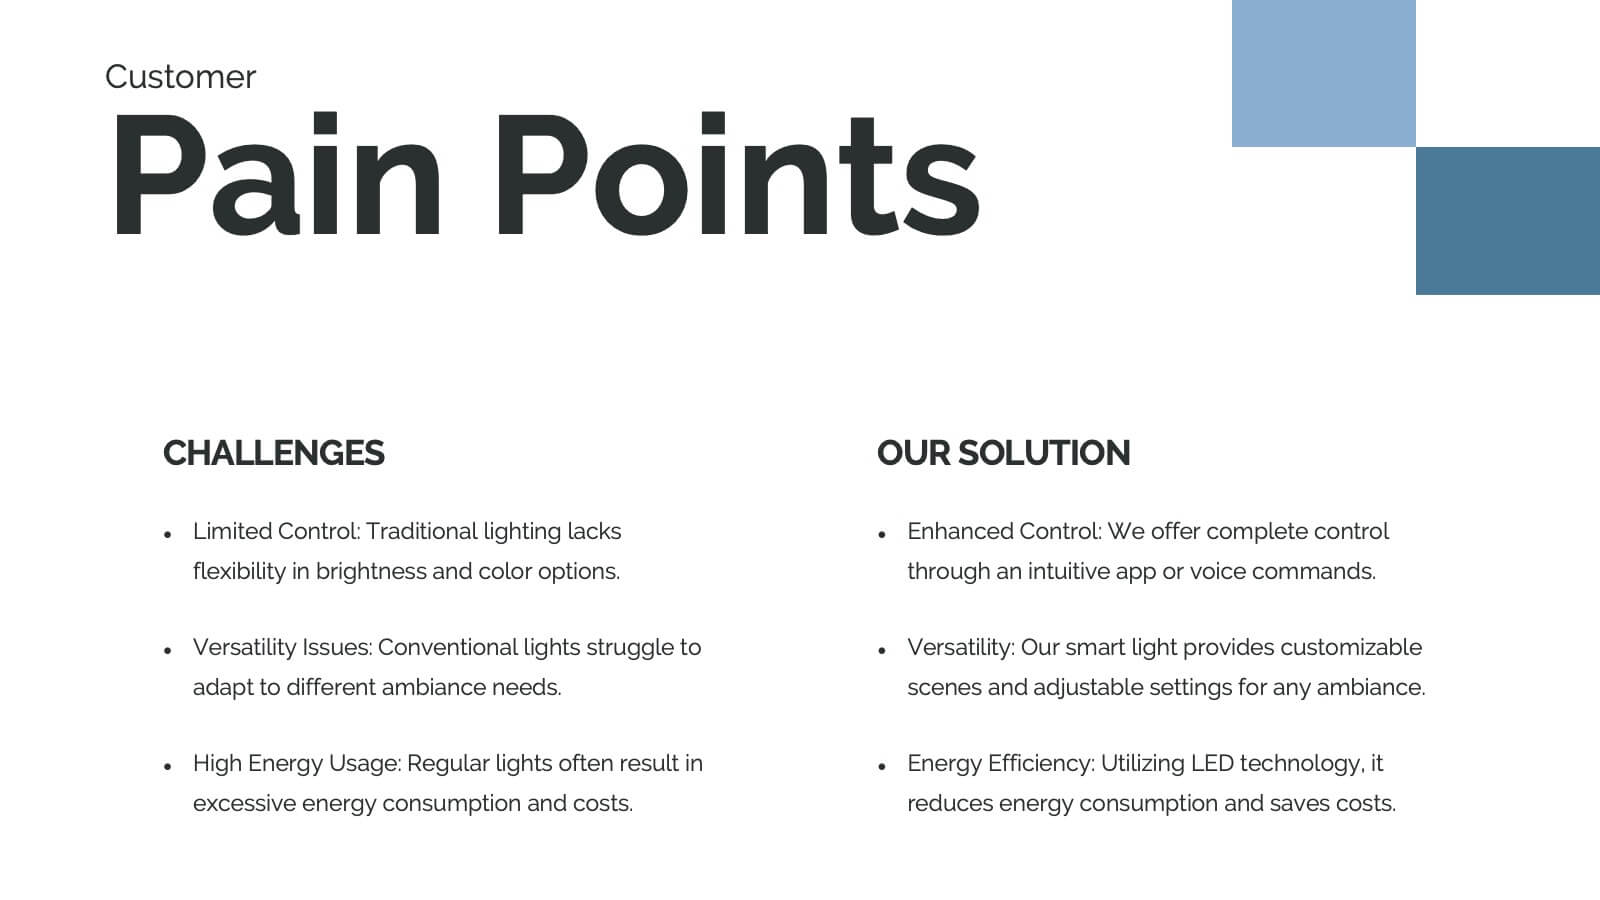
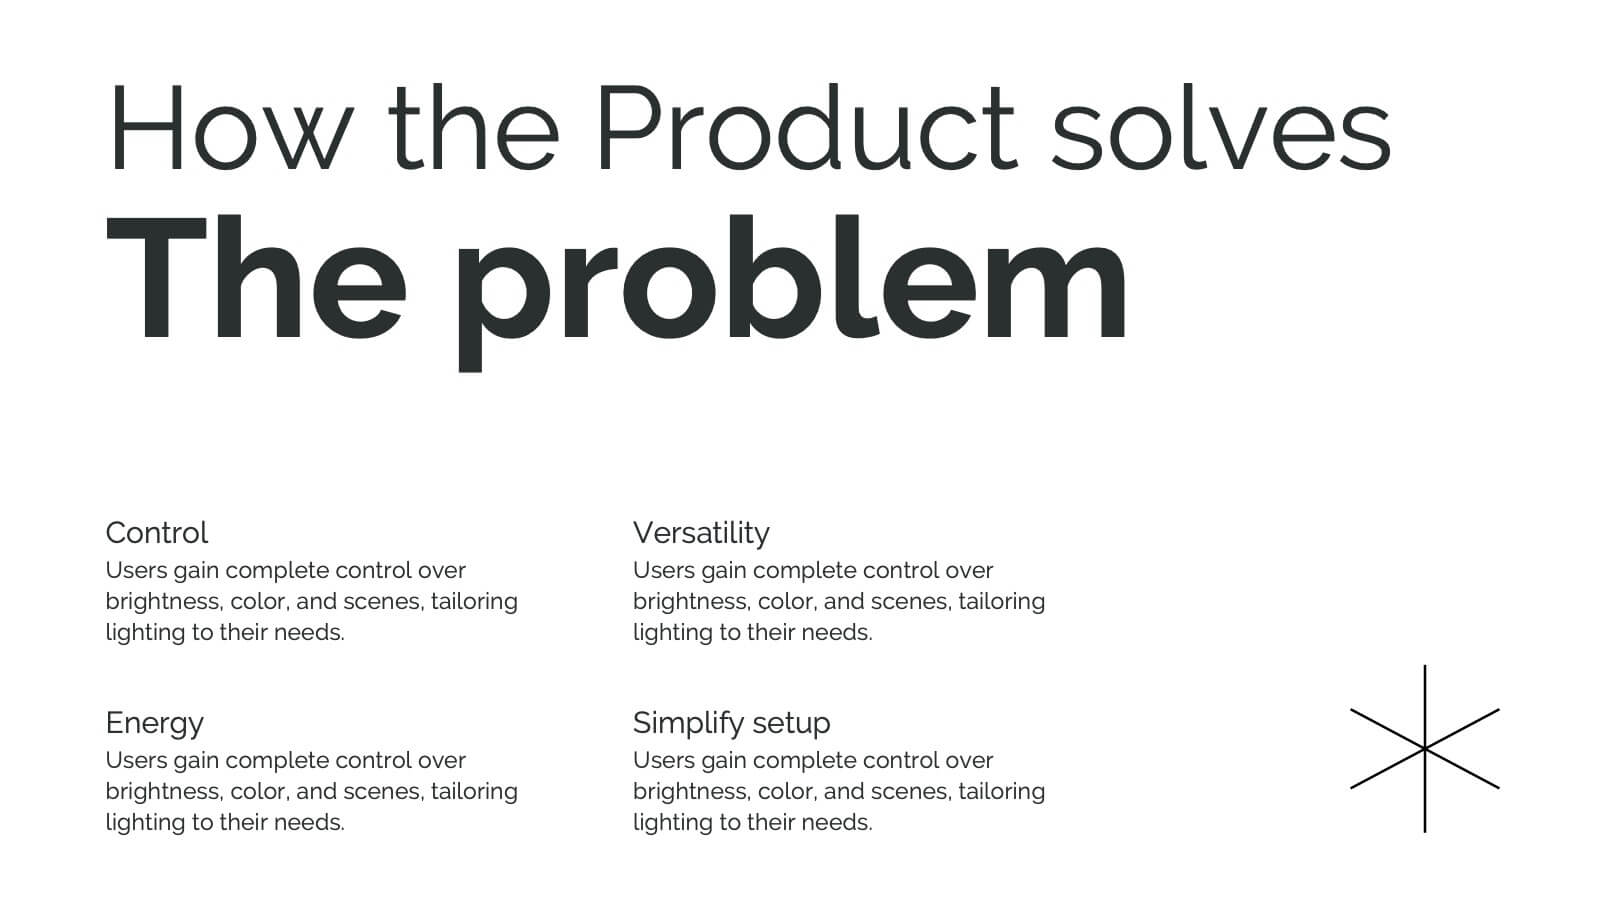
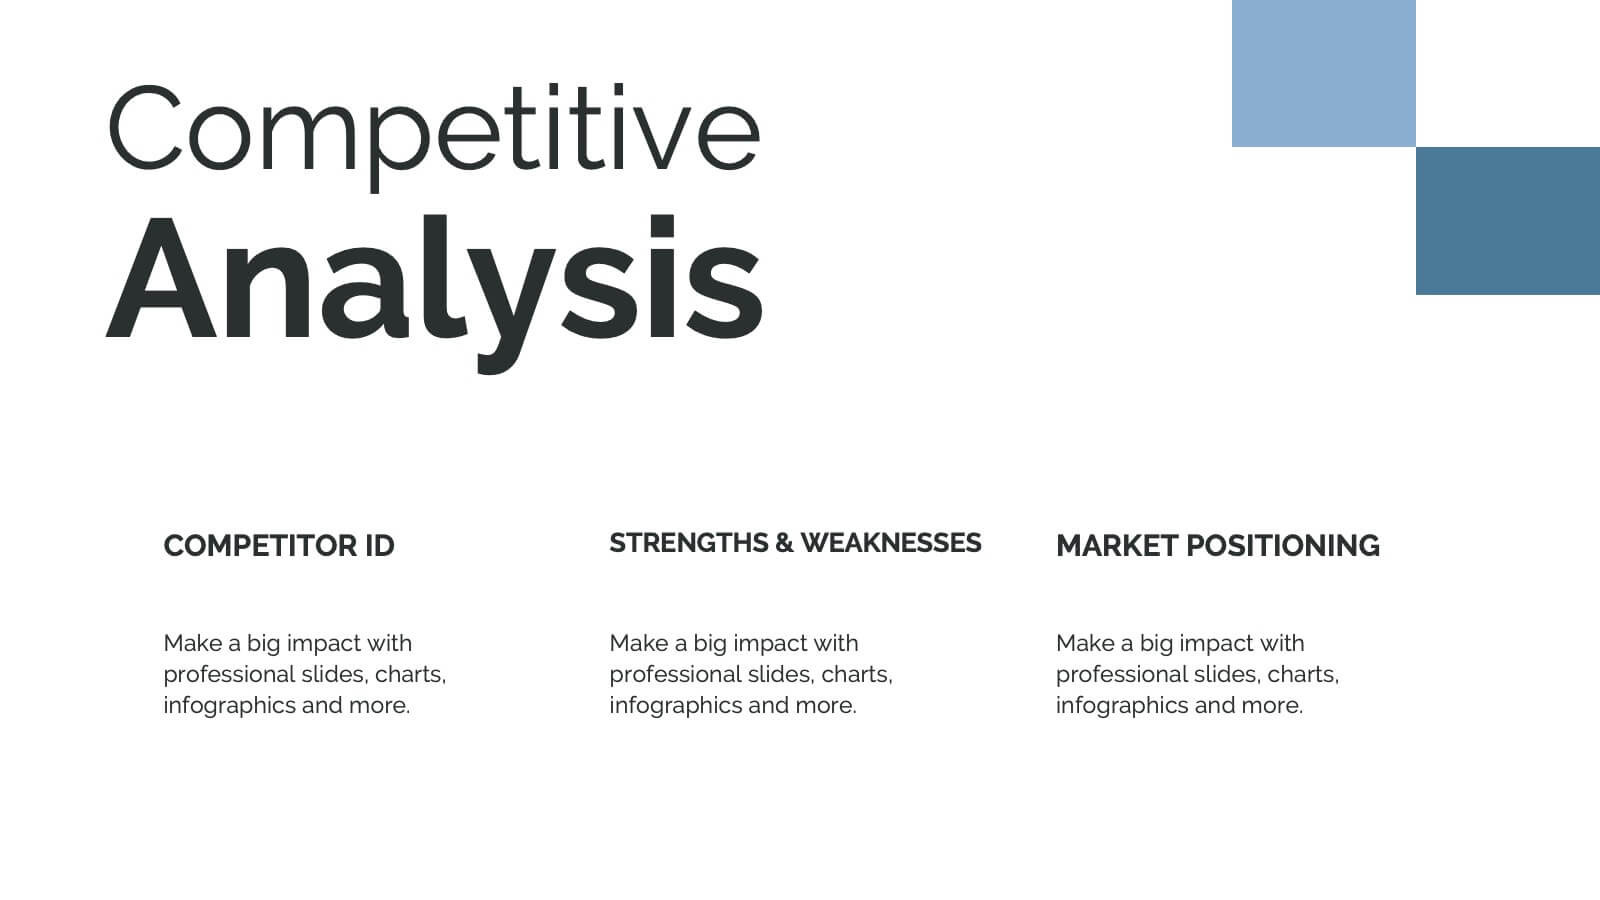
Hydra Product Launch Presentation
Unveiling your latest product has never been easier or more captivating! This comprehensive presentation template covers every aspect of your product's journey—from launch to competitive analysis. Engage your audience with detailed slides on features, target analysis, and pricing strategy. Seamlessly compatible with PowerPoint, Keynote, and Google Slides for maximum flexibility and impact.


34 diapositivas
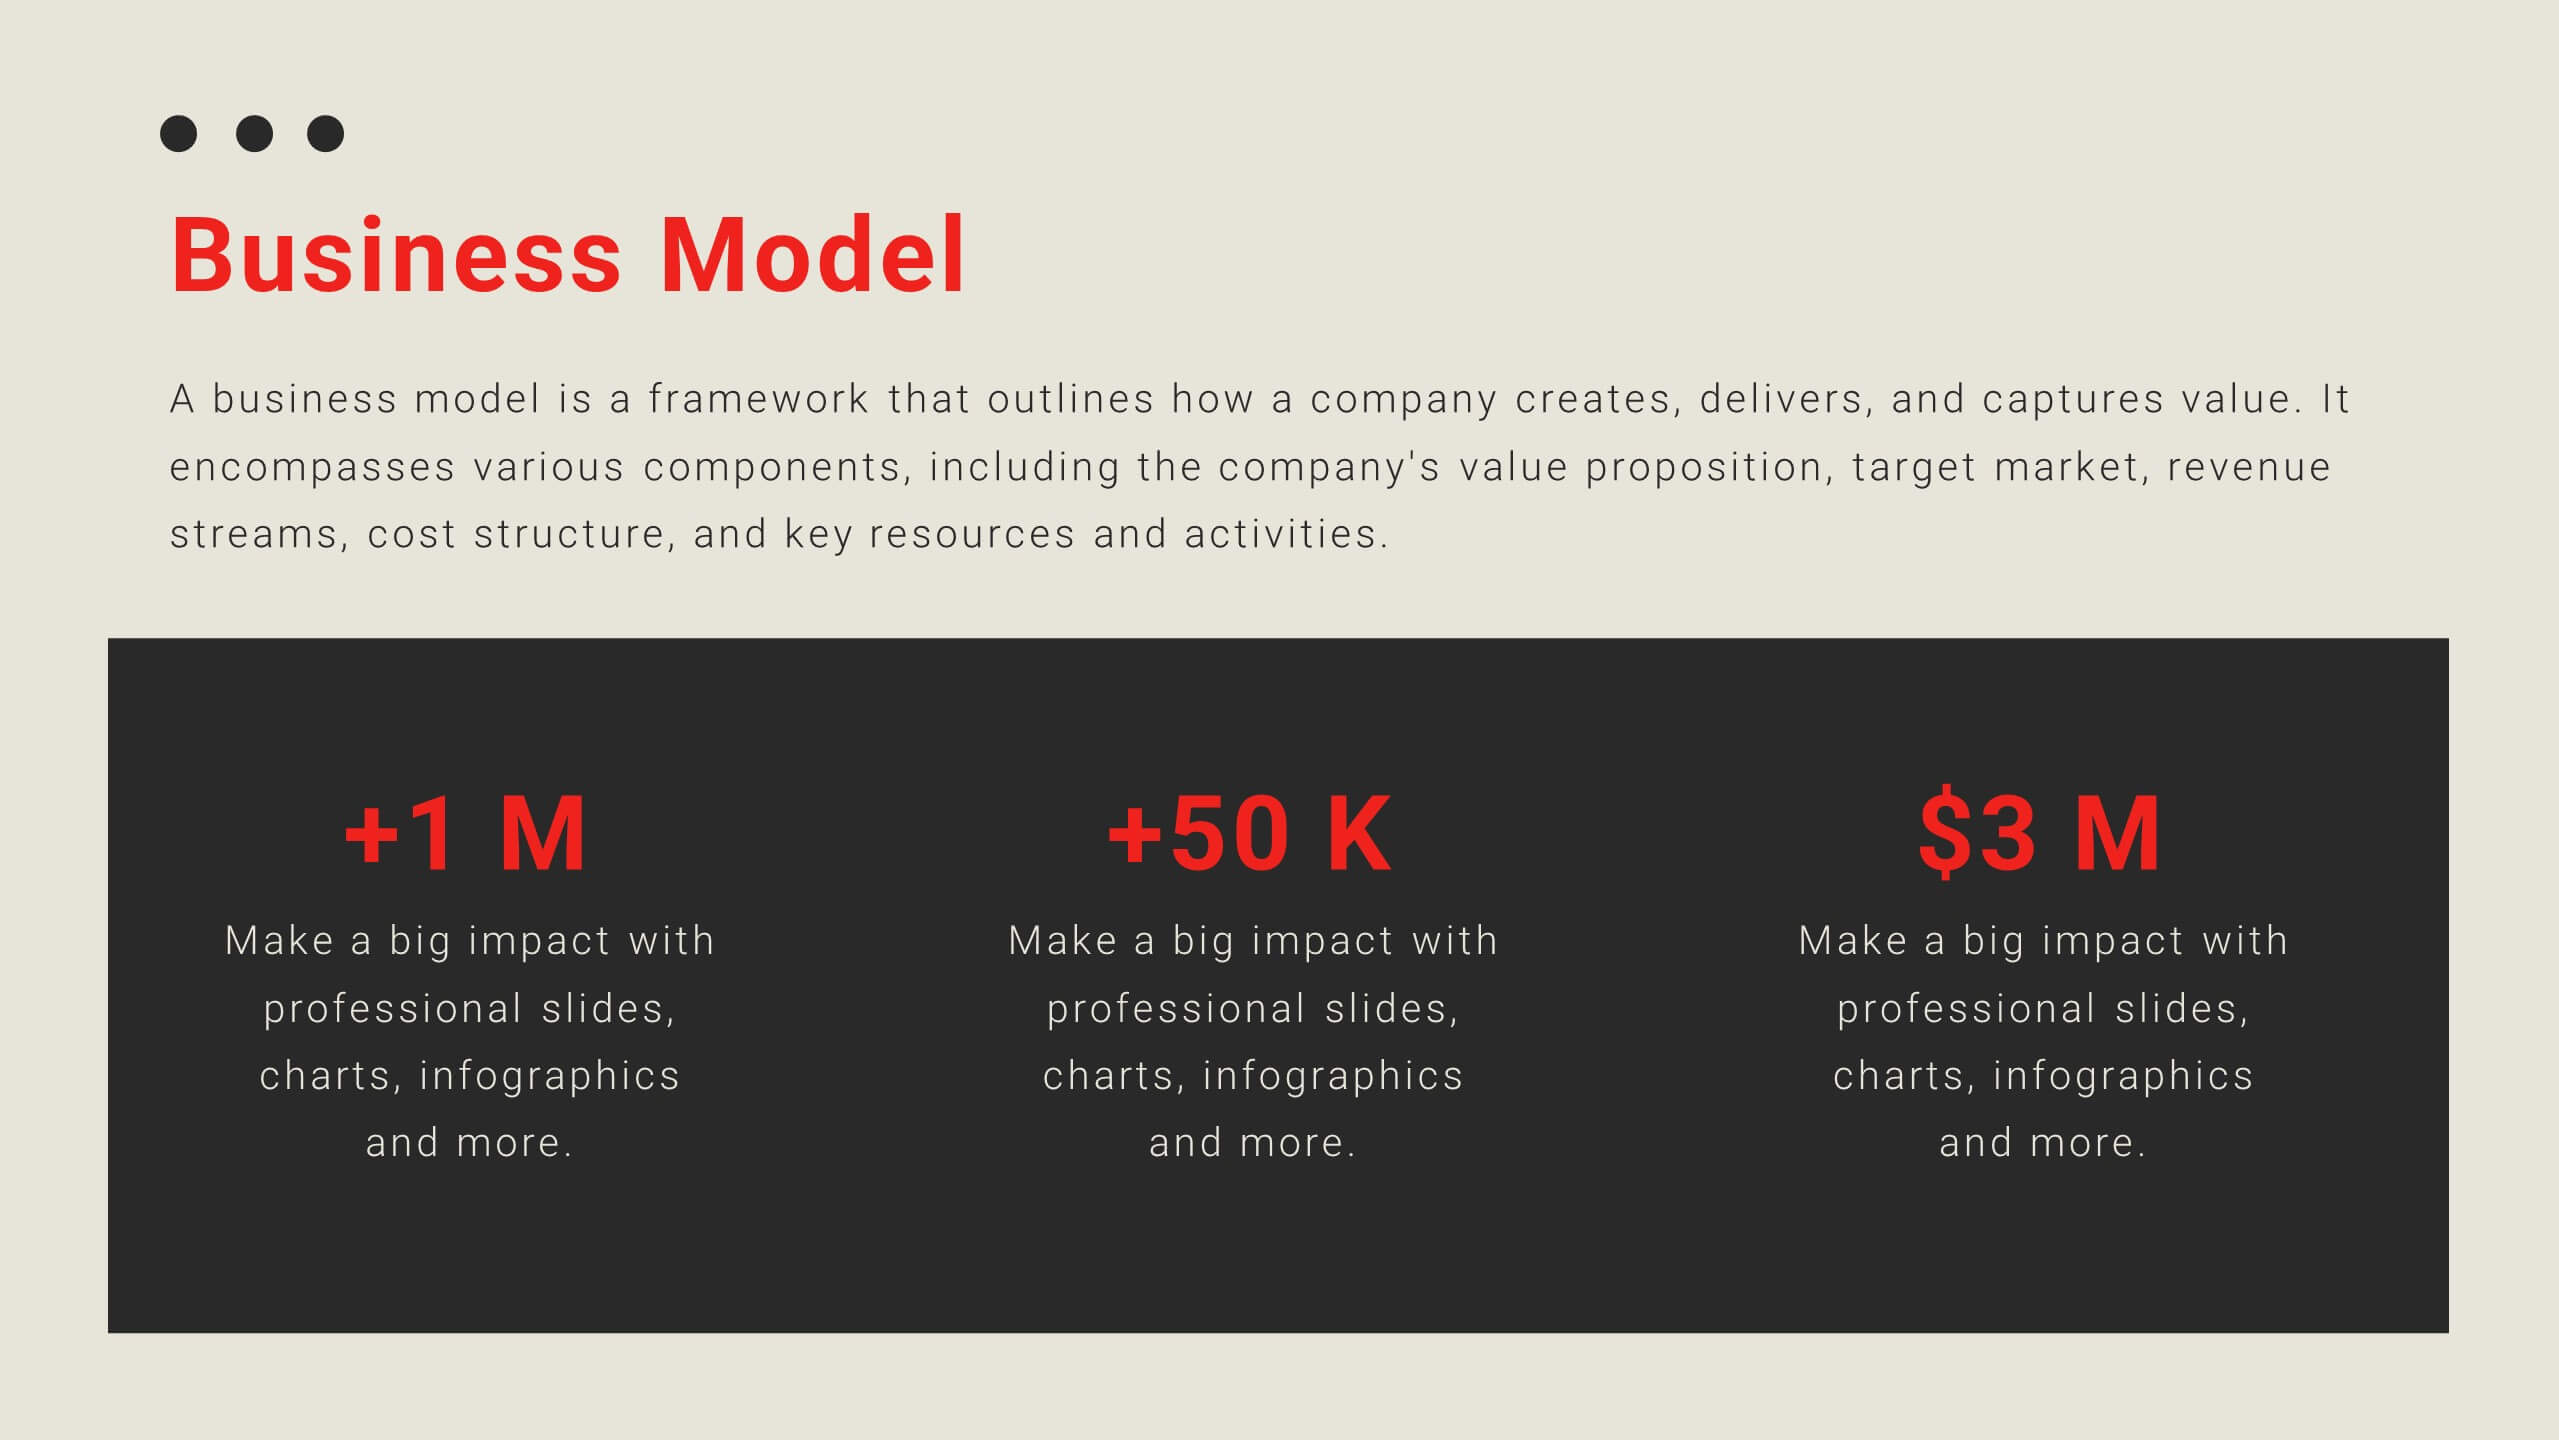
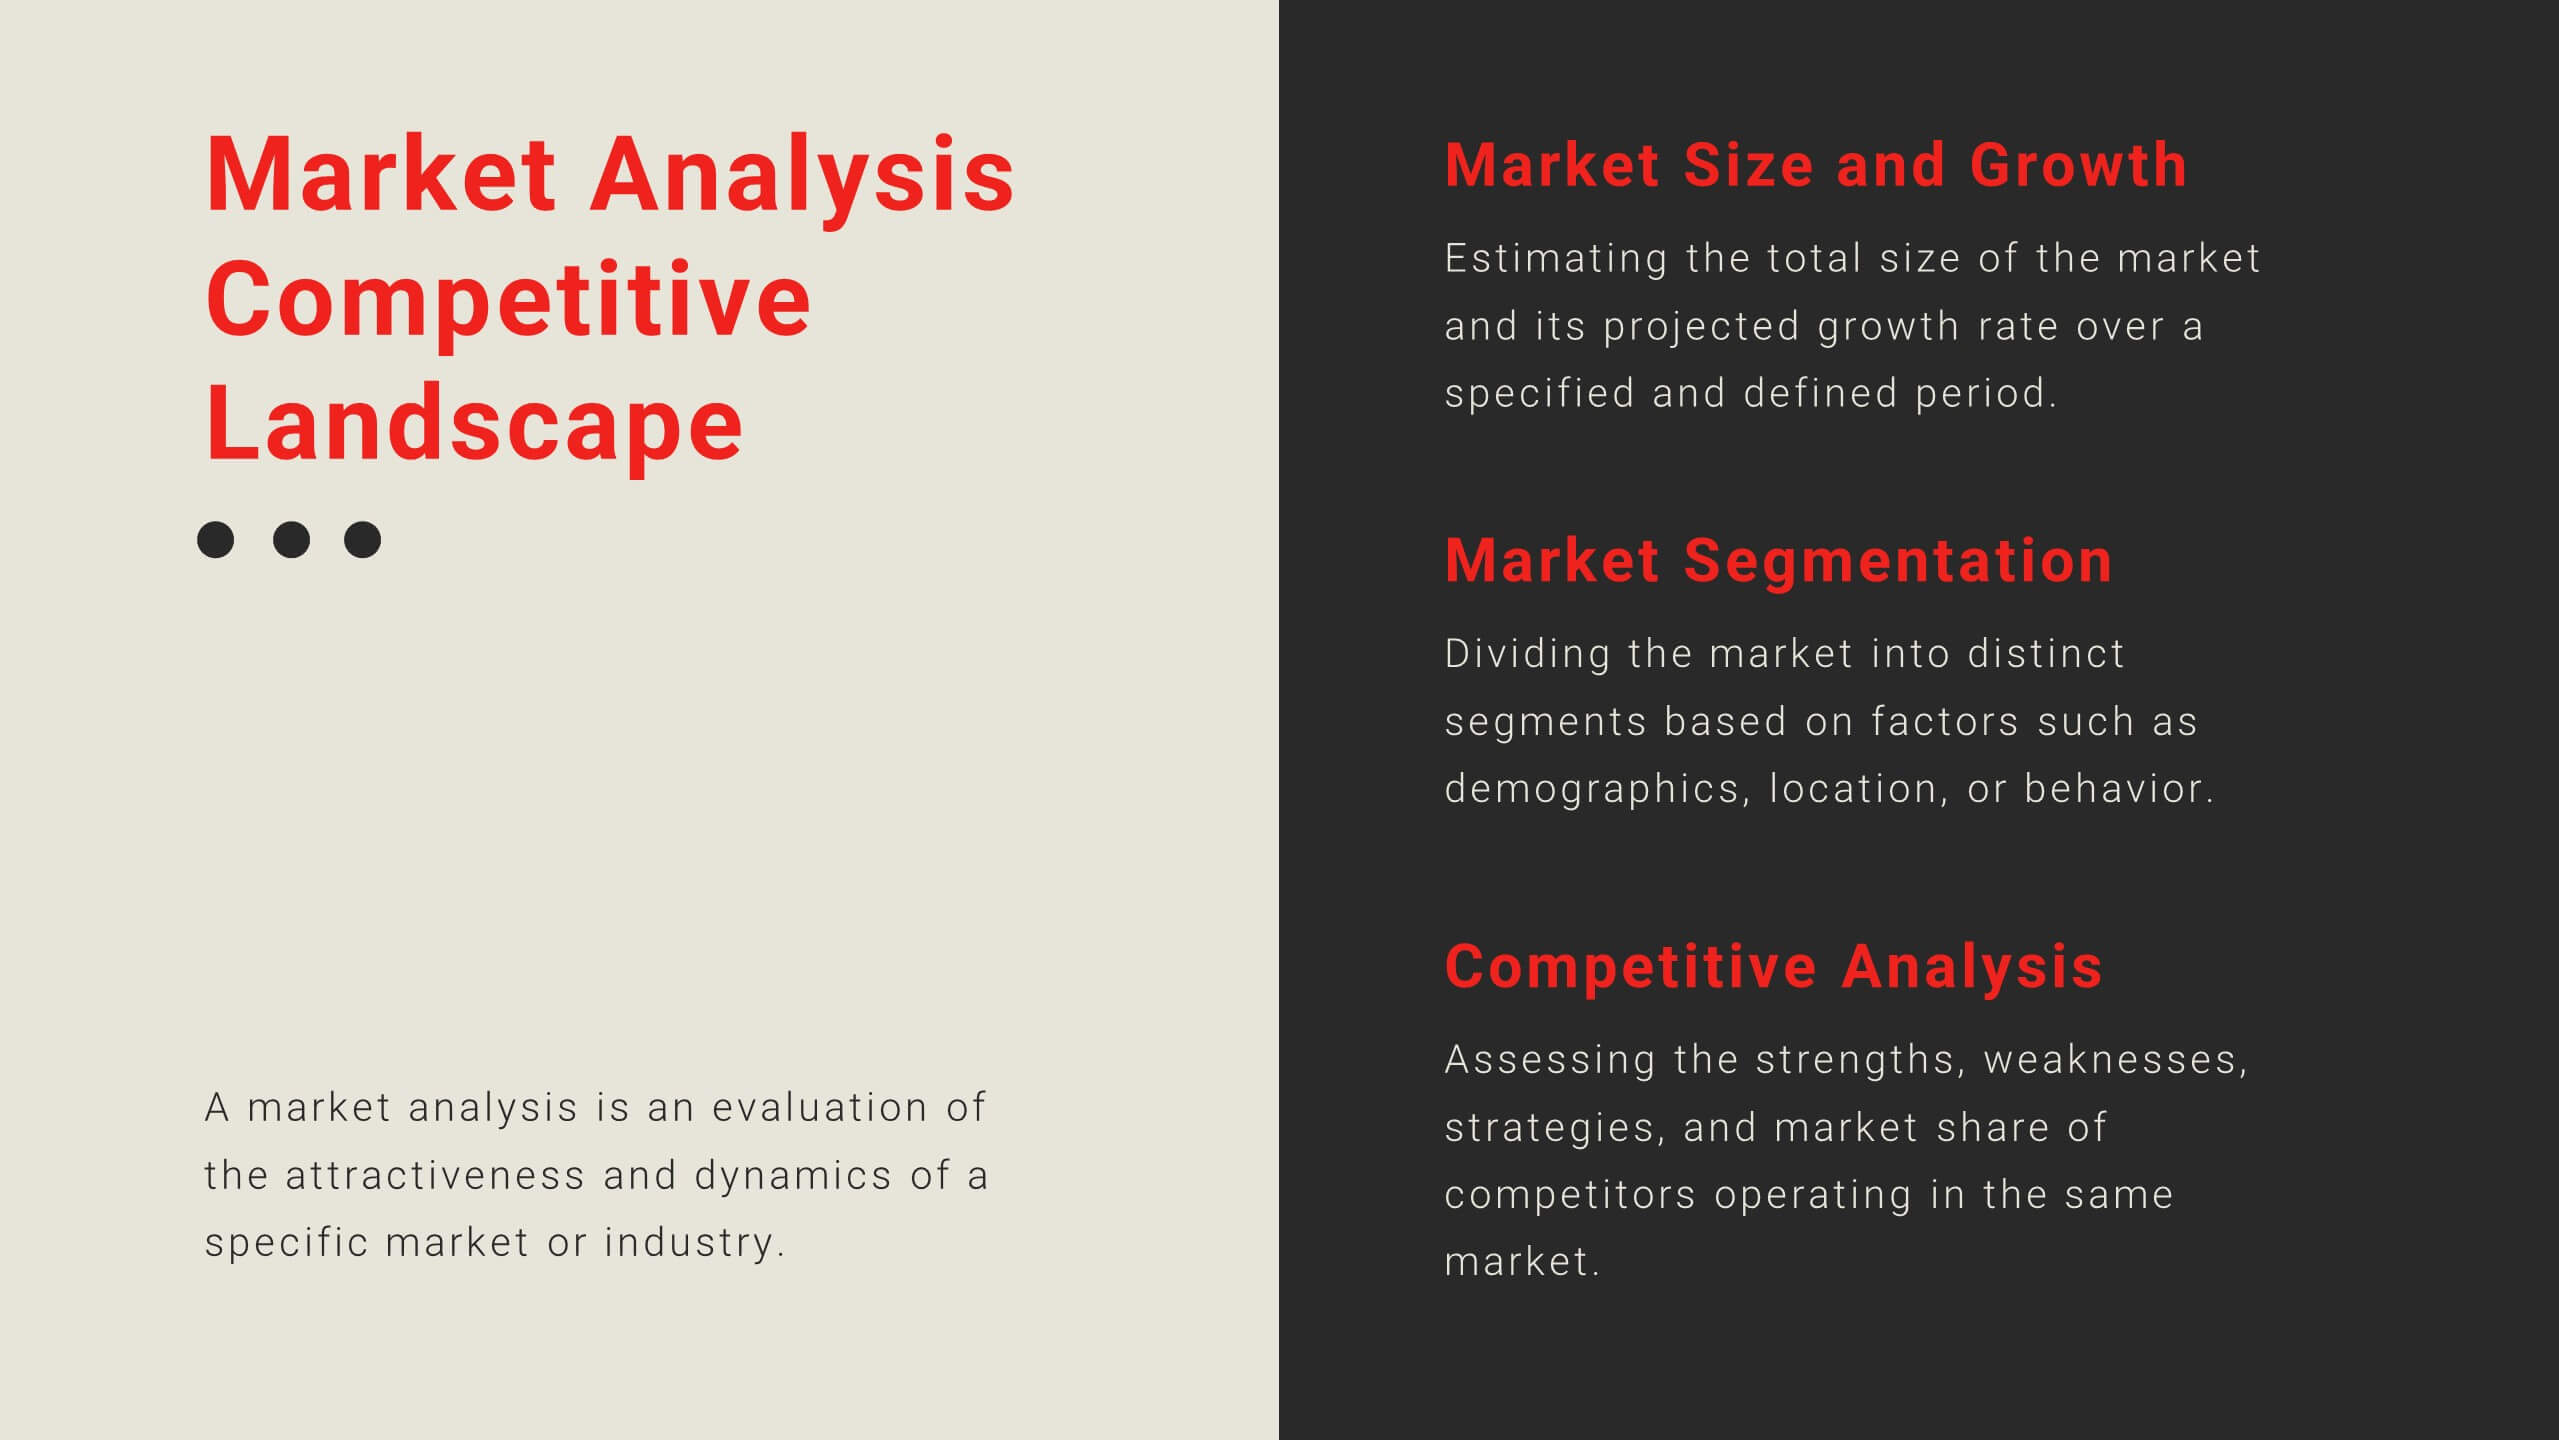
Validation Pitch Deck
A Validation Pitch Deck, is a visual presentation that provides an overview of a startup company's business idea, market opportunity, value proposition, and progress towards validation of its concept or product. This template consists of a series of slides that are designed to convey the key elements of your business model in a concise and persuasive manner. Use this template as a tool to communicate your vision, market opportunity, and progress to potential investors or other stakeholders. Compatible with PowerPoint, Keynote, and Google Slides. The color scheme and design elements can be easily customized to match your brand or business.


10 diapositivas
Chronological Event Timeline Presentation
Present events with clarity using this linear timeline slide. Ideal for showcasing project milestones, historical developments, or sequential achievements. Features 5 editable points with icons, titles, and dates for easy customization. Compatible with PowerPoint, Keynote, and Google Slides—perfect for planners, managers, educators, and strategists needing organized time-based visuals.


5 diapositivas
Creative Brainstorming Presentation
Enhance your brainstorming sessions with this Creative Brainstorming template. Designed with a modern head outline and idea mapping structure, it visually organizes key insights for innovative discussions. Fully customizable with editable text, colors, and icons to fit your needs. Compatible with PowerPoint, Keynote, and Google Slides for seamless integration.


20 diapositivas
Legendra Artist Portfolio Presentation
Showcase your creative journey with this dynamic artist portfolio presentation template. Highlight your featured projects, creative process, collaborations, and pricing in a visually engaging format. Perfect for artists, designers, and creative professionals looking to impress potential clients. Fully editable in PowerPoint, Keynote, and Google Slides.


12 diapositivas
Investment Strategy Presentation
The "Investment Strategy Presentation" template is designed for effectively mapping out and displaying various investment strategies. It uses a multi-colored light bulb graphic, which symbolizes ideas and innovation in investment planning, making it visually appealing and easy to understand. Each segment of the light bulb is labeled with letters A through F, representing different aspects or phases of an investment strategy that can be tailored to specific objectives or points of discussion. This format helps in presenting complex financial data or strategies in a straightforward manner that can be easily grasped by audiences, making it an ideal choice for financial analysts, investors, or corporate strategy meetings.


6 diapositivas
Leadership Program Infographic
A leadership program is a structured and intentional learning experience designed to develop and enhance leadership skills and qualities in individuals. This infographic template aims to provide a concise overview of the program's objectives, target audience, curriculum, and expected outcomes. This template includes icons, graphics, and color schemes that align with the organization's branding and make the infographic visually appealing. This infographic serves as an effective marketing tool to attract potential participants, showcase the value of the program, and communicate the positive outcomes of joining the leadership development journey.


6 diapositivas
Porter's Five Forces Management Infographic
Porter's Five Forces is a framework, that helps businesses understand the attractiveness and profitability of an industry by examining five key forces that shape its competitive landscape. These infographic templates provide a visually appealing and concise overview of Porter's Five Forces framework. They are designed to help businesses and professionals analyze the competitive dynamics of an industry and make informed strategic decisions. By using this to help your audience understand the forces that shape industry competitiveness, they can identify potential threats and opportunities to make informed decisions, and gain a competitive edge.


7 diapositivas
Vacations Travel Infographic
Are you ready to embark on a journey around the world? Our Vacations Travel Infographic is your ultimate guide to thrilling destinations, exotic experiences, and memorable adventures. Whether you're a passionate traveler seeking new horizons or an explorer at heart, this infographic is designed to ignite your wanderlust and set your vacation dreams on fire. Compatible with Powerpoint, Keynote, and Google Slides. Dive into the world of travel with this vivid infographic that sparks excitement and eagerness to discover what lies beyond. This template is not just a visual delight, it's a roadmap to your dream vacation!


5 diapositivas
Secure Cloud Storage and Access Presentation
Highlight your data protection strategy with the Secure Cloud Storage and Access presentation slide. Featuring a central cloud shield icon with five connected callouts, it’s perfect for illustrating encryption methods, access protocols, or compliance points. Fully editable in PowerPoint, Keynote, and Google Slides.