


Características


¿Tienes alguna pregunta?
Recomendar


7 diapositivas
Break Even Point Infographic Presentation
A Break Even Analysis Infographic is a visual tool that helps businesses and organizations understand the point at which they will begin to make a profit. This template uses a graph to show the relationship between fixed costs, revenue, and profits at different levels of production or sales. This Infographic also includes a graph with two lines: one representing fixed costs and the other representing total revenue. The point at which these lines intersect represents the break-even point, which is the level of sales or production at which the business will neither make a profit nor incur a loss.


5 diapositivas
Modern Tech Stack Overview Presentation
Showcase your technology architecture with this Modern Tech Stack Overview. Featuring a robotic hand and circular layout, it’s ideal for product demos, software architecture, or developer briefings. Designed for PowerPoint, Keynote, and Google Slides, this deck makes complex tech structures easy to understand and visually engaging for modern audiences.


3 diapositivas
Persona Mapping for Target Audience Presentation
Get clear on who you're speaking to with this visual persona mapping slide. Ideal for marketing plans, customer research, or segmentation strategies, this layout helps you define and compare target audience types with clean icons and text space. Fully editable and works with PowerPoint, Keynote, and Google Slides.


26 diapositivas
Financial Literacy Simple Presentation
Our "Financial Literacy" template is a must-have for anyone teaching money management, savings, and investment strategies. Compatible with PowerPoint, Keynote, and Google Slides, it makes financial education accessible and engaging. Introduce the basics with "Financial Literacy: Creating a Smarter Tomorrow" and outline your agenda with the "Table of Contents." The "Meet Our Team" slide can spotlight your financial experts, and the "Three Option Slide" breaks down key concepts like budgeting, saving, and investing. The "This is your big image slide" can visualize financial goals, while "Earn, Save, Invest, Protect." reinforces sound financial habits. Use "This is your Chart Slide" to present data on spending patterns and "Brain Infographic" to explore the psychology of spending. The template's clean design and customizable features make it easy to tailor your financial literacy presentation to any audience, ensuring that your message on smart money management is clear and impactful.


20 diapositivas
Starbound Sales Proposal Presentation
Close deals with confidence using this polished and professional sales proposal presentation! It covers everything from target market analysis and pricing strategies to sales objectives, performance metrics, and future opportunities, ensuring a complete pitch. Perfect for client meetings and business proposals, this template works seamlessly with PowerPoint, Keynote, and Google Slides.


6 diapositivas
Real-Life Business Case Study Review Presentation
Break down complex scenarios into clear, visual insights with the Real-Life Business Case Study Review Presentation. This template uses a 5-step horizontal hexagon layout to guide your audience through each stage of a business case—ideal for timelines, project phases, or outcome reviews. Fully editable in PowerPoint, Keynote, and Google Slides.


20 diapositivas
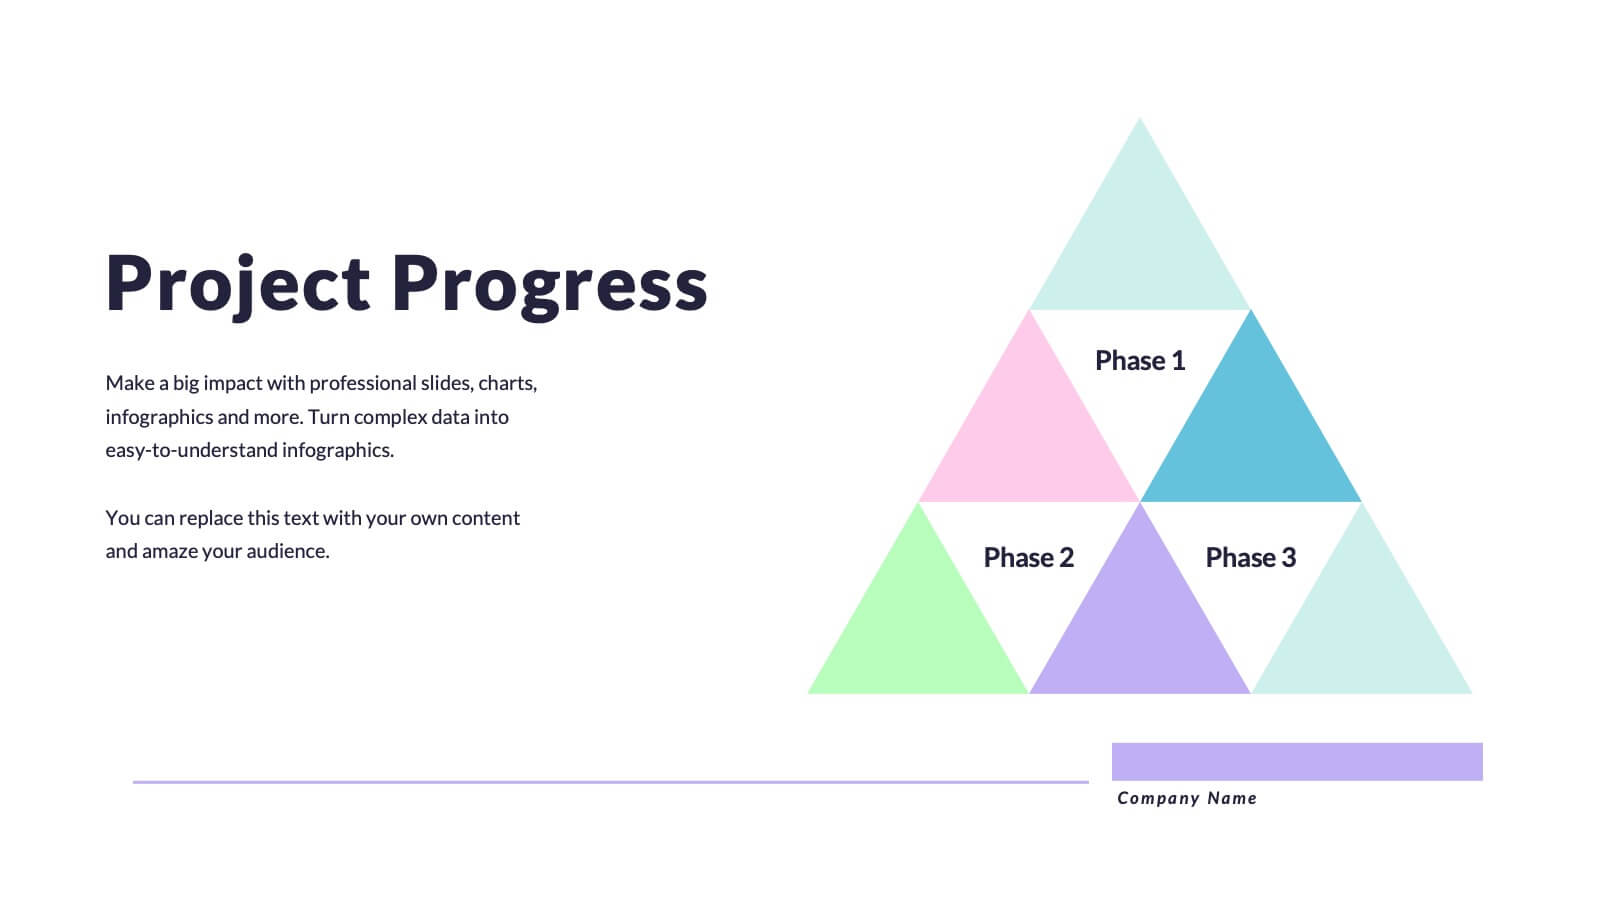
Ignisiel Sales Performance Report Presentation
Present your sales performance insights with a bold and professional edge using this dynamic presentation template. Designed to highlight every critical aspect of your sales achievements, it features slides for company introductions, service overviews, and target market analysis. Dive deeper into your success with sections on sales objectives, competitive analysis, and an in-depth performance metrics breakdown. Showcase your team’s efforts with slides for team introductions and build trust through customer testimonials. Financials are made clear with slides for pricing strategies and enticing promotions and discounts. Wrap up your presentation with actionable slides for future opportunities and an organized feedback section to engage stakeholders effectively. Fully customizable and compatible with PowerPoint, Google Slides, and Keynote, this template ensures your message is delivered with clarity and style. Perfect for businesses aiming to make a bold impression.


5 diapositivas
Advances in Technology Infographics
Advances in Technology have transformed the world in a number of ways and have had a significant impact on society. These Infographic templates are dynamic and visually appealing tools for showcasing the latest advancements in technology across various fields. Whether you're discussing breakthroughs in electric cars, robotics, biotechnology, or any other cutting-edge technology, this template has you covered. With its modern and sleek design, this template captures the essence of technological innovation. It features a range of customizable design elements enabling you to present data-driven information in a visually engaging way.


21 diapositivas
Alchemos UX Case Study Presentation
Showcase your UX process with clarity and impact using this sleek case study presentation. Covering key aspects like user research, interaction design, prototyping, and responsive design, this template helps you tell a compelling design story. Fully customizable and compatible with PowerPoint, Keynote, and Google Slides for a seamless presentation experience.


7 diapositivas
7 Elements of McKinsey Framework Presentation
Turn complex organizational elements into a simple, story-driven visual with a clean layout that highlights how each component connects back to core values. This presentation helps you explain relationships, improve alignment, and support strategic decision-making with clarity and ease. Fully editable and compatible with PowerPoint, Keynote, and Google Slides.


5 diapositivas
USA Economy Infographics
The U.S. economy has a significant impact on the global economy and serves as a benchmark for economic performance. These vertical infographics are the perfect tool to present your key facts, statistics, and trends to help the audience understand the economic landscape of the country. The visually appealing design included, coupled with concise and relevant information, helps to effectively communicate the complexities of the economy. Whether used for educational purposes or as a reference tool, these templates provides a comprehensive overview of the USA economy and its key components. Fully compatible with Powerpoint, Keynote, and Google Slides.


22 diapositivas
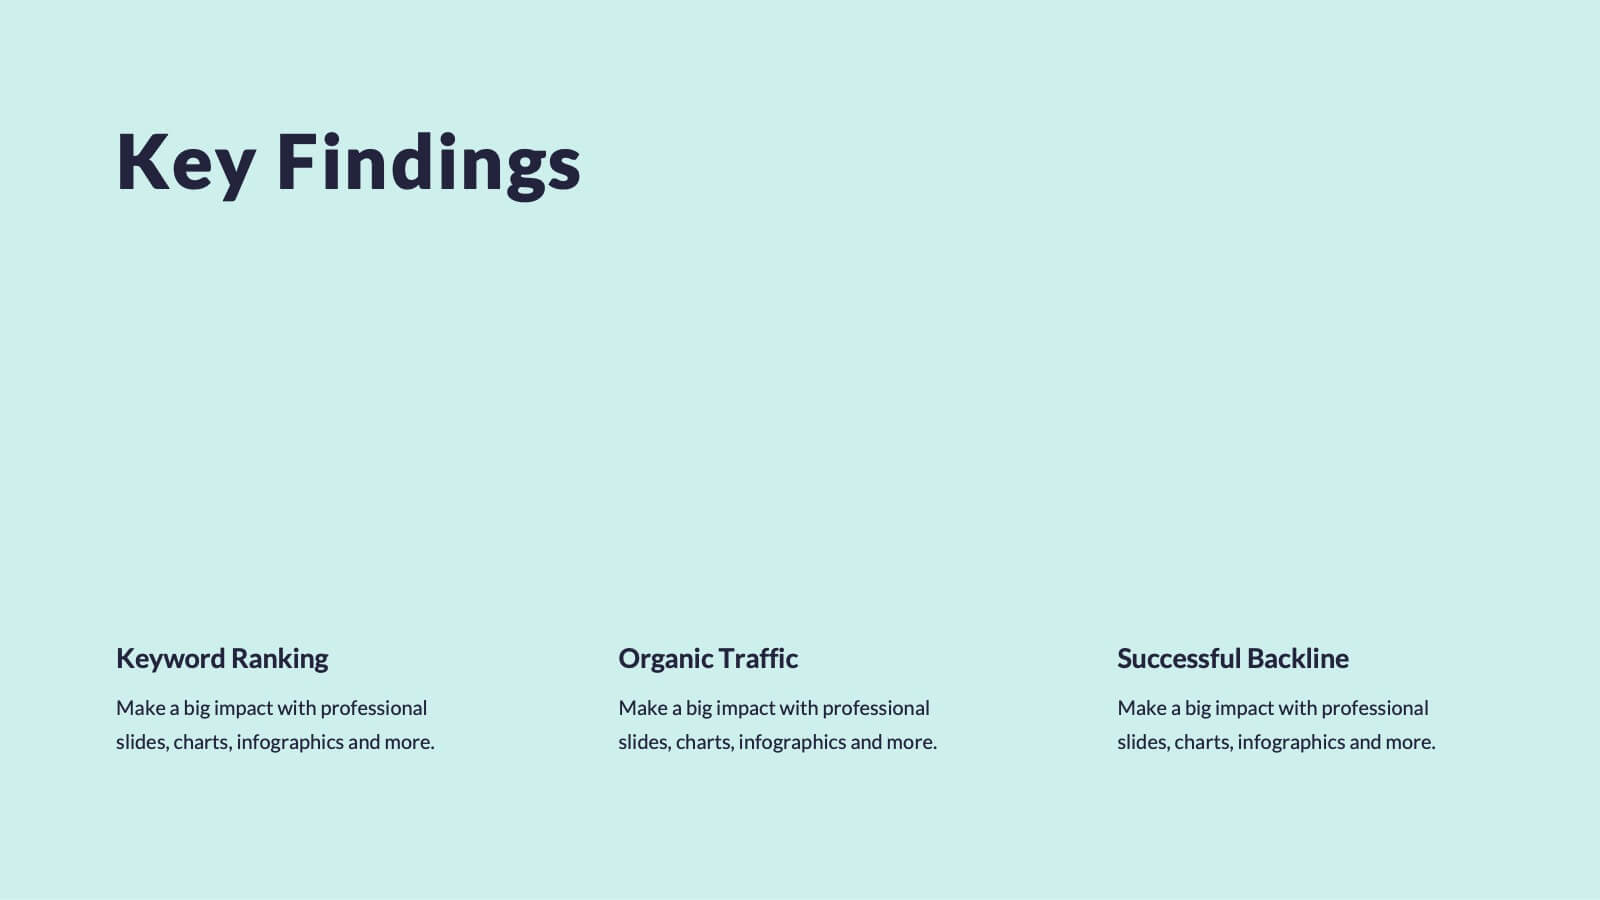
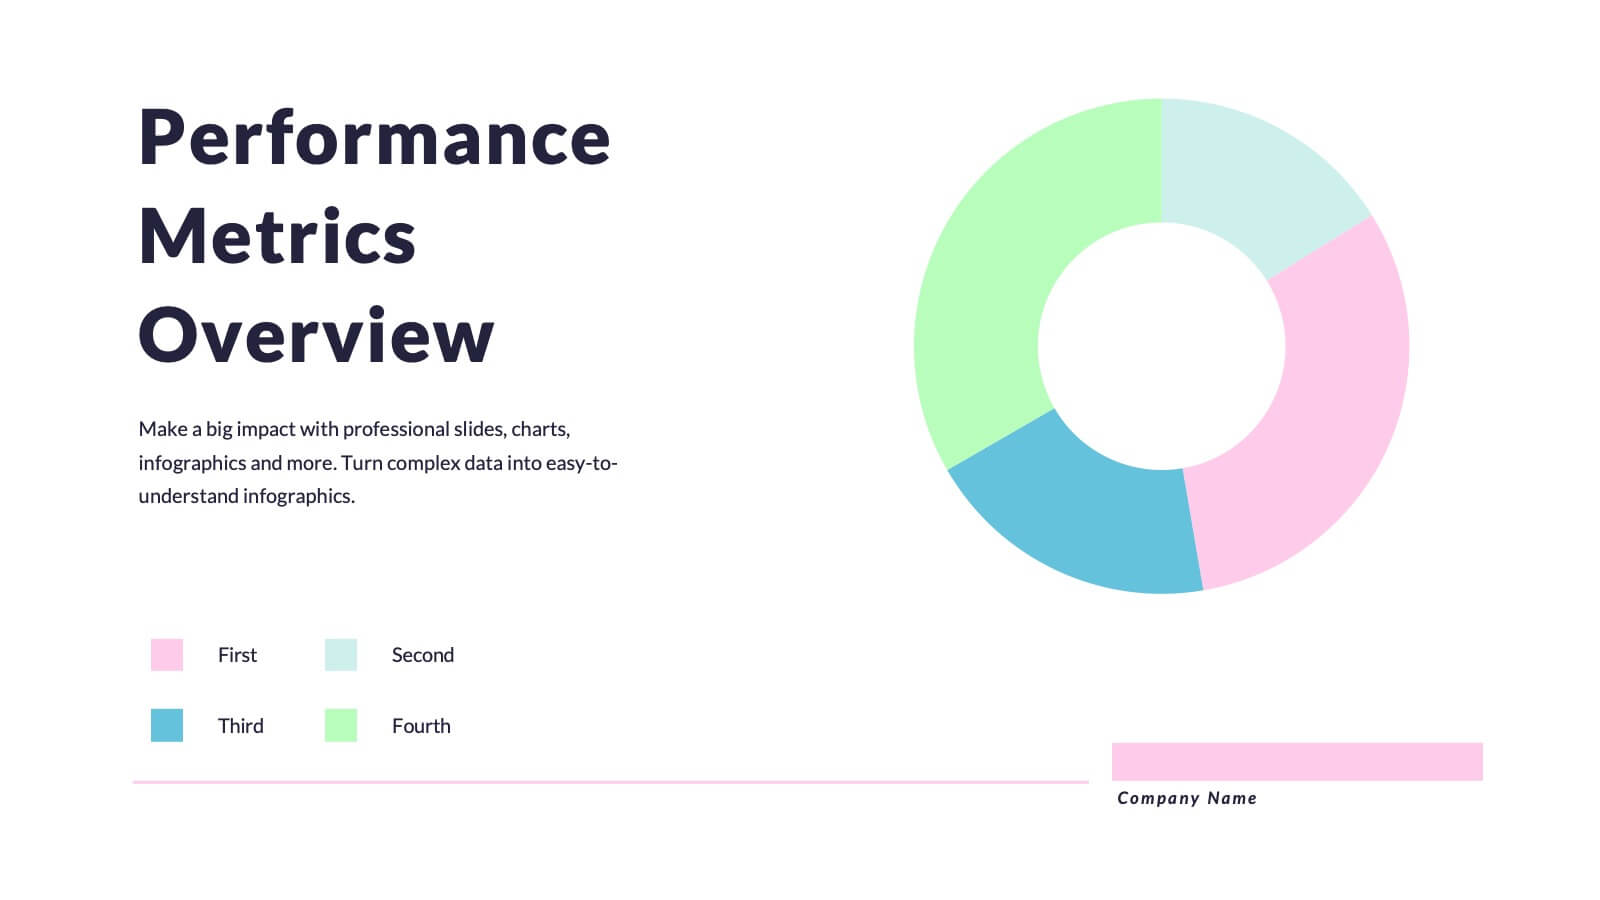
Quantum Research Findings Report Presentation
Discover insights like never before with this vibrant presentation template! Perfect for showcasing research findings, it includes slides for key findings, performance metrics, and market trends. Clearly present data and engage your audience with visually appealing graphics. Compatible with PowerPoint, Keynote, and Google Slides, making it easy to use on any platform.


6 diapositivas
Customer Targeting Strategy Overview Presentation
Present your customer approach clearly with this Customer Targeting Strategy Overview presentation. Featuring a central persona with speech bubble-style segments, this layout is perfect for showcasing targeting methods, segmentation insights, or buyer personas. Ideal for marketers and strategists. Fully editable in Canva, PowerPoint, and Google Slides for easy customization.


20 diapositivas
Victoria Design Strategy Proposal Presentation
This design strategy proposal template, crafted with a soft, modern aesthetic, offers a comprehensive layout for presenting design elements, processes, and deliverables. Each slide provides a clean, structured approach to showcase your brand’s design brief, target audience, color palette, typography, mood board, and project timeline. Perfect for designers and agencies, it supports PowerPoint, Keynote, and Google Slides for versatile use.


7 diapositivas
Company Title Infographic
This collection of slides is designed to vividly present company profiles and services, utilizing a dynamic color palette of blue, yellow, and white to create an engaging viewer experience. Each slide is meticulously crafted to cater to specific content, enhancing the presentation's overall effectiveness and appeal. Starting with the "Empathy Map" slide, it offers a detailed insight into customer perceptions and experiences, essential for tailoring services to meet client needs. The "SEO Report" slide focuses on showcasing quantifiable data, critical for evaluating marketing success. A dedicated "Portfolio" slide highlights past achievements, pivotal for attracting potential clients and investors by demonstrating proven capability and success. Further slides like "What We Do" and "Objectives" provide clear, straightforward layouts that detail the company’s primary activities and strategic goals, respectively. The "Projects" slide offers a glimpse into current and prospective projects, illustrating ongoing development and future aspirations. Ideal for stakeholder briefings, marketing pitches, or internal reviews, these templates support companies in communicating a cohesive and comprehensive narrative of their operational scope and strategic direction.


22 diapositivas
Radiance UX Research Report Presentation
This engaging UX research report template is designed to captivate your audience! With sections like user research, journey mapping, prototyping, and testing, it showcases the entire UX process effortlessly. Fully customizable and compatible with PowerPoint, Keynote, and Google Slides, this template is perfect for presenting your design insights with professionalism and flair.


8 diapositivas
Leadership and Management Presentation
The "Leadership and Management" presentation template uses a mountain metaphor to visually depict the challenges and achievements in leadership and management roles. Each slide features a series of peaks, symbolizing different stages or goals within a project or initiative. The climbers on various parts of the mountain can represent team members or leaders at different phases of their tasks. This template is versatile, suitable for presentations aimed at discussing strategies, milestones, or team dynamics in corporate settings. It offers a clear and engaging way to present complex information through a straightforward visual narrative.