


Características


¿Tienes alguna pregunta?
Recomendar


20 diapositivas
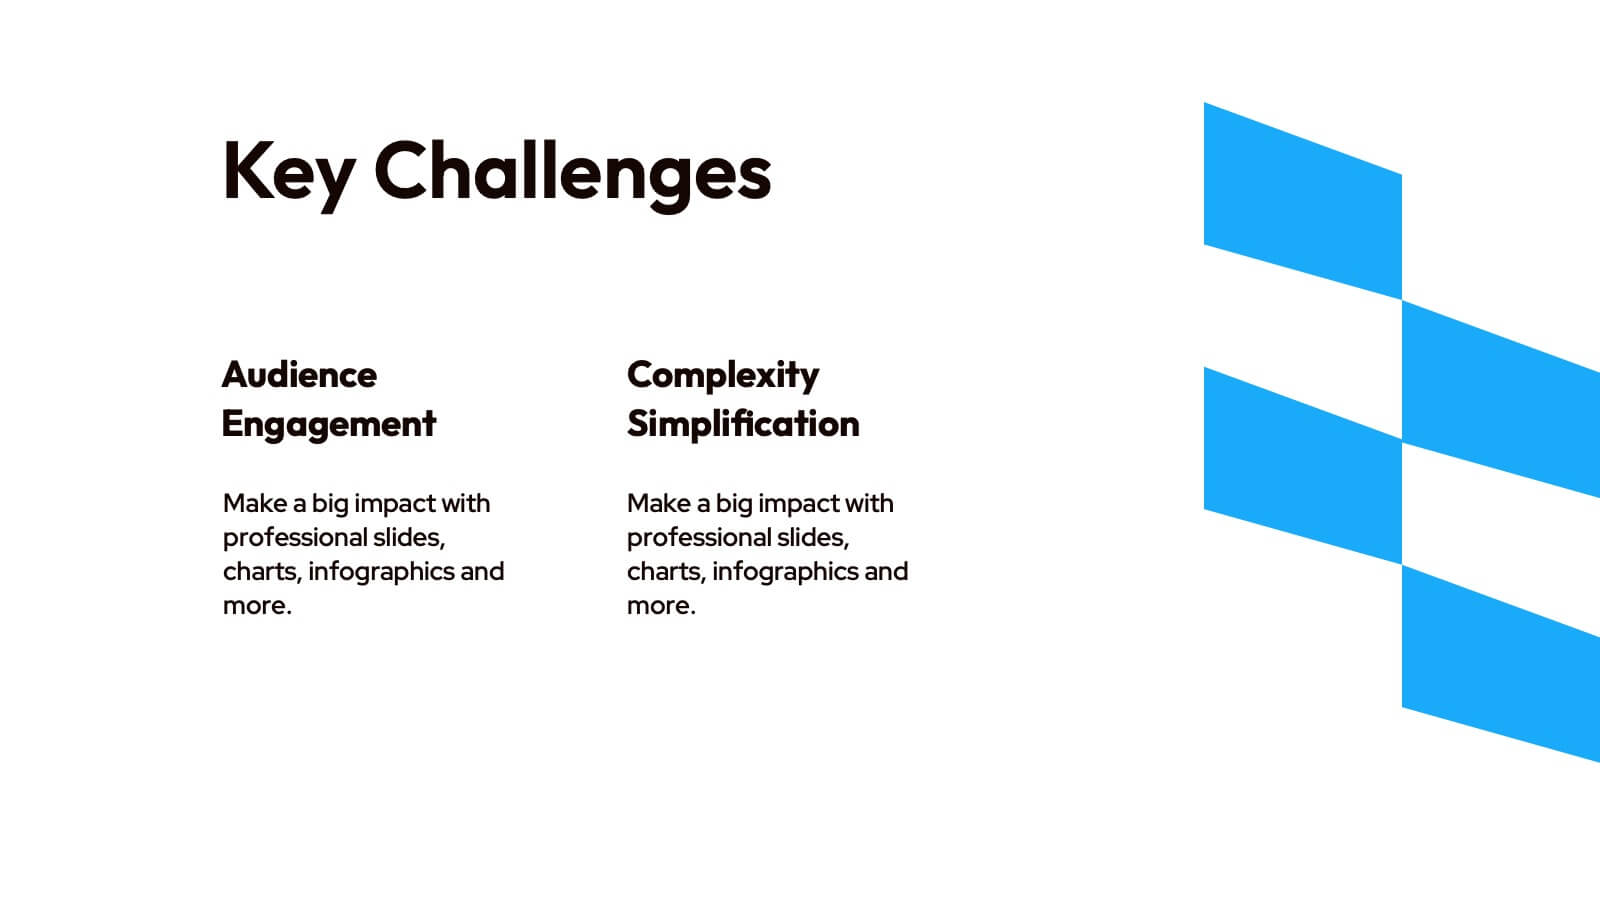
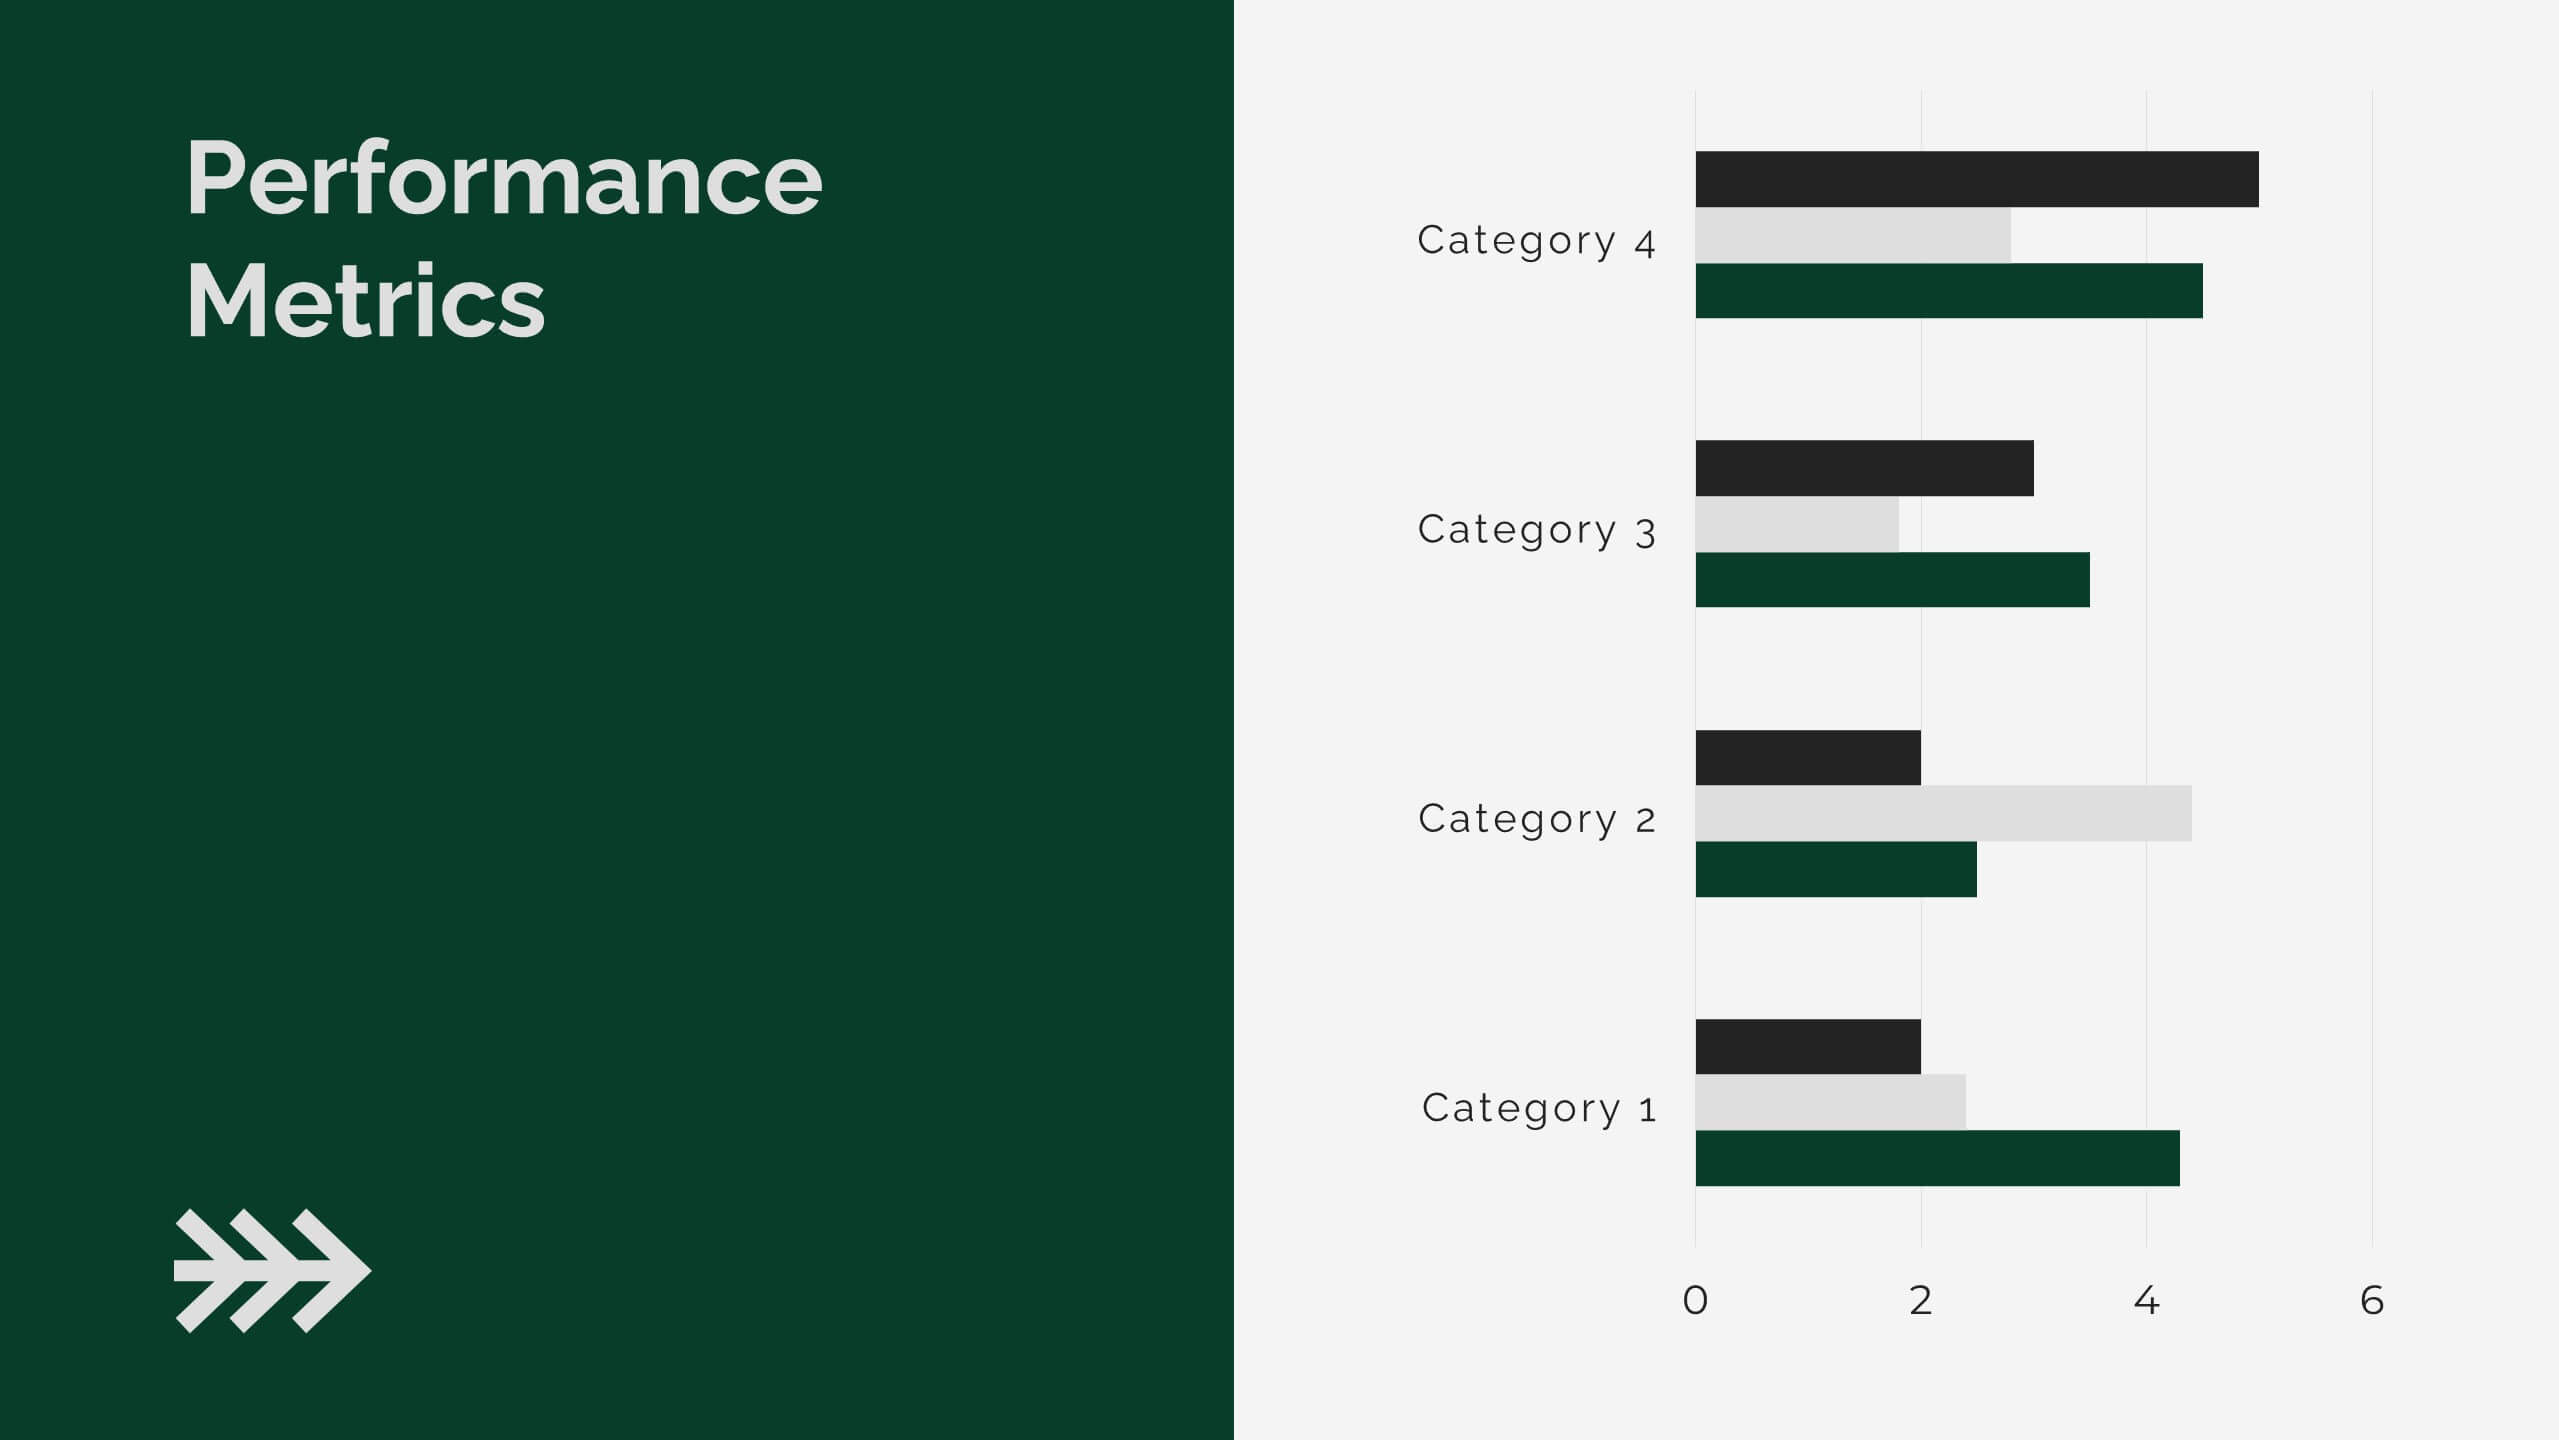
Obscuran Sales Performance Report Presentation
Take your sales analysis to the next level with this sleek and professional presentation template. Designed to highlight key areas such as sales objectives, process, performance metrics, competitive analysis, pricing strategy, and future opportunities. This modern layout ensures clarity and impact, making it perfect for sales teams, managers, and stakeholders. Fully customizable and compatible with PowerPoint, Keynote, and Google Slides.


20 diapositivas
Team Meeting Presentation
Streamline your team meetings with this professional presentation template, designed in striking purple tones. It covers all essential aspects from agenda setting to feedback collection, ensuring efficient and effective communication. Compatible with PowerPoint, Google Slides, and Keynote, this template is perfect for keeping your team aligned and focused.


5 diapositivas
Product Development and Innovation Presentation
Showcase your Product Development and Innovation process with this structured and visually appealing infographic. Designed with interconnected gears and a step-by-step approach, this template is ideal for illustrating stages of product design, research, and launch. Fully customizable and compatible with PowerPoint, Keynote, and Google Slides.


4 diapositivas
Brain Function Breakdown Chart Presentation
Bring clarity to complex thinking with a visual layout that highlights key mental processes in a clean, engaging way. This presentation helps you explain cognitive functions, organize insights, and break down information into easy-to-follow sections. Perfect for education, training, or research. Fully compatible with PowerPoint, Keynote, and Google Slides.


5 diapositivas
Real-Life Case Study Analysis Presentation
Turn data and insights into compelling stories that capture real business impact. This clean, professional layout is perfect for analyzing real-world examples, comparing strategies, and presenting key takeaways. Easy to customize and visually balanced, it’s fully compatible with PowerPoint, Keynote, and Google Slides for seamless use across platforms.


5 diapositivas
Campaign Funnel & Outreach Strategy Presentation
Present your marketing funnel clearly with this layered funnel chart design. Ideal for outlining awareness, engagement, and conversion stages, this slide helps visualize outreach strategies effectively. Fully editable in PowerPoint, Keynote, and Google Slides—perfect for campaign overviews, marketing reports, or client presentations that require structured, strategic communication.


21 diapositivas
Thistlewood Strategic Planning Report Presentation
This comprehensive template is ideal for strategic planning, featuring slides for market analysis, SWOT evaluation, growth opportunities, and resource allocation. Showcase timelines, milestones, risk management, and communication strategies. Fully customizable, it’s perfect for delivering professional insights. Compatible with PowerPoint, Keynote, and Google Slides.


5 diapositivas
Innovative Concept Pitch Presentation
Present your big ideas with impact using this lightbulb puzzle infographic. Perfect for concept development, product ideation, or startup pitches. The layered segments help structure your content clearly. Fully customizable in PowerPoint, Keynote, and Google Slides—ideal for innovation roadmaps, creative planning, or visualizing business concepts.


6 diapositivas
High-Performance Team Building Presentation
Boost team efficiency with the High-Performance Team Building presentation template. Designed to visualize team development stages, leadership strategies, and collaboration efforts, this template is perfect for managers, HR teams, and trainers. The pyramid and rocket-themed design illustrates goal progression, making it easy to track growth. Fully customizable and compatible with PowerPoint, Keynote, and Google Slides.


5 diapositivas
Closing Talent Gaps with Skills Data Presentation
Showcase a clear talent strategy with the Closing Talent Gaps with Skills Data Presentation. This infographic-style layout visualizes key workforce stages, helping teams align talent capabilities with organizational needs. Ideal for HR, L&D, and talent management discussions. Fully customizable in Canva, PowerPoint, Google Slides, and Keynote.


22 diapositivas
Starlit Agency Portfolio Presentation
The Starlit Agency Portfolio template is a sophisticated way to highlight your agency's expertise, achievements, and creative vision! Perfect for presenting to potential clients or partners, this template starts with a polished introduction and an "About Us" section that clearly defines your agency's mission and vision. Showcase your team's skills and services in an organized manner, making it easy for clients to understand what you offer. With slides dedicated to client success stories, case studies, and market analysis, you can build trust by displaying your proven track record. Highlight industry trends and your agency's approach to creative processes to demonstrate your strategic thinking. The template also includes sections for strategy development, campaign execution, and measurement analytics, ensuring you cover all aspects of your services. Close with client testimonials, partnership opportunities, and a future outlook, leaving your audience impressed. This template is fully compatible with PowerPoint, Keynote, and Google Slides, making it versatile and easy to use for any presentation.


7 diapositivas
Stores Pricing Tables Infographic Presentation
A Pricing Table Infographic is a visual representation of the prices and features of different products or services offered by a company. This template is designed so you can compare and contrast the different options available to potential customers, and to make an informed decision based on their needs and budget. This template includes a table that lists the different products and services, along with their prices, features, and any other relevant information you chose to include. It also include charts or graphs to help visualize the differences between the different options available.


5 diapositivas
Revenue Streams & Expense Management Layout Presentation
Visualize your income and costs with the Revenue Streams & Expense Management Layout Presentation. This slide layout uses a vertical arrow chart to display four data categories, ideal for comparing sources of income and related expenditures. Great for financial reports, budgeting reviews, and strategy discussions. Compatible with Canva, PowerPoint, Google Slides, and Keynote.


20 diapositivas
Leafsong Design Strategy Proposal Presentation
This Design Strategy Presentation Template is perfect for showcasing your creative process, key design elements, and project planning. Covering essential aspects like moodboards, prototypes, and design assets, it ensures a structured and visually appealing approach. Fully customizable and compatible with PowerPoint, Keynote, and Google Slides.


6 diapositivas
Scientific Experiment Presentation Template Presentation
Showcase your research with clarity using this Scientific Experiment Presentation Template. Featuring lab-themed visuals like microscopes and molecular diagrams, it’s perfect for sharing hypotheses, procedures, and results. Ideal for science professionals and students, this editable deck works seamlessly with PowerPoint, Keynote, and Google Slides for compelling, educational presentations.


26 diapositivas
Salus Rebranding Project Plan Presentation
This rebranding project plan template offers a clear framework for presenting brand identity transformation. Covering brand values, identity components, target audience, positioning, and guidelines, it’s ideal for companies refreshing their brand. Compatible with PowerPoint, Keynote, and Google Slides, it ensures a streamlined, professional presentation of your rebranding strategy.


10 diapositivas
Marketing Wheels Strategy Presentation
Turn your marketing process into a powerful visual story with this dynamic circular design. Each stage connects seamlessly to highlight planning, execution, and performance insights. Perfect for illustrating campaigns, workflows, or business strategies. Fully customizable and compatible with PowerPoint, Keynote, and Google Slides for effortless editing and presentation.