


Características


¿Tienes alguna pregunta?
Recomendar


5 diapositivas
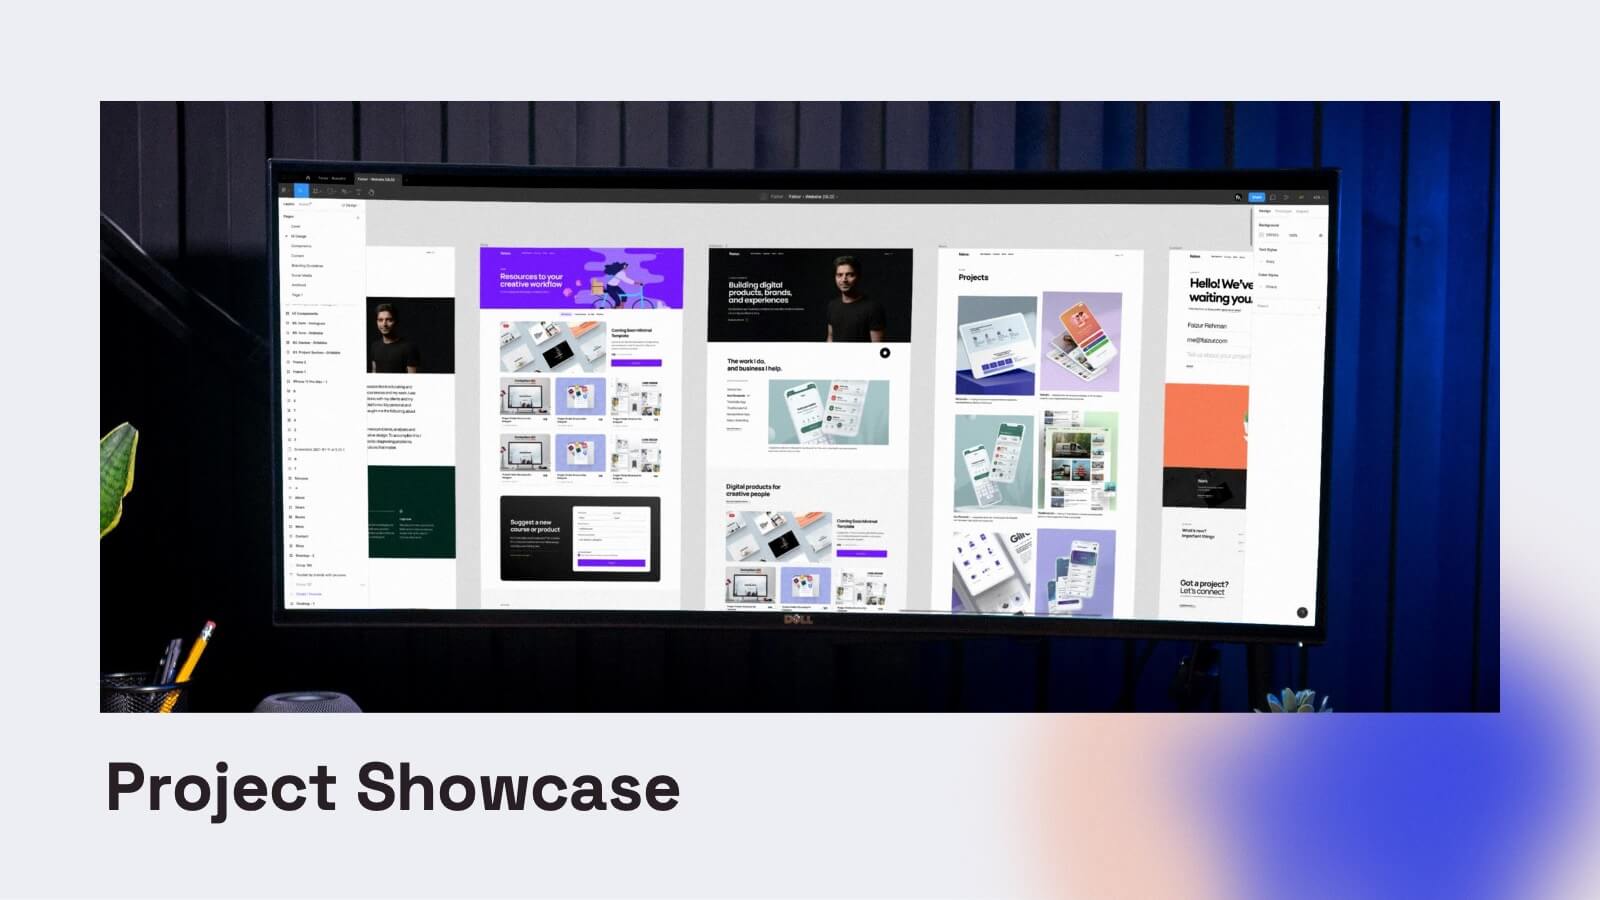
Website UI Mockup Device Display
Present your web interface with clarity and flair using this clean device display slide. Designed around a desktop monitor mockup, it’s perfect for showcasing UI designs, website pages, or digital layouts. Fully customizable in PowerPoint, Keynote, and Google Slides—edit colors, fonts, and content to match your project needs.


5 diapositivas
5-Level Smile Rating Presentation
Give your audience a fun, visual way to understand sentiment with this colorful rating slide. Perfect for feedback summaries, project reviews, or performance insights, it displays five clear emotion levels in a simple, engaging format. Easy to customize and fully compatible with PowerPoint, Keynote, and Google Slides.


7 diapositivas
Business 3D Infographic
Bring a new dimension to your business presentations with our 3D Business Infographics. These dynamic visuals are perfect for professionals and educators who want to add depth to their data representation and make complex information more accessible. Our 3D Business Infographics collection features a range of formats, from layered pyramids to multidimensional bar graphs, allowing for innovative depictions of hierarchies, relationships, and progressions. Whether you're illustrating strategic frameworks, financial analysis, or project milestones, these graphics can enhance understanding and engagement. Customizable for any business context, these infographics are designed to stand out in reports, presentations, or educational materials. Their SEO-friendly nature ensures that your content is more likely to be seen and shared, extending your reach. Use these 3D infographics to make a strong visual impact that communicates your business concepts with clarity and creativity.


8 diapositivas
Customer Market Segmentation Analysis
Visualize your audience insights with precision using the Customer Market Segmentation Analysis Presentation. This slide features a sleek, layered funnel design with percentage bars and arrow pointers—ideal for illustrating demographic splits, buyer behavior, or psychographic segments. With space for four data-driven categories and custom labels, this template is perfect for marketers, analysts, and product teams looking to present actionable customer data. Fully editable in PowerPoint, Keynote, and Google Slides, and easy to adapt to any color scheme or branding.


6 diapositivas
Break Even Analysis Rate Infographics
Analyze your business's break-even point effectively with our Break-Even Analysis Rate infographic template. This template is fully compatible with popular presentation software like PowerPoint, Keynote, and Google Slides, allowing you to easily customize it to illustrate and communicate critical break-even analysis concepts. The Break-Even Analysis Rate infographic template offers a visually engaging platform to calculate and display the point at which your business covers all its costs and begins to generate a profit. Whether you're an entrepreneur, financial analyst, or business owner, this template provides a user-friendly canvas to create informative presentations and reports on your break-even analysis. Optimize your financial decision-making with this SEO-optimized Break-Even Analysis Rate infographic template, thoughtfully designed for clarity and ease of use. Customize it to showcase your break-even calculations, assumptions, and scenarios, helping you make informed decisions about pricing, costs, and profitability. Start crafting your personalized infographic today to enhance your break-even analysis skills and strategies.


19 diapositivas
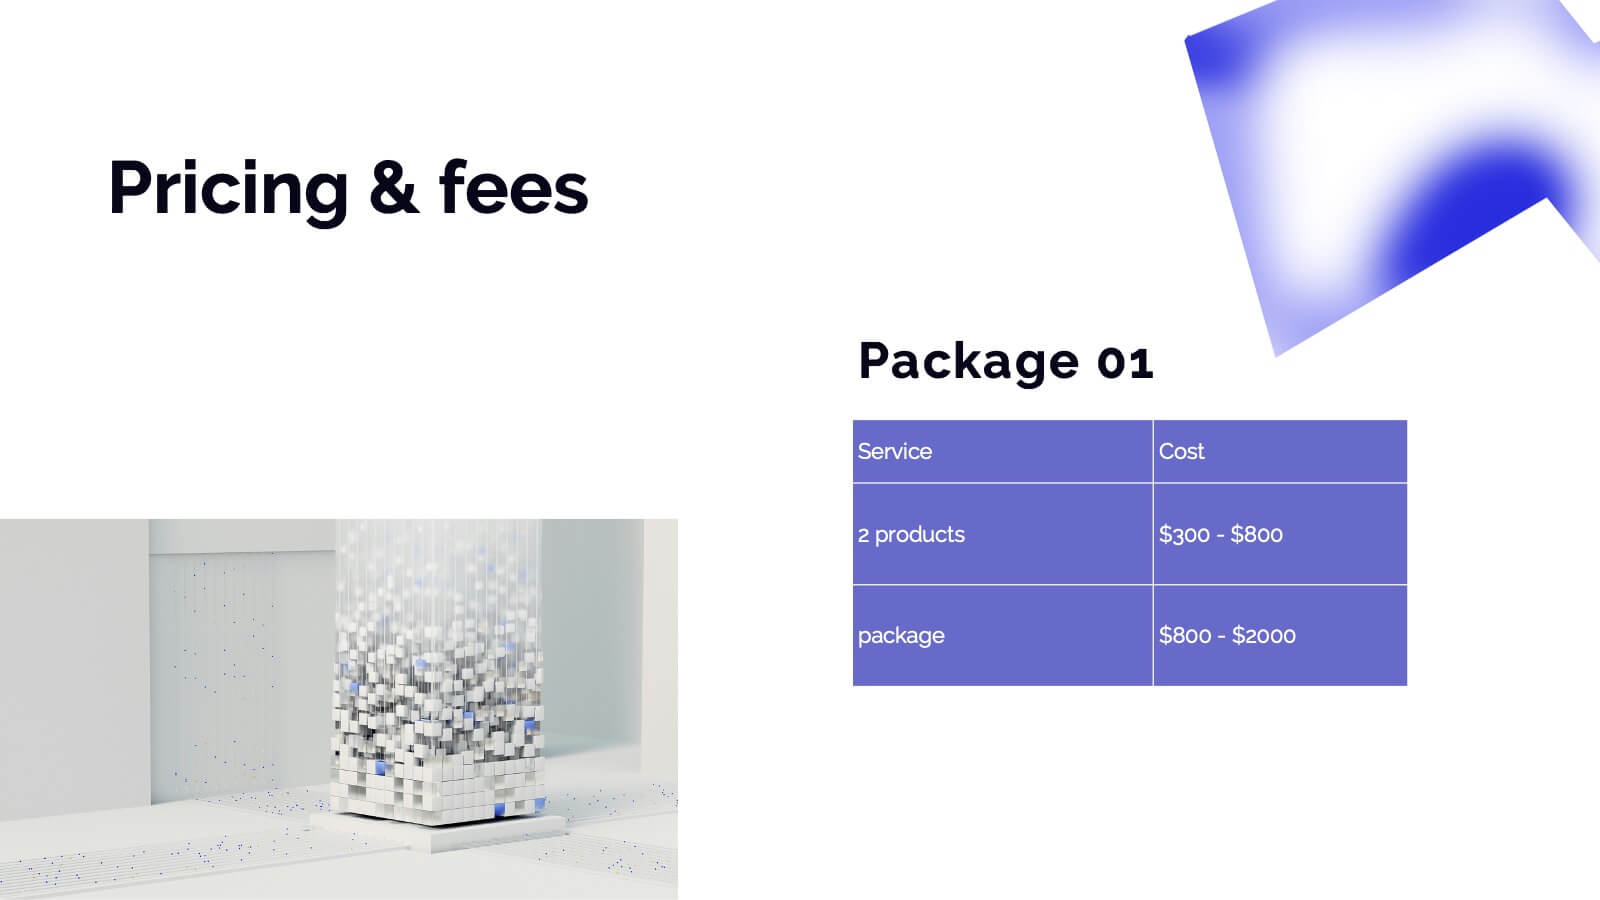
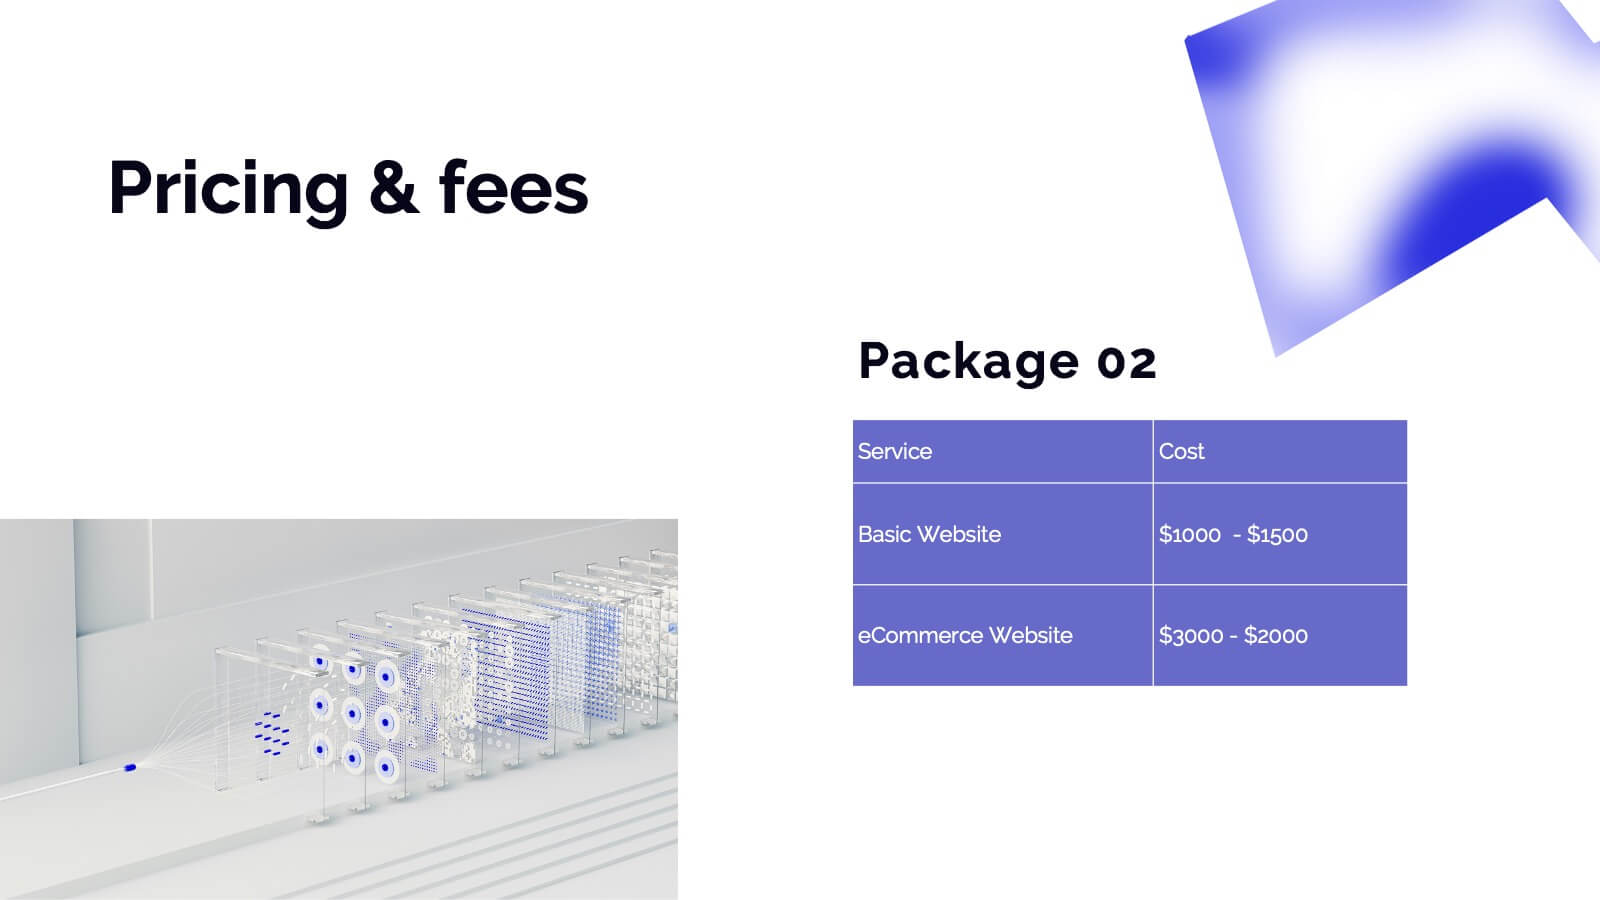
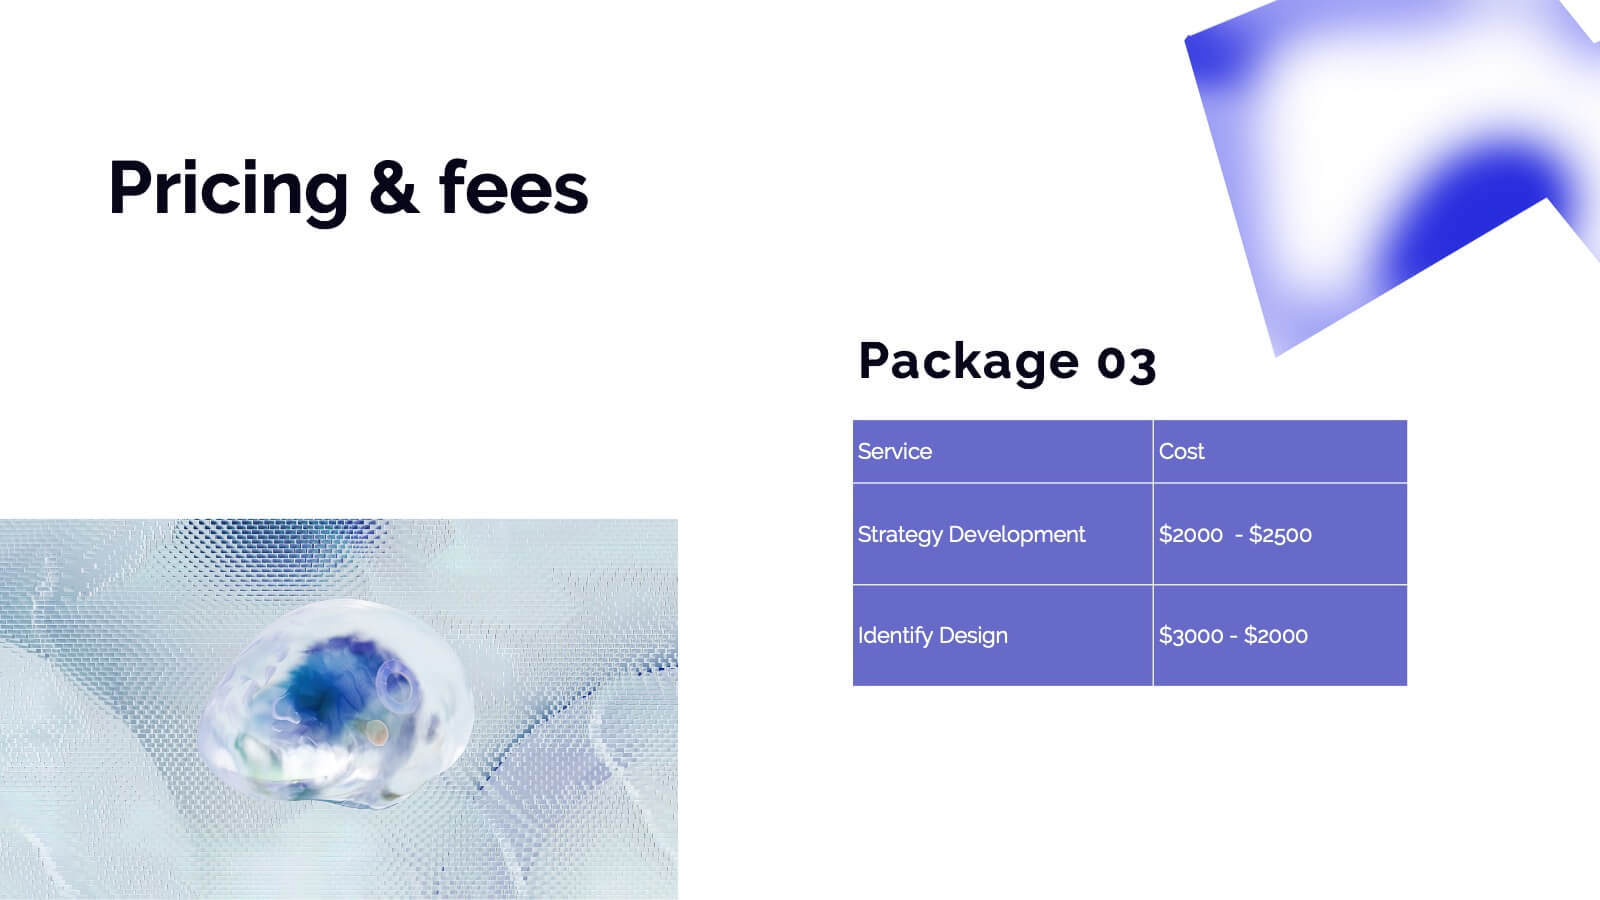
Haze Sales Forecast Presentation
Elevate your sales strategy with this stunning Sales Forecast template! Designed to highlight your objectives, team, pricing strategies, and future opportunities, it presents data in a sleek and professional manner. Impress your audience with clear visuals and a modern aesthetic. Perfect for PowerPoint, Keynote, and Google Slides presentations!
5 diapositivas
Performance Progress Tracking Presentation
Monitor performance with precision using this Performance Progress Tracking template. This visually engaging dashboard helps you track progress across multiple stages, from planning to testing. With interactive bar graphs and percentage indicators, you can evaluate real-time performance, identify bottlenecks, and make data-driven decisions. Fully customizable for PowerPoint, Keynote, and Google Slides, ensuring seamless adaptability.

23 diapositivas
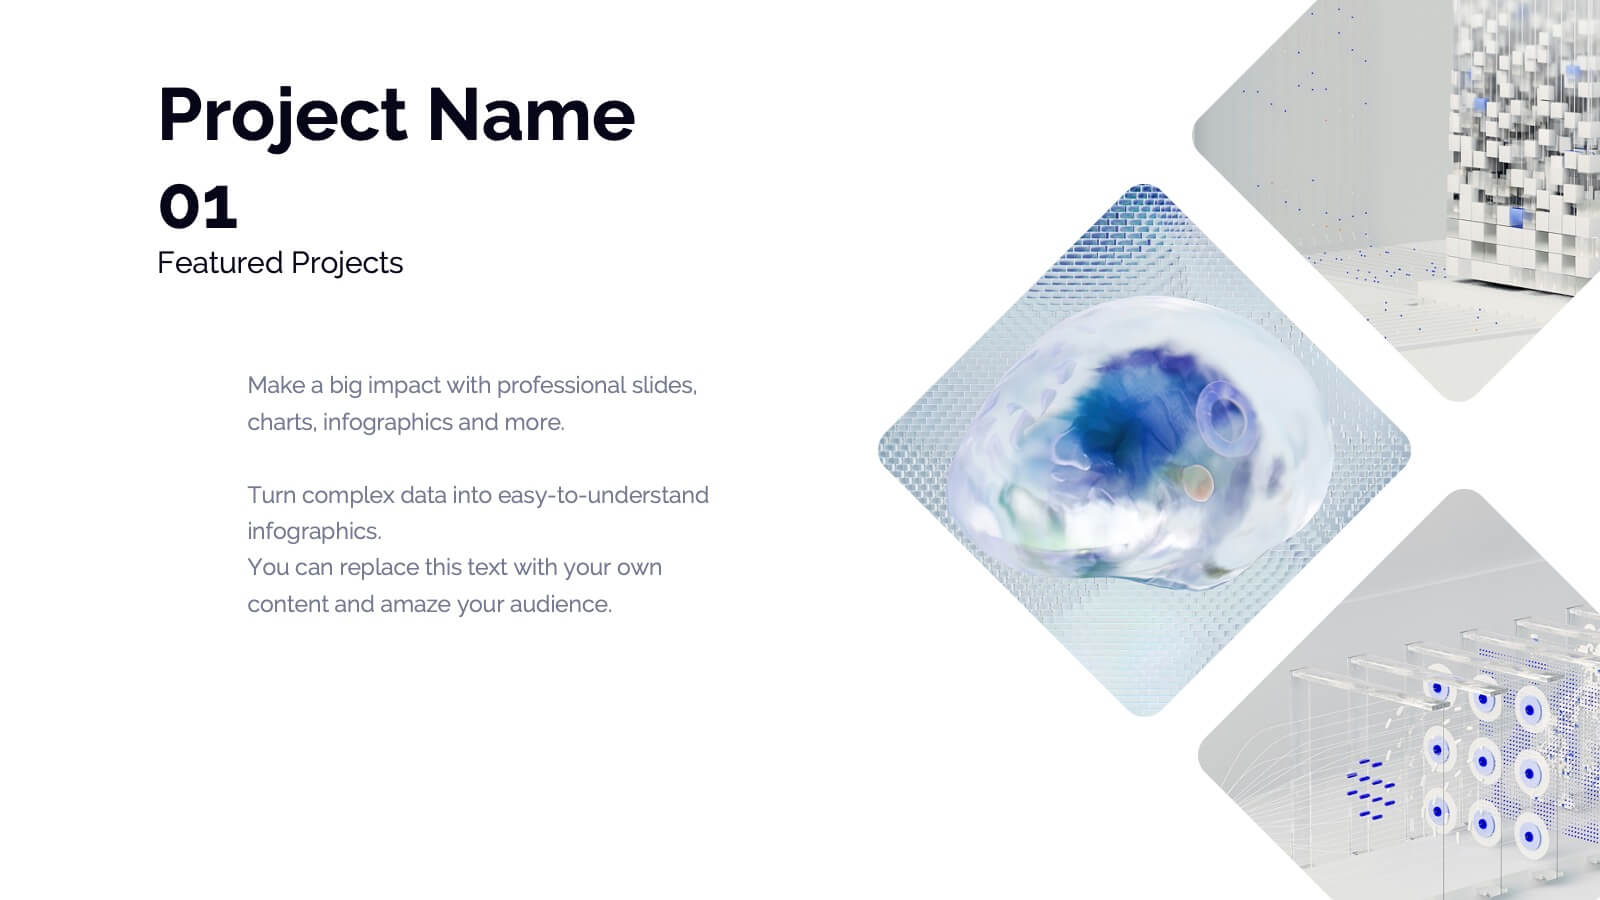
Dryad Photography Portfolio Template Presentation
Showcase your photography skills with this elegant and professional portfolio presentation template! Perfect for highlighting your projects, style, and creative process, this template covers everything from client testimonials to pricing and services offered. It’s ideal for photographers wanting to present their work with style and clarity. Compatible with PowerPoint, Keynote, and Google Slides for effortless sharing and presentations.


6 diapositivas
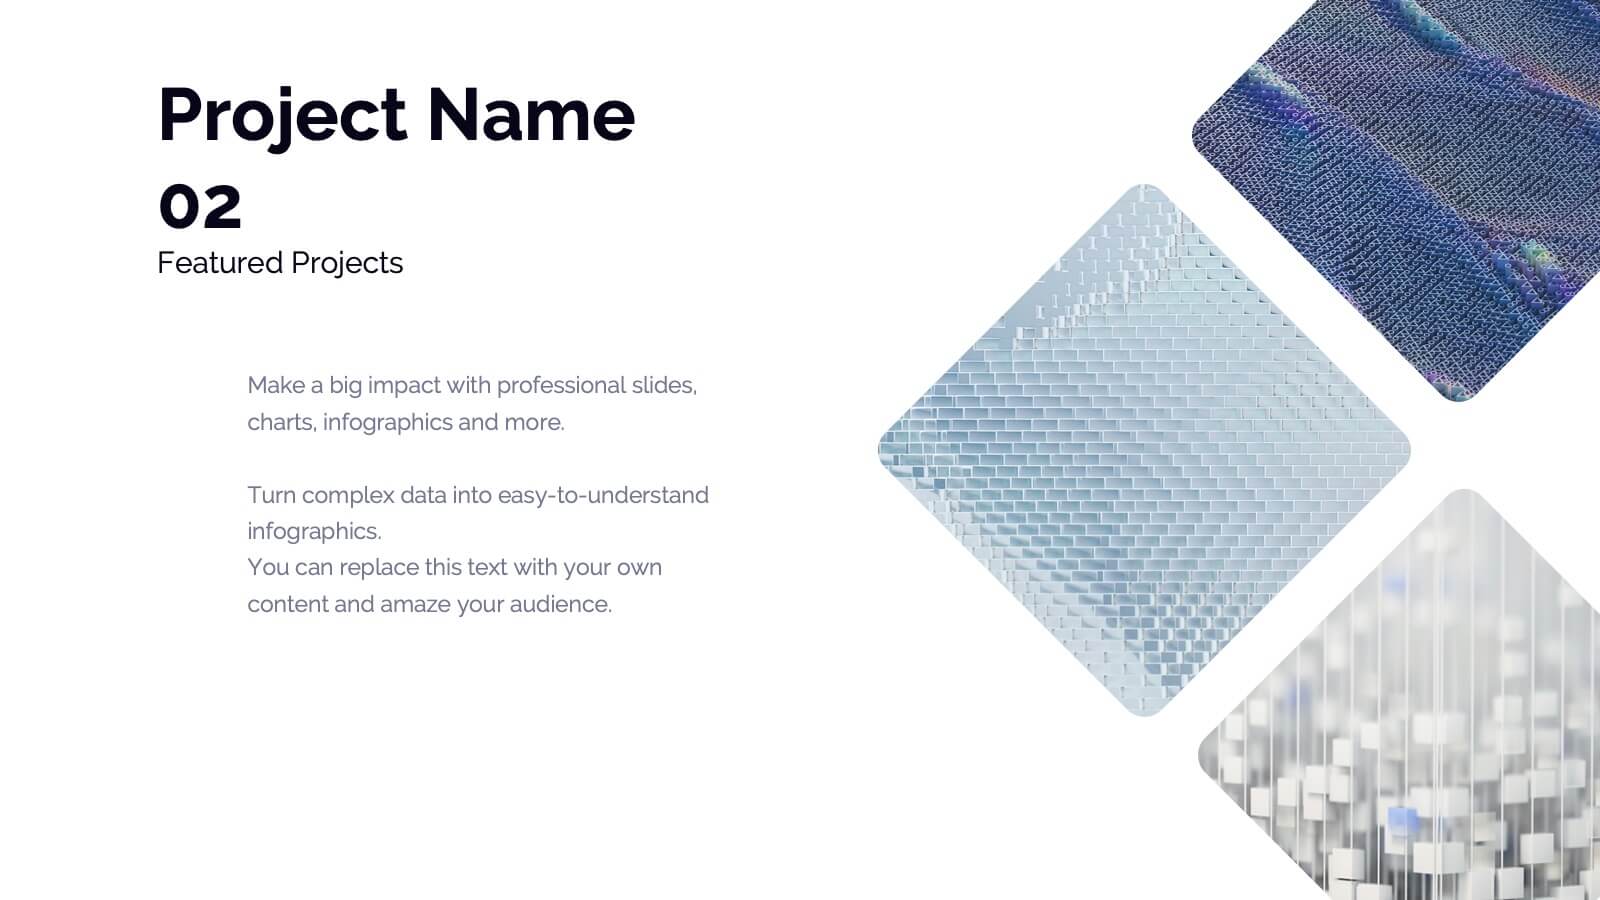
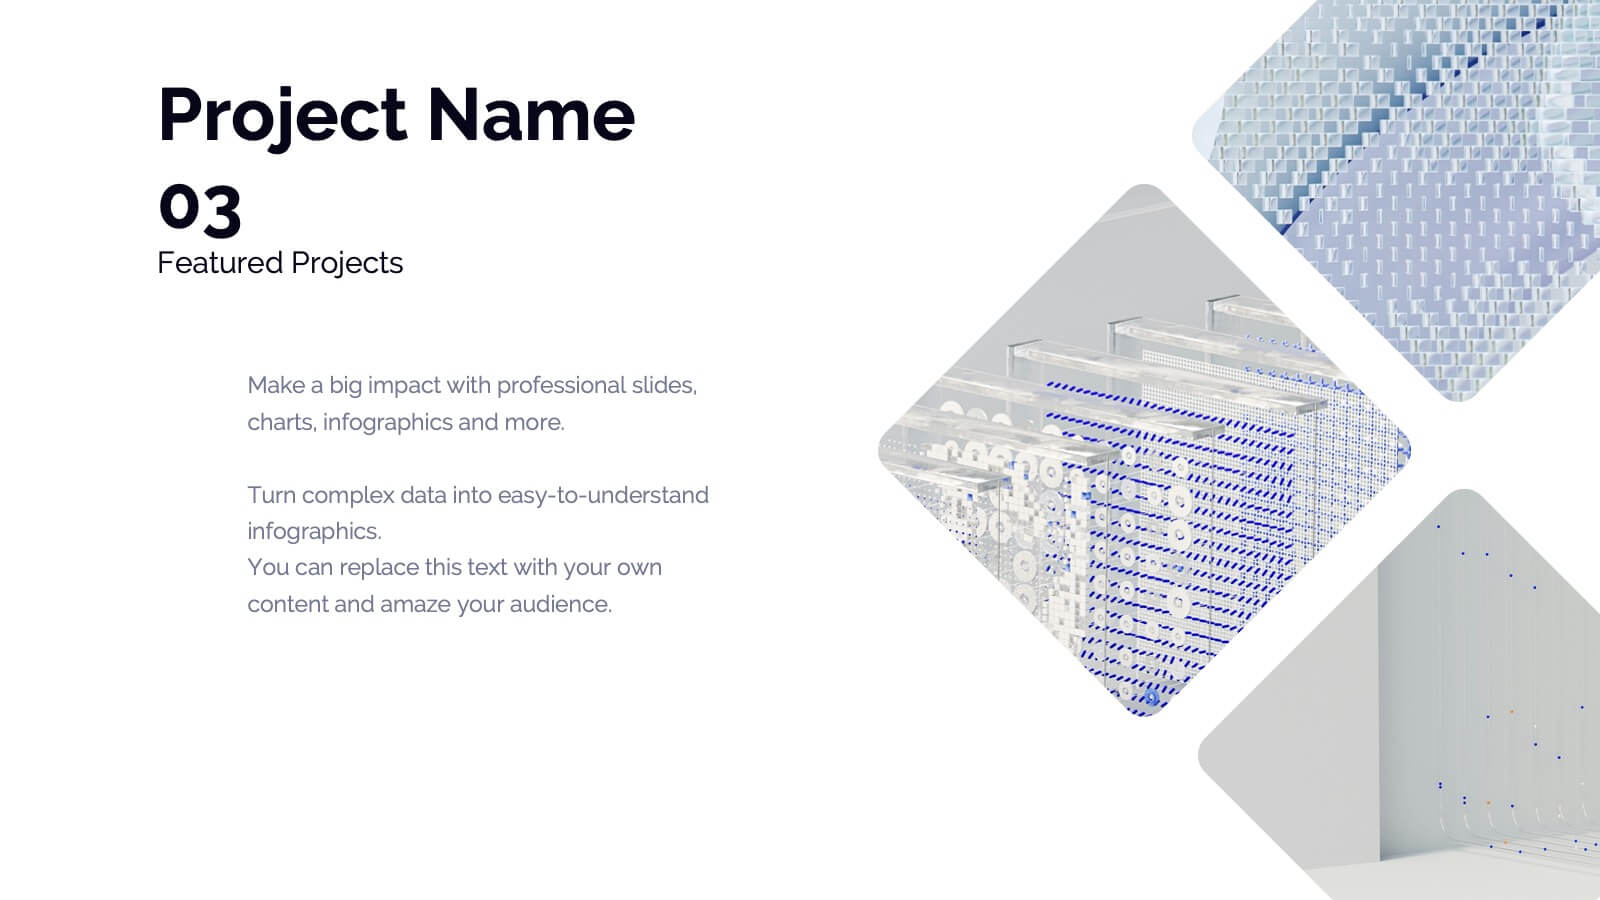
Pattern-Based Layouts Using Geometry
Present your process, timeline, or flow with clarity using the Pattern-Based Layouts Using Geometry Presentation. This clean, step-by-step format uses bold numbered icons and curved geometric blocks to guide viewers through five key stages. Ideal for sequential content, strategies, or workflows. Easily customizable in PowerPoint, Keynote, and Google Slides.


5 diapositivas
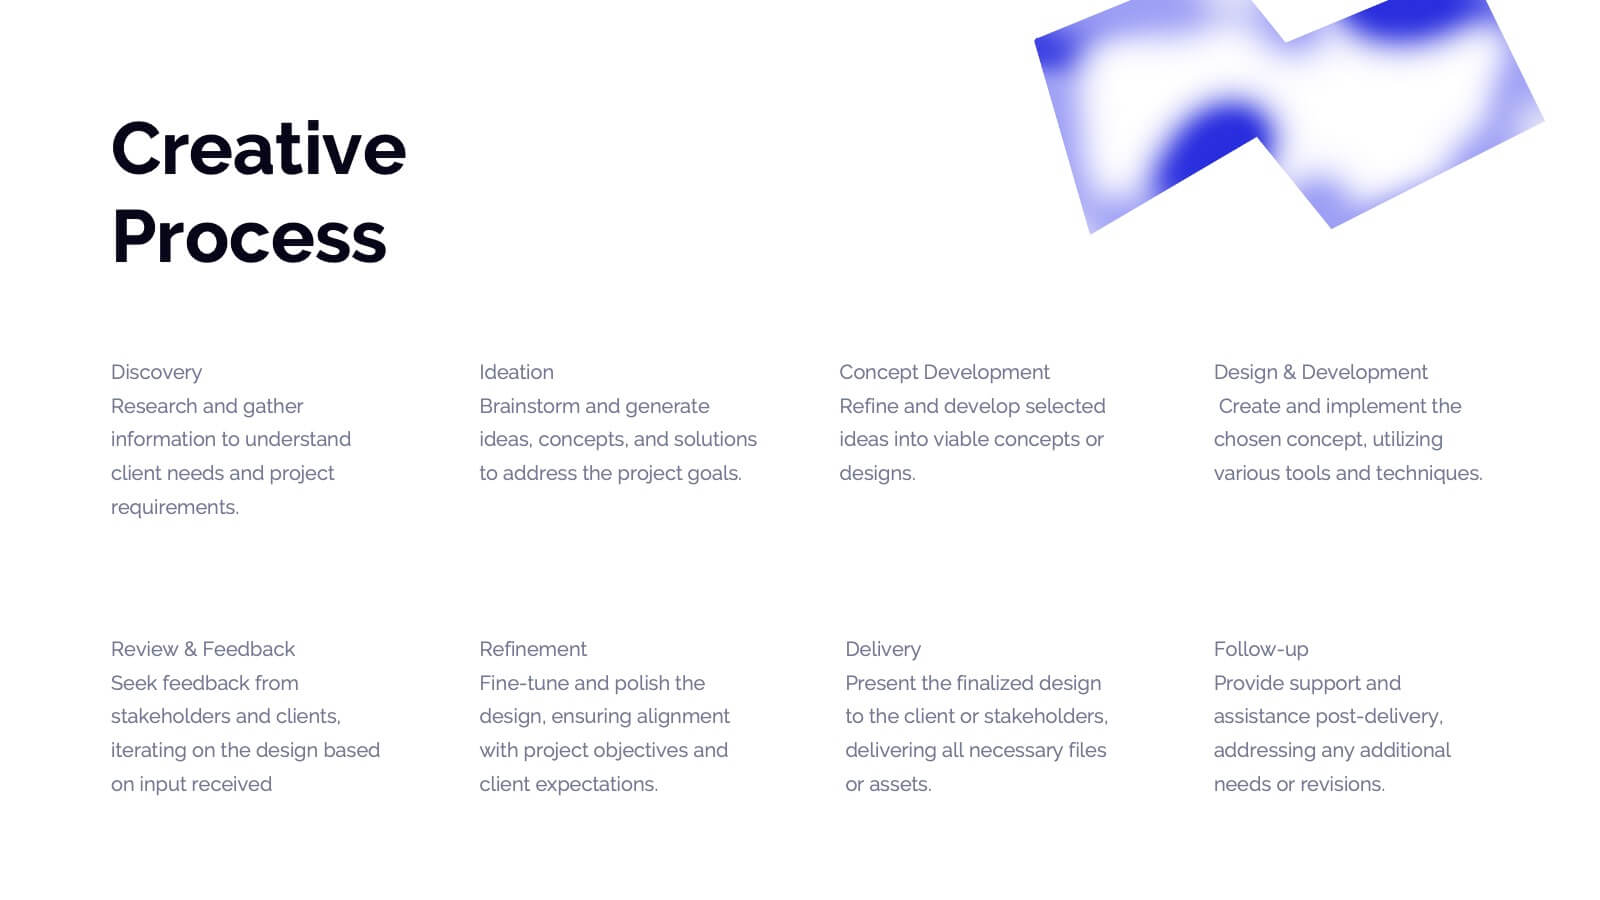
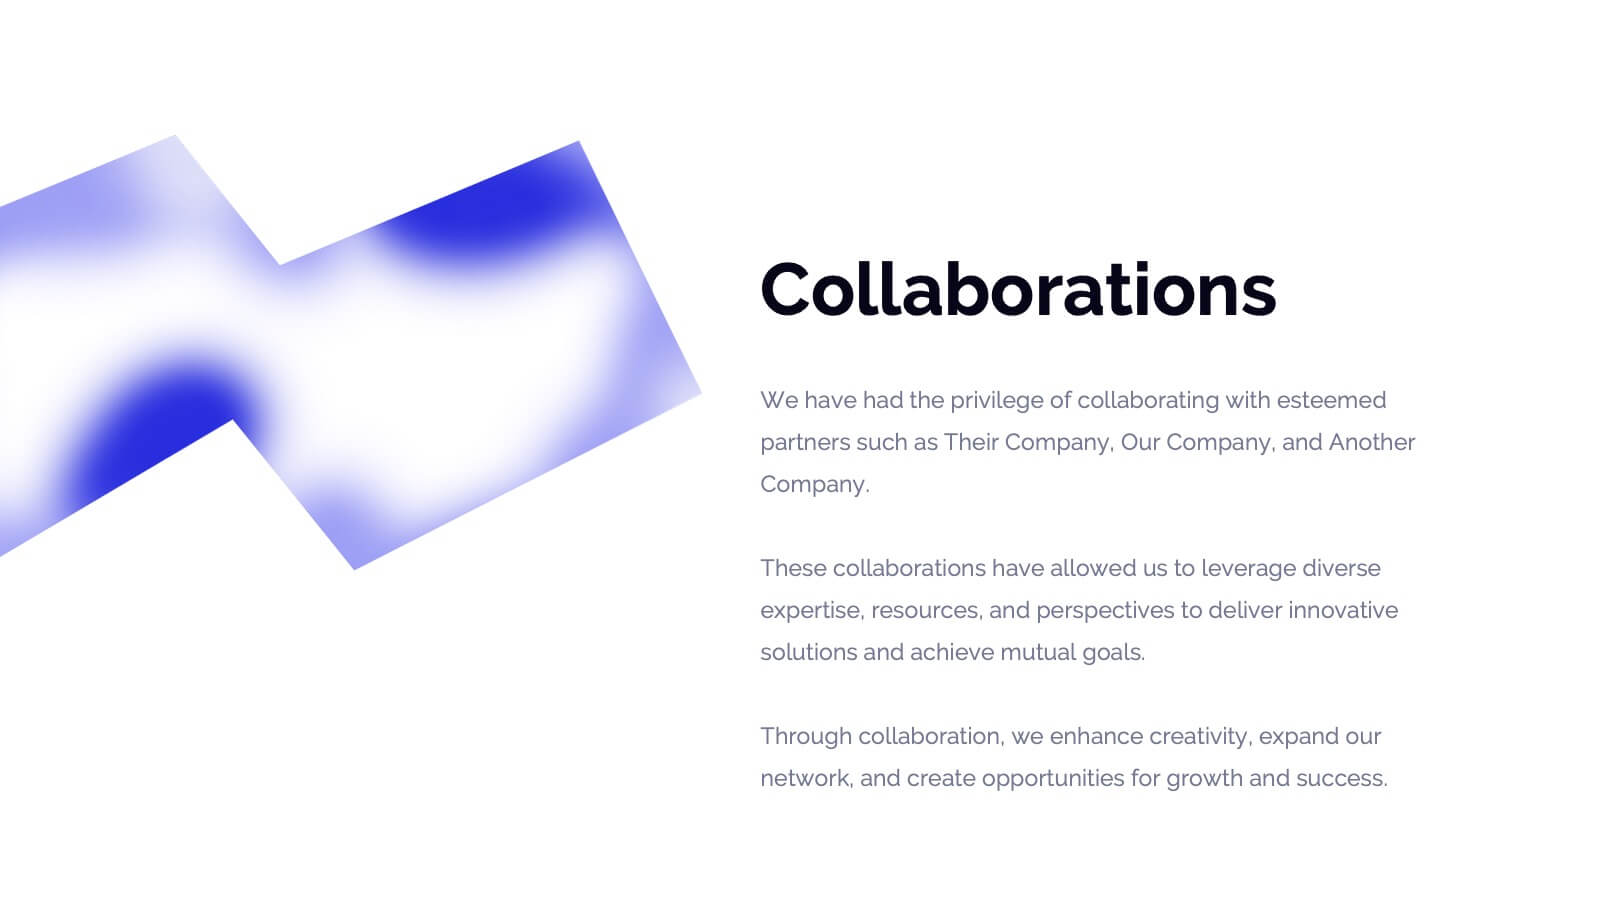
Business Innovations Strategy Presentation
Bring your next big idea to life with this modern, visually engaging presentation. Perfect for showcasing creative strategies, innovation frameworks, and growth opportunities, it helps you present your concepts with clarity and flow. Fully customizable and compatible with PowerPoint, Keynote, and Google Slides for a smooth professional experience.


7 diapositivas
Startup Program Infographic Presentation
A Startup is a newly established business venture that is focused on developing and commercializing innovative products, services, or business models. This Startup Template is a perfect way to present your company and products in an attractive and professional way. This Infographic is designed for every step of a new startup business, from inception to implementation, sales and marketing. This is perfect for using as a visual aid during meetings, pitching new business ideas, or giving presentations to your team. This template will help you to build a high-quality professional presentation!


6 diapositivas
Framework Version Infographic
A framework infographic is a visual representation that outlines a structured approach, model, or framework for understanding a concept, solving a problem, or making decisions. This infographic template involves visually presenting different versions of a software or system framework along with their features and benefits. Summarize the improvements and benefits introduced by each framework version. This template provides a clear overview of the evolution of the framework and how each version brought value to users. By using icons, graphics, and concise descriptions, you can make the information easily digestible and engaging for your audience.


6 diapositivas
Alphabet Learning Presentation
Make learning fun and engaging with this alphabet learning presentation template! Designed with vibrant visuals and a structured layout, this template helps educators, parents, and trainers introduce letters effectively. Perfect for early childhood education, homeschooling, and interactive lessons. Fully customizable and compatible with PowerPoint, Keynote, and Google Slides.


4 diapositivas
2030 Year in Review Company Report Presentation
Highlight achievements and key metrics with the 2030 Year in Review Company Report Presentation. This professionally designed slide is perfect for summarizing company growth, social stats, or performance KPIs at a glance. Featuring bold typography, modern layout, and editable elements in Canva, PowerPoint, and Google Slides. Ideal for annual business updates.


4 diapositivas
Green Business and Climate Goals Presentation
Bring your sustainability message to life with a fresh and vibrant layout that guides viewers through key milestones. This template helps communicate eco-friendly initiatives and climate strategies in a simple timeline format. Ideal for showcasing goals, progress, and impact. Fully compatible with PowerPoint, Keynote, and Google Slides for easy editing.


23 diapositivas
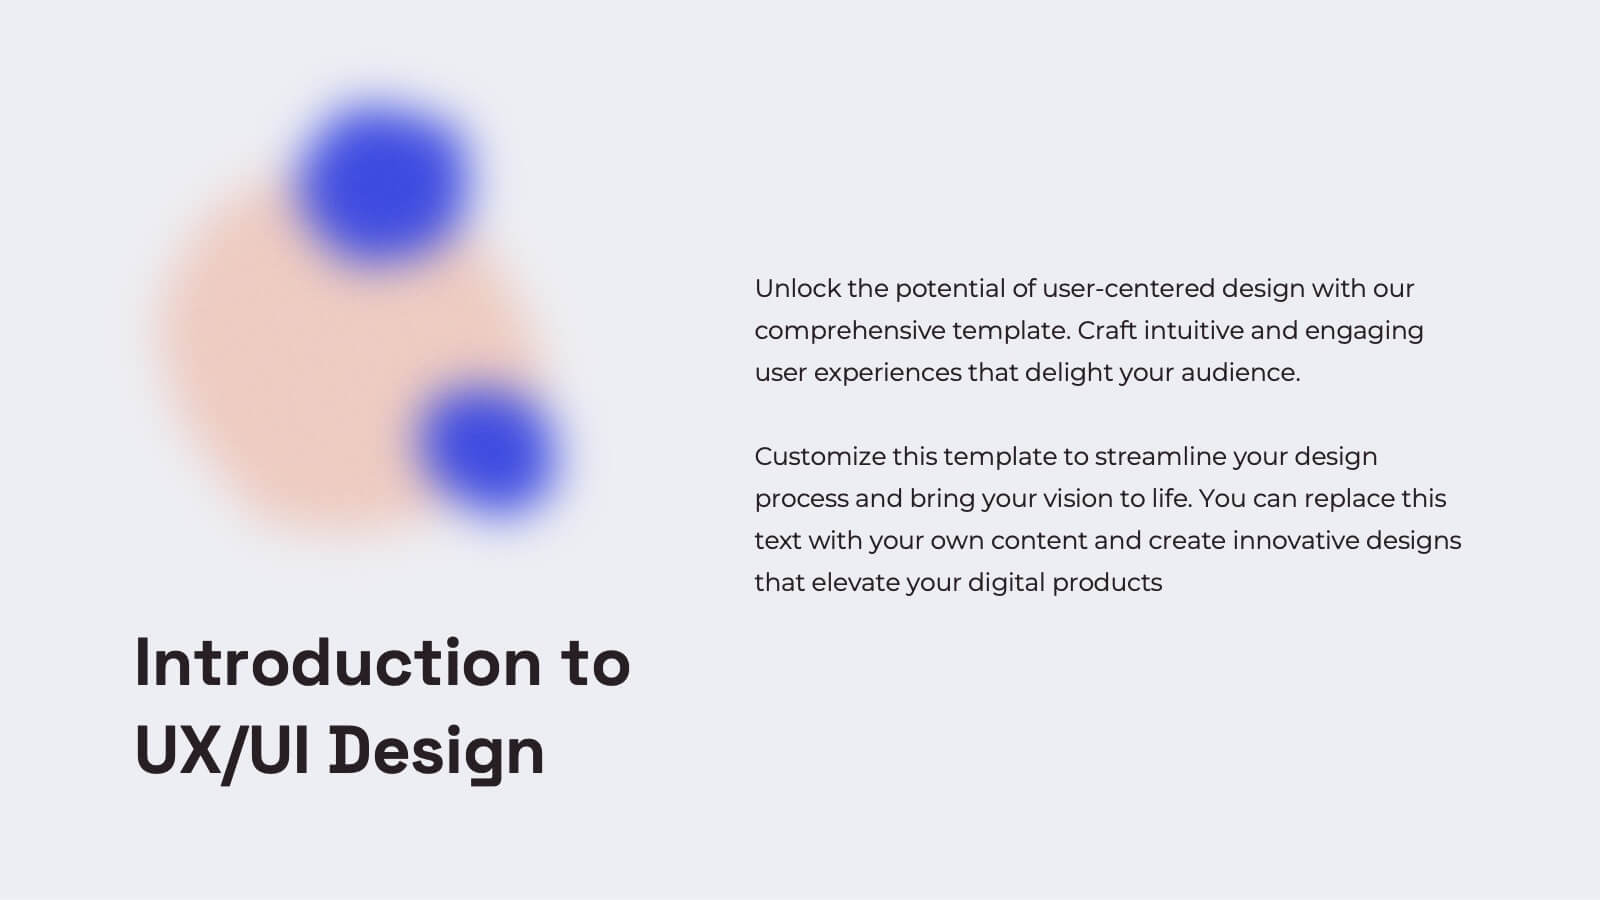
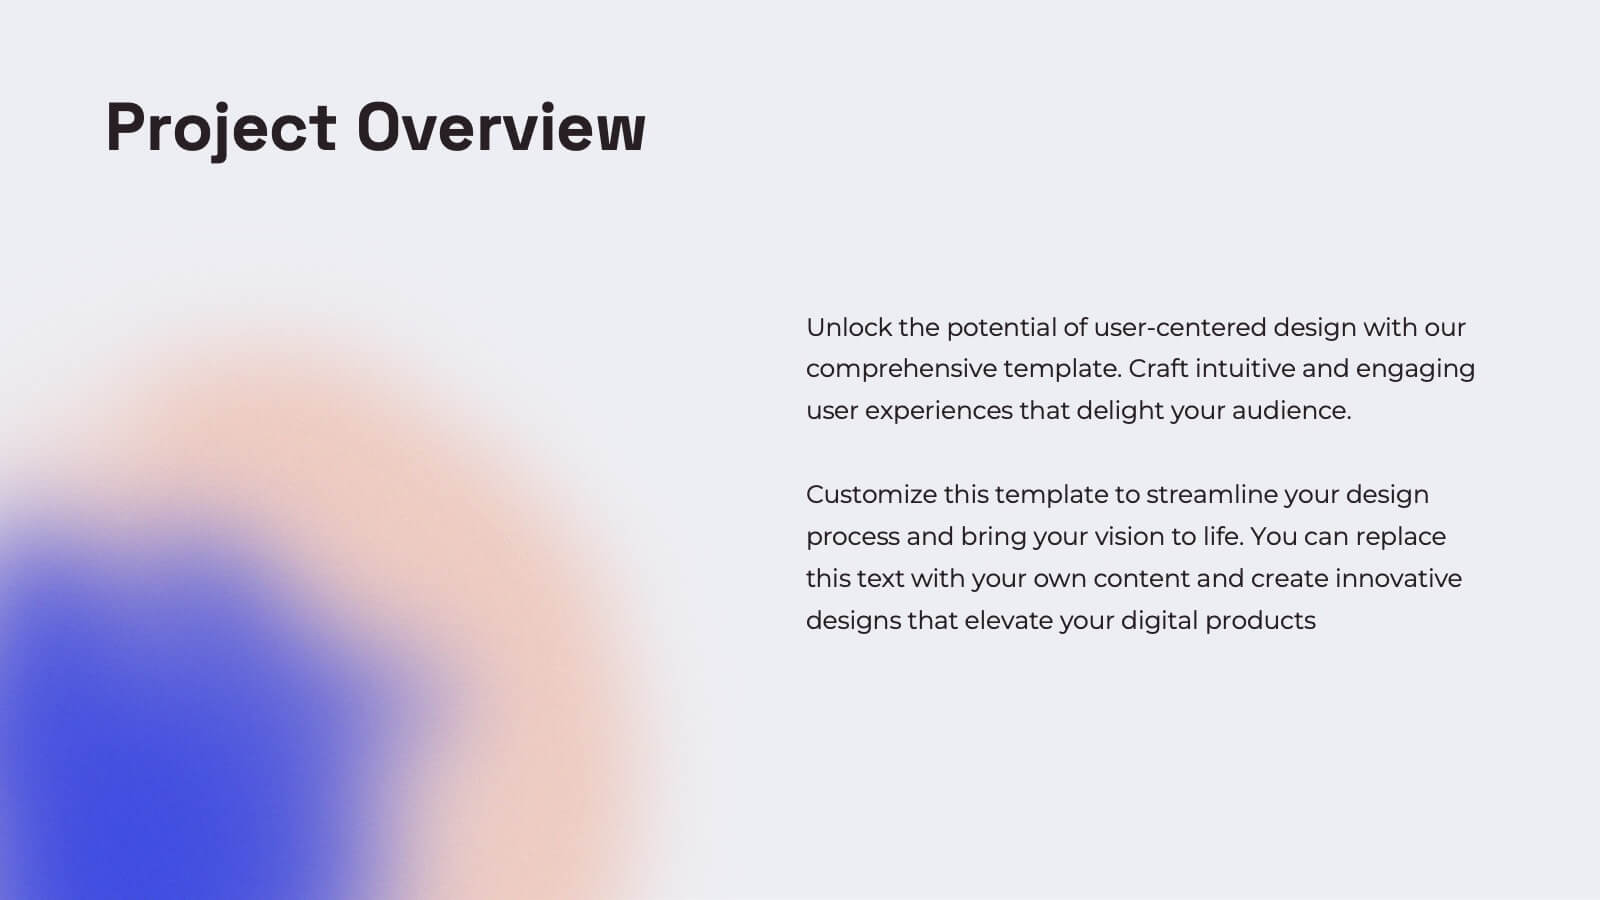
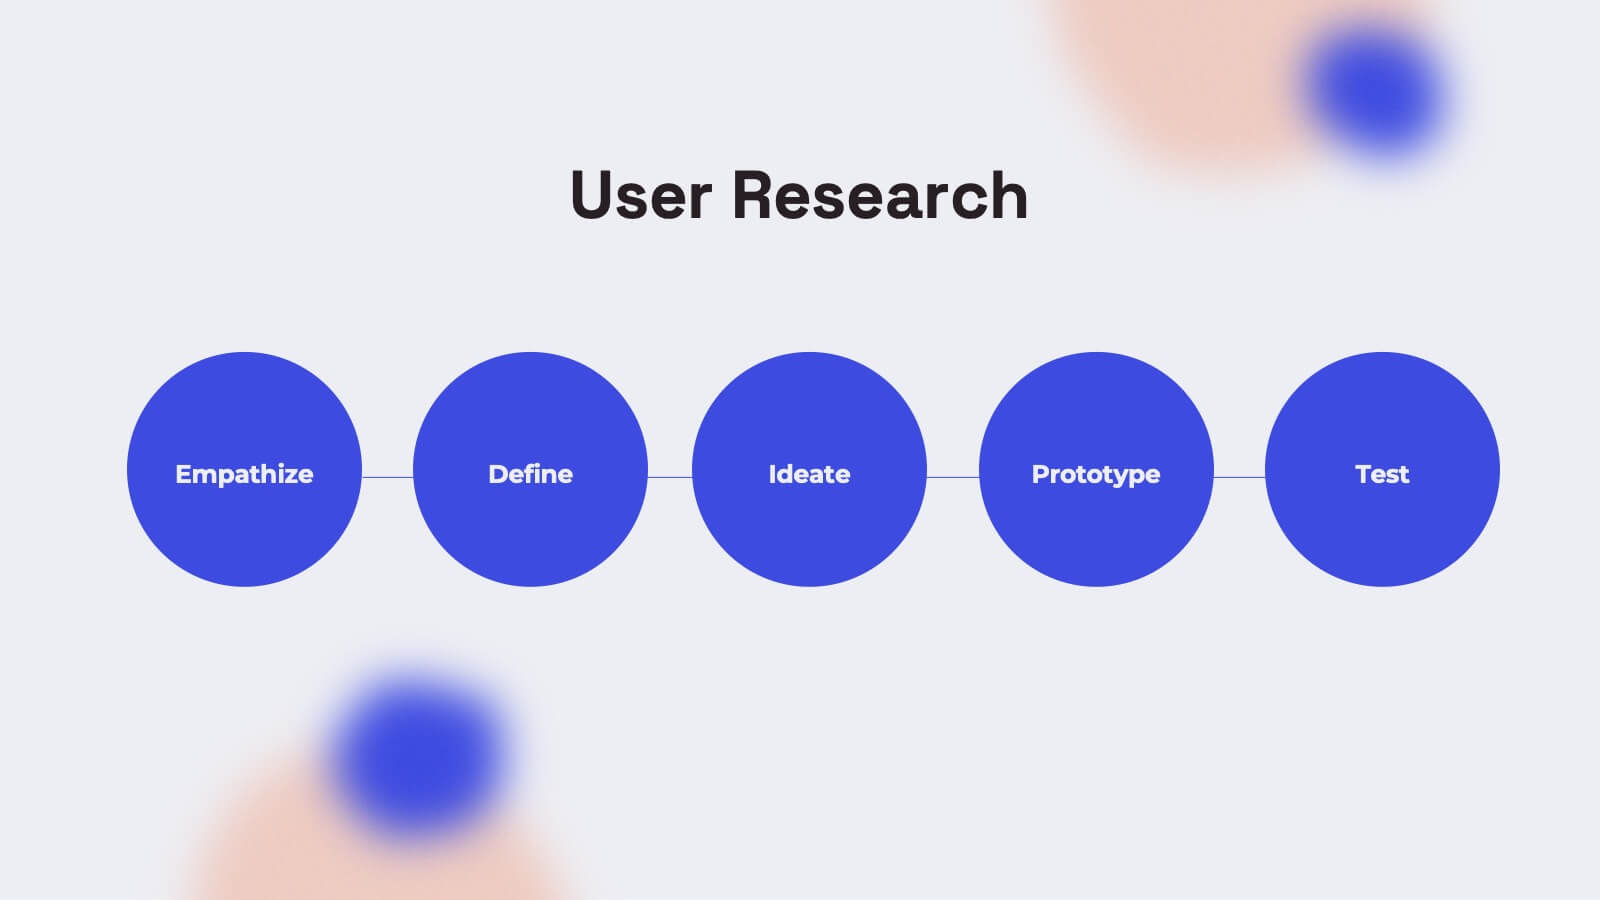
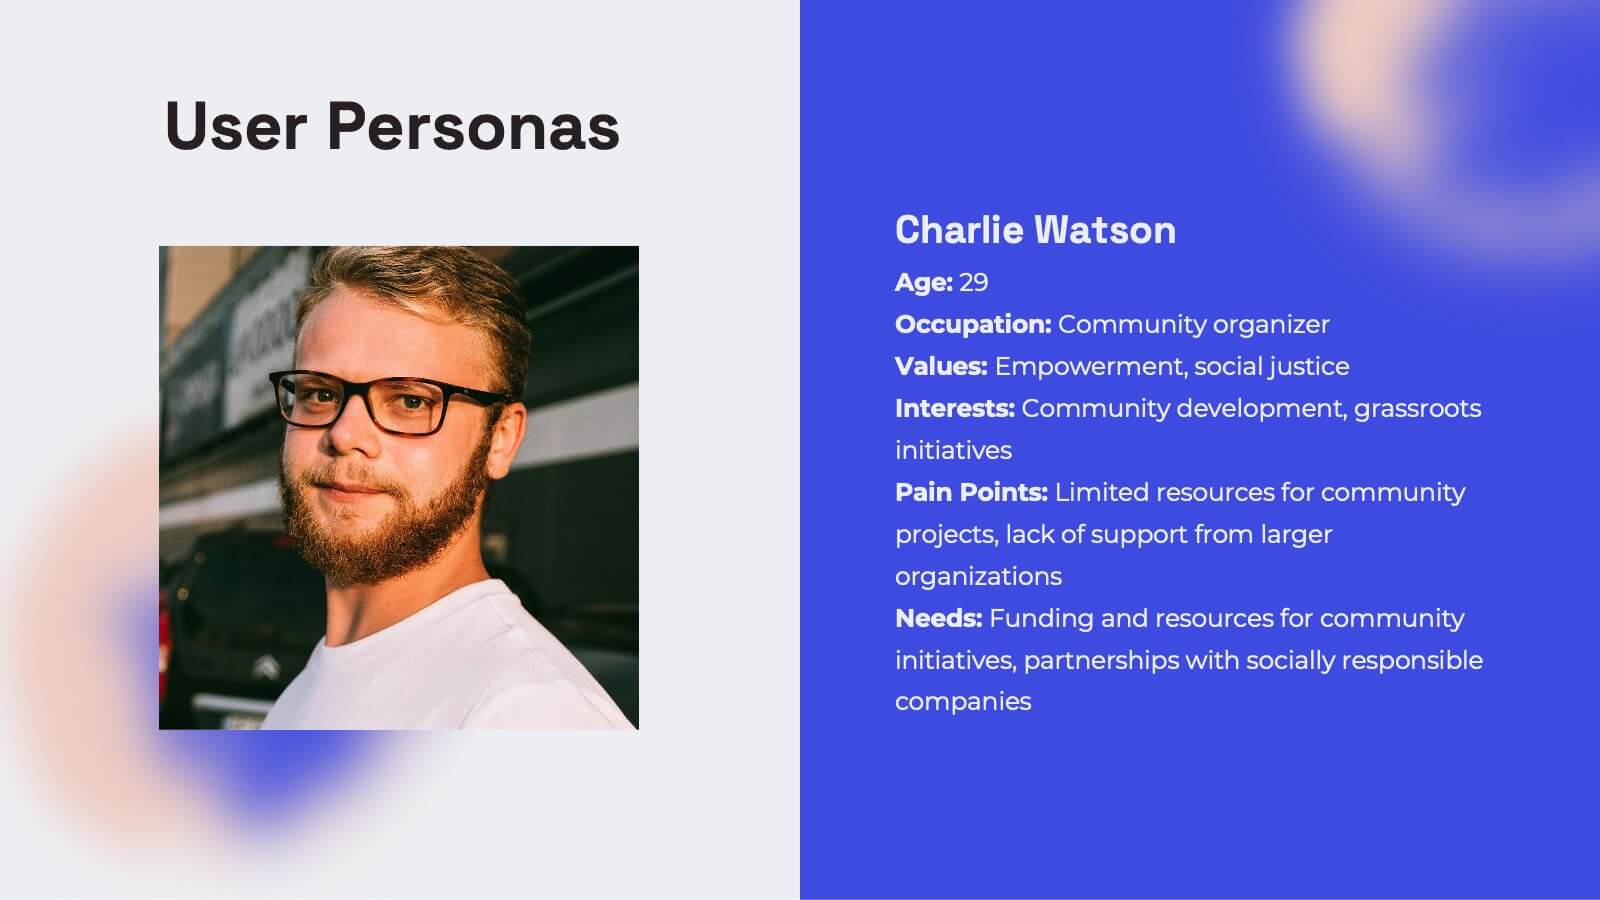
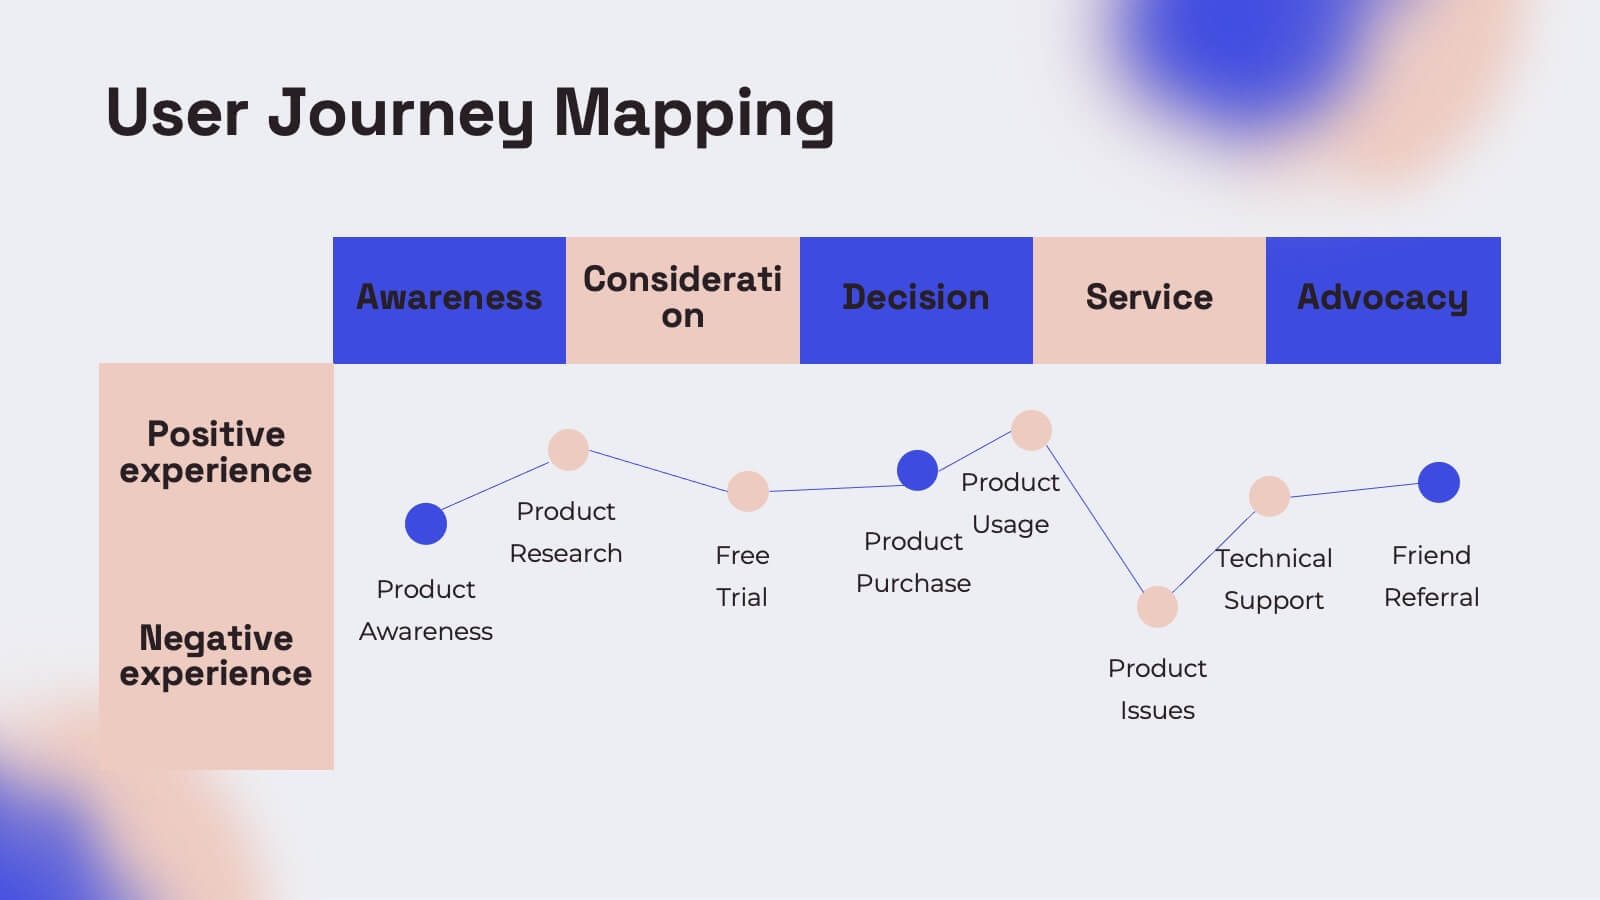
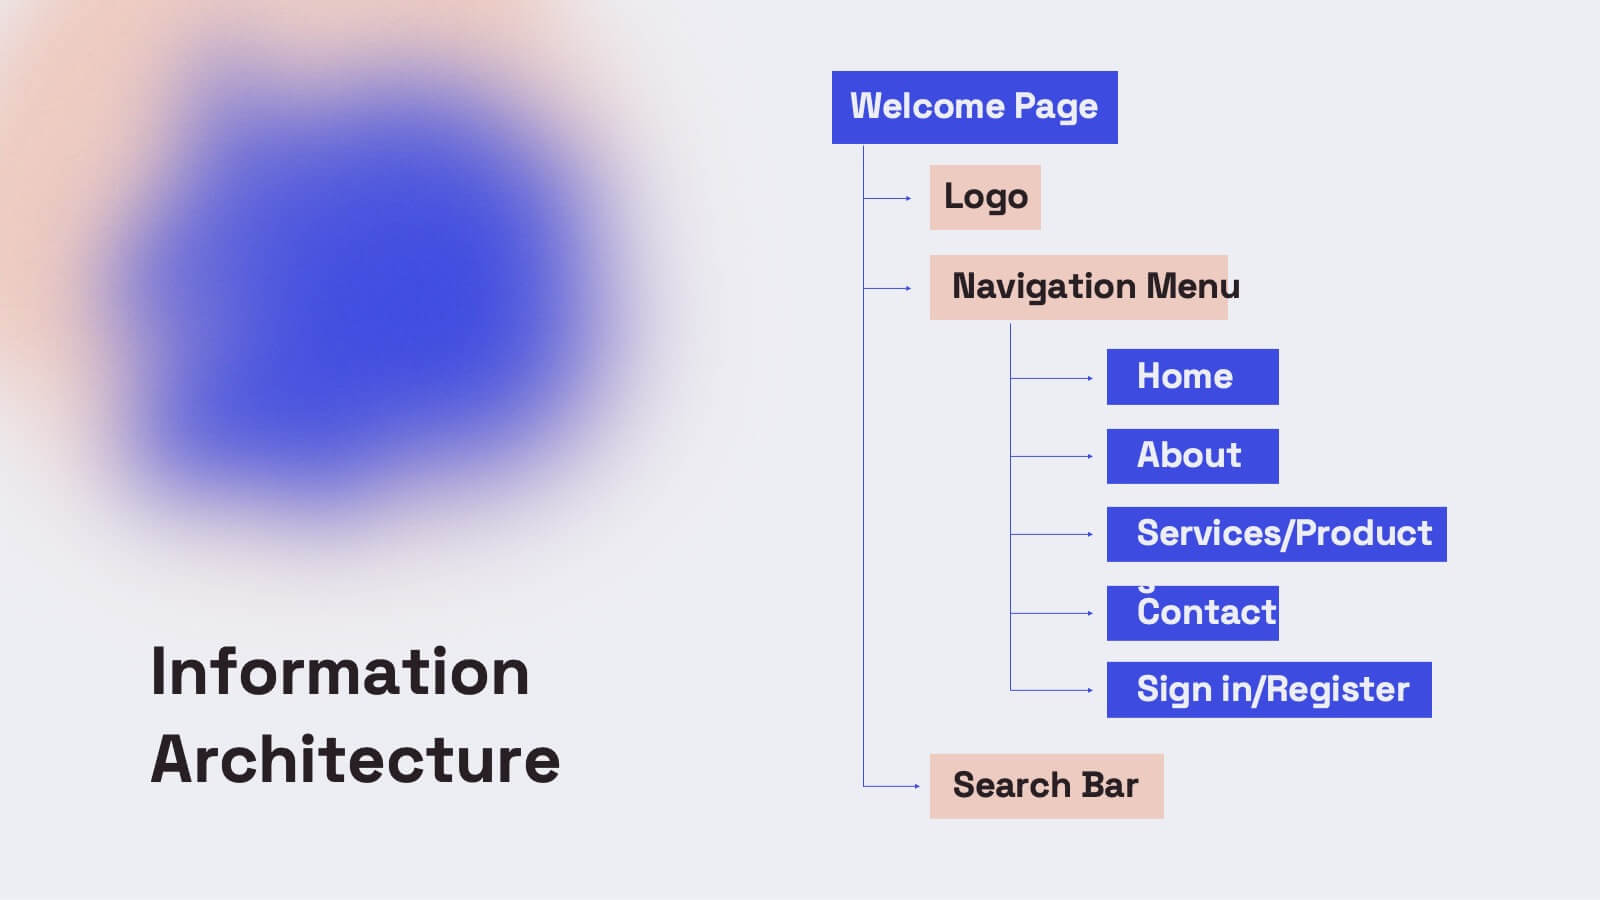
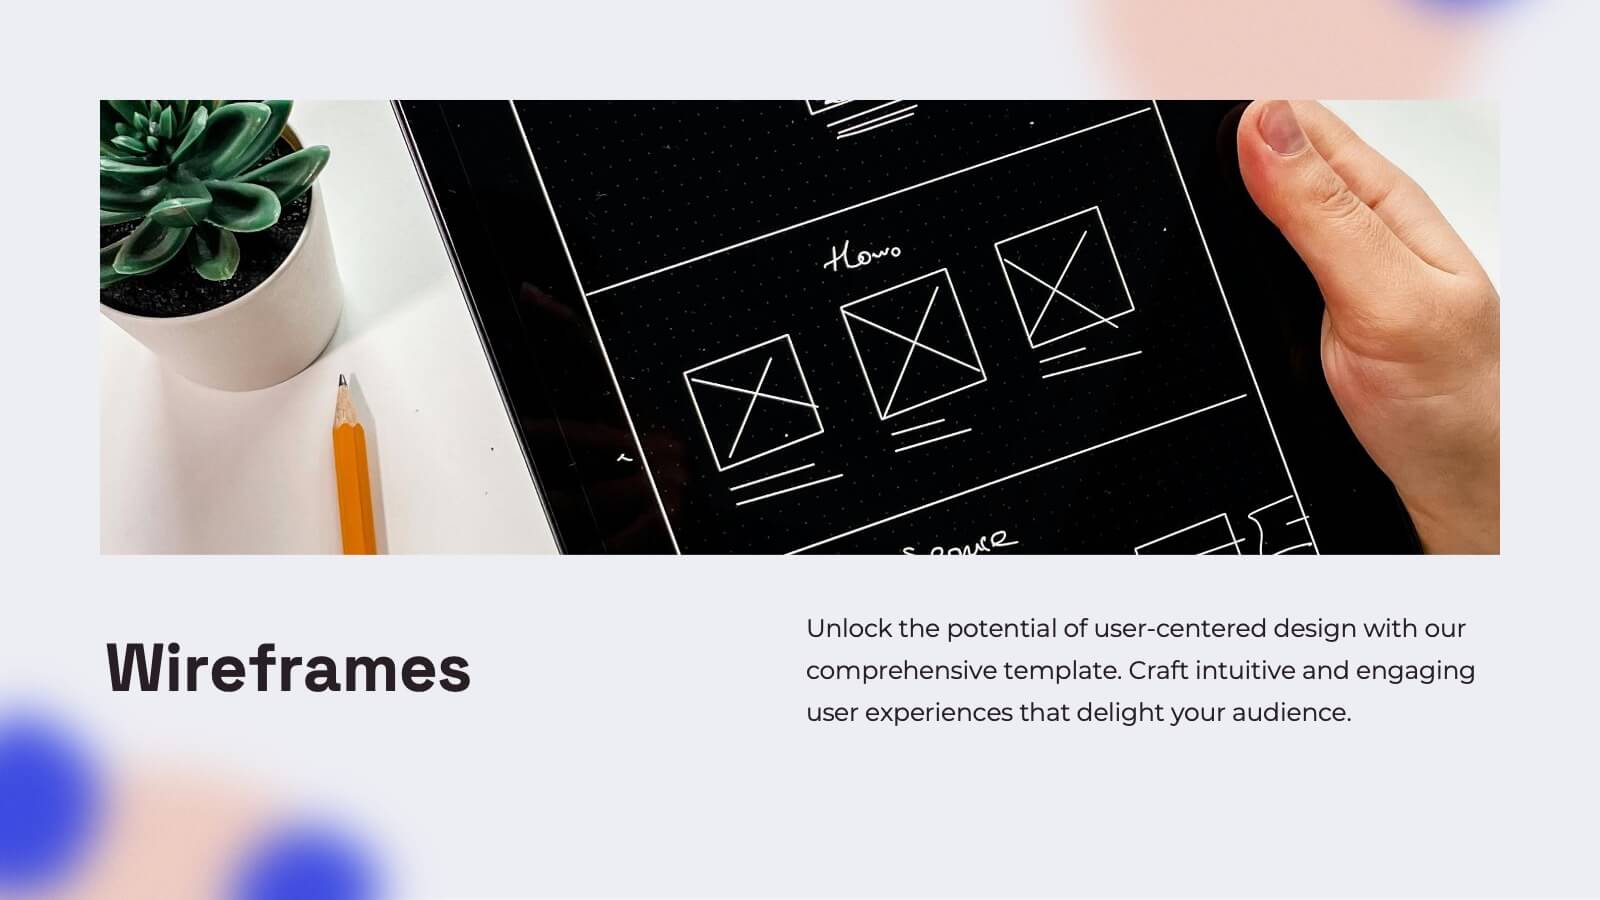
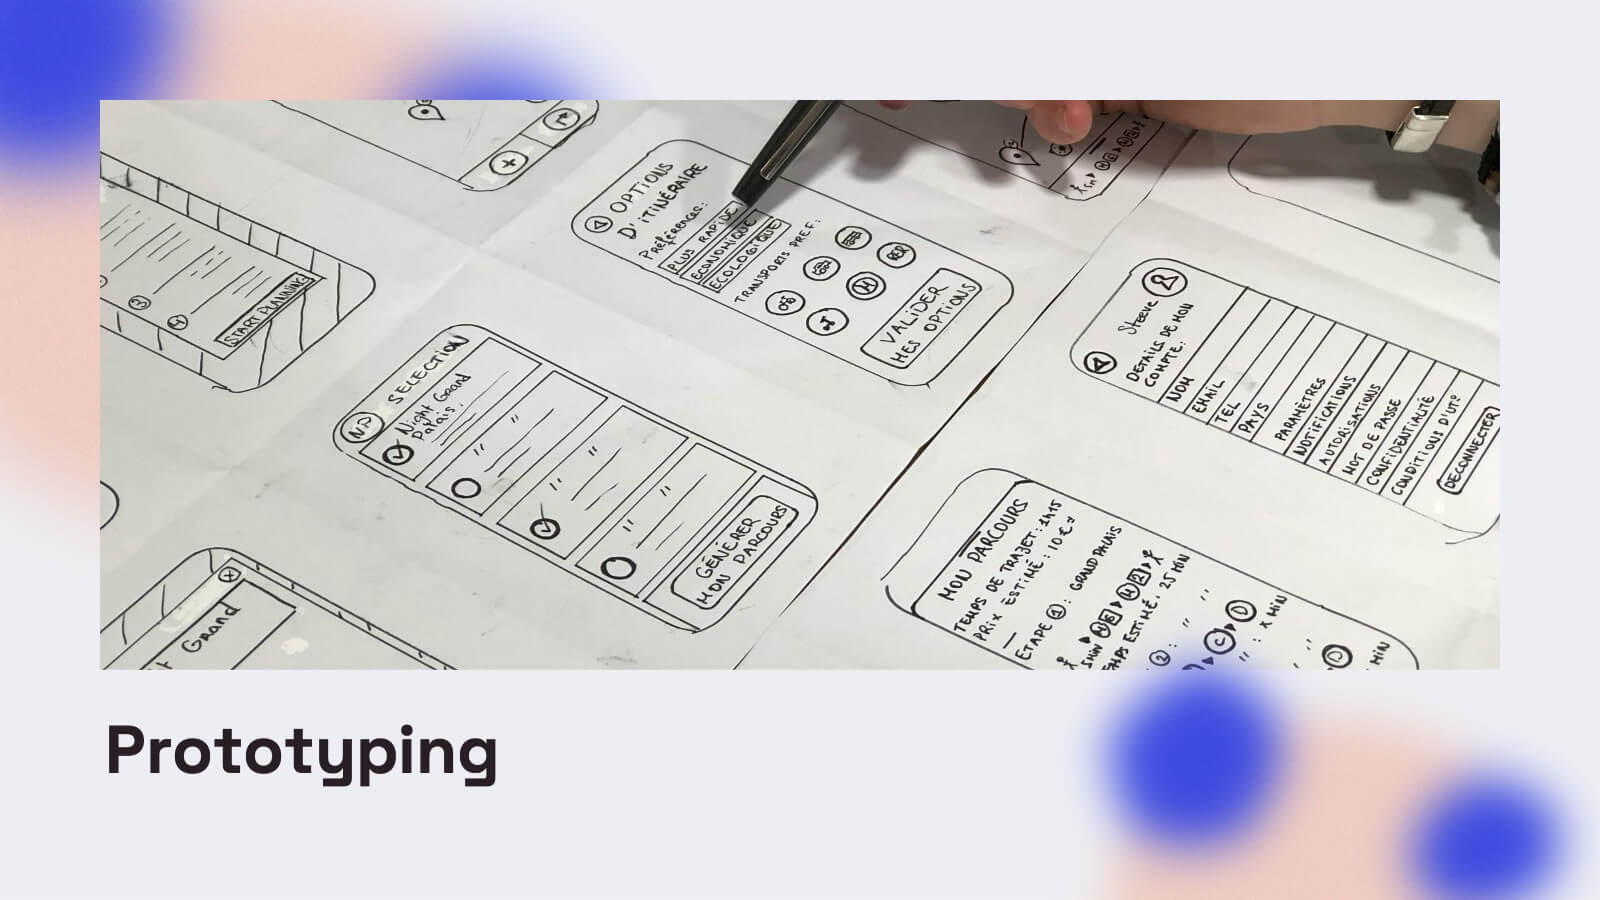
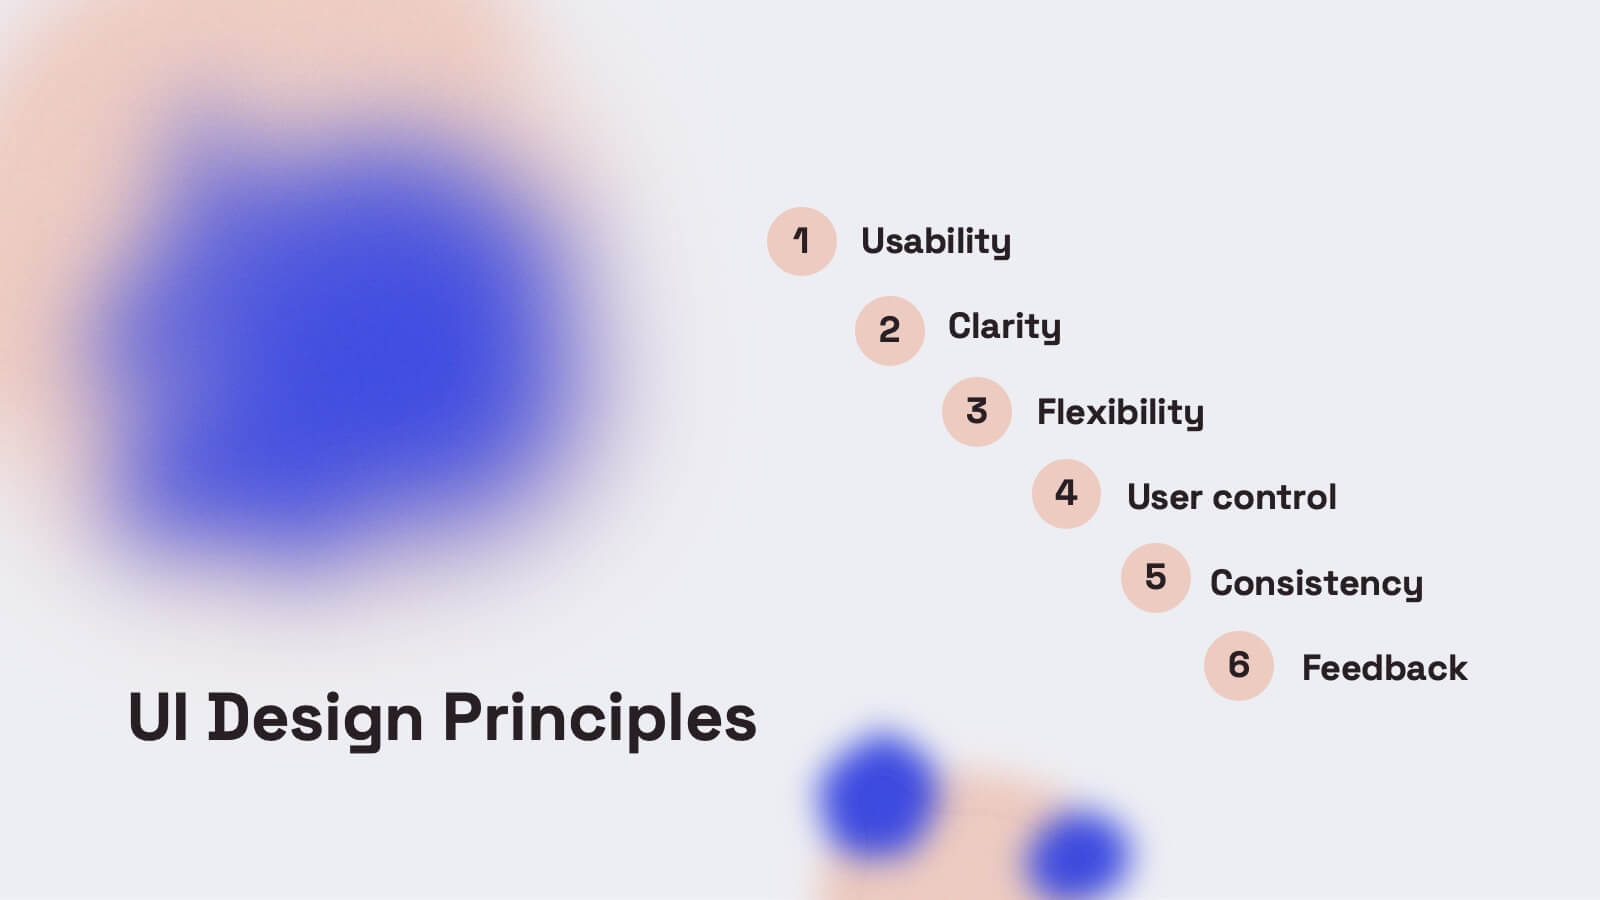
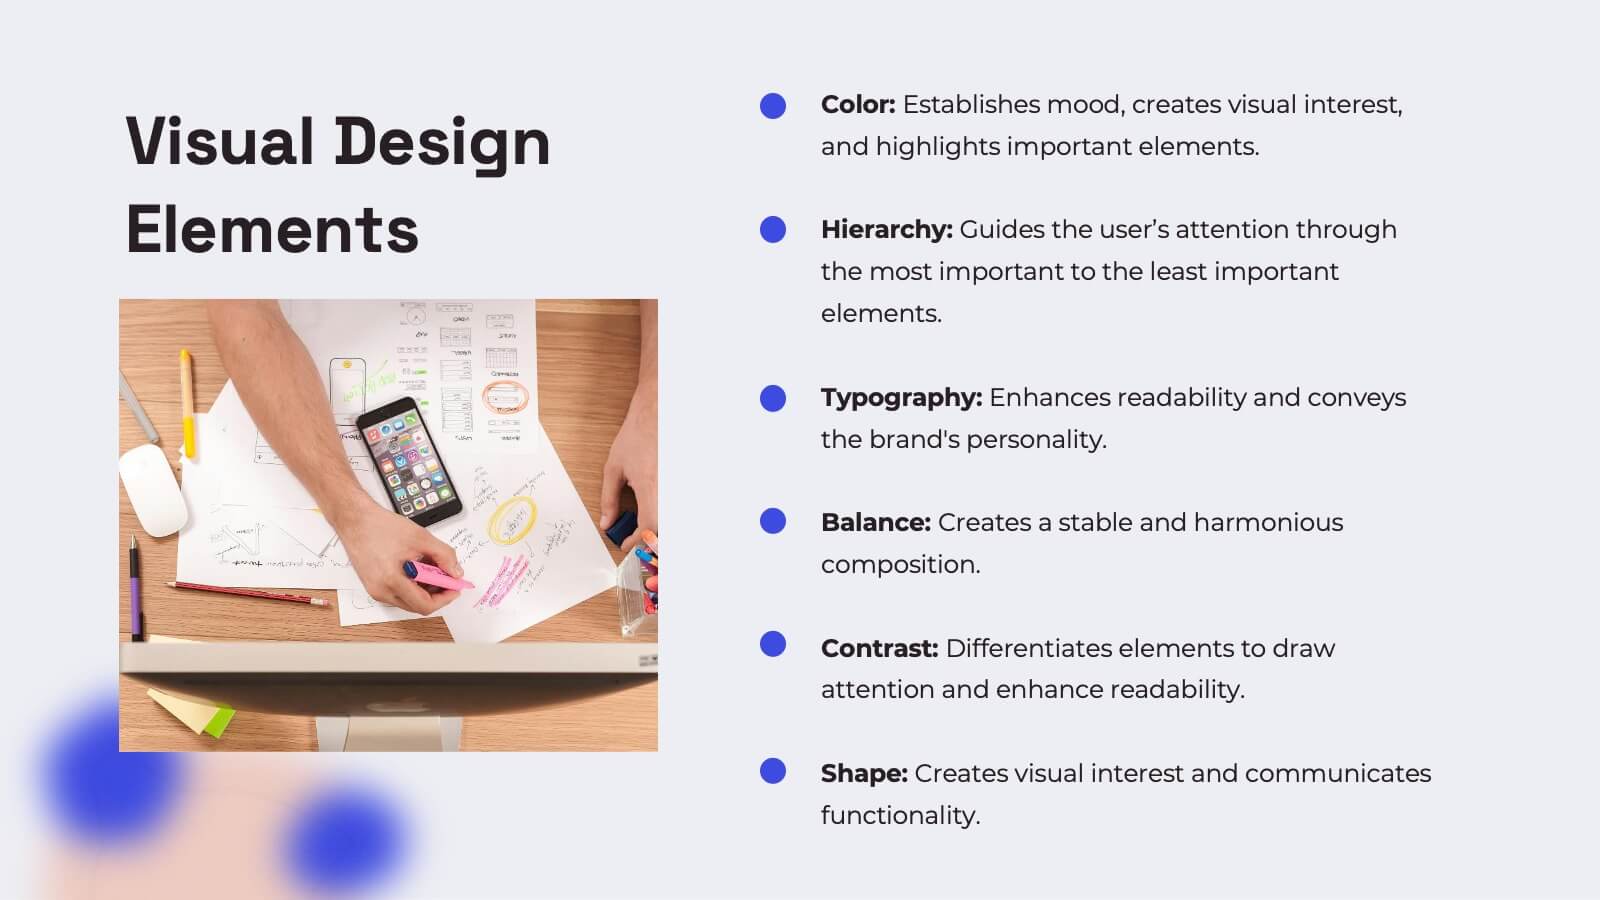
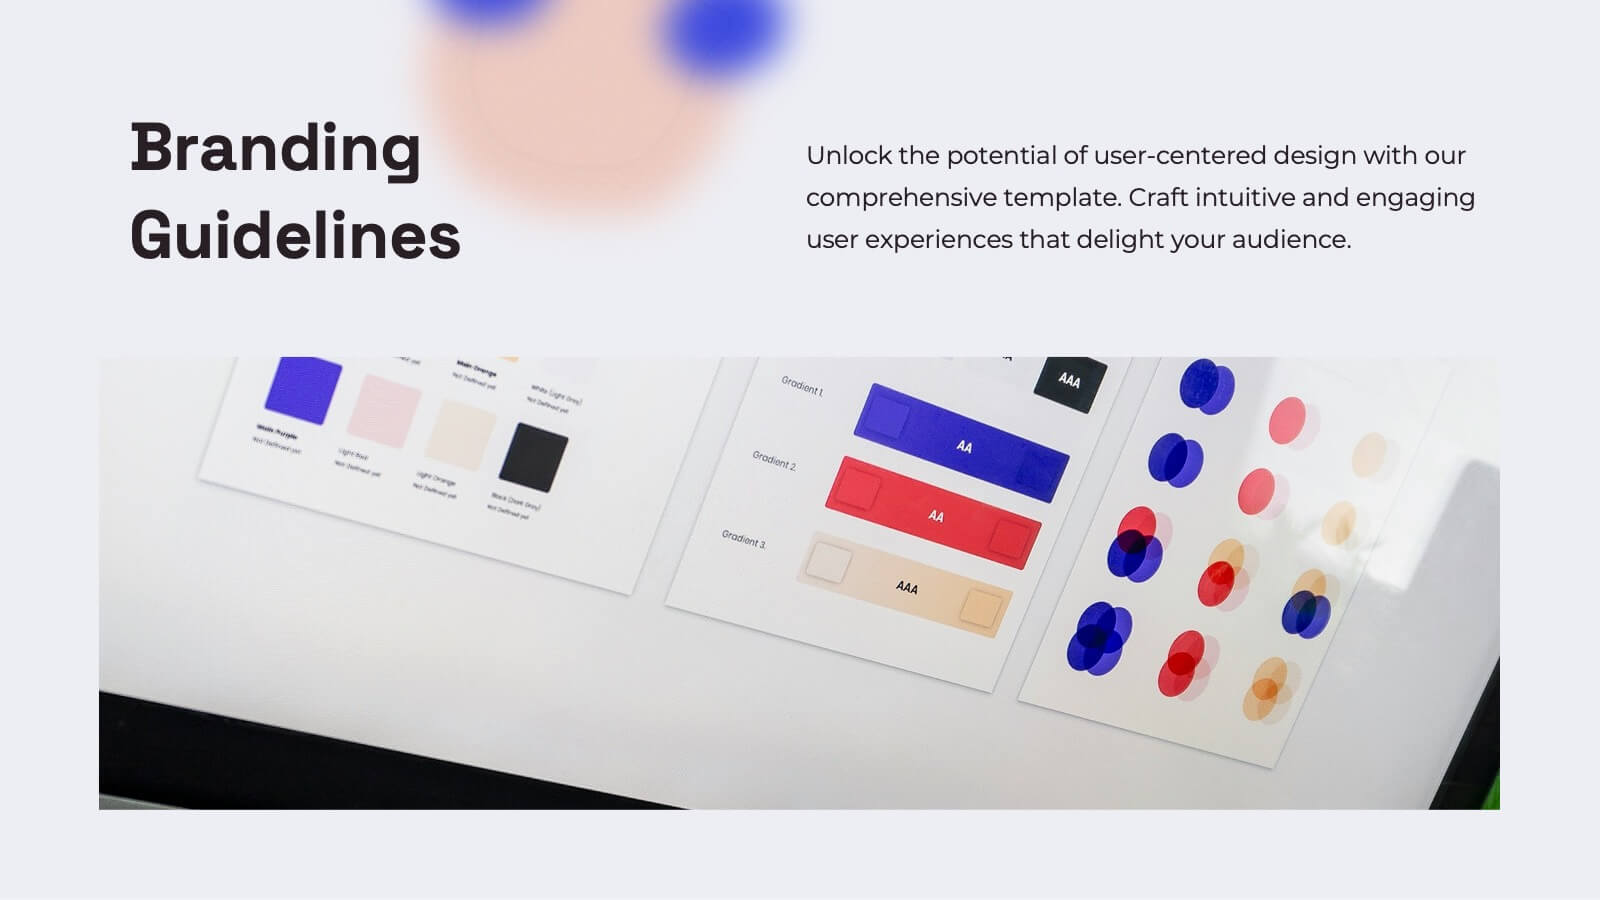
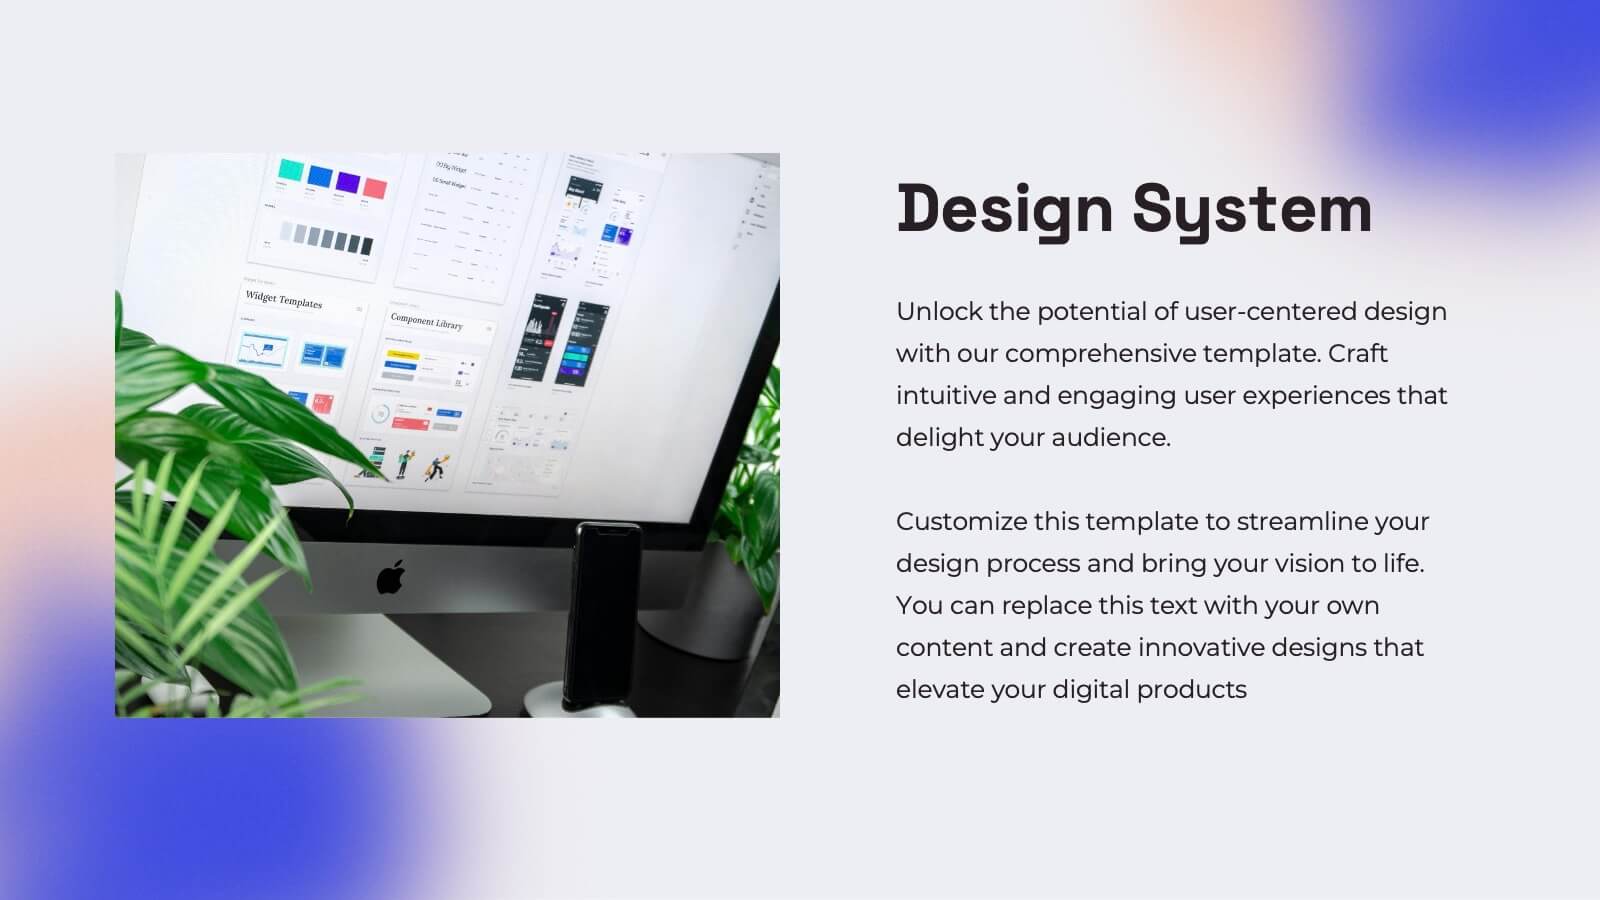
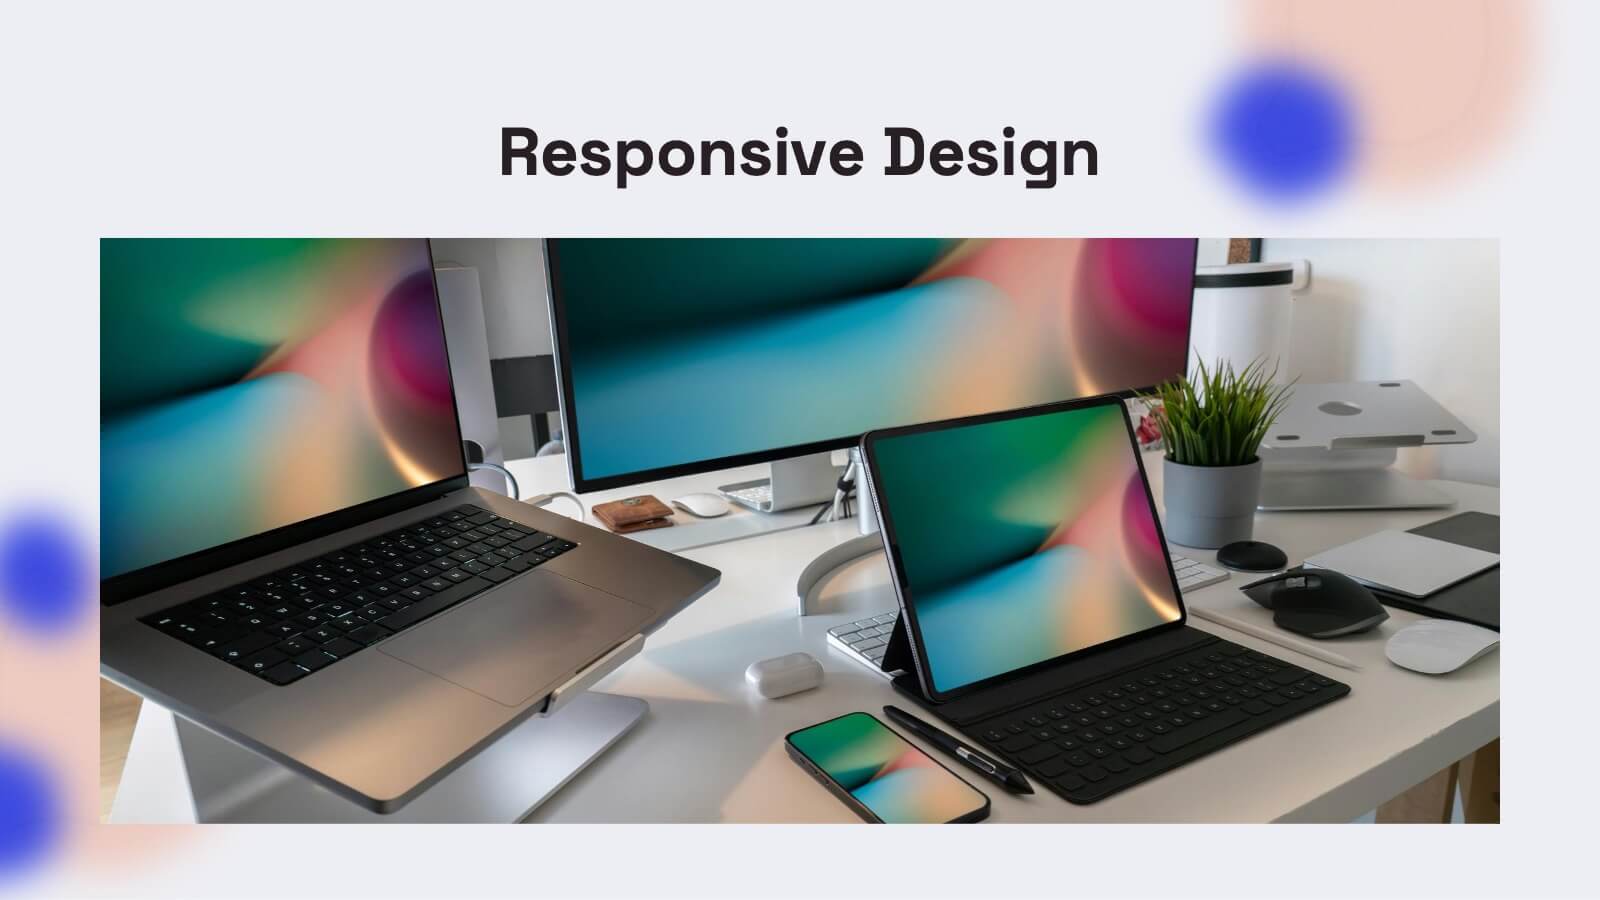
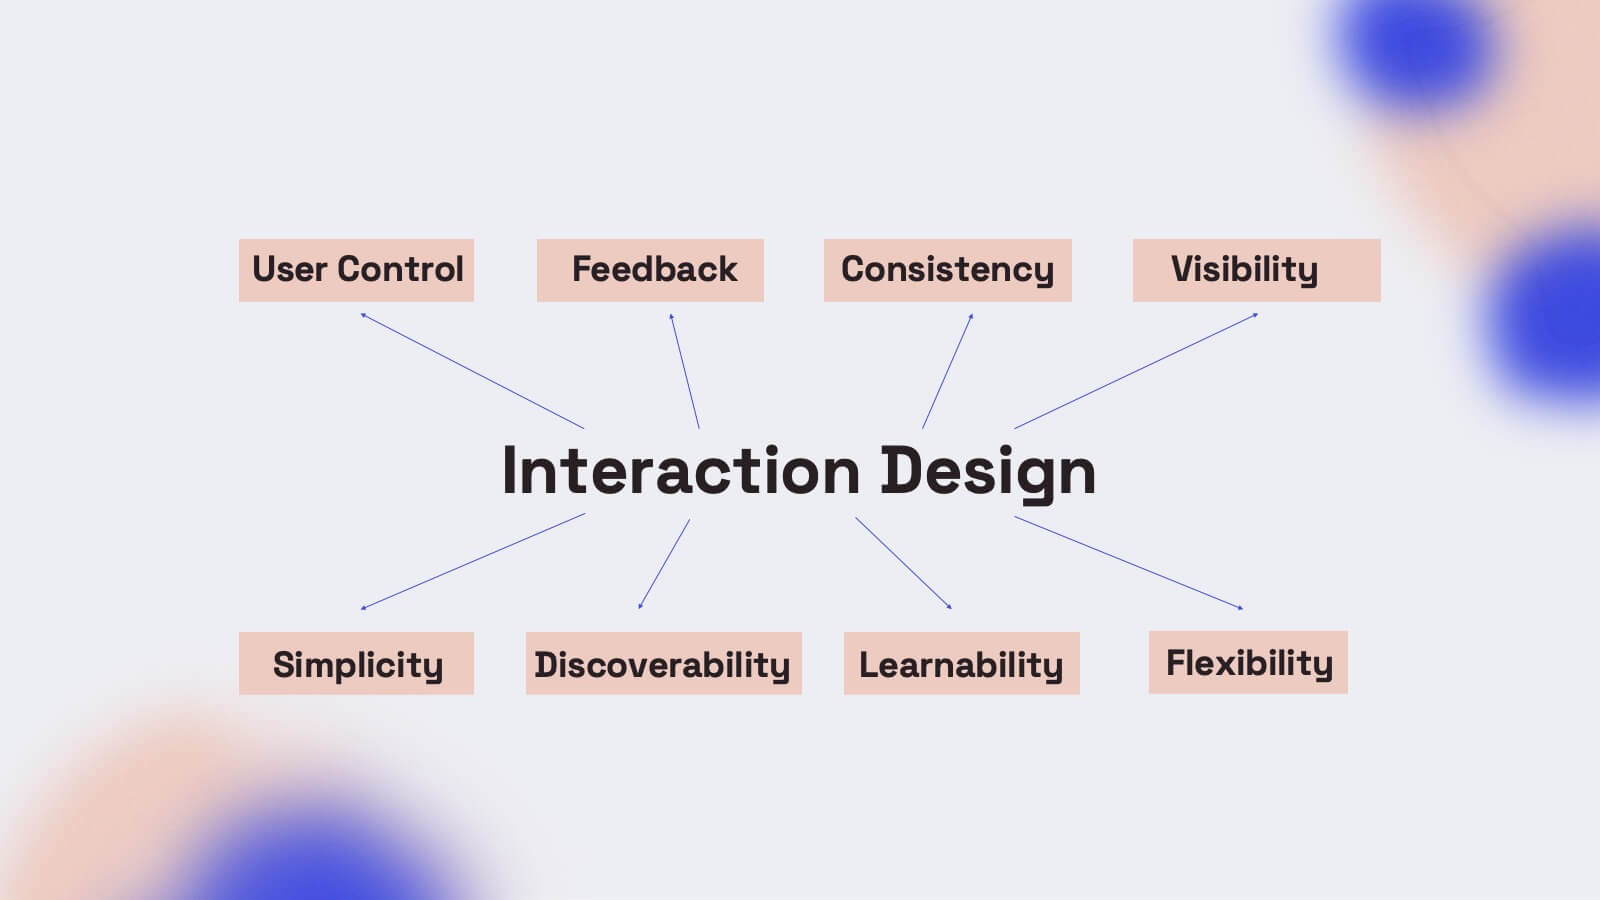
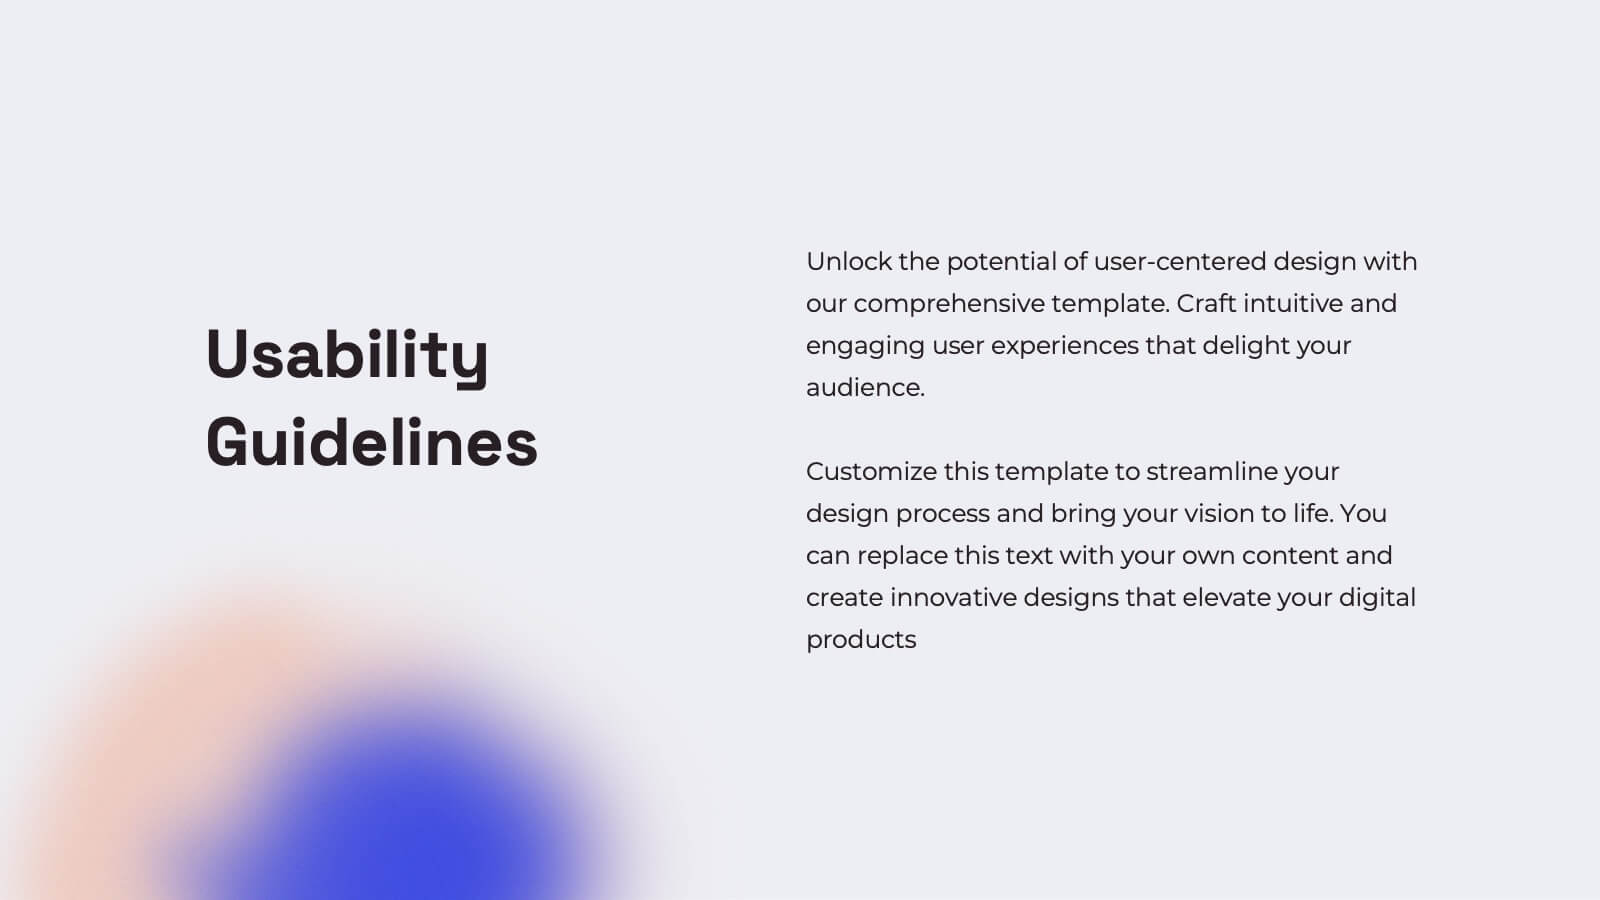
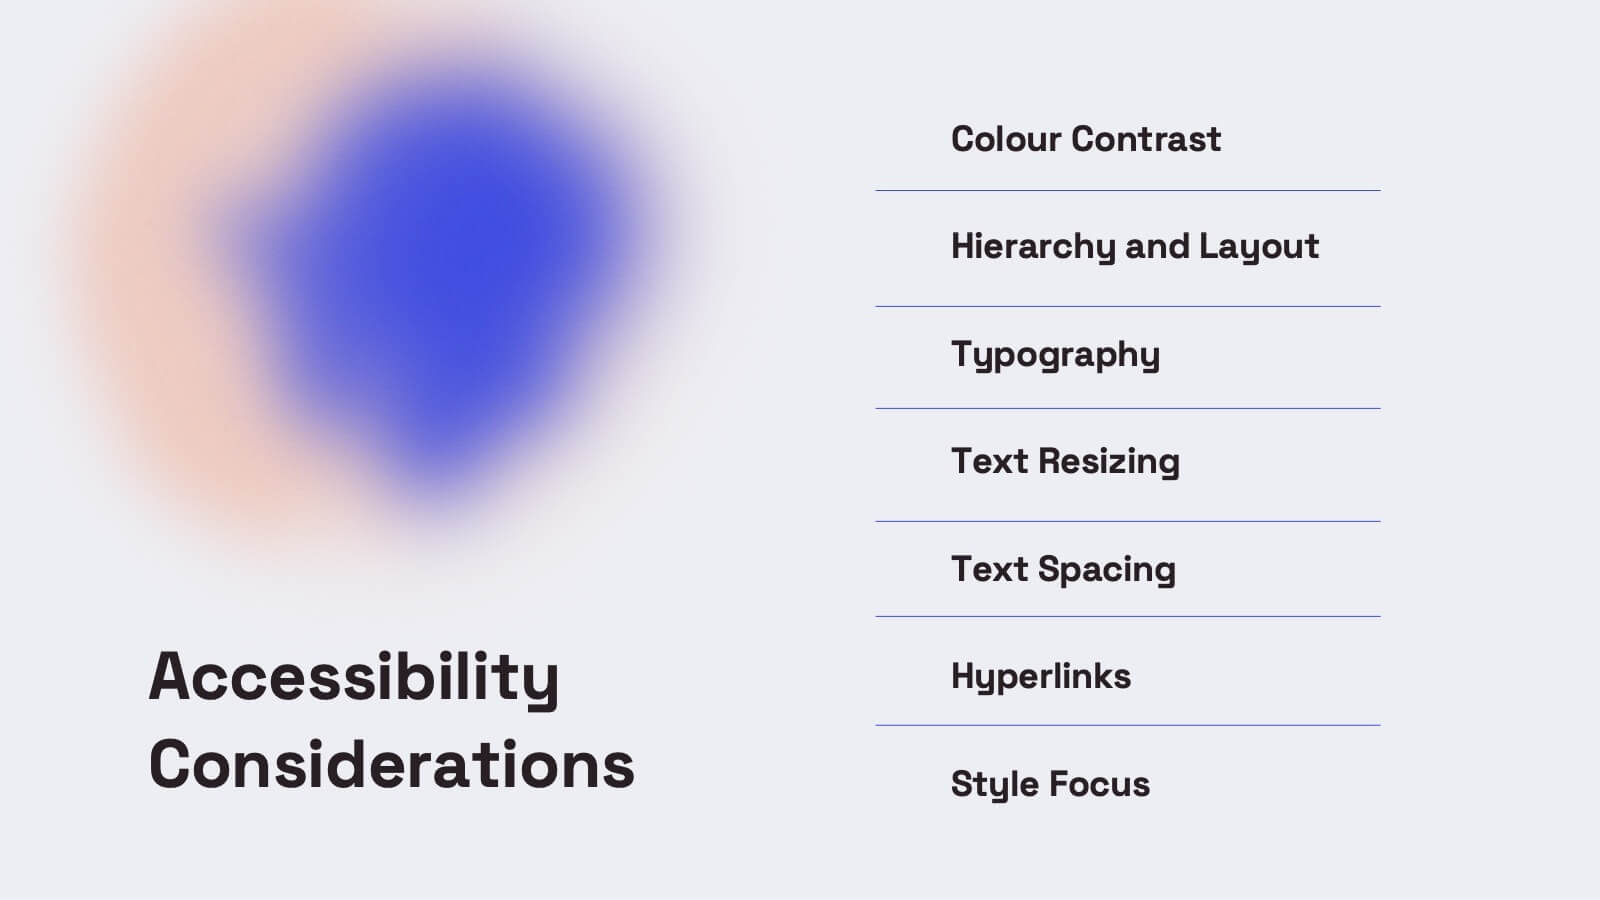
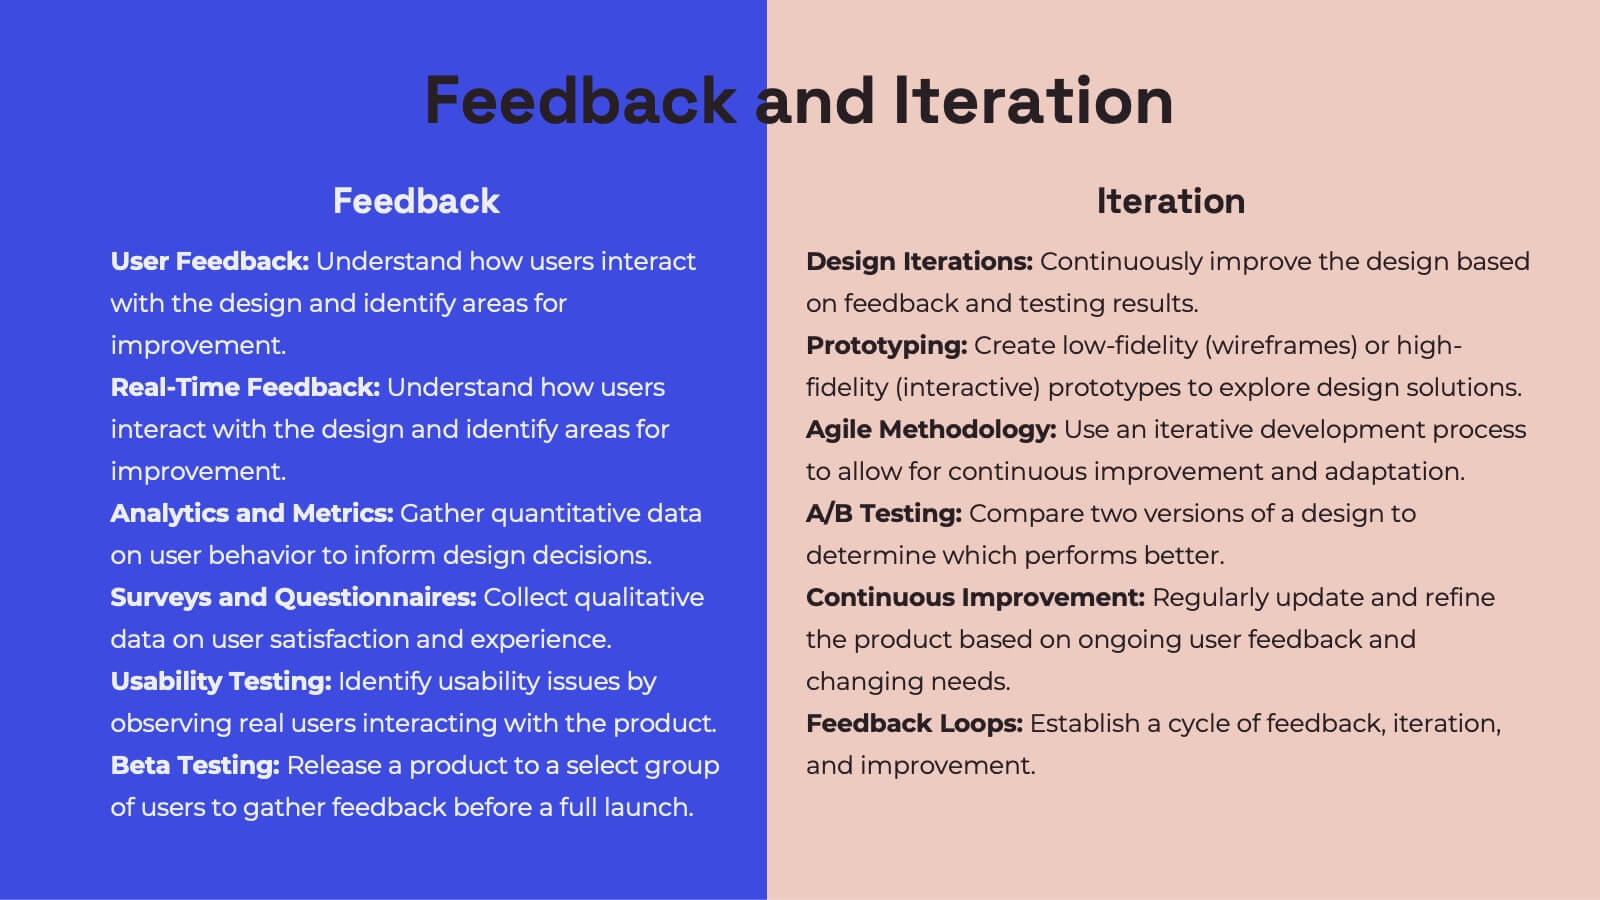
Gemini UX Design Presentation
Enhance your UX presentations with this vibrant and user-friendly template. Designed to cover every aspect of UX design, from user research and personas to wireframes and prototyping, this template ensures a comprehensive and engaging delivery. Its modern design and structured layout make your insights clear and impactful. Compatible with PowerPoint, Keynote, and Google Slides, it's perfect for any platform.


4 diapositivas
Digital Marketing and SEO Best Practices Presentation
Communicate your digital strategy with this clean and structured visual layout. This template features a horizontal flowchart design with four circular icons branching from a central infographic, allowing you to showcase core areas such as audience targeting, content creation, performance analytics, and ranking improvement. Ideal for marketers, consultants, and SEO professionals. Fully editable in PowerPoint, Keynote, and Google Slides.