


Características


¿Tienes alguna pregunta?
Recomendar


7 diapositivas
RACI Matrix Manufacturing Infographic
The RACI matrix, an essential tool for defining roles and responsibilities, finds vital applications in the realm of manufacturing. Our RACI matrix manufacturing infographic, bathed in shades of blue against a clean white canvas with tasteful black accents, simplifies the complex choreography of tasks, roles, and accountabilities in manufacturing processes. Designed particularly for manufacturing managers, team leaders, and project coordinators, this template vividly illustrates how tasks are assigned and to whom, ensuring clarity and streamlining operations. Ready-to-use, it integrates seamlessly with PowerPoint, Keynote, and Google Slides.


22 diapositivas
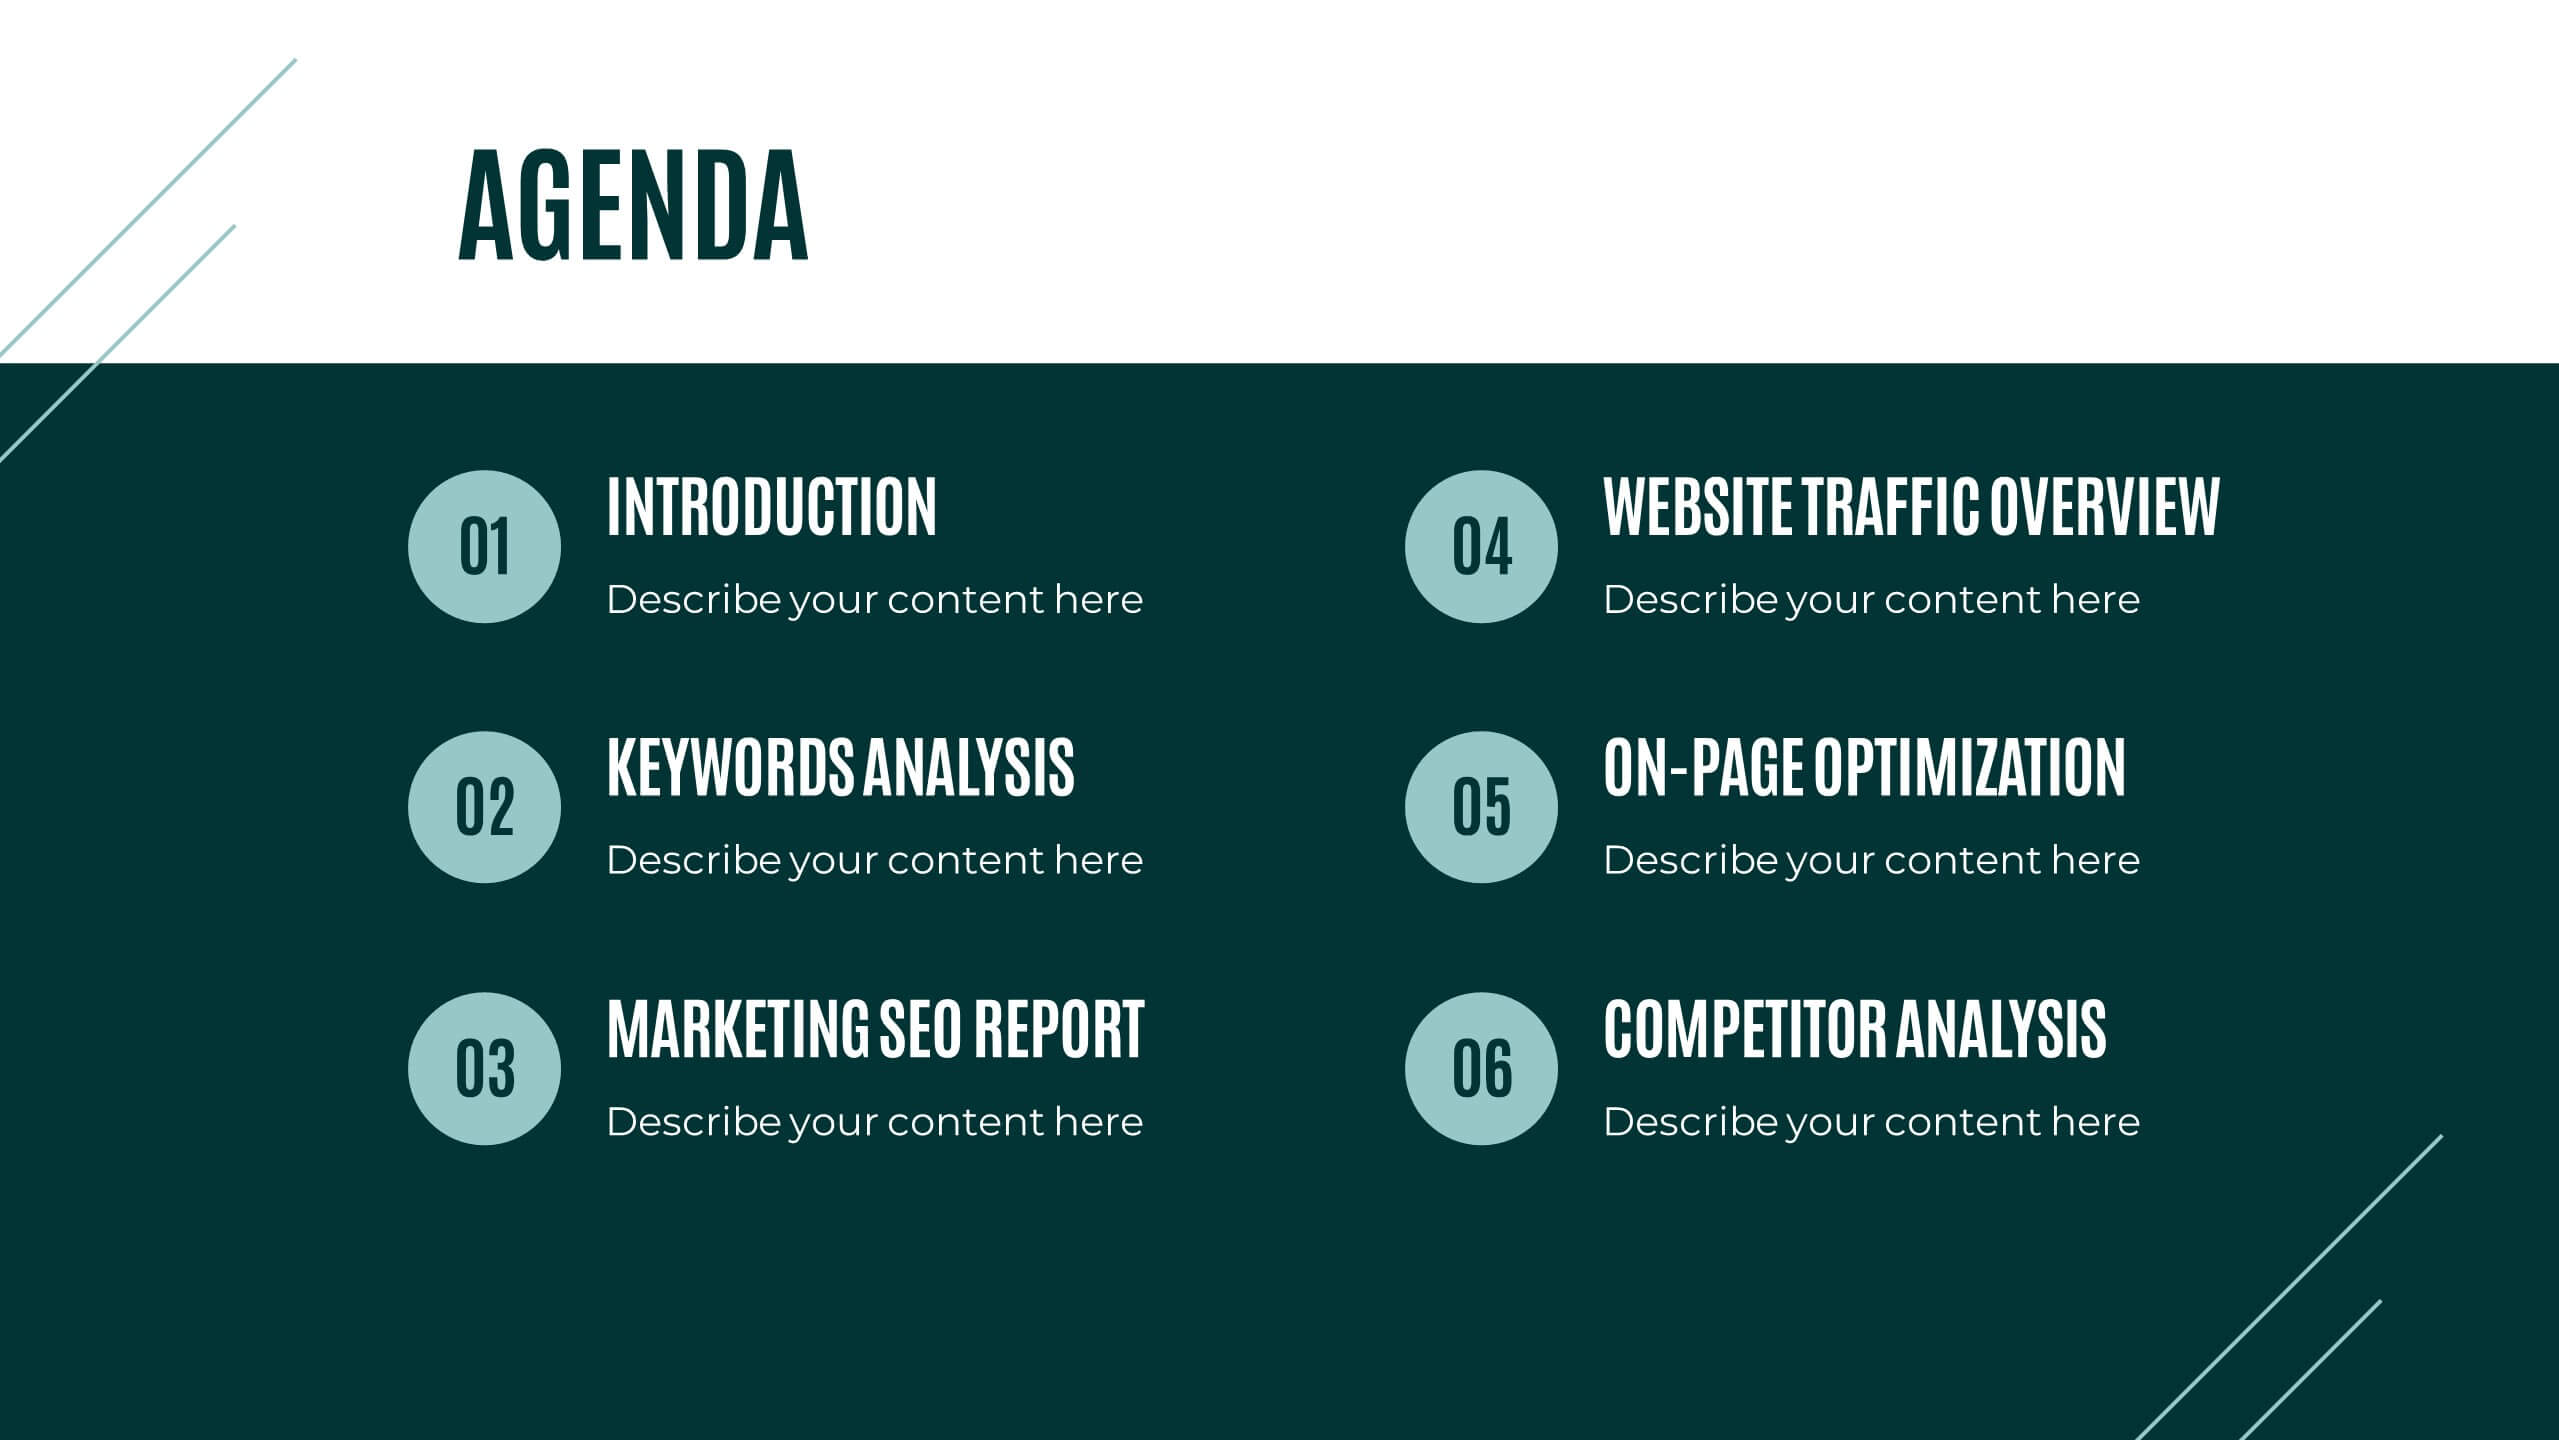
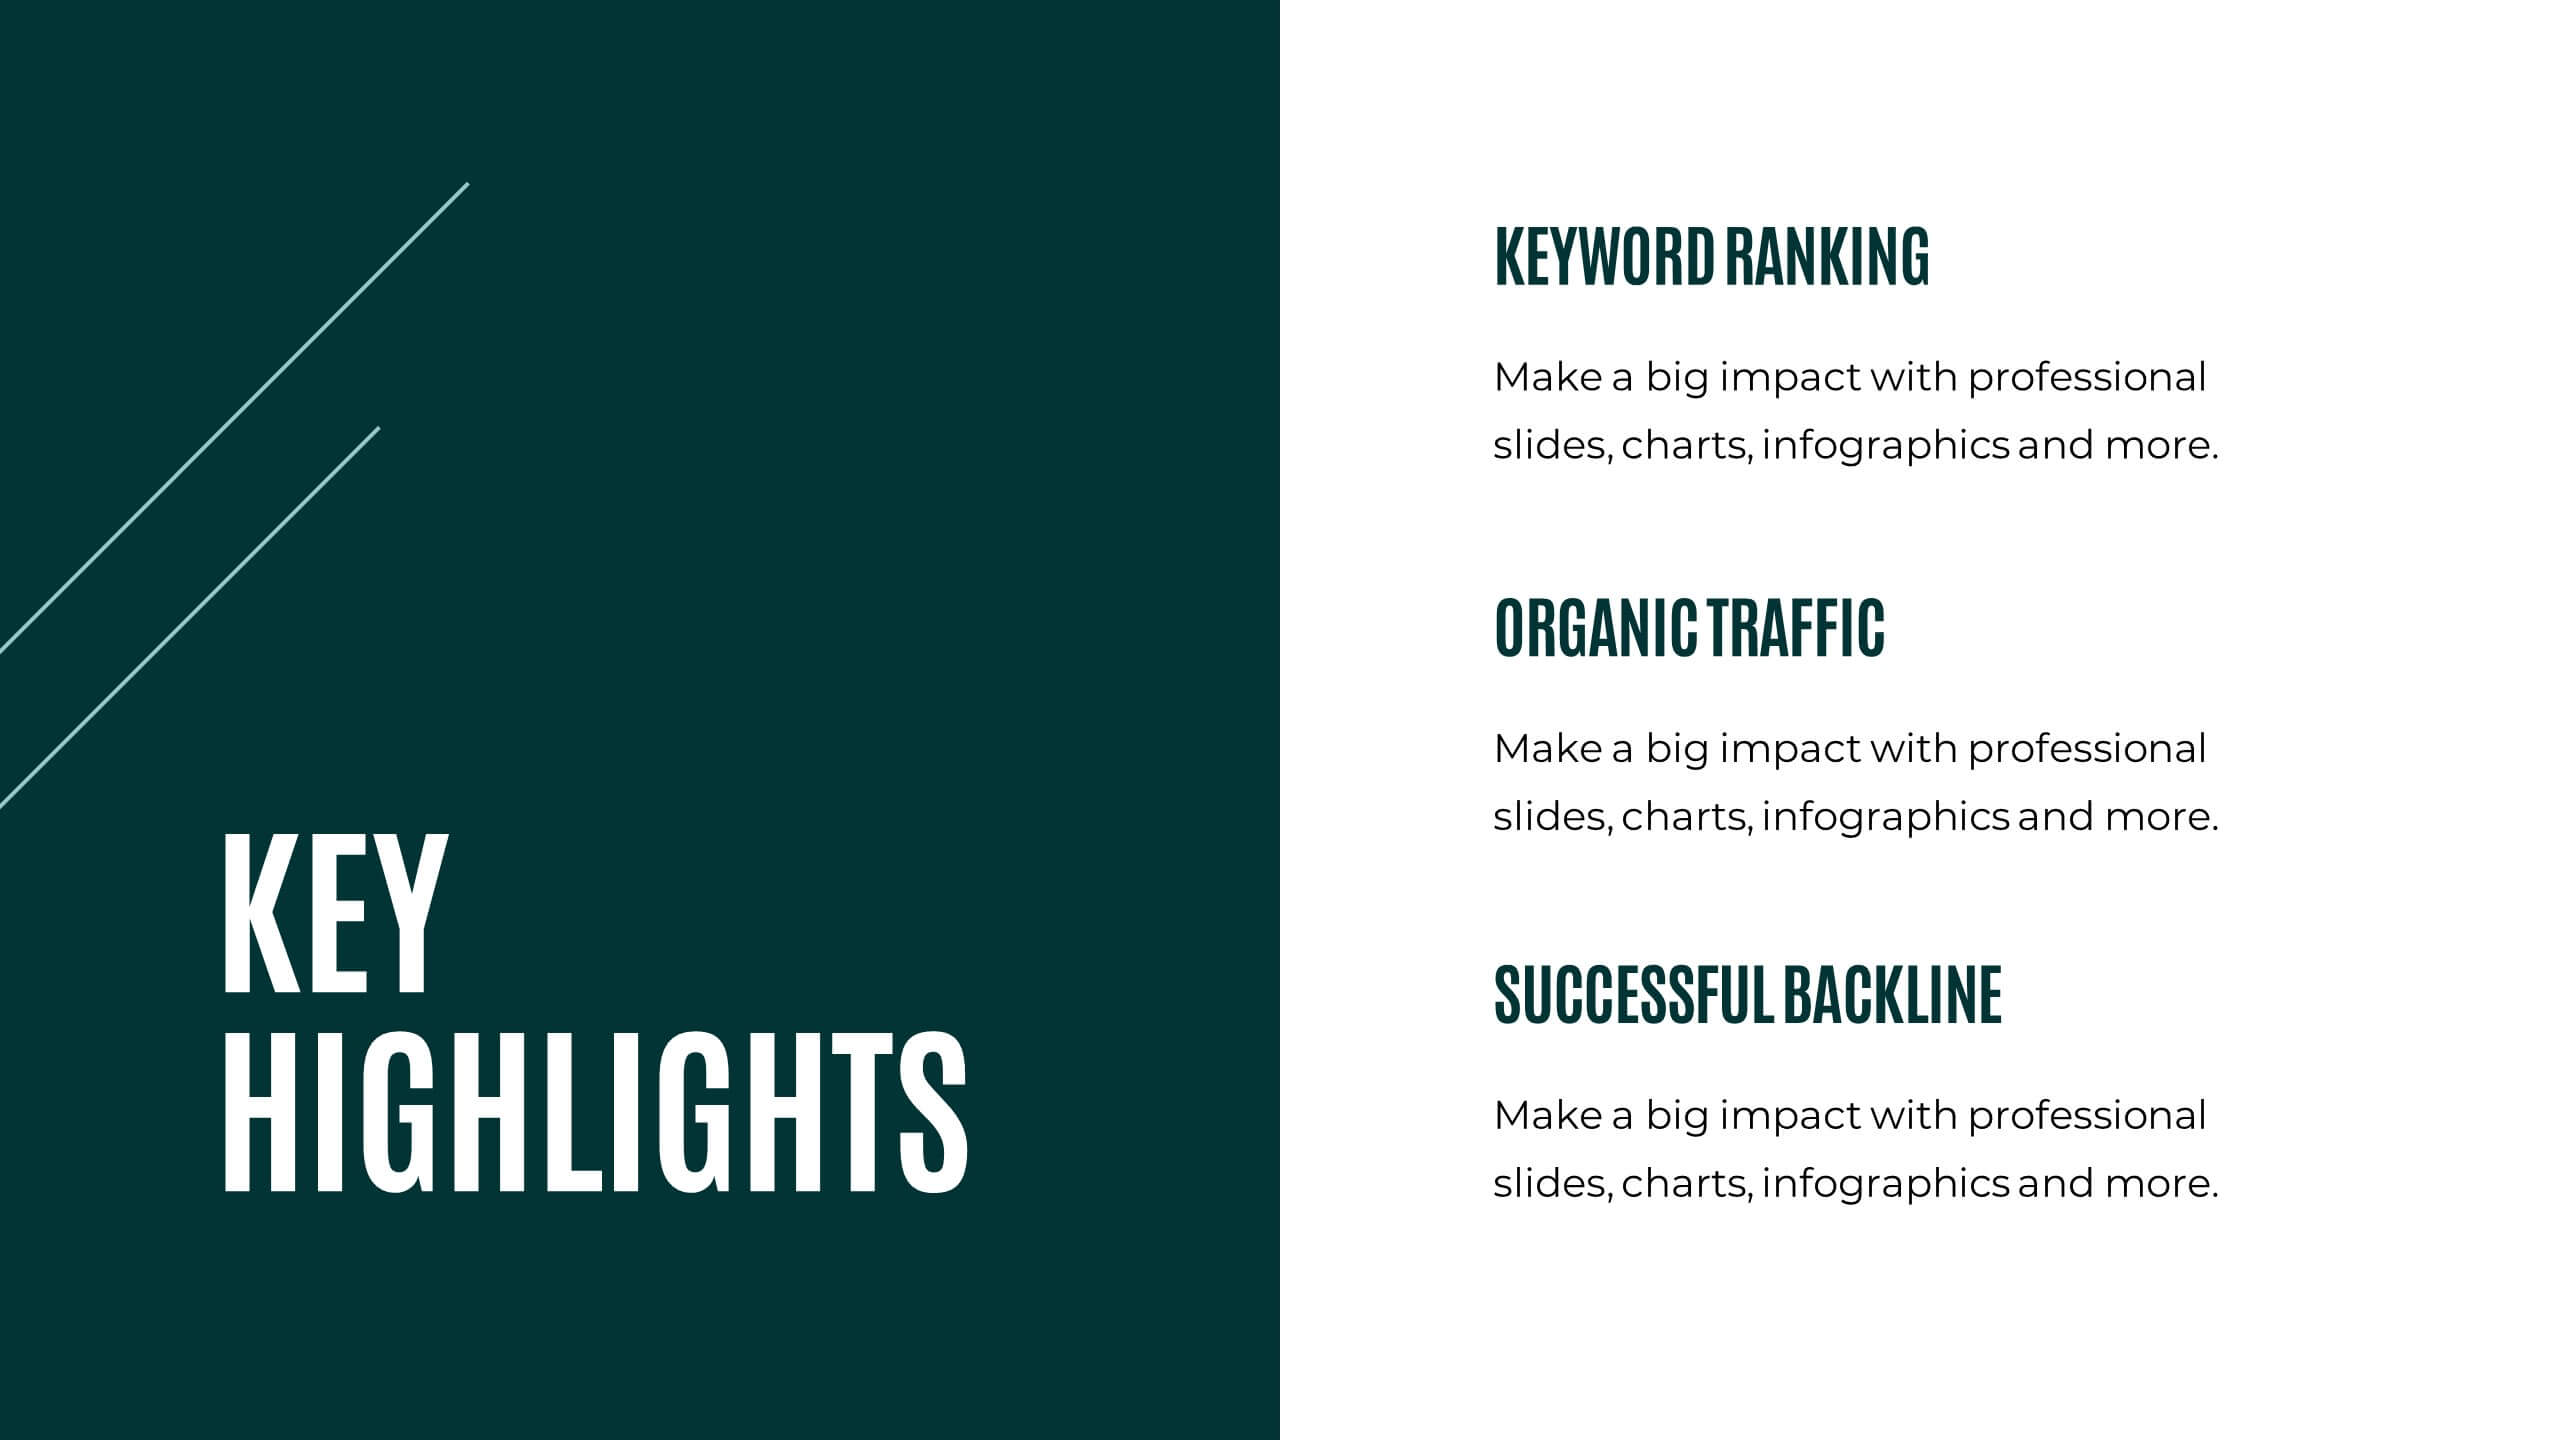
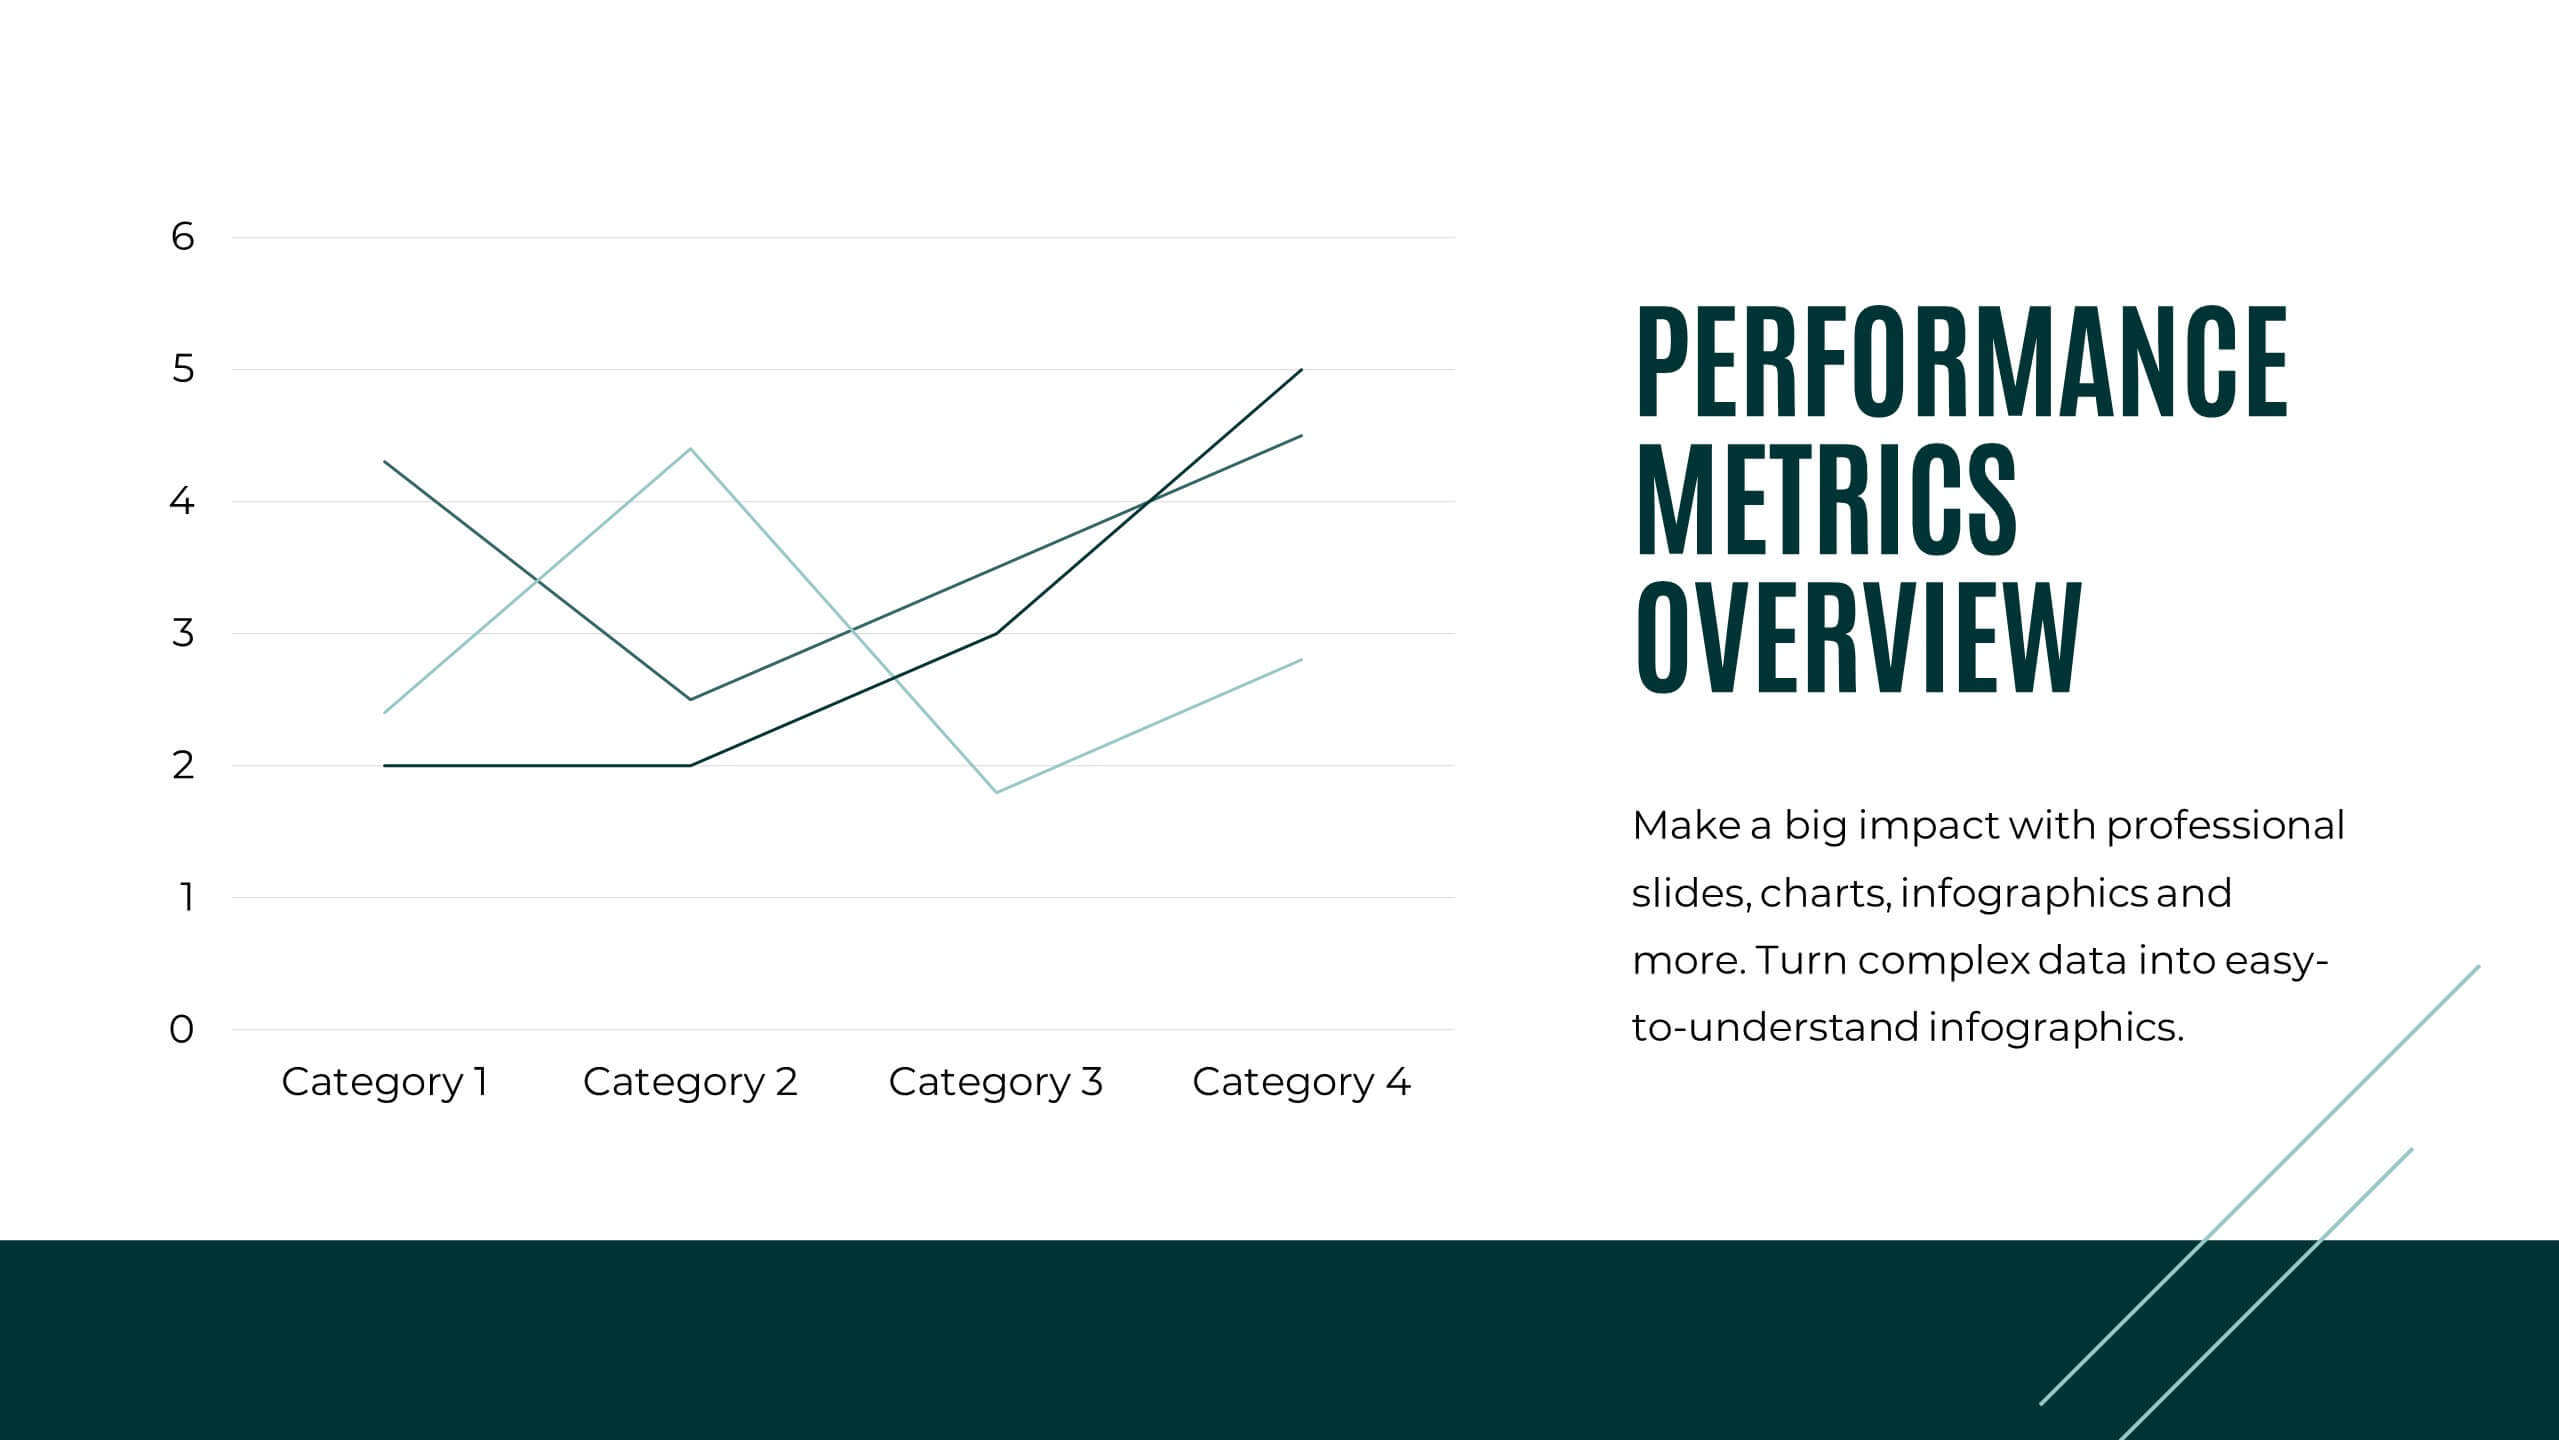
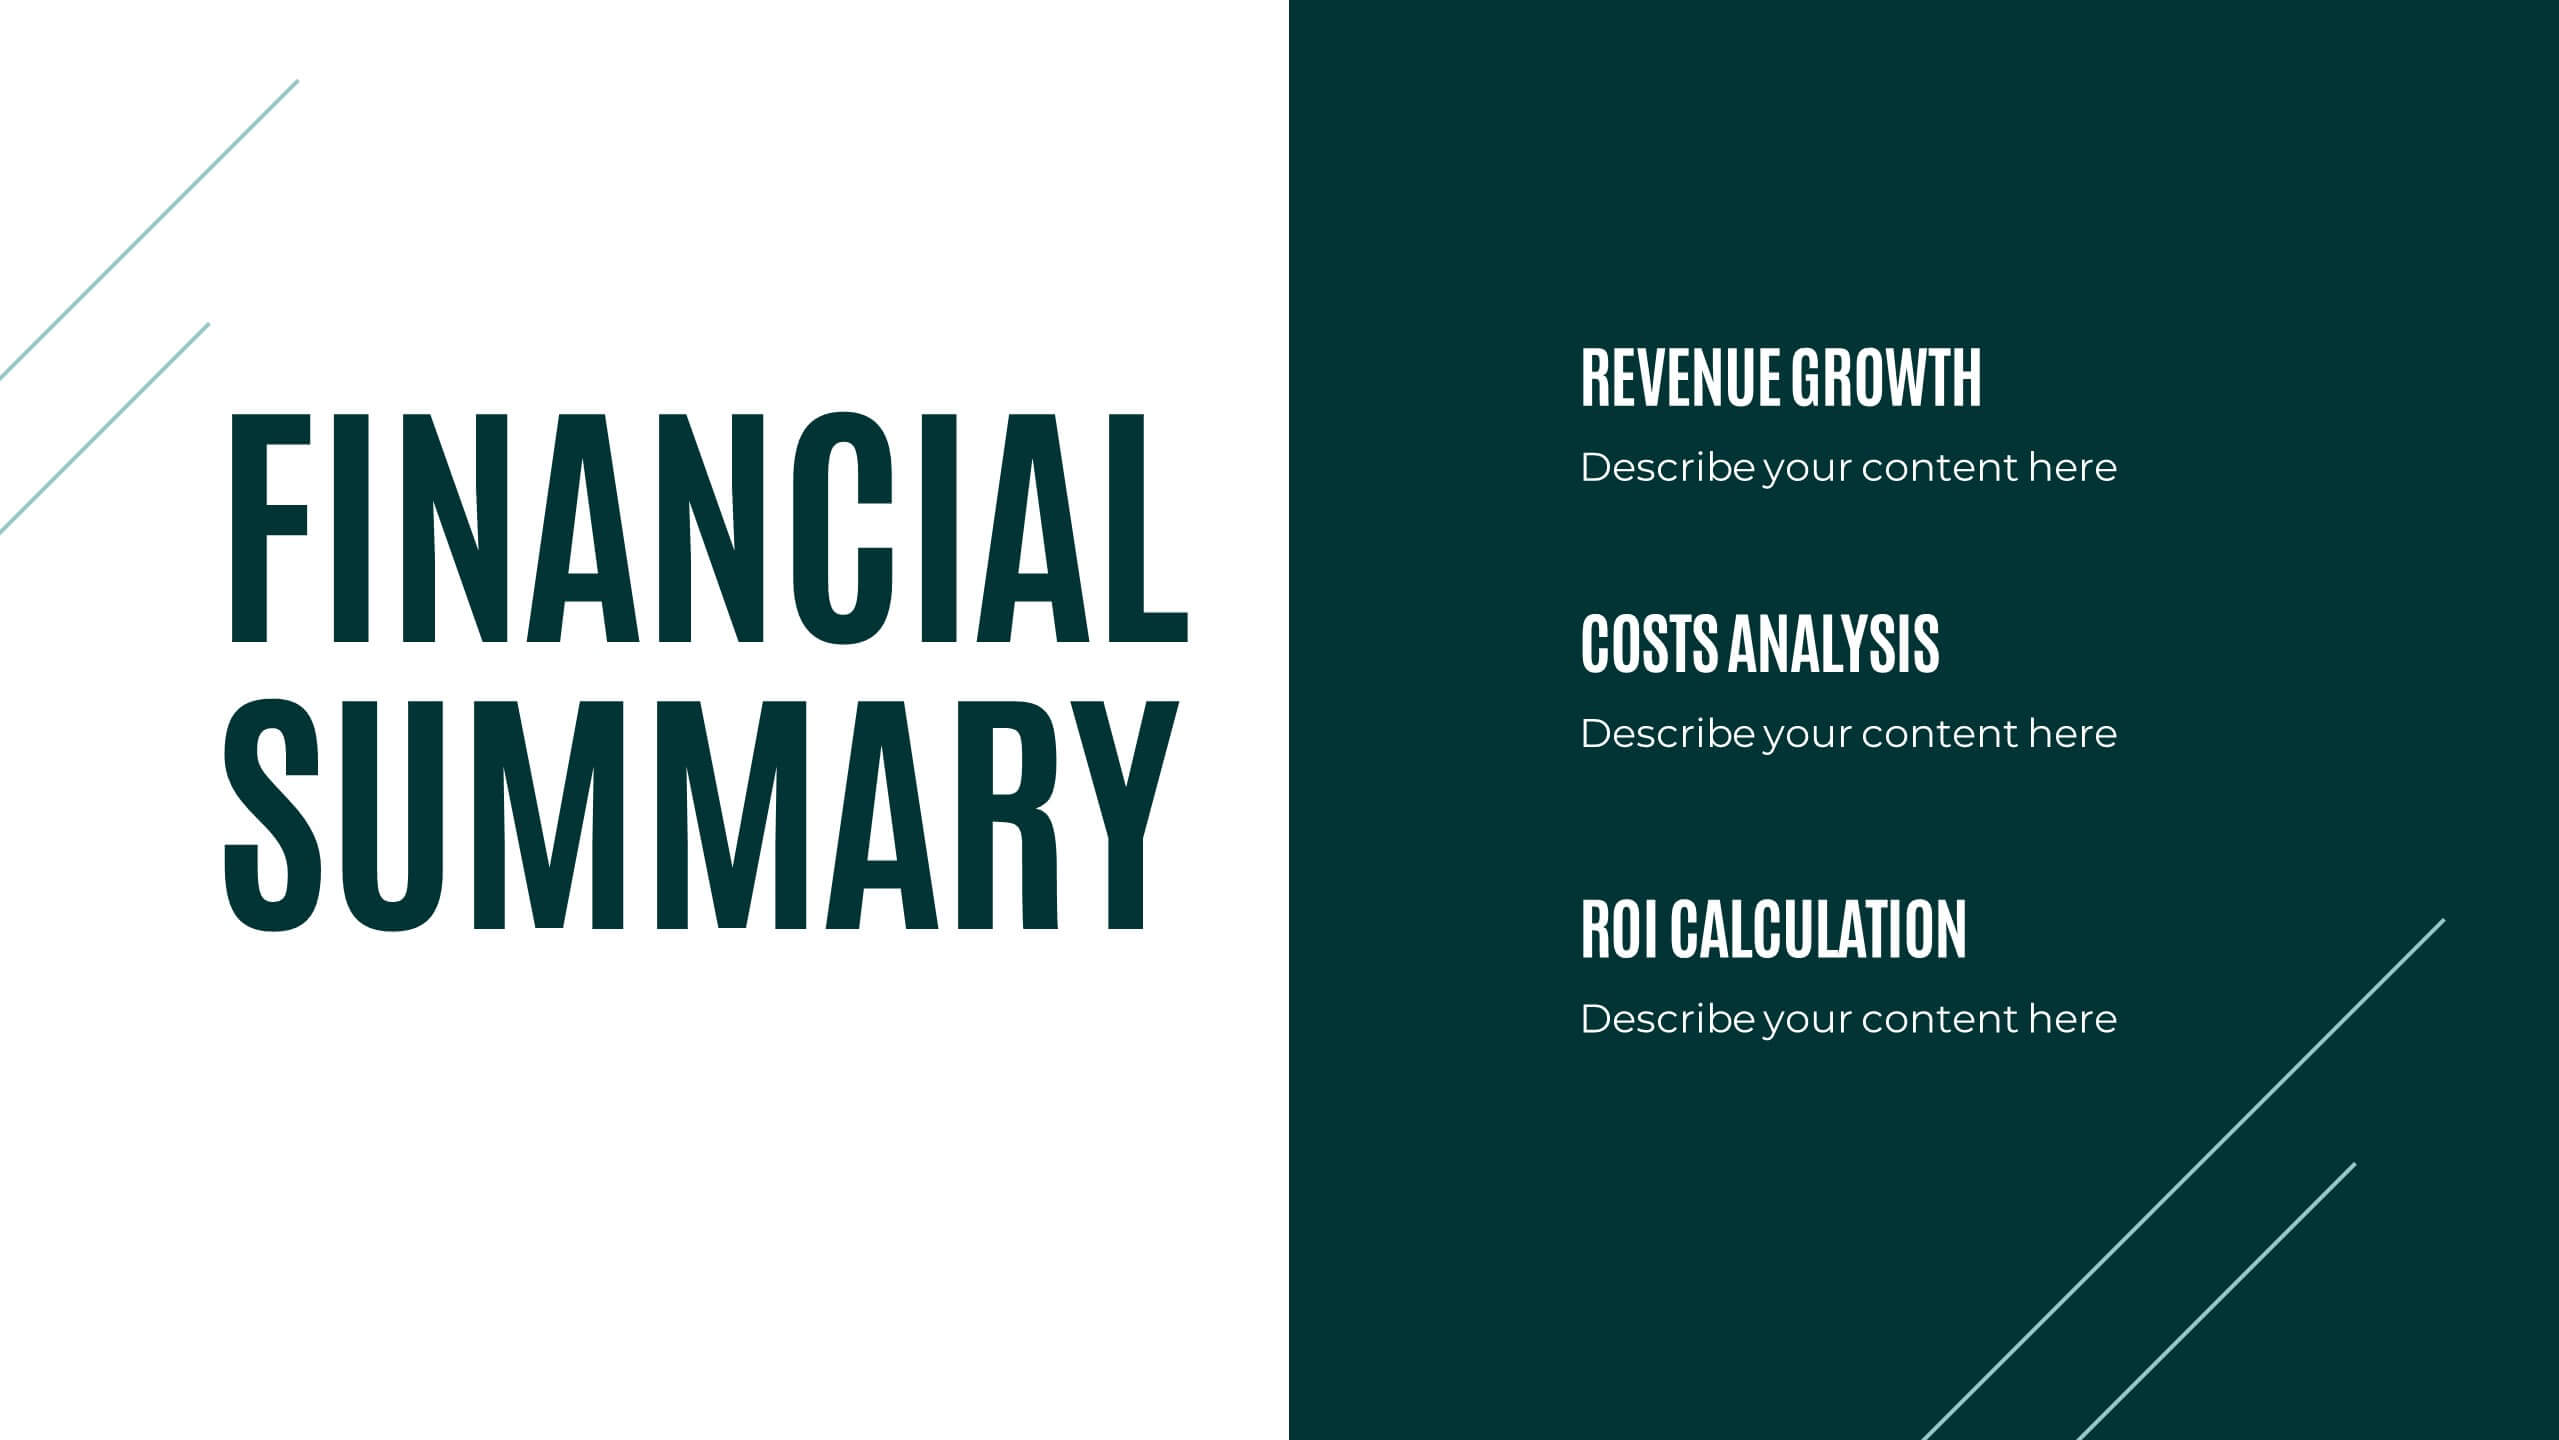
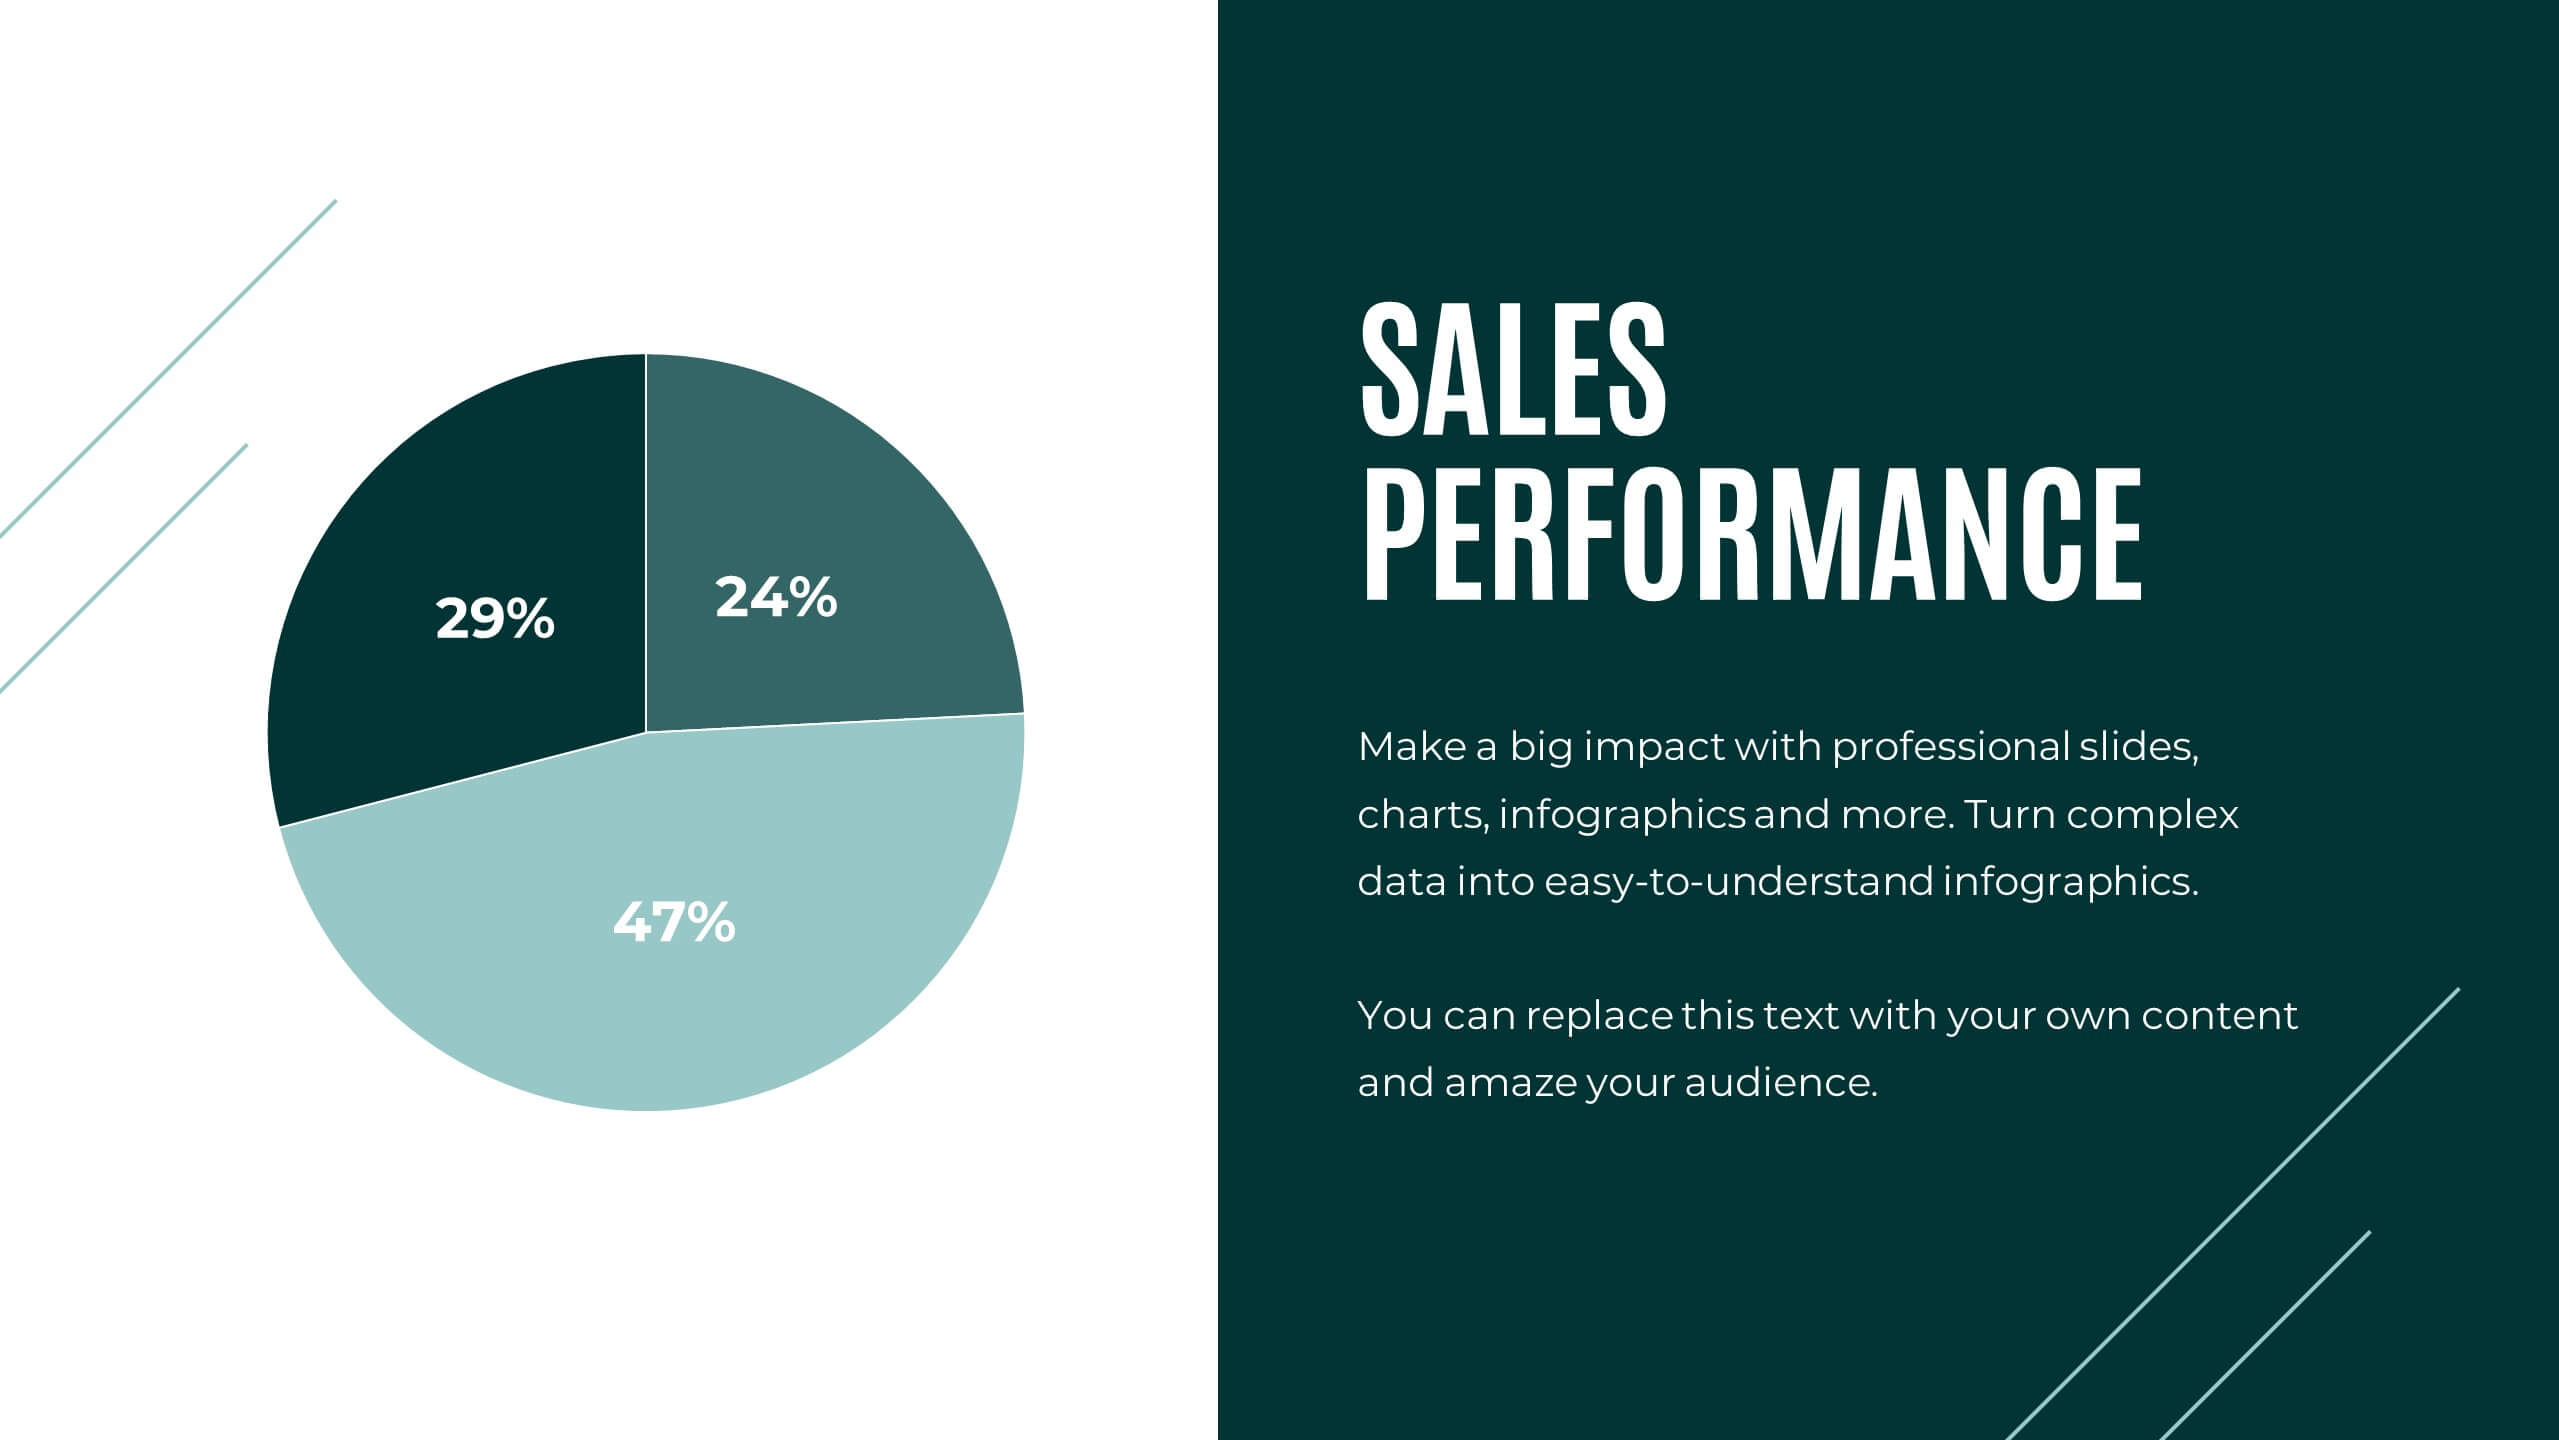
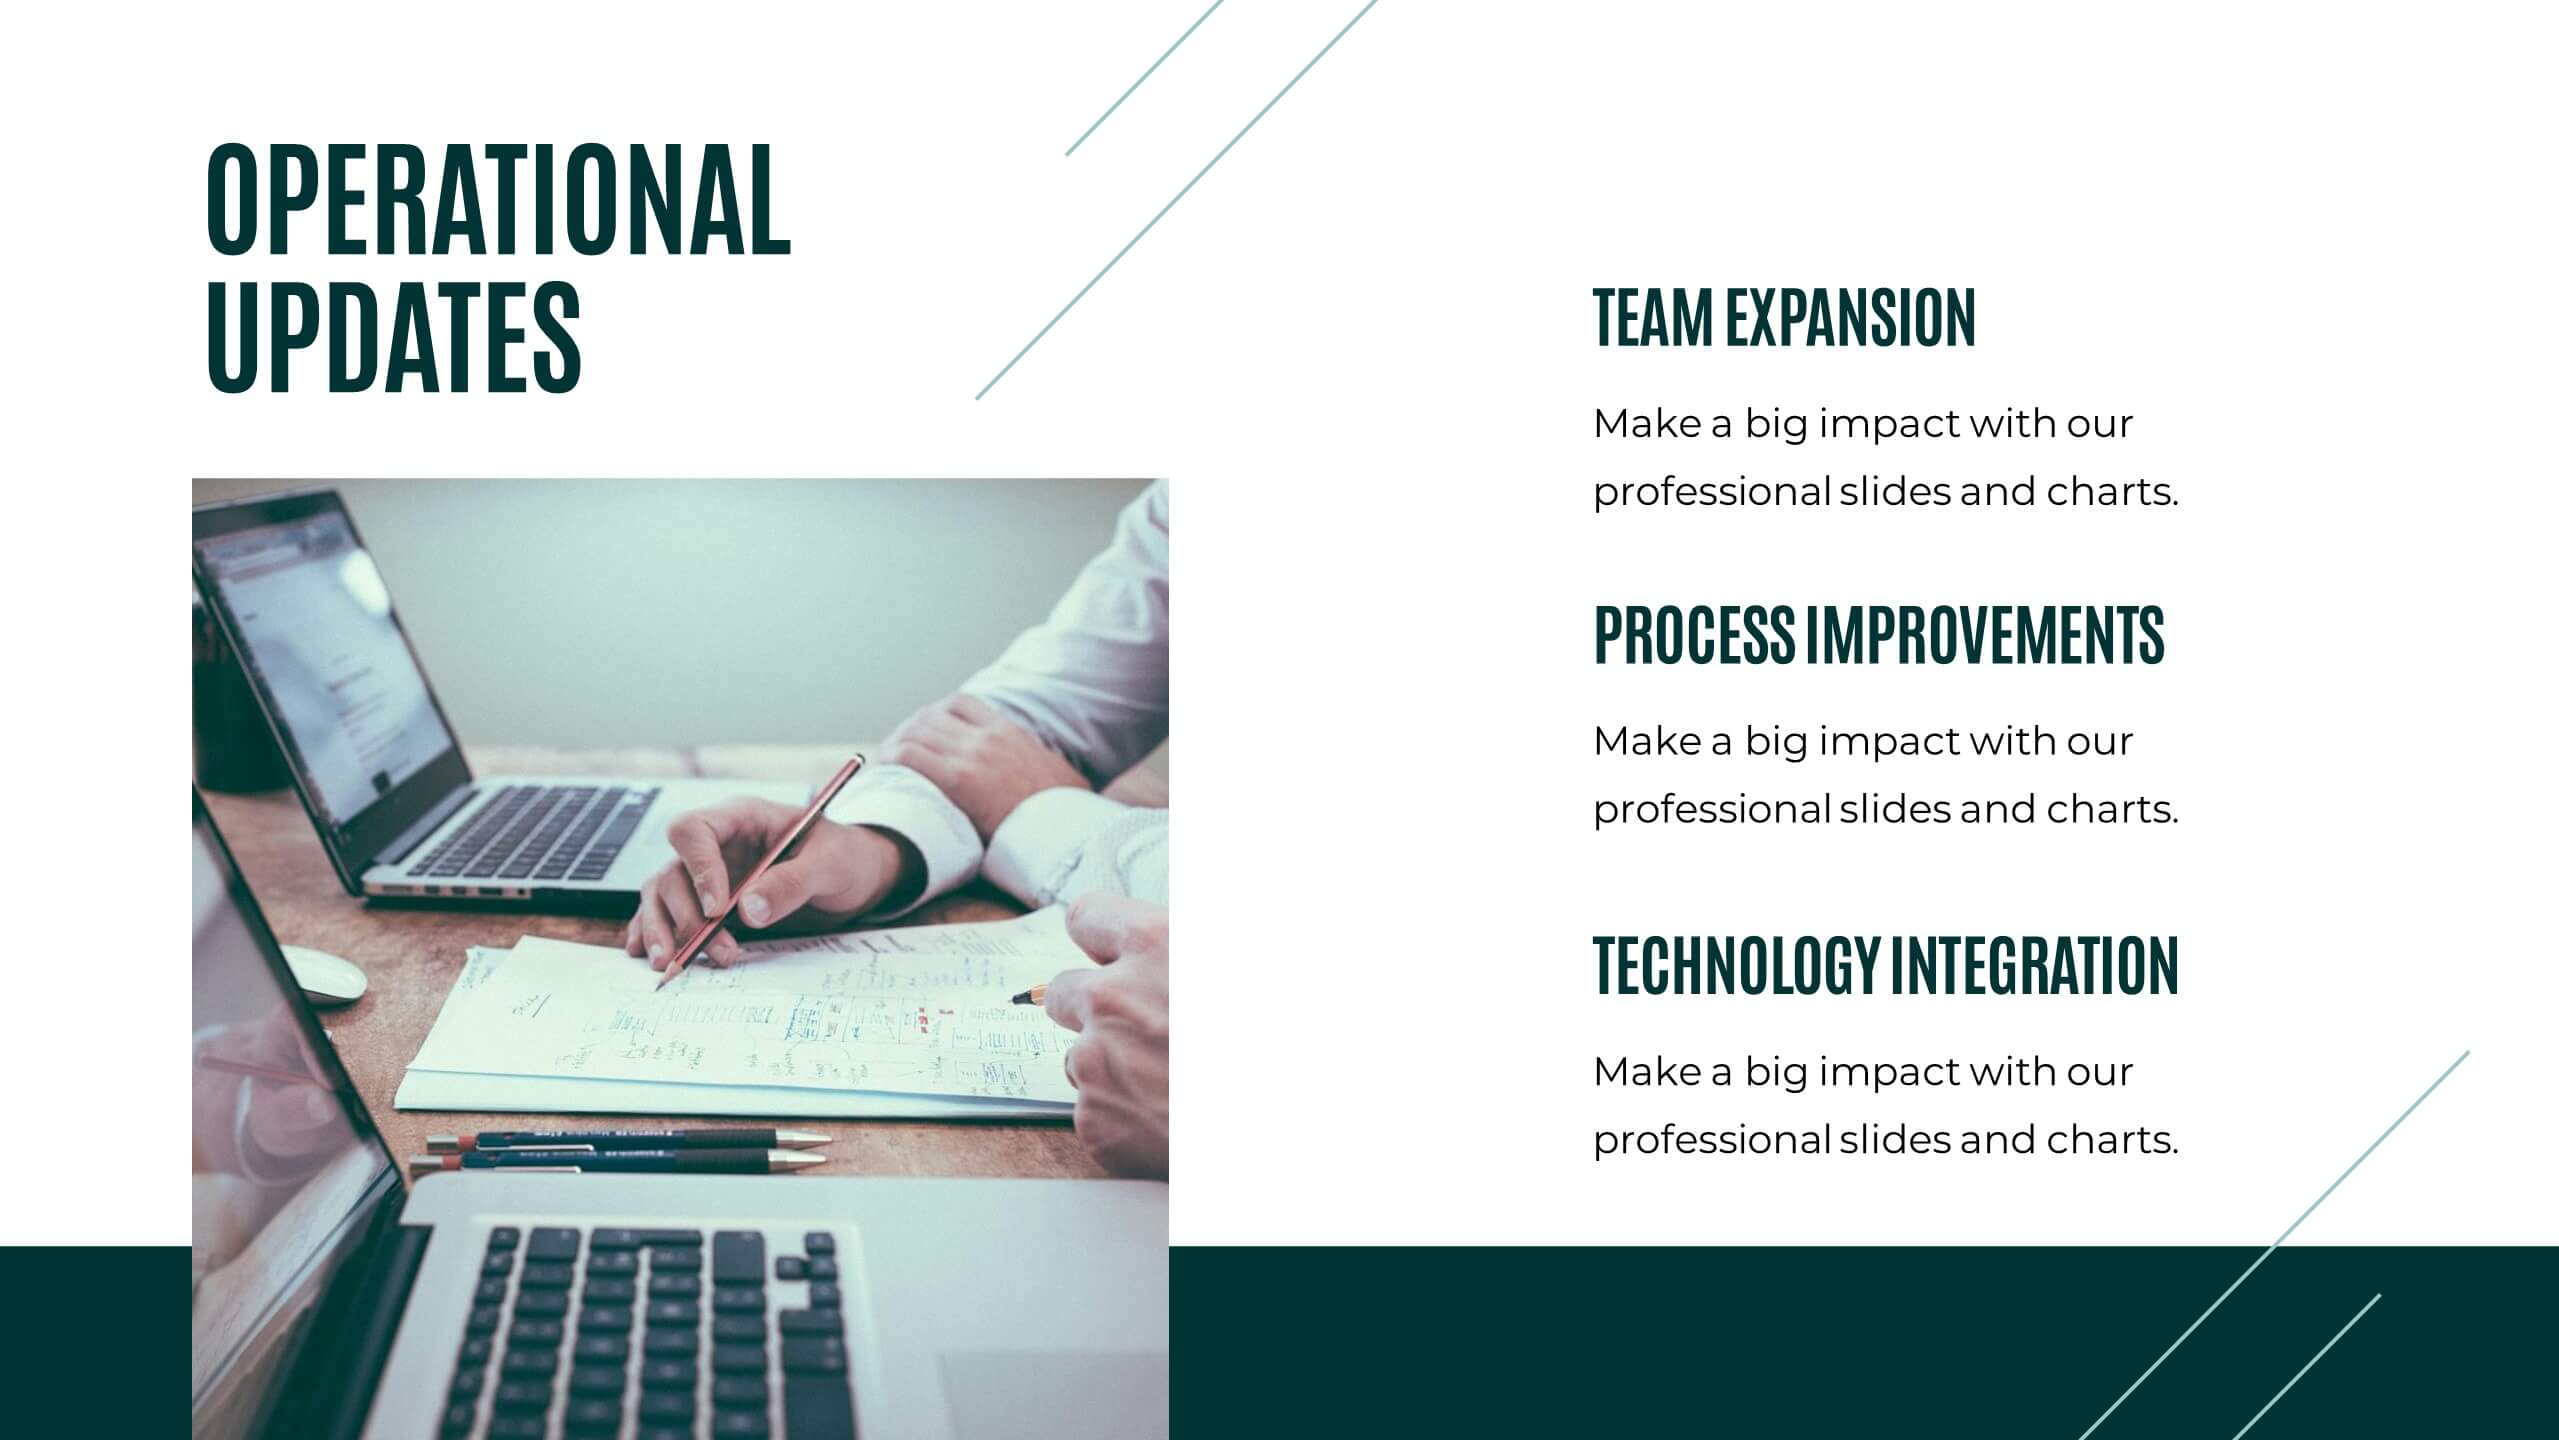
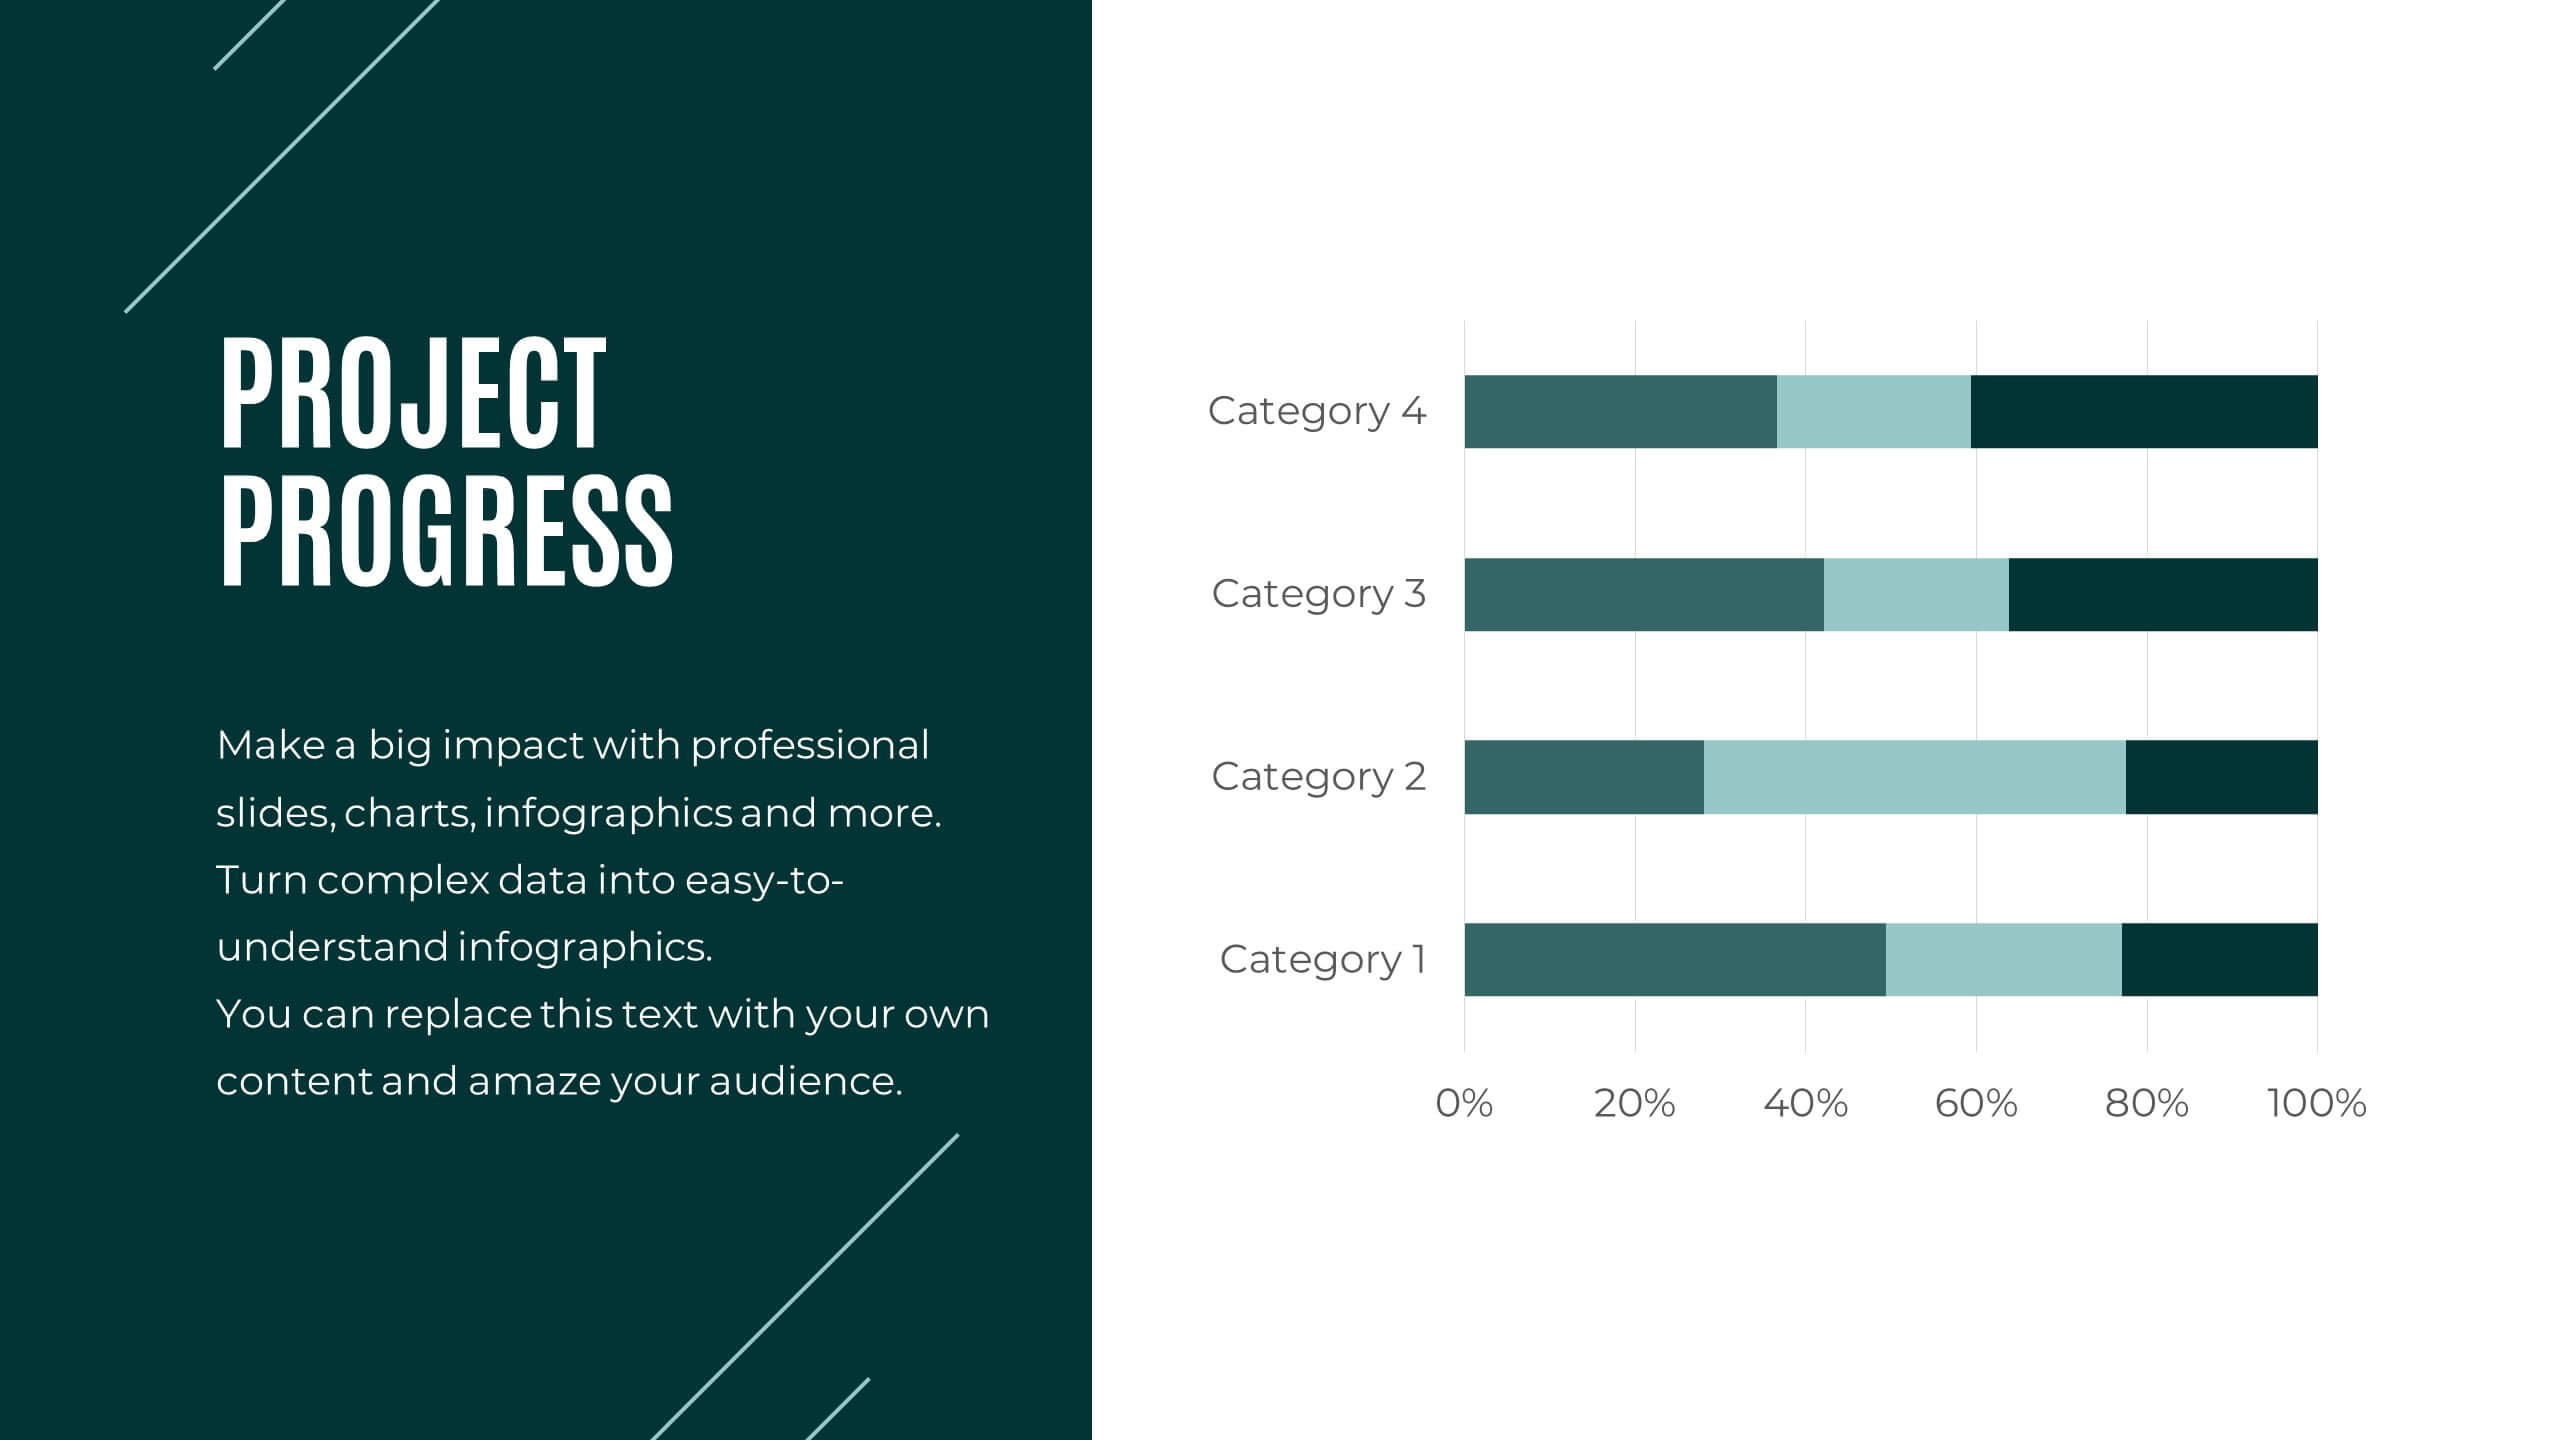
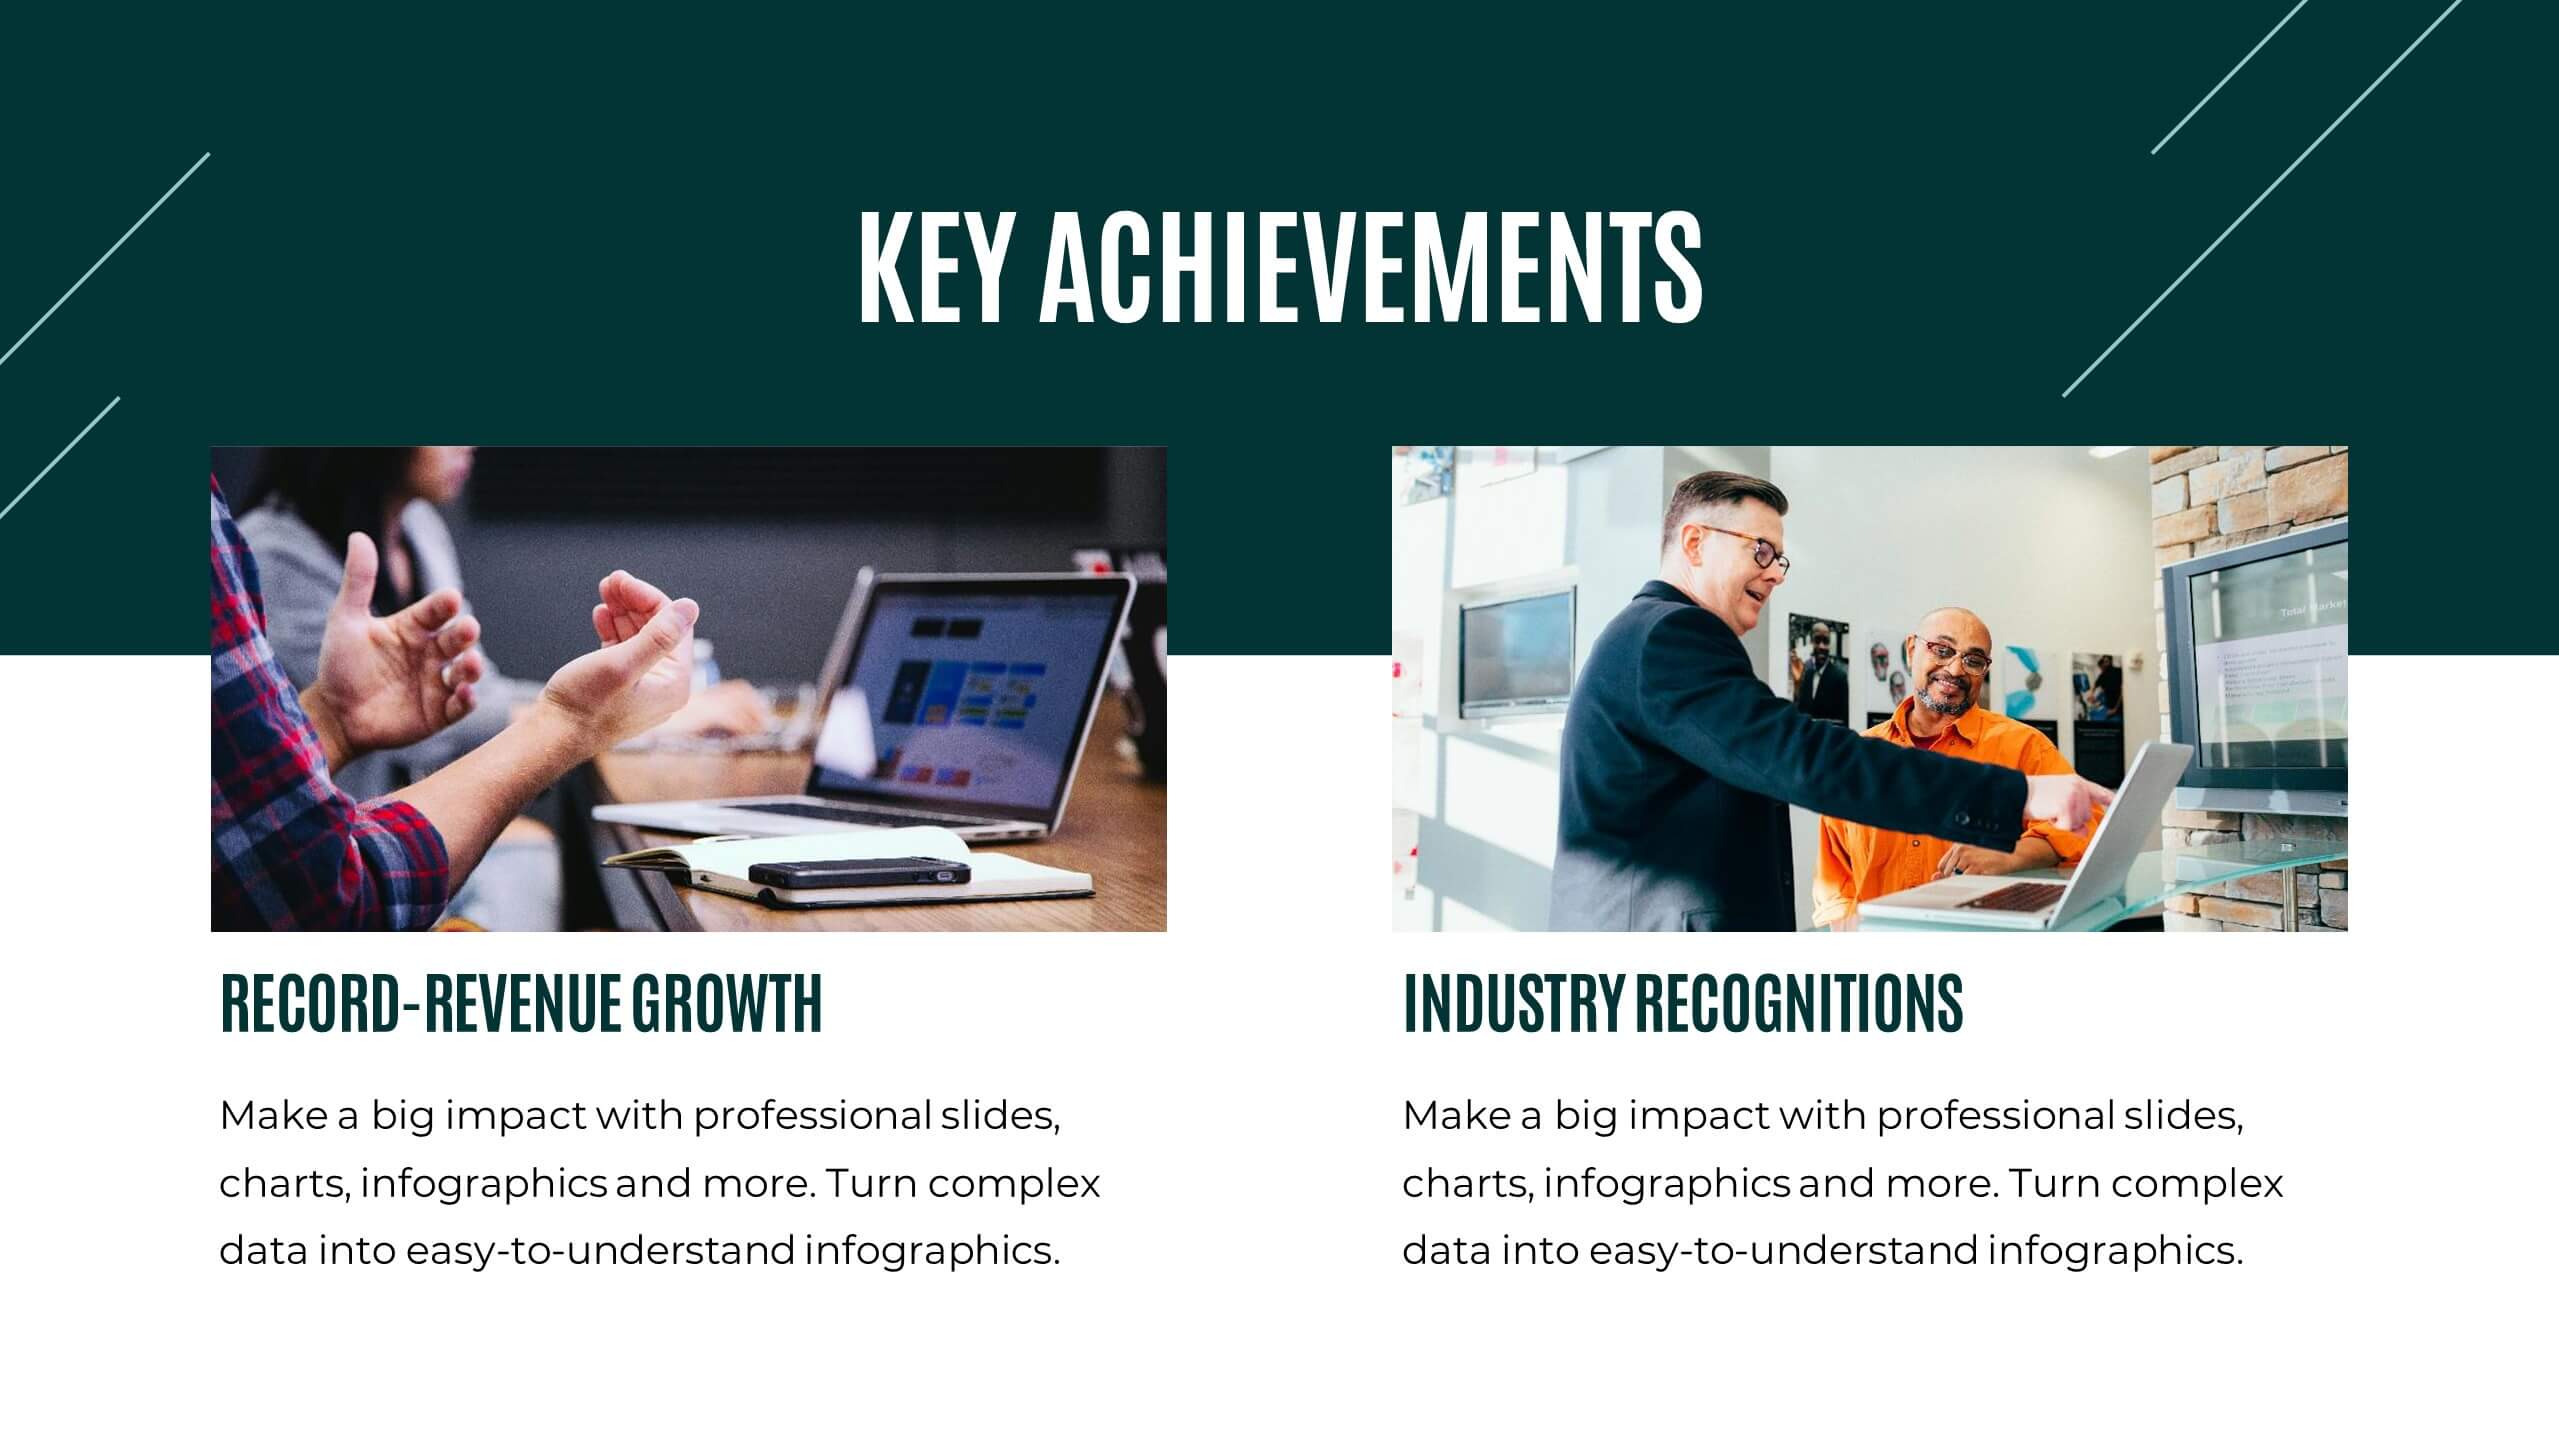
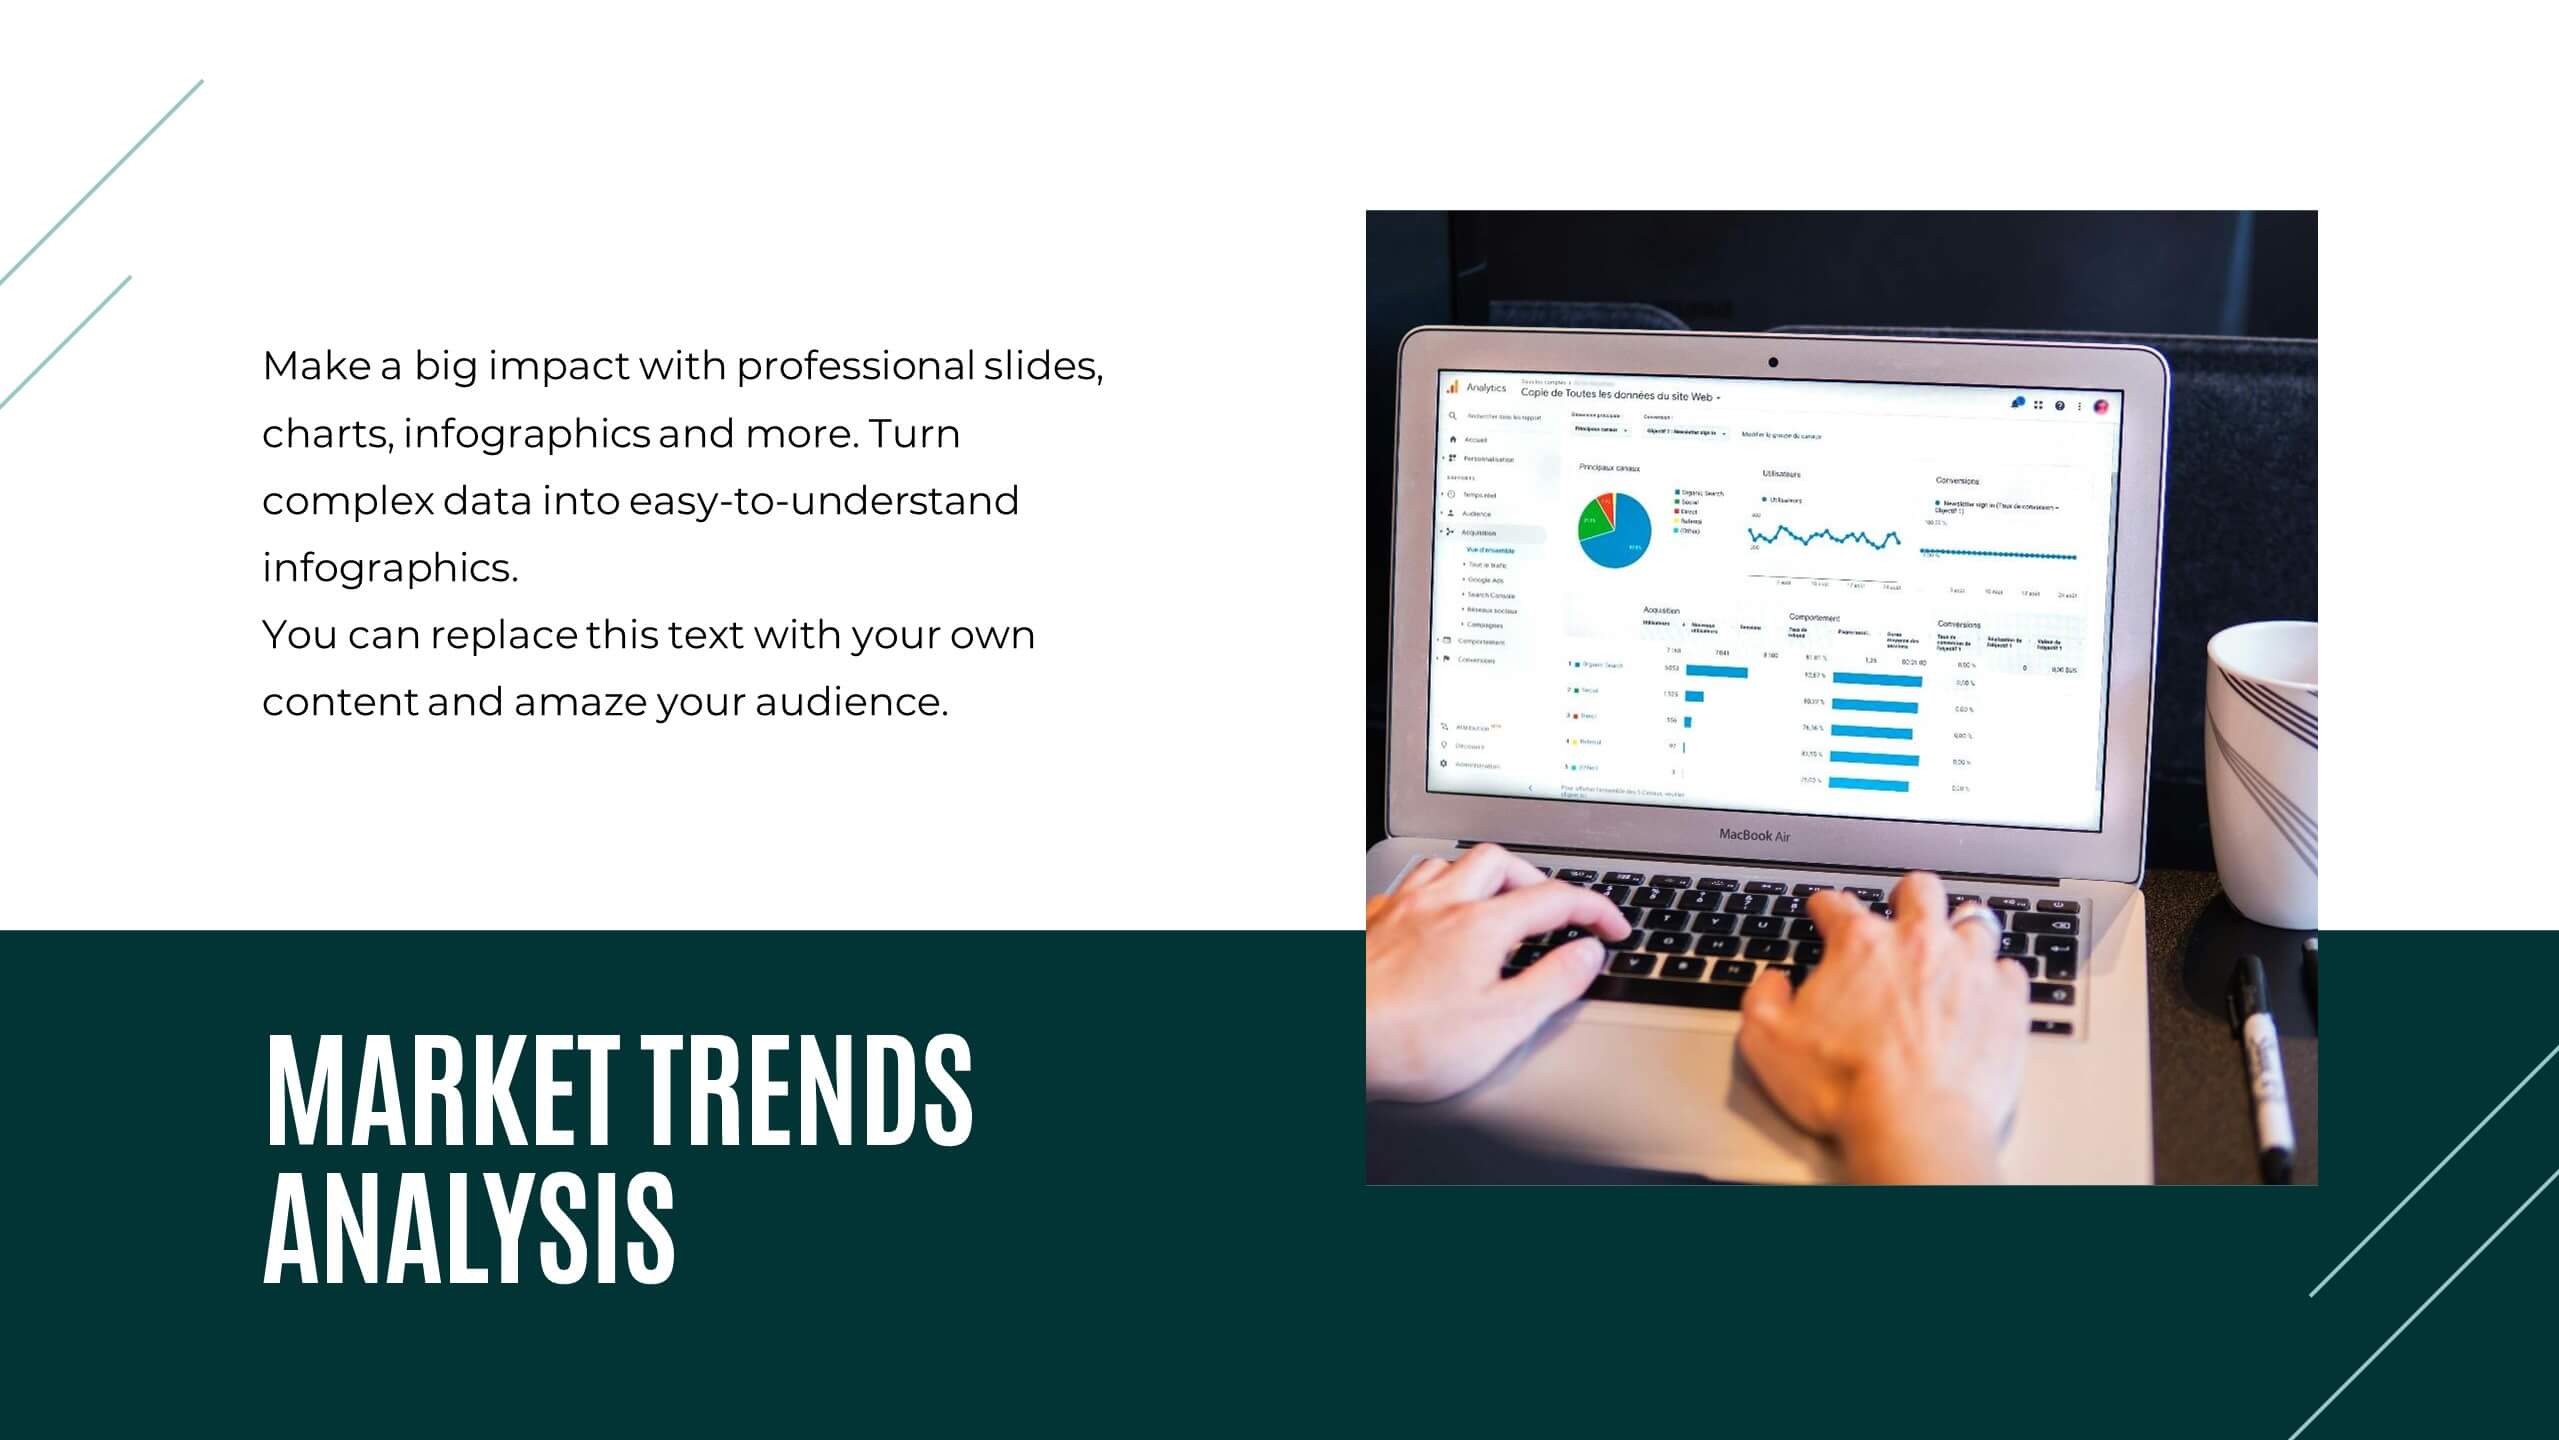
Prism Project Status Report Presentation
Deliver impactful updates with this comprehensive project status report template! Perfect for presenting key highlights, performance metrics, and strategic initiatives. Ideal for project managers aiming to keep stakeholders informed and aligned. Compatible with PowerPoint, Keynote, and Google Slides, this template ensures your reports are clear, professional, and engaging. Keep projects on track!


3 diapositivas
Remote Work Culture and Guidelines Presentation
Bring remote teamwork to life with visuals that speak your culture. This presentation template simplifies how you communicate expectations, structure, and values for virtual teams. Perfect for onboarding, policy updates, or outlining collaboration tools, it’s designed to keep your message clear and consistent. Fully compatible with PowerPoint, Keynote, and Google Slides.


5 diapositivas
Cryptocurrency Market Infographic
Cryptocurrency Infographics can help explain the benefits and risks of investing in cryptocurrency, as well as provide valuable information about different types of crypto and their market trends. You can use this infographic to cover a range of topics related to cryptocurrencies, such as its history, how they work, the different types of crypto, the advantages and disadvantages, and the potential risks and challenges associated with investing. This fully customizable template feature eye catching color schemes along with icons and diagrams to illustrate complex concepts related to cryptocurrencies.


7 diapositivas
Corporate Training Infographic
Enhance your corporate training program with our engaging Infographic, designed to succinctly communicate the key elements of effective employee development. Ideal for HR managers and corporate trainers, this Infographic provides a visual summary of training strategies and success metrics. Our Corporate Training Infographic includes sections on training goals, interactive learning approaches, progress tracking, and feedback collection. It's crafted to facilitate quick comprehension and retention of corporate training concepts, making it a perfect tool for internal communication and team meetings. The customizable layout allows you to highlight specific training outcomes, participant engagement, and the benefits of ongoing professional development. This SEO-friendly Infographic is tailored to attract professionals focused on boosting their team's performance and skills. Implement our Infographic to streamline your training processes and showcase the value of learning and development within your organization.


10 diapositivas
5 Step Business Growth Presentation
The "5 Step Business Growth Presentation" template is designed to clearly depict progressive strategies in business development. Featuring a visually engaging staircase-style layout, this infographic effectively guides viewers through sequential stages, making it perfect for presentations that outline growth phases or strategic processes. Each step is color-coded and provides sufficient space to elaborate on key points, ensuring clarity and emphasis on important data. Ideal for use in business strategy meetings or any setting requiring a structured presentation of development stages, this template is versatile and compatible with various presentation platforms, enhancing the visual appeal and comprehension of your message.


6 diapositivas
Lean Six Sigma Framework Slide Presentation
Bring your audience in with a bold, energetic layout that makes each stage feel clear and engaging. This presentation explains the DMAIC framework in a streamlined way, helping users outline process improvement steps with confidence and clarity. Fully customizable and compatible with PowerPoint, Keynote, and Google Slides.


7 diapositivas
Process Solution Infographic
Streamline intricate workflows with our process solution infographic. Anchored in a pristine white base and infused with varying shades of professional blue, our template elegantly delineates step-by-step solutions and systematic approaches. Decked with meticulous infographics, representative icons, and versatile image placeholders, it transforms complexities into a navigable visual journey. Masterfully curated for Powerpoint, Keynote, or Google Slides. An invaluable asset for process managers, business analysts, strategists, or any organization keen on optimizing workflows. Navigate processes with confidence; let each slide chart the path to optimized solutions.


6 diapositivas
Scrum and Kanban Agile Delivery Presentation
Streamline your Agile processes with this modern Scrum and Kanban workflow slide. Highlight six key stages in your delivery cycle using a sleek, color-coded format with icons. Ideal for project managers, developers, and Agile teams. Fully editable in PowerPoint, Keynote, and Google Slides. Clean, professional layout for maximum clarity.


23 diapositivas
Skycrest Business Idea Pitch Deck Presentation
Present your innovative business idea with this bold pitch deck, featuring sections for problem statement, solution, business model, and financial projections. Ideal for capturing investor attention, this template supports PowerPoint, Keynote, and Google Slides, making it perfect for impactful presentations across multiple platforms.


5 diapositivas
Scrum Team Roles Presentation
A clear, engaging layout brings this presentation to life, making it easy to explain how each role contributes to a productive, collaborative workflow. Designed to simplify complex team structures, it helps you communicate responsibilities with confidence and clarity. Fully compatible with PowerPoint, Keynote, and Google Slides.


7 diapositivas
Human Resources Administration Infographic
Human Resources Administration involves managing and overseeing various aspects of an organization's human capital and related processes. Our HR administration Infographic is your compass in the vast realm of HR, guiding you through essential aspects, best practices, and strategies crucial for successful HR management. This template is your guide to navigating the HR terrain. Compatible with Powerpoint, Keynote, and Google Slides. Discover best practices, strategies, and essential aspects of HR, empowering you to lead with expertise, empathy, and efficiency in the exciting world of human resources.


6 diapositivas
Six-Sided Strategy with Hexagon Infographic Presentation
Present your six-point plan with clarity using the Six-Sided Strategy with Hexagon Infographic Presentation. This geometric layout highlights each core element in a balanced, easy-to-follow format—ideal for frameworks, business models, or strategy steps. Fully customizable in Canva, PowerPoint, Keynote, and Google Slides for seamless integration.


6 diapositivas
5-Step Investment Planning Presentation
Guide your audience through a clear, structured journey with a modern layout that turns each financial step into a simple, visual milestone. This presentation helps you explain goals, outline processes, and communicate actionable insights with ease and clarity. Fully editable and compatible with PowerPoint, Keynote, and Google Slides.


26 diapositivas
Workouts for Every Body Part Presentation
Achieve total-body fitness with this dynamic presentation on targeted workouts for every muscle group. Covering effective exercises, proper form, strength training techniques, and workout plans, this template helps simplify fitness routines for all levels. Fully customizable and compatible with PowerPoint, Keynote, and Google Slides for a seamless and engaging presentation experience.


8 diapositivas
Leadership Training Workshop Presentation
Boost your team's leadership skills with our 'Leadership Training Workshop' template, perfect for structuring dynamic and effective training sessions. Designed to focus on core leadership competencies, this template supports organizations in cultivating influential leaders. It's fully compatible with PowerPoint, Keynote, and Google Slides, facilitating a seamless integration into your training curriculum.


7 diapositivas
Success Iceberg Infographic
Iceberg Infographic are visual guides to understanding the world of business. Ideal for anyone who wants to understand the basics of business, from what it is and how it works to why it matters. This template is easy to read, and can be used for everything from data visualization to teaching people how to use a new product. Give your audience a look at the most important parts of your business. The template is easy to use, and allows you to highlight your data. Fully customizable and compatible with Powerpoint, Keynote, and Google Slides. There are multiple color themes, fonts, and shapes to choose from, and endless combinations to make it truly yours.