


Características


¿Tienes alguna pregunta?
Recomendar


5 diapositivas
Industry Competition Assessment with Porter’s Forces Presentation
Present your competitive landscape with this Porter’s Five Forces slide. Designed for strategic analysis, it visually maps key industry forces—New Entrants, Supplier Power, Buyer Power, Substitutes, and Competitive Rivalry—around a central business icon. Fully customizable and ideal for PowerPoint, Keynote, or Google Slides to elevate professional presentations.


4 diapositivas
Funding and Investment Project Proposal Presentation
Unlock the potential of your next big venture with this vibrant and organized infographic presentation template! Perfect for outlining key stages from research to returns, this template makes complex investment strategies accessible and engaging. Tailor each segment to fit your project's unique needs. Compatible with PowerPoint, Keynote, and Google Slides, it's ideal for professionals looking to impress stakeholders and secure funding.


6 diapositivas
Business Security Compliance Presentation
Visualize your security framework with this clear and modern infographic layout. This slide is ideal for presenting compliance steps, risk assessments, or regulatory requirements, featuring a shield-centered hub with 5 editable sections. Customize easily in PowerPoint, Keynote, or Google Slides.


6 diapositivas
Brain Vector Infographic
This Brain Vector Infographic is an imaginative tool for presenting complex concepts and ideas in an easy-to-digest visual format. The design employs brain imagery to symbolize various aspects of thought processes, intelligence, brainstorming, or mental health. Its sections are strategically placed to reflect different cognitive areas, making it perfect for educational settings or business workshops focused on innovation. Fully editable and compatible with PowerPoint, Google Slides, and Keynote, this template allows for full customization, from colors to text, adapting to your unique presentation needs. Whether for academic, or personal use, this infographic simplifies conveying intricate information.


7 diapositivas
Relationship Polices Infographic
Navigate the intricacies of interpersonal dynamics with our relationship policies infographic. Adorned in the purity of white, complemented by shades of understanding blue and harmonious green, this template elucidates the principles and boundaries that shape healthy relationships. Detailed with relevant infographics, symbolic icons, and illustrative image placeholders, it provides a visual roadmap to successful connections and interactions. Impeccably designed for Powerpoint, Keynote, or Google Slides. An essential tool for HR professionals, relationship counselors, team leaders, or any organization emphasizing healthy interpersonal dynamics. Foster connections; let each slide guide the way to relationship excellence.


5 diapositivas
Customer Loyalty Program Strategy
Design a winning rewards system with this engaging loyalty program infographic. Featuring a vertical layout with five customizable stages alongside a gift icon, this slide is perfect for outlining incentives, customer tiers, or retention plans. Fully editable in PowerPoint, Keynote, and Google Slides.


4 diapositivas
Virtual Collaboration and WFH Tools Presentation
Supercharge your workflow with a clean visual that brings your digital workspace to life! This presentation template focuses on streamlining communication and productivity through key virtual collaboration tools and remote work essentials. It’s perfect for outlining platforms, strategies, or tools that boost efficiency. Fully compatible with PowerPoint, Keynote, and Google Slides.


21 diapositivas
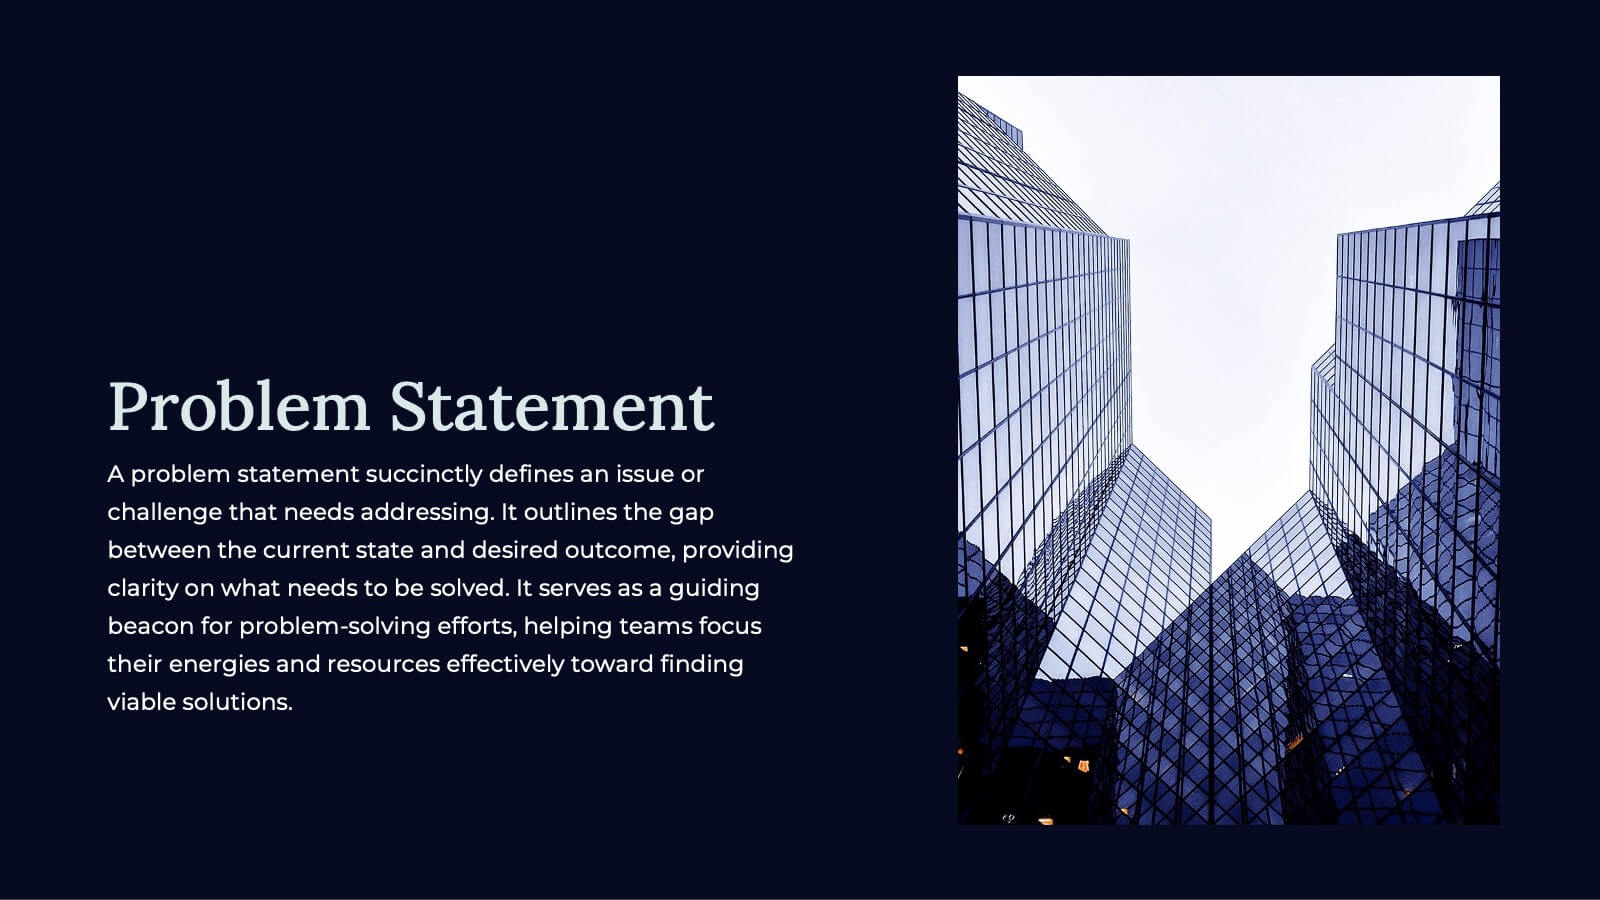
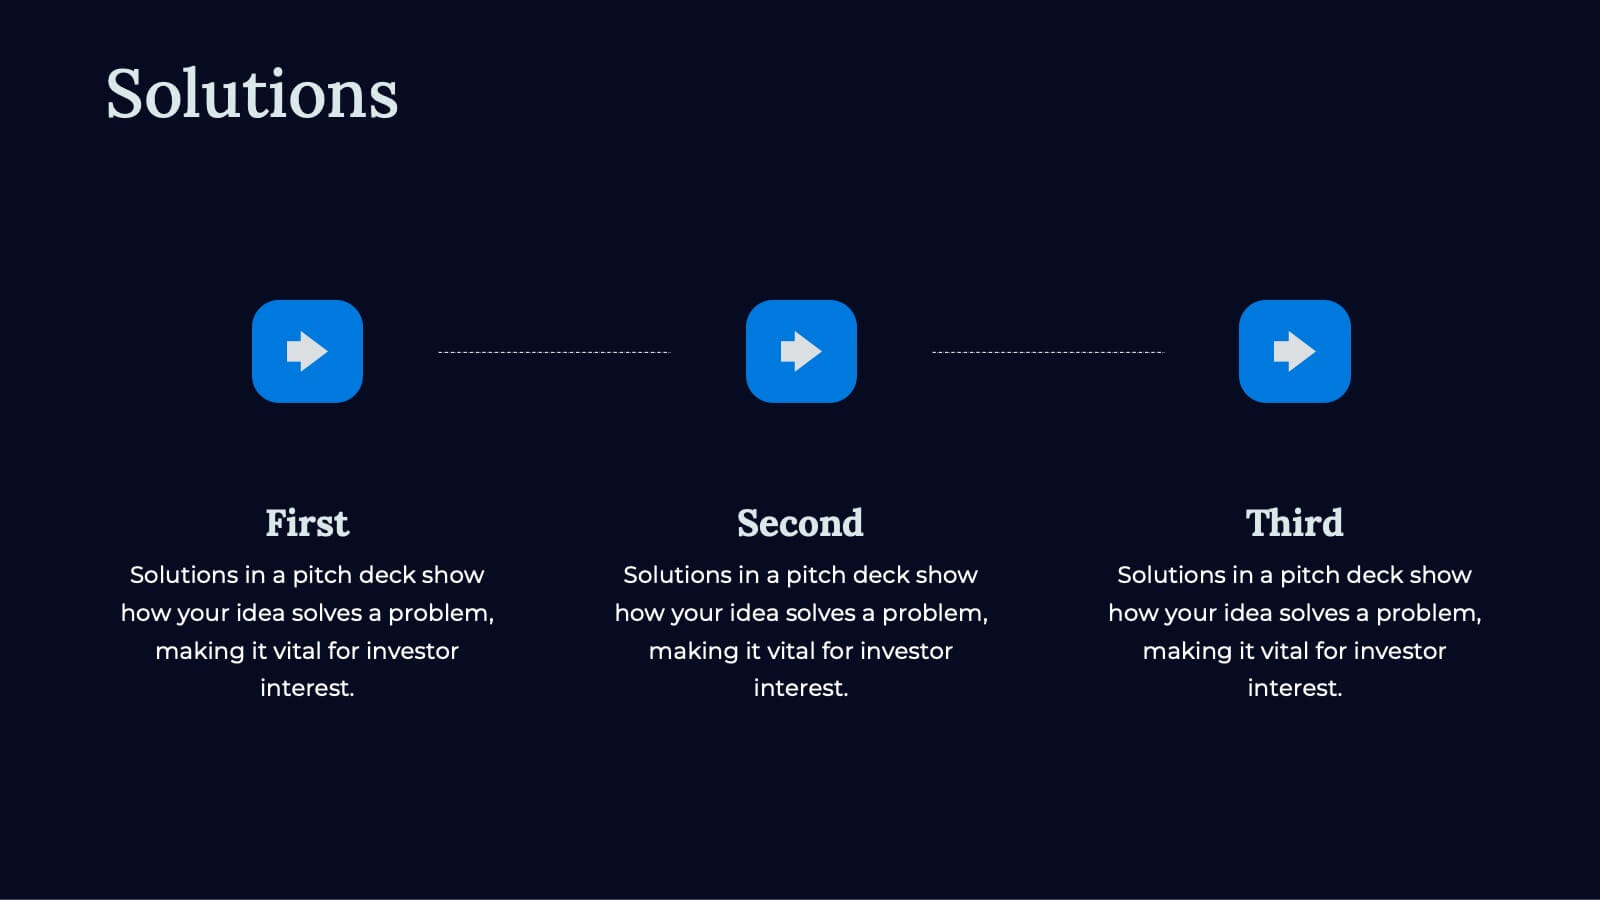
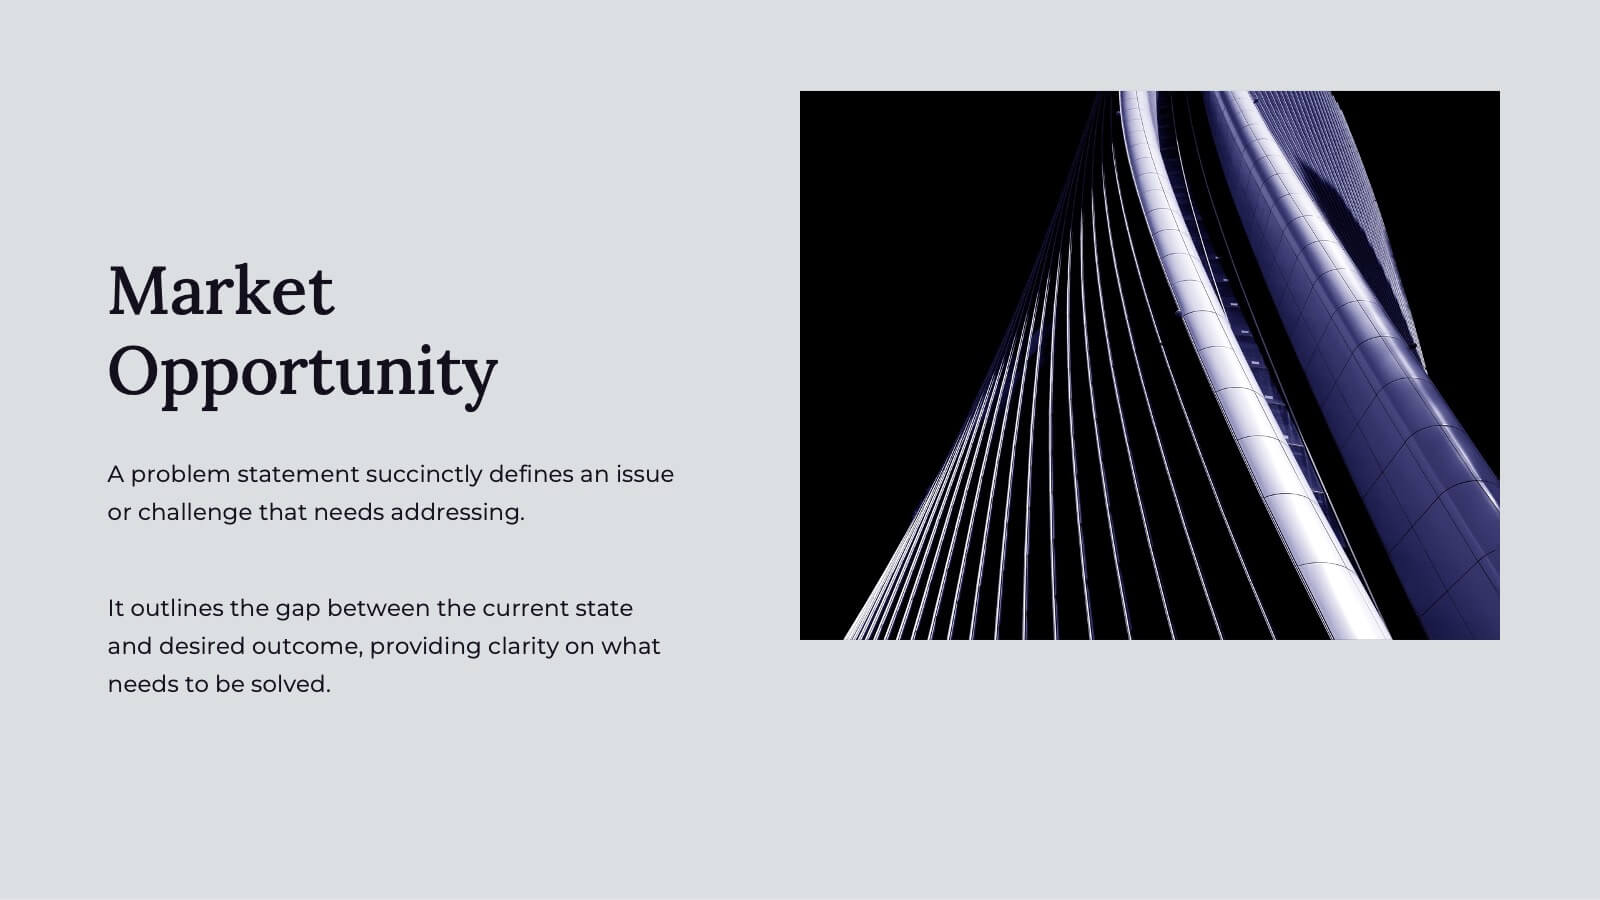
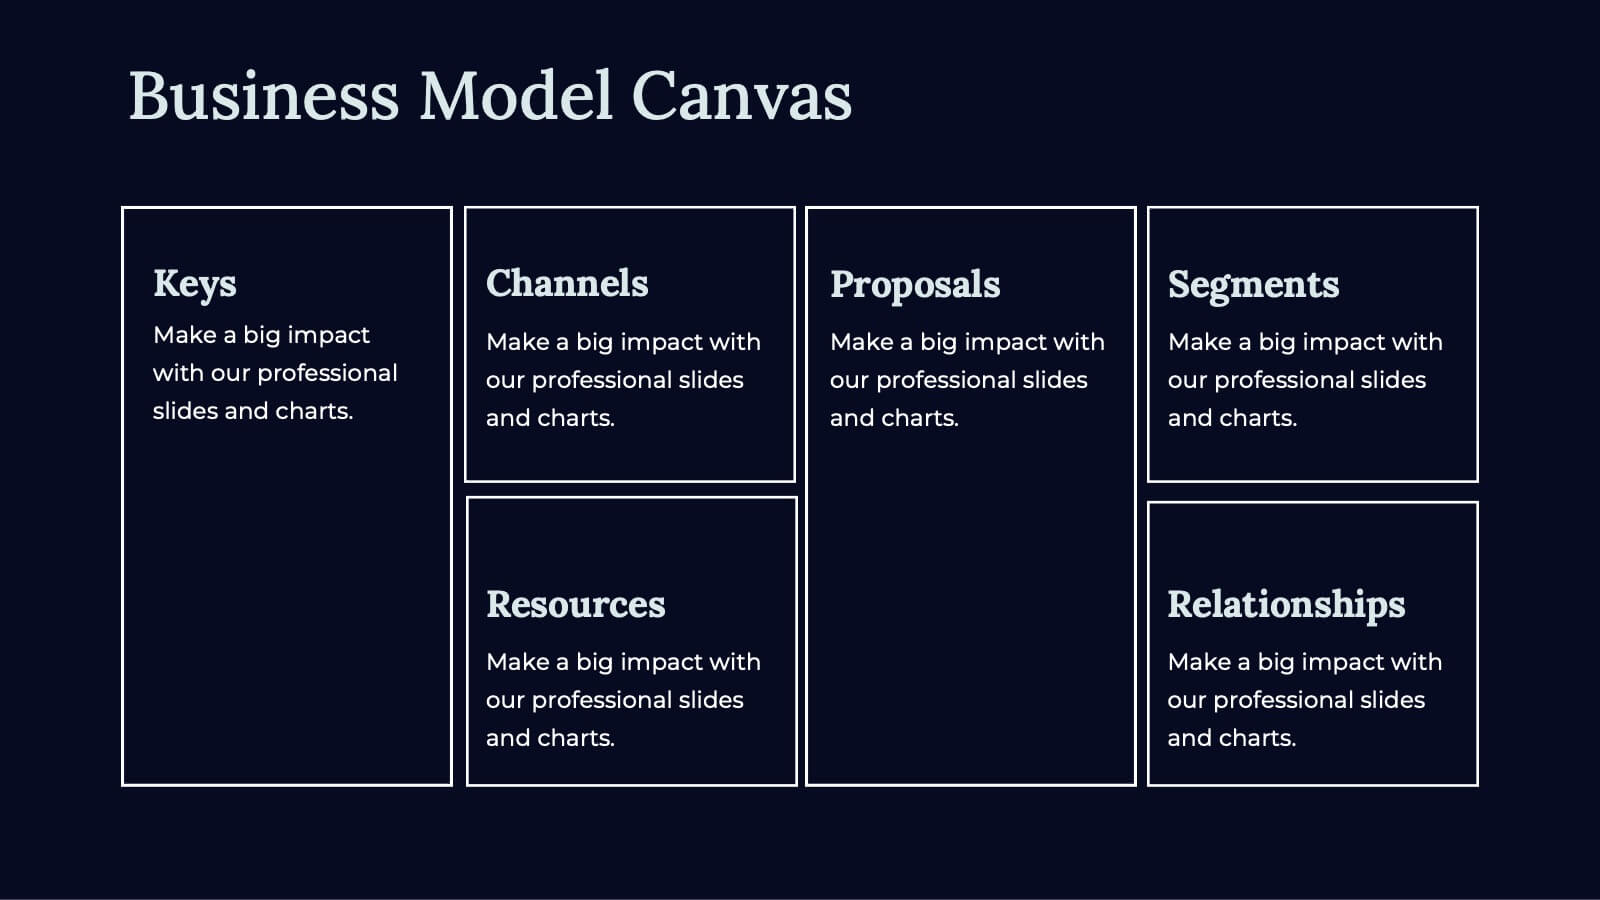
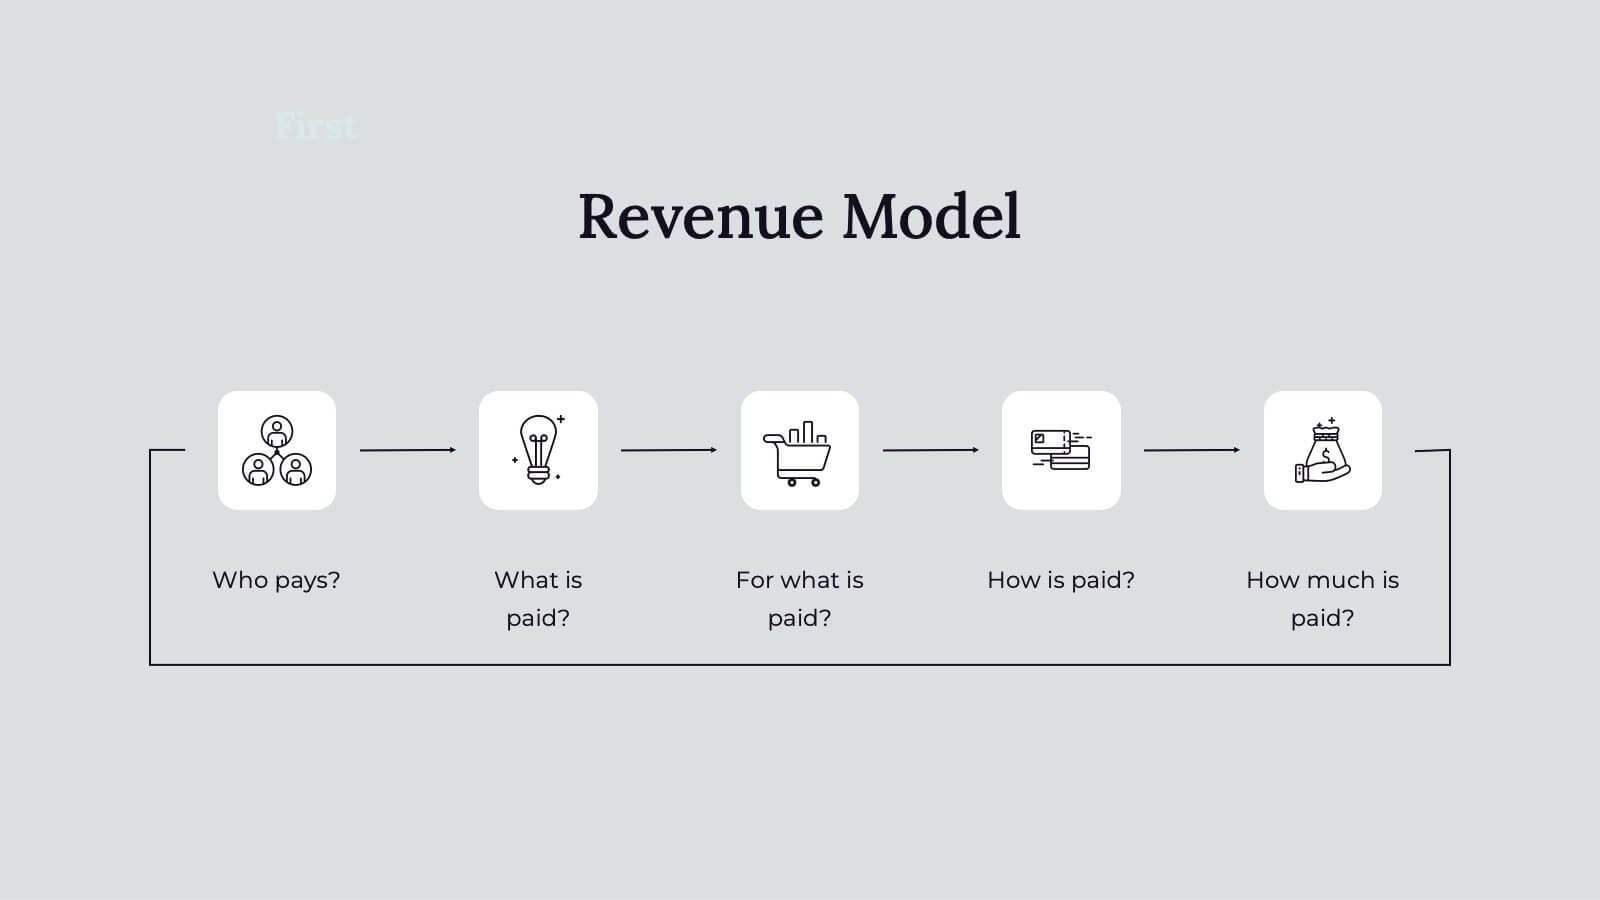
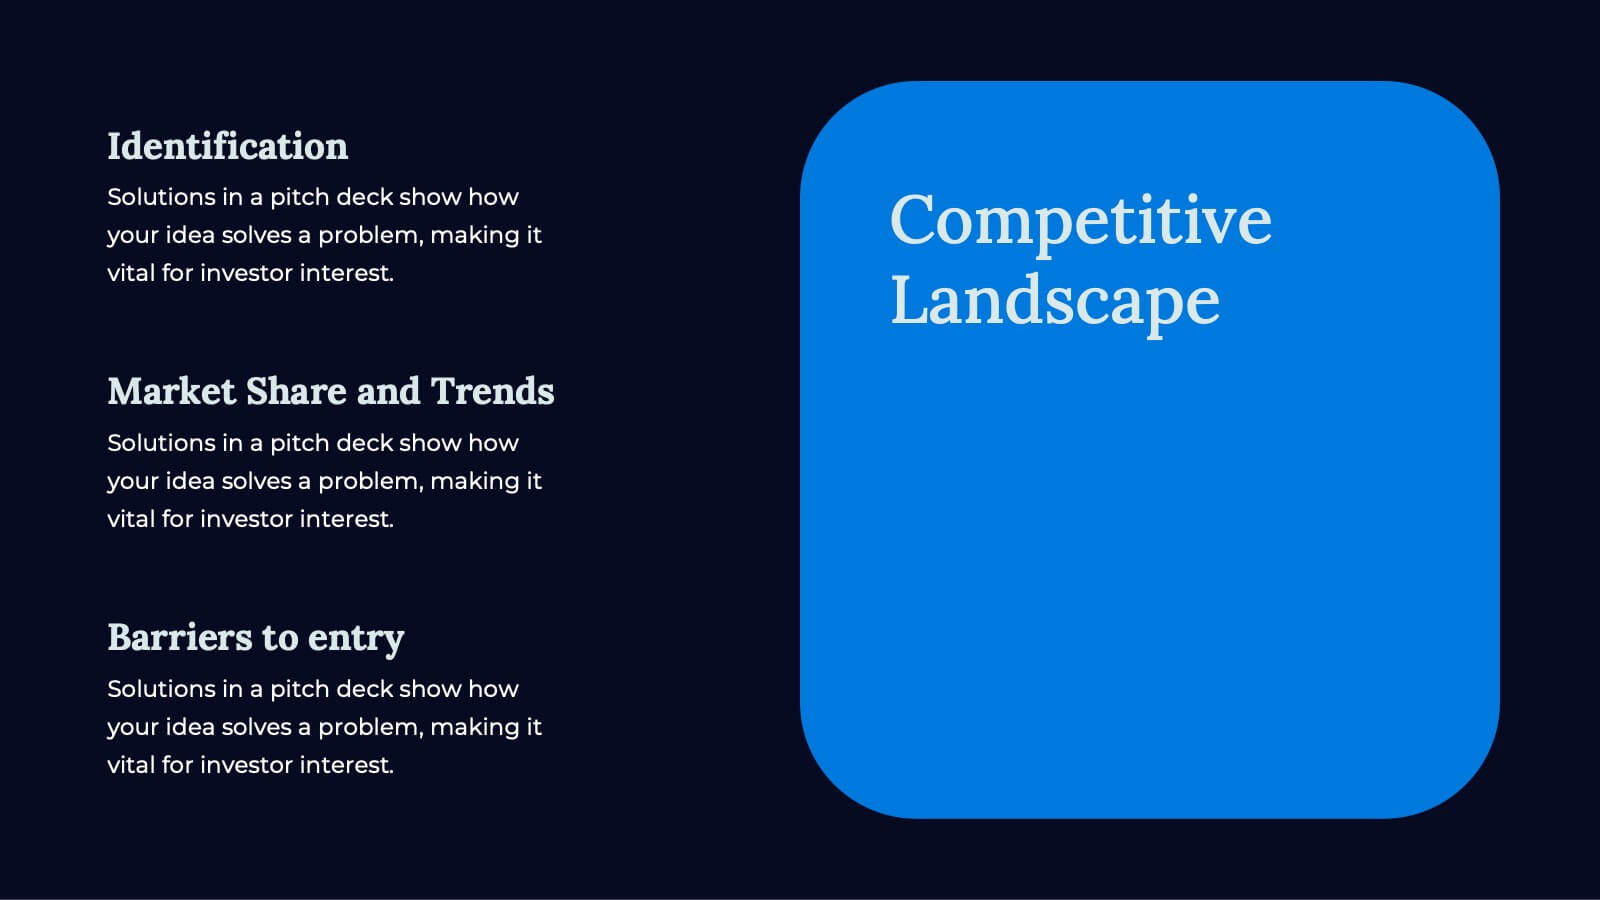
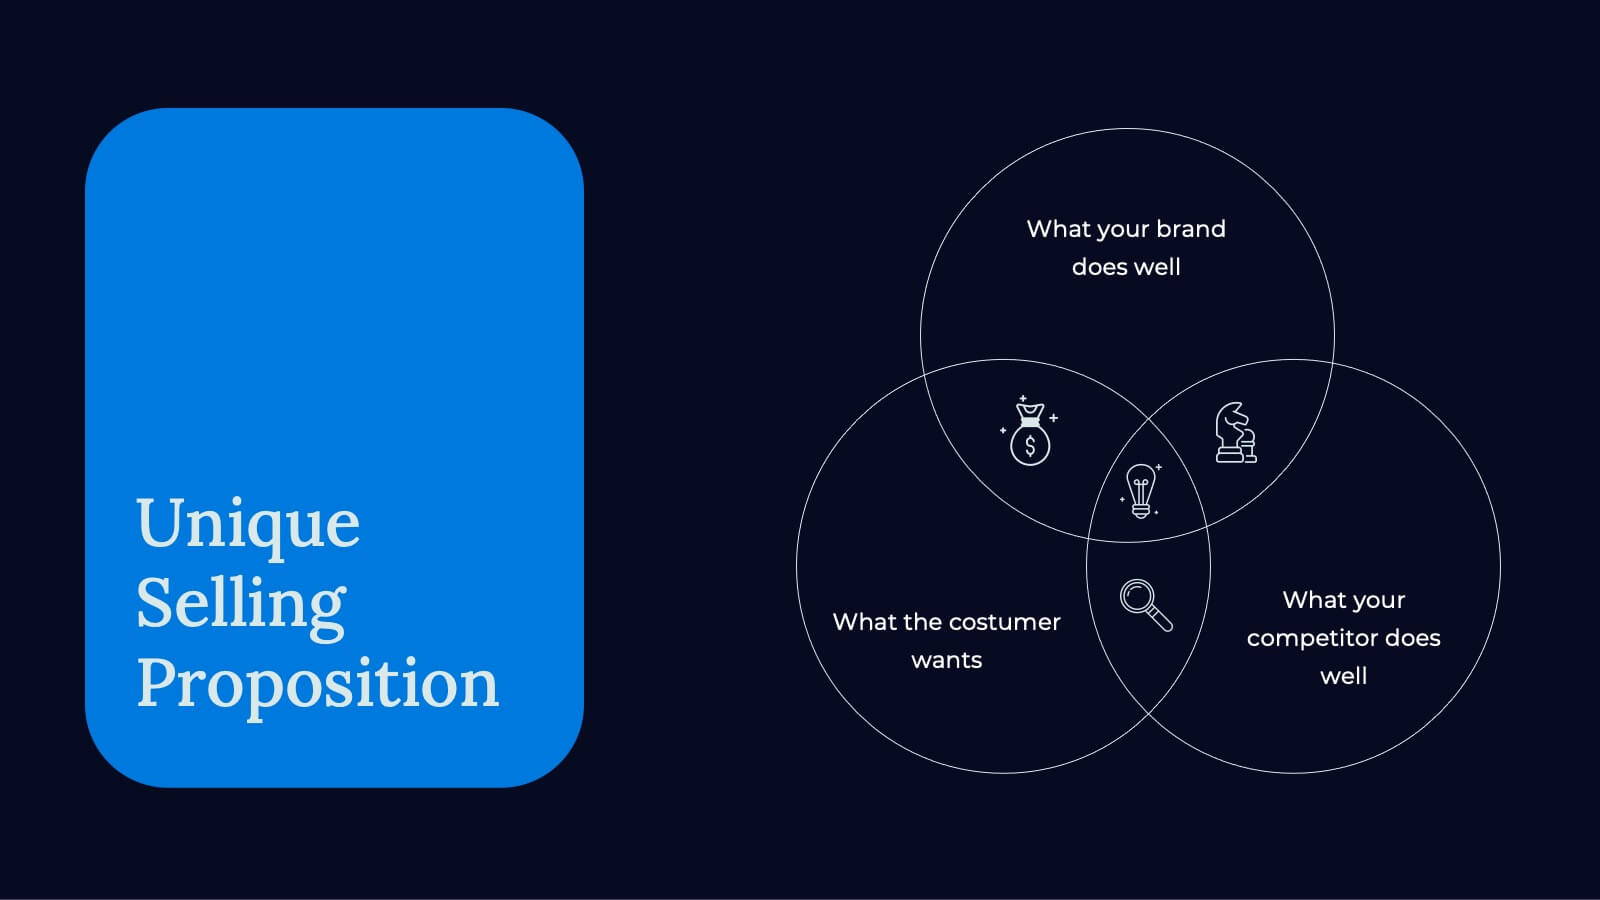
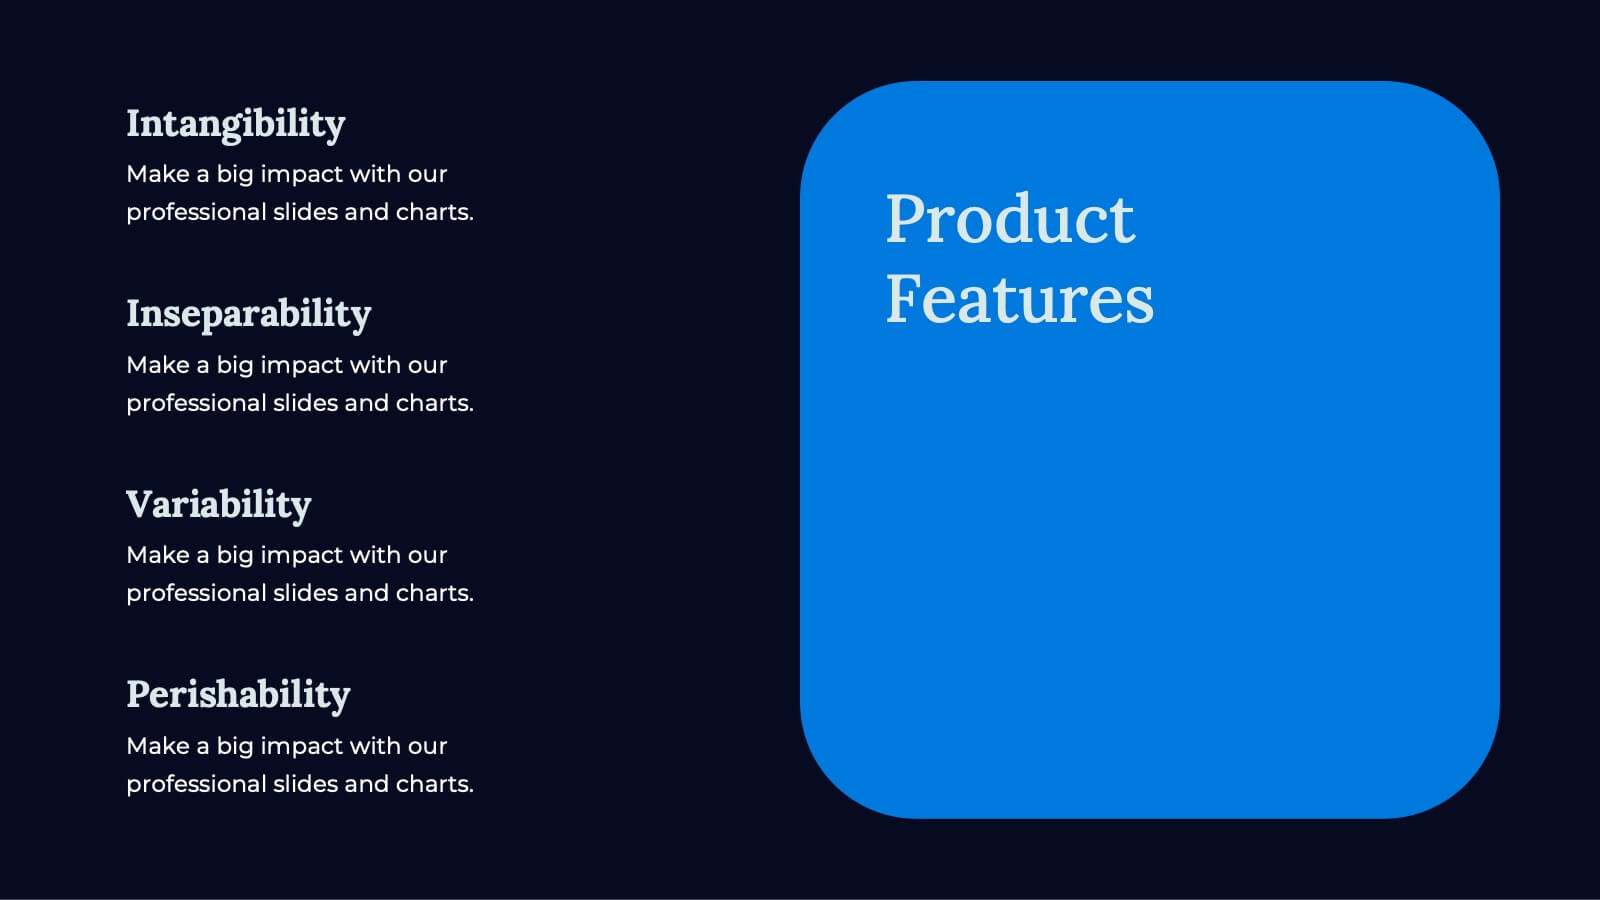
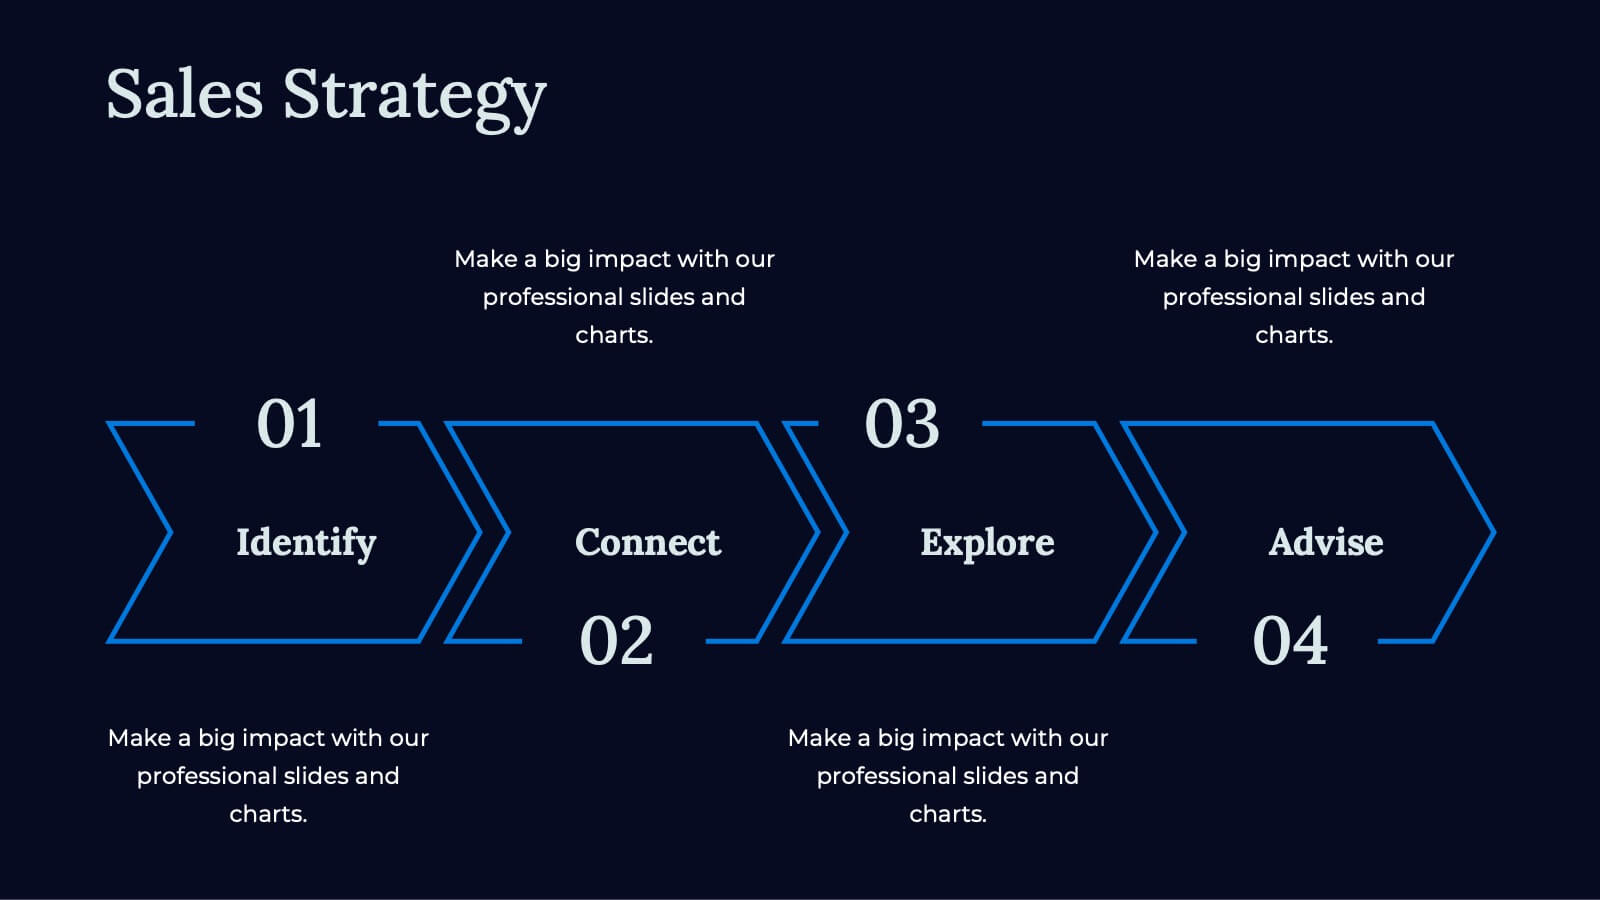
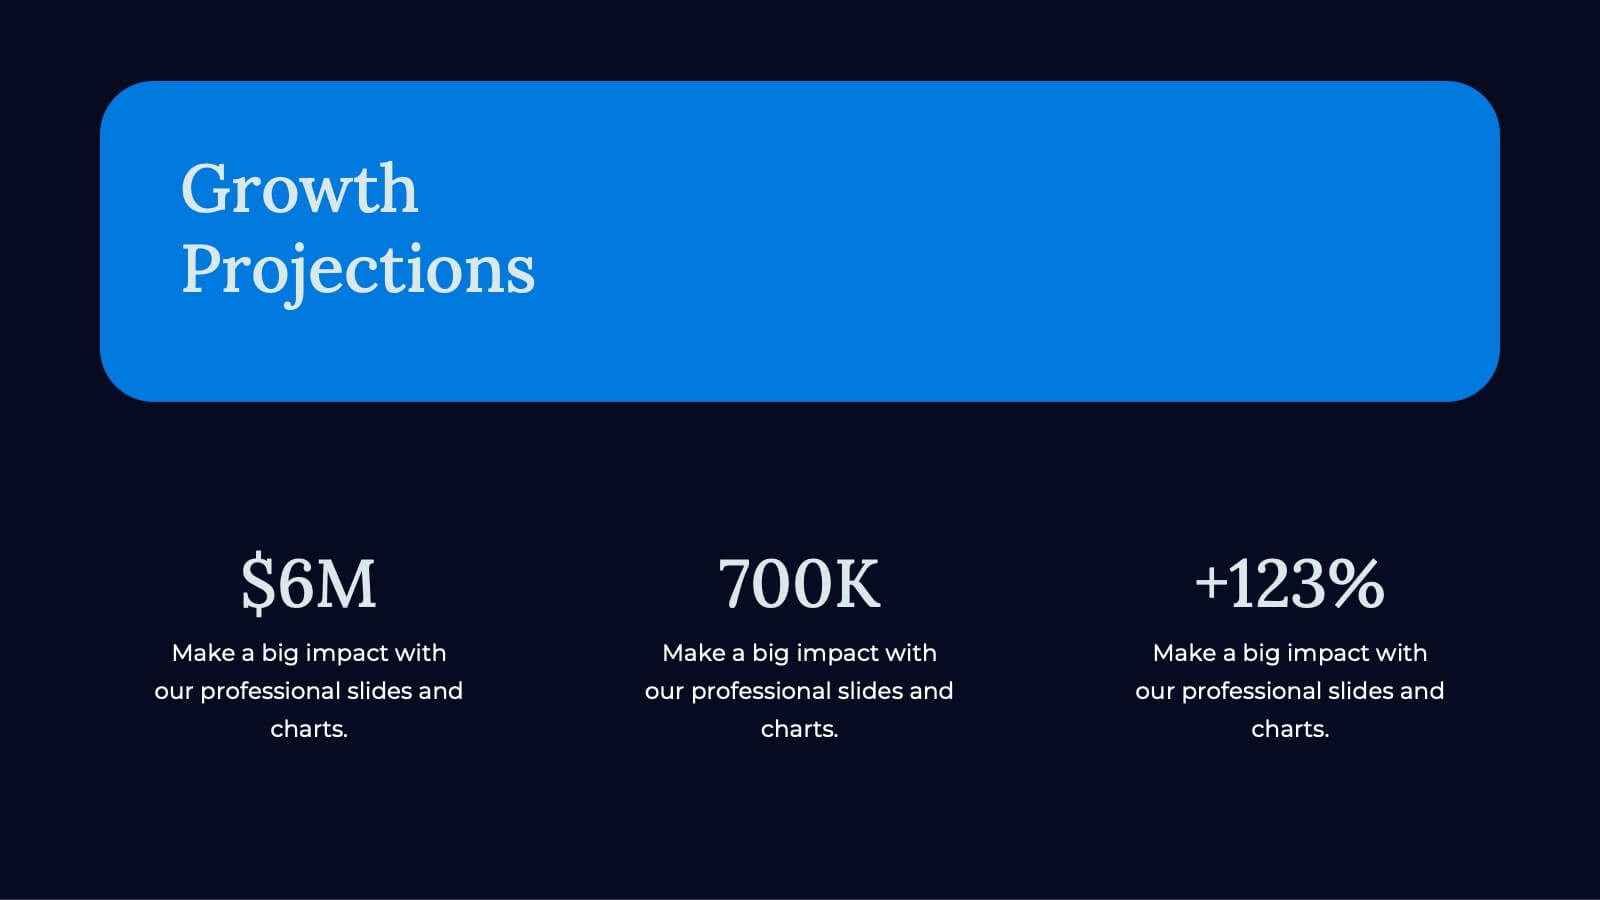
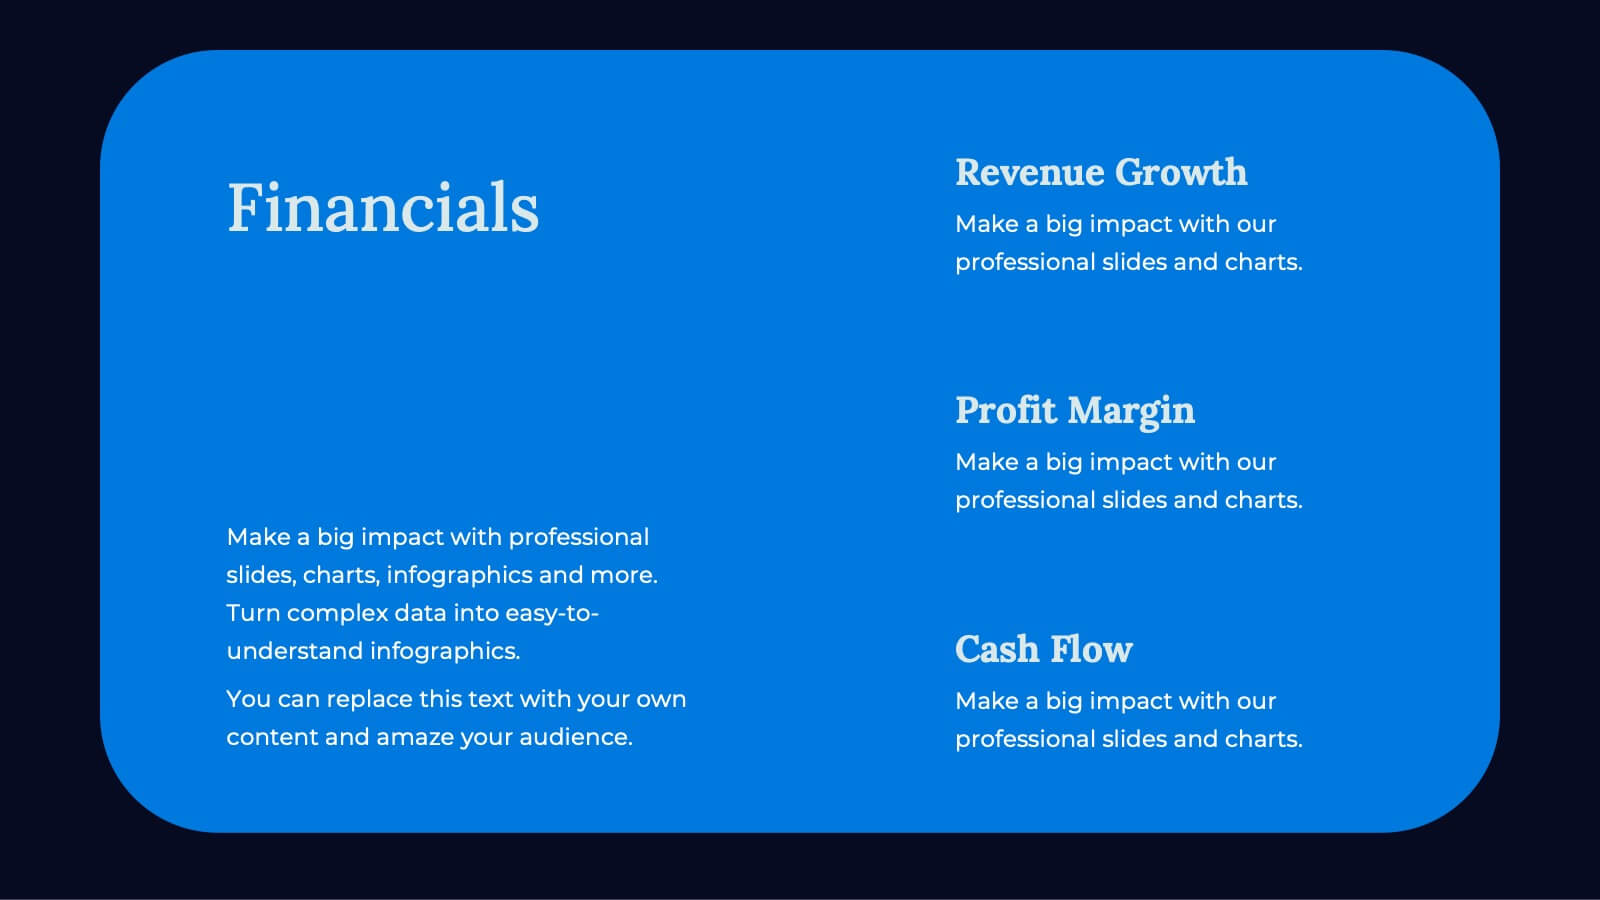
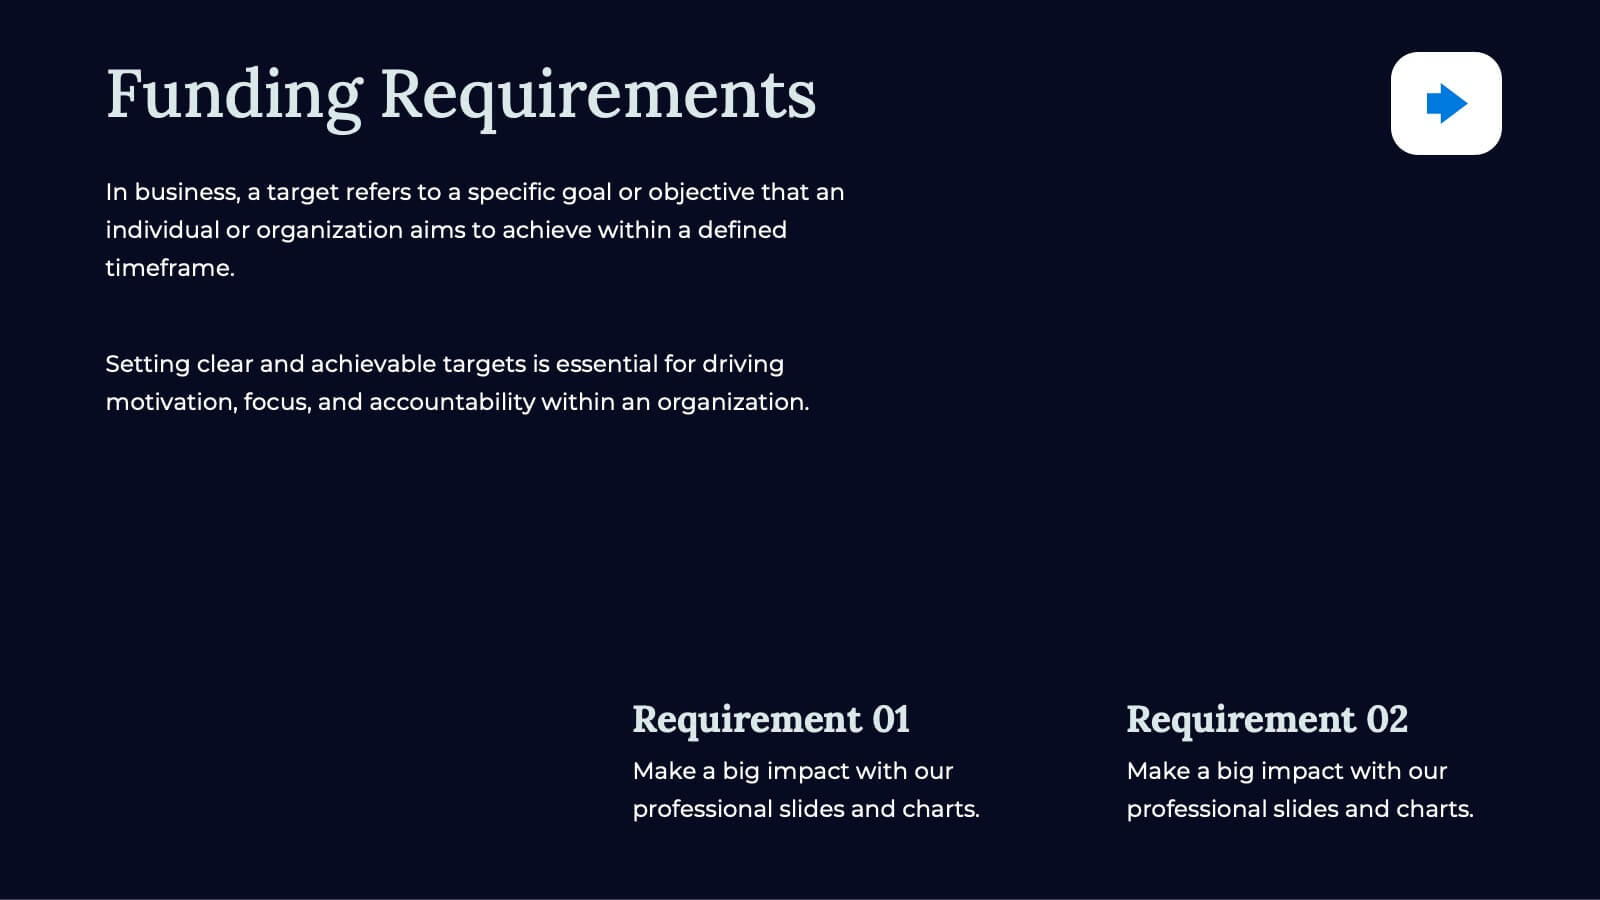
Apex Business Idea Pitch Deck Presentation
Craft powerful business pitch decks with this sleek template. Present your company overview, problem statement, solutions, and market opportunity. Showcase your business model, revenue model, competitive landscape, and unique selling proposition. Perfect for highlighting financials, growth projections, and funding requirements. Compatible with PowerPoint, Keynote, and Google Slides. Impress investors and stakeholders with clear, concise, and visually appealing presentations.


6 diapositivas
Project Timeline Calendar Presentation
Kick your planning into high gear with a clean, colorful layout that makes tracking progress feel effortless. This presentation helps you map tasks across the week, visualize timelines, and communicate project schedules with absolute clarity. It’s fully editable and works seamlessly in PowerPoint, Keynote, and Google Slides.


7 diapositivas
Product Life Cycle Model Infographic
Navigate the evolution of any product with our vibrant product life cycle model infographic. Utilizing a vivid color palette of purple, blue, green, and pink, this design masterfully illustrates each phase of a product's journey, from inception to decline. Ideal for marketers, product managers, and business educators, this infographic serves as a visual guide to understand and optimize a product's life span. With its sleek design, it can effortlessly engage audiences in presentations and discussions. And with seamless compatibility across PowerPoint, Keynote, and Google Slides, presenting this dynamic process is both effortless and impactful.


5 diapositivas
Insurance Policy Structure Presentation
Add a touch of creativity to your financial reports with this clean and modern presentation design. Perfect for explaining coverage breakdowns, risk management strategies, or policy frameworks, it simplifies complex ideas through visuals. Fully editable and compatible with PowerPoint, Keynote, and Google Slides for a seamless presentation experience.


5 diapositivas
Project Efficiency with RAPID Matrix Presentation
Clarify project responsibilities with the Project Efficiency with RAPID Matrix Presentation. This visually engaging layout highlights each role in the RAPID framework—Recommend, Agree, Perform, Input, Decide—making team alignment fast and effective. Perfect for decision-making workflows and execution plans. Fully editable in PowerPoint, Google Slides, Keynote, and Canva.


6 diapositivas
KPI Metric Infographic
KPI stands for Key Performance Indicator, and it is a measurable value that helps organizations track their progress and performance towards achieving specific business goals and objectives. This infographic template is designed to display key performance indicators and metrics in a concise and easy-to-understand manner. KPIs are quantifiable measurements used to evaluate the success of an organization, project, or specific business activities. The infographic provides a visual representation of these KPIs, making it easier for stakeholders and decision-makers to interpret the data and track progress.


6 diapositivas
1-Page Executive Summary Slide Presentation
Bring clarity to complex updates in a single, colorful layout designed to keep your audience engaged from start to finish. This clean and modern slide breaks down key messages into six distinct points, making it easy to showcase progress, milestones, or strategies. Fully compatible with PowerPoint, Keynote, and Google Slides.


3 diapositivas
Ishikawa Diagram Template Presentation
Bring clarity to complex challenges with a clean, structured visual that helps teams trace issues back to their true causes. This presentation outlines key factors, organizes insights, and supports decision-making with an intuitive, step-by-step layout. Ideal for problem-solving sessions and strategy workshops. Fully compatible with PowerPoint, Keynote, and Google Slides.


21 diapositivas
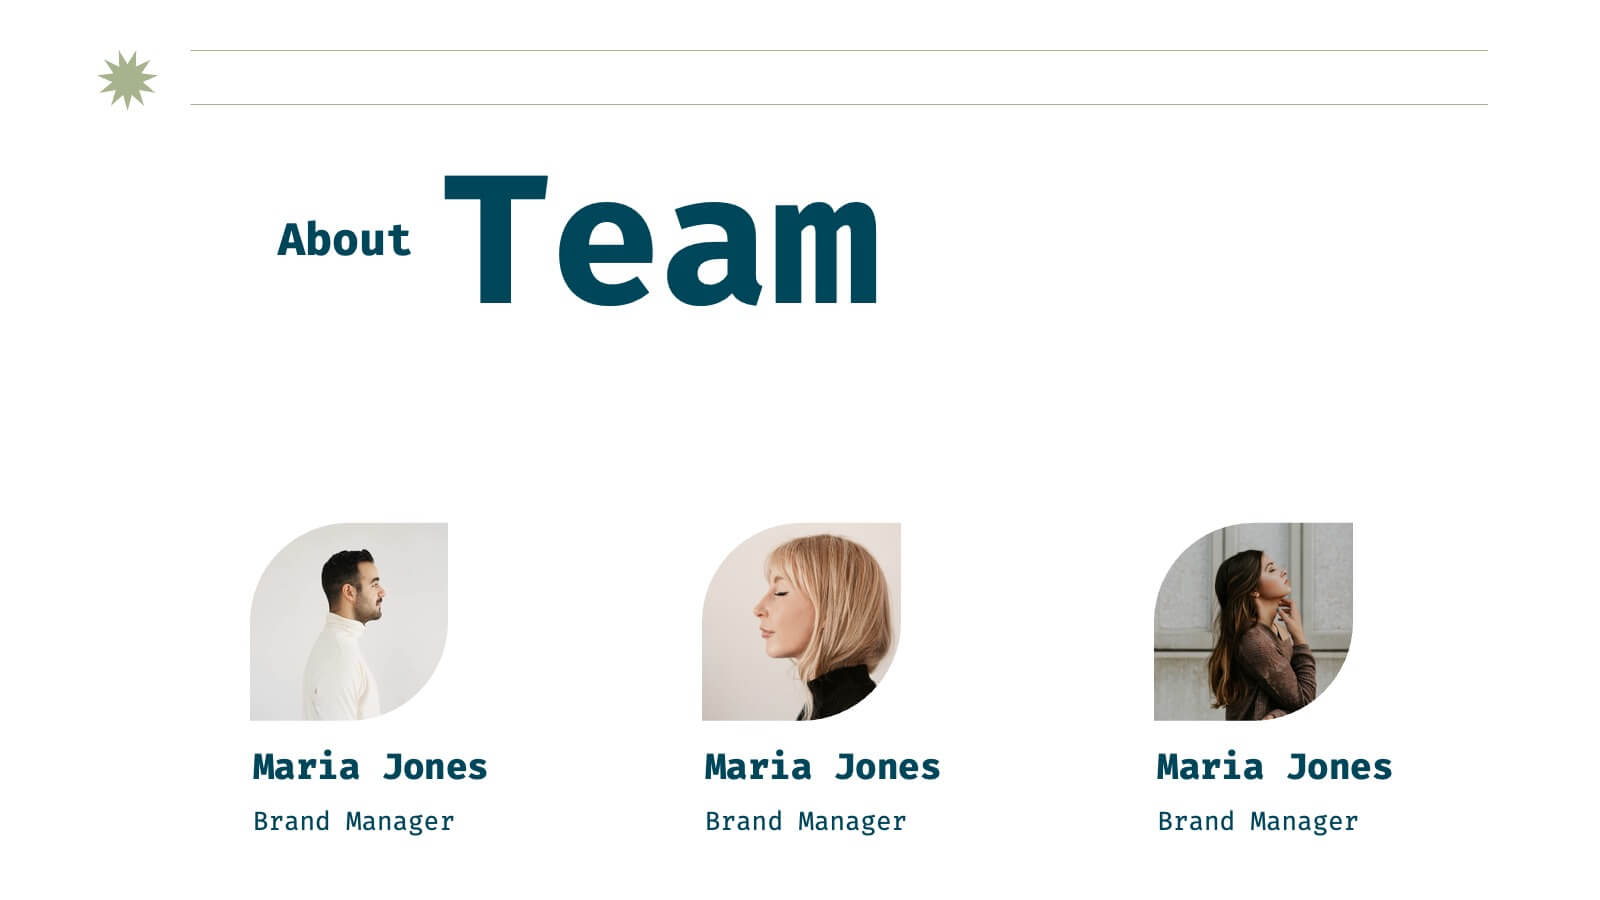
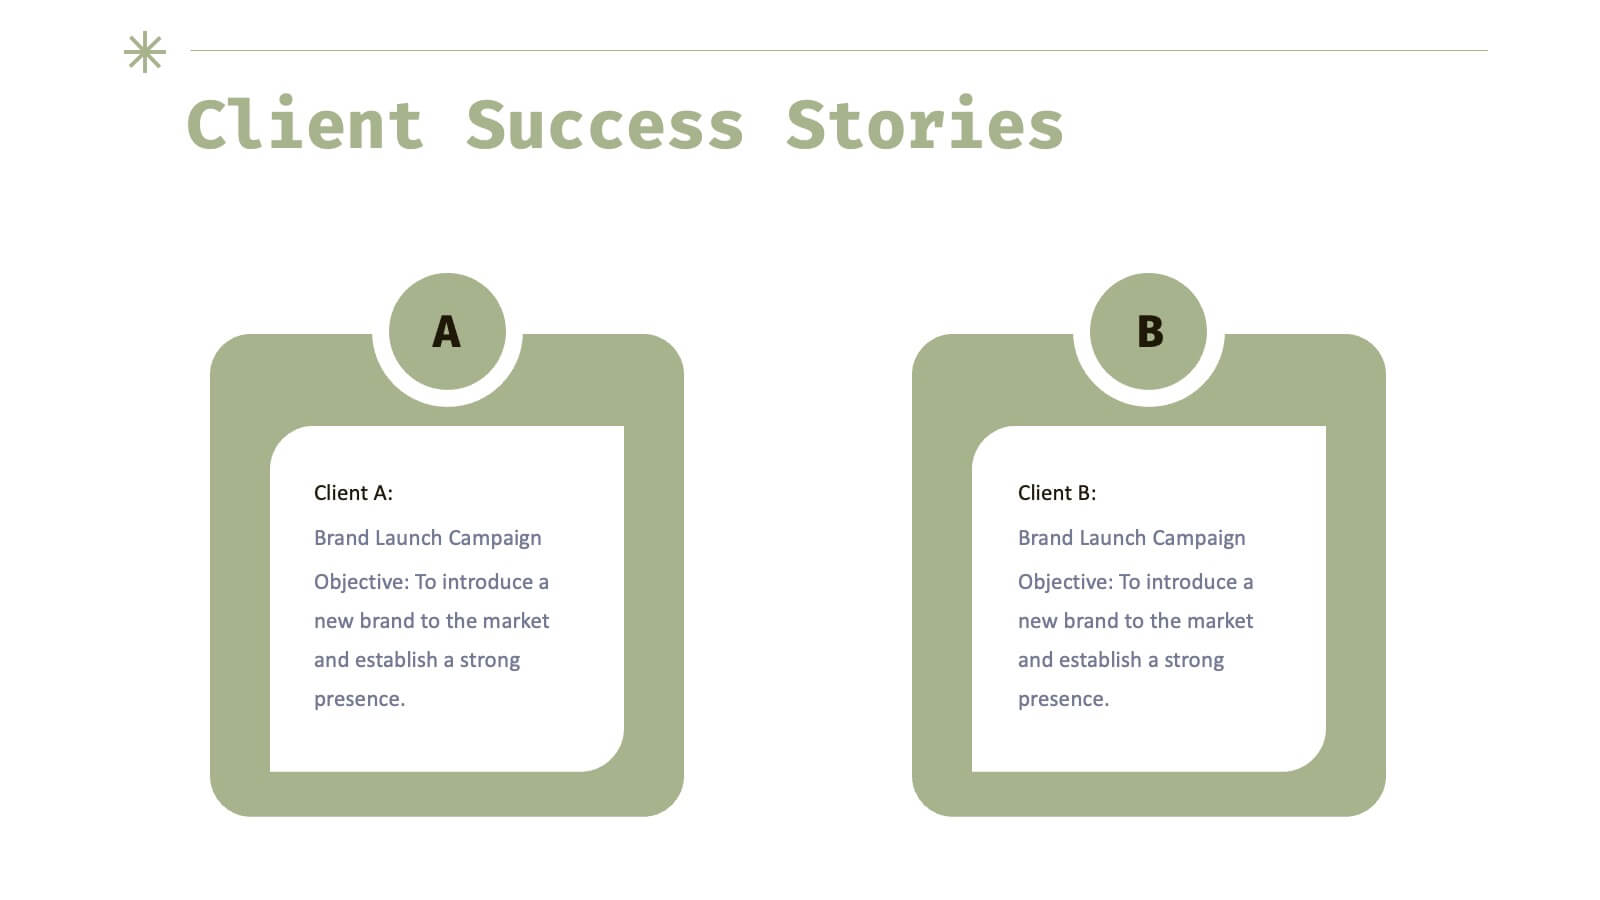
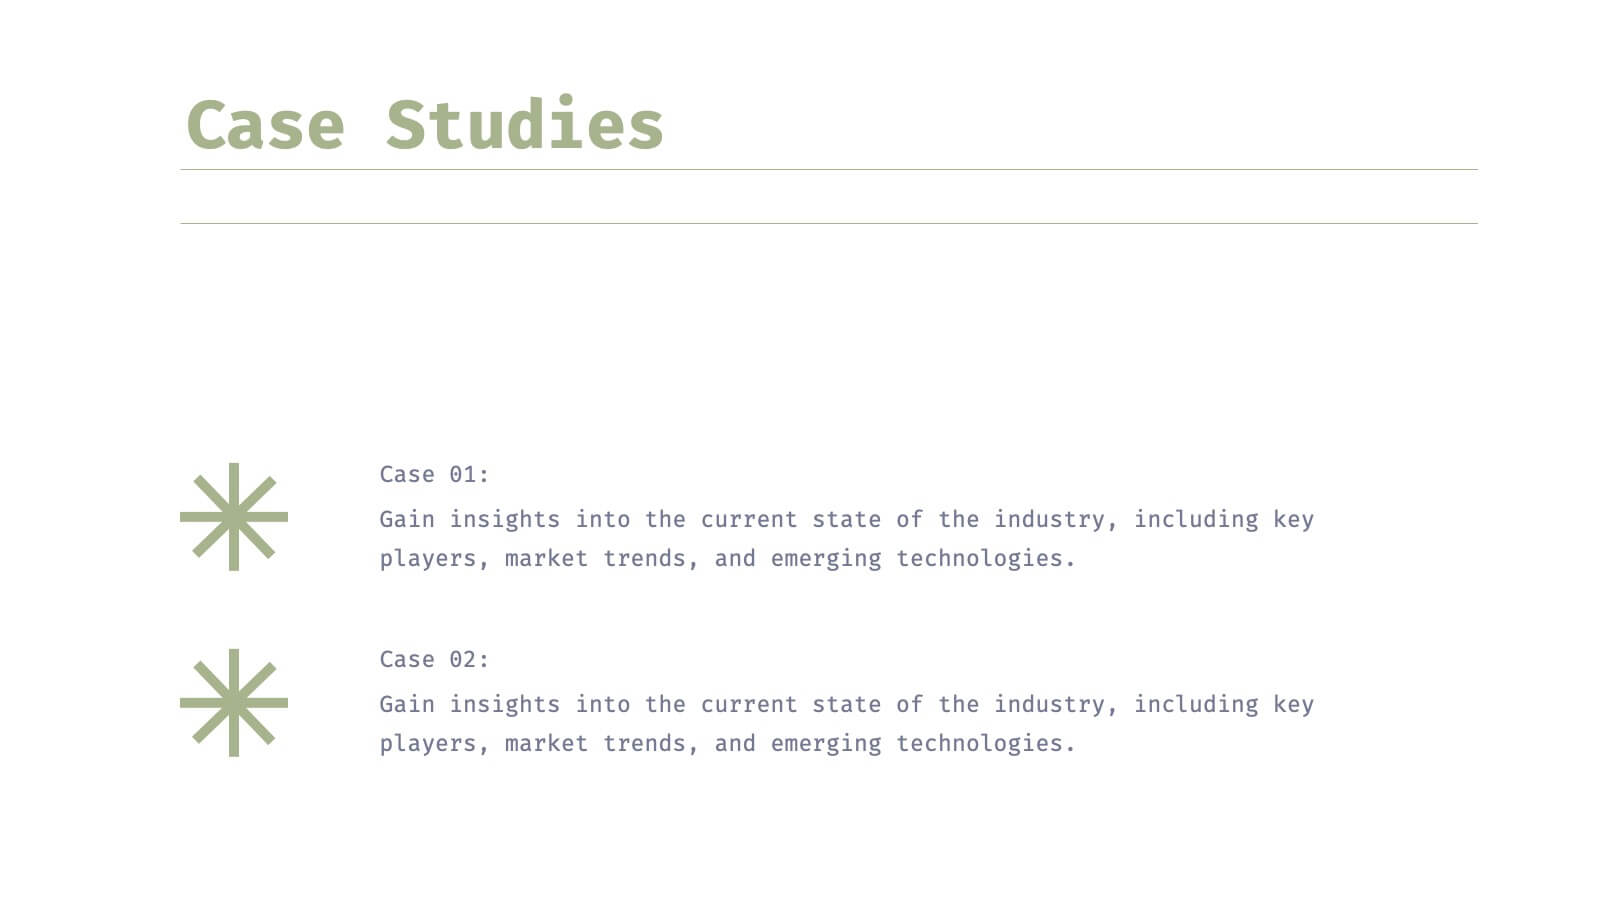
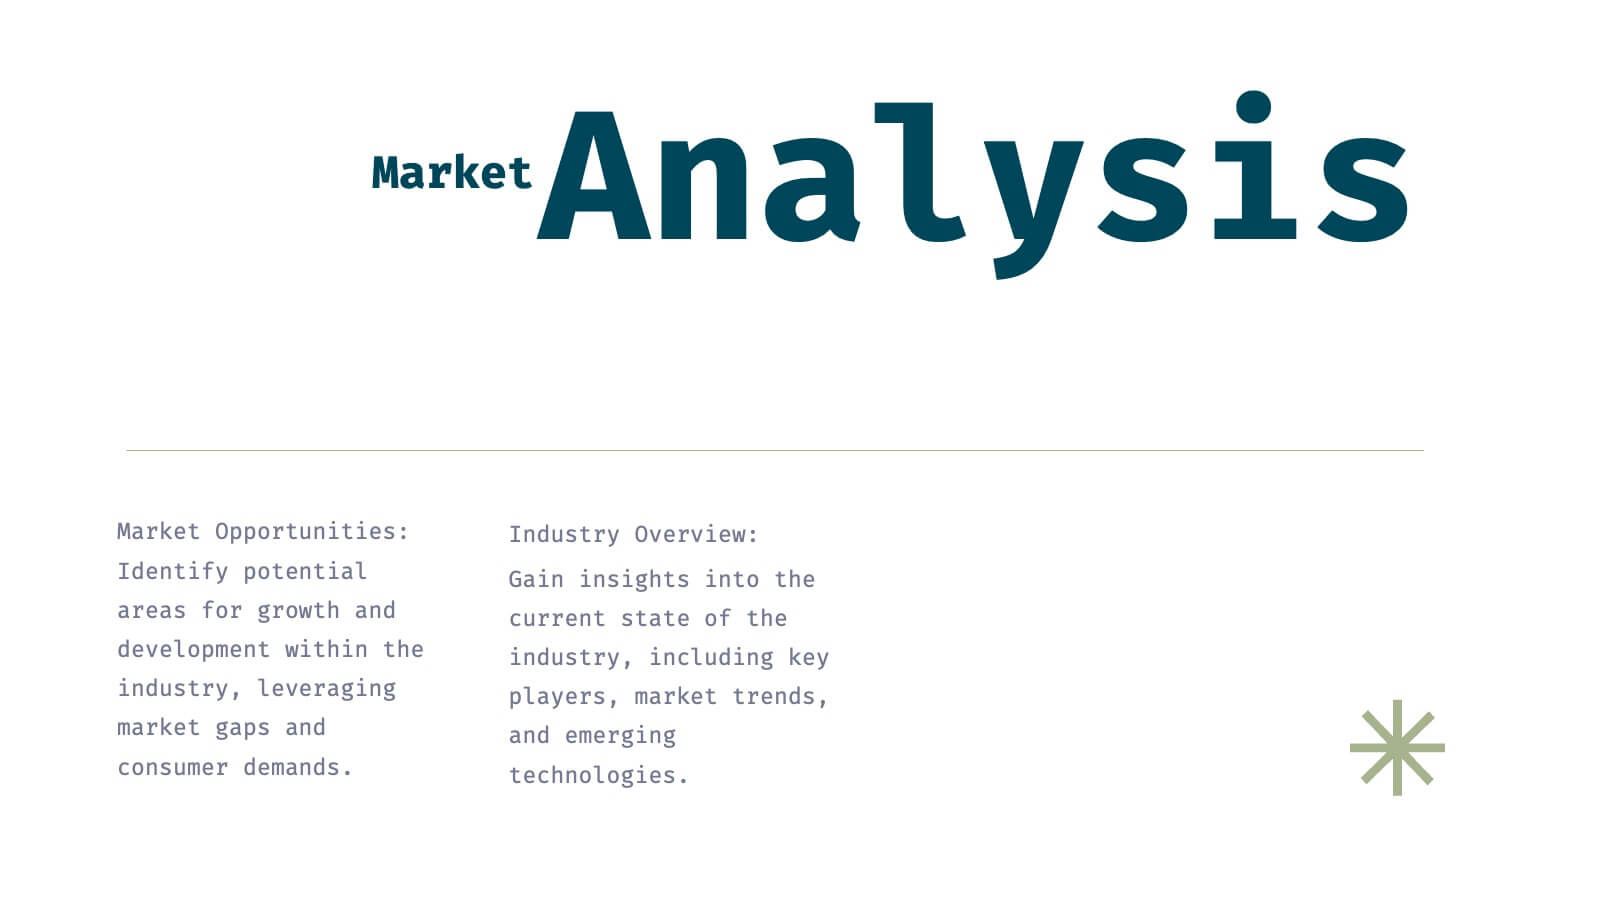
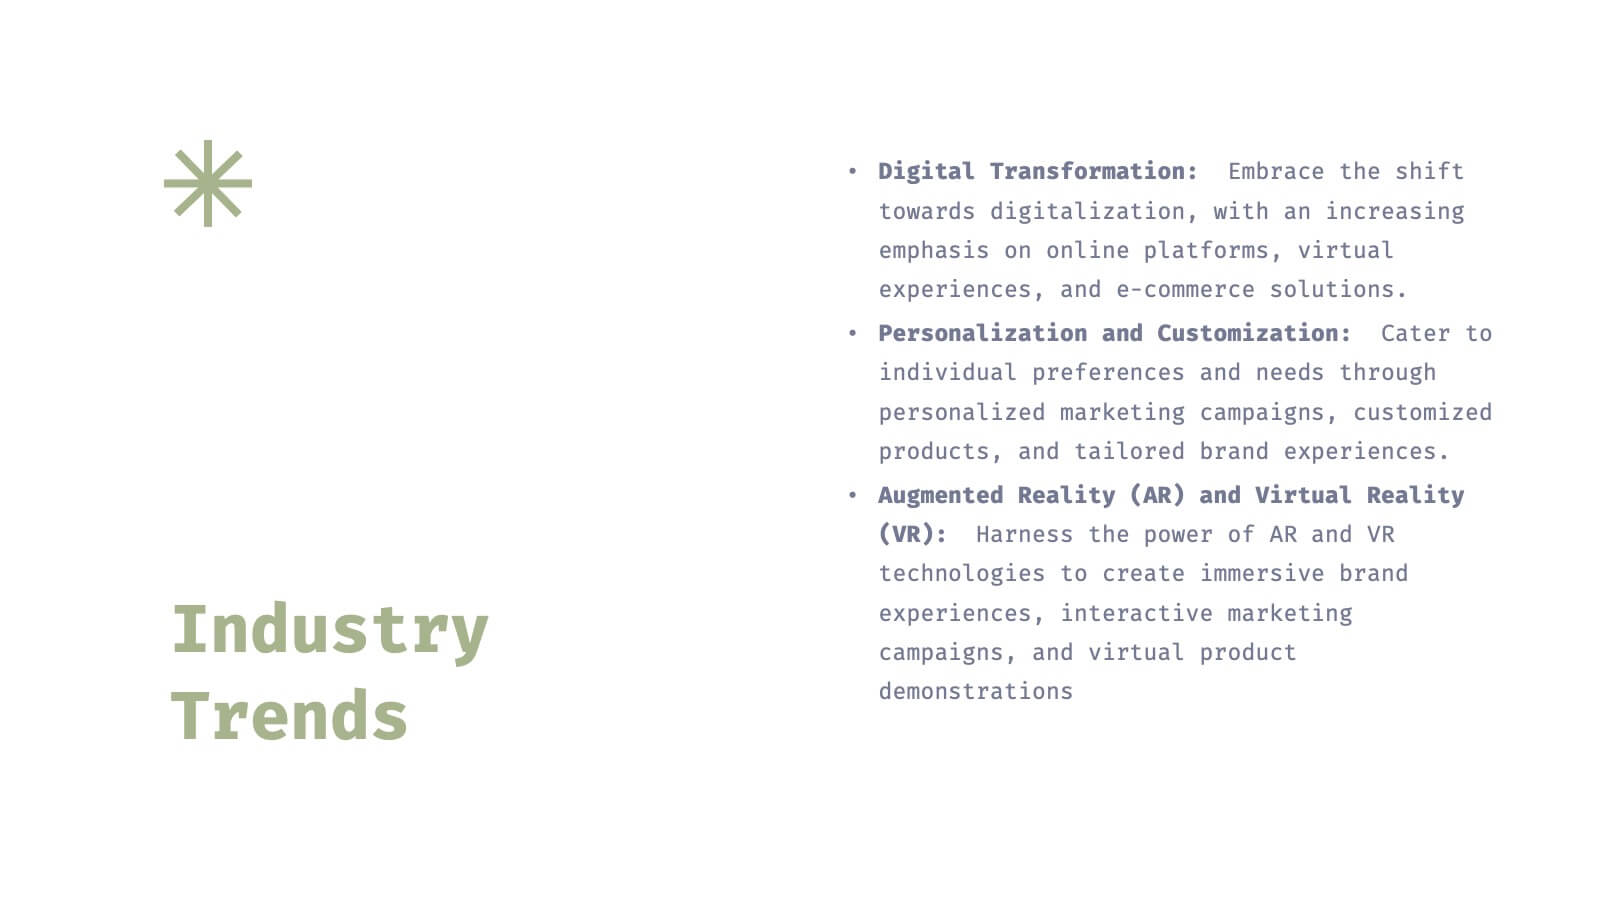
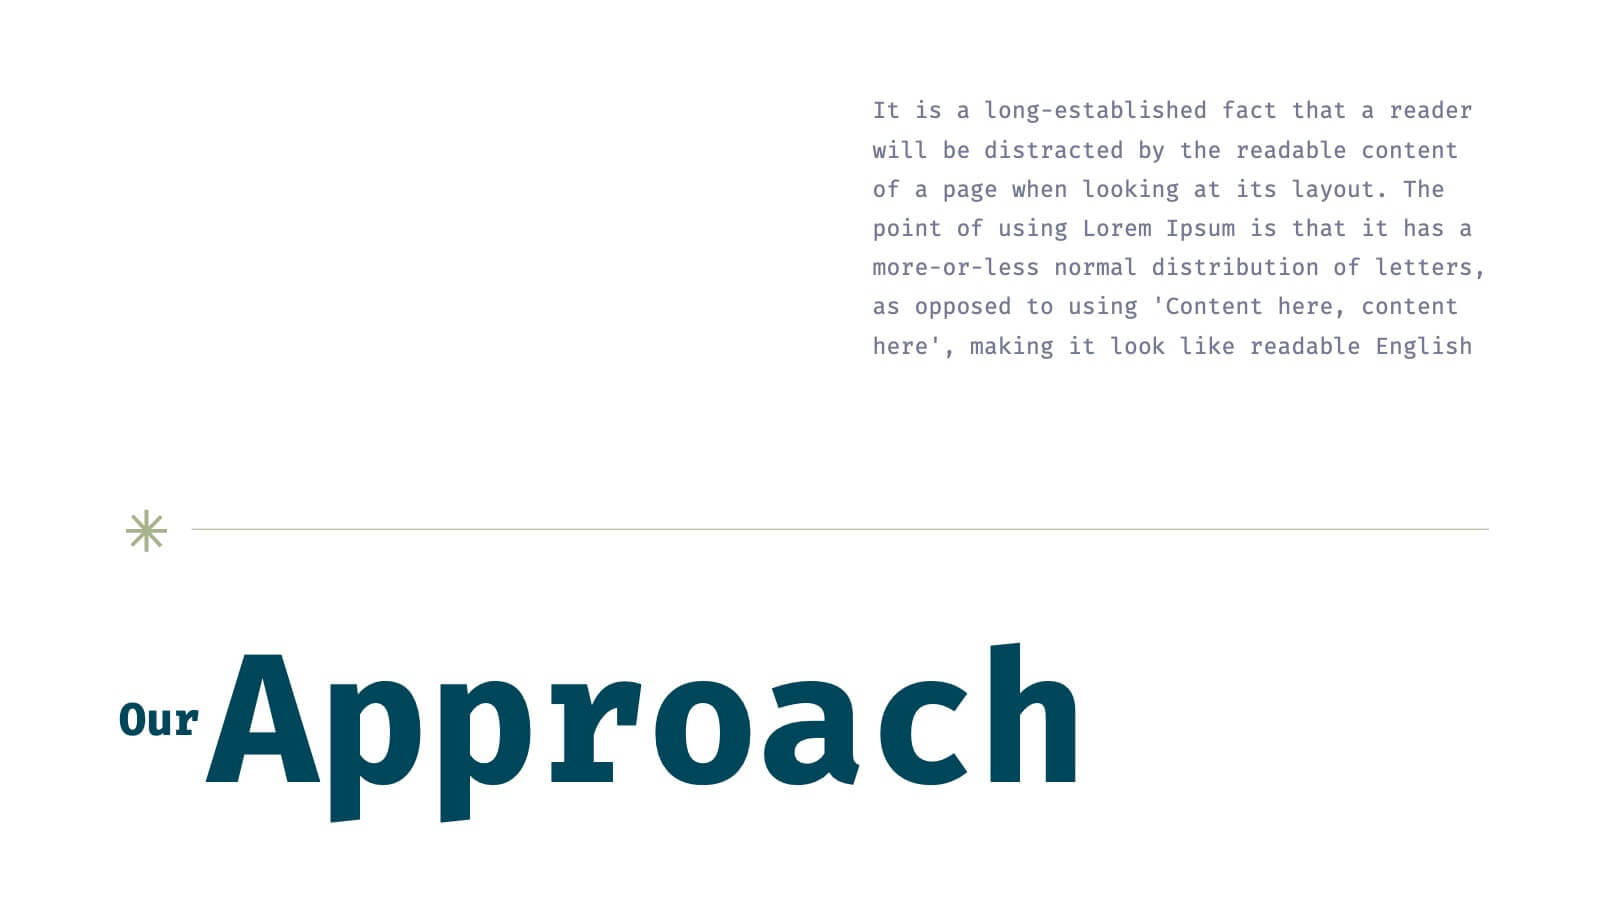
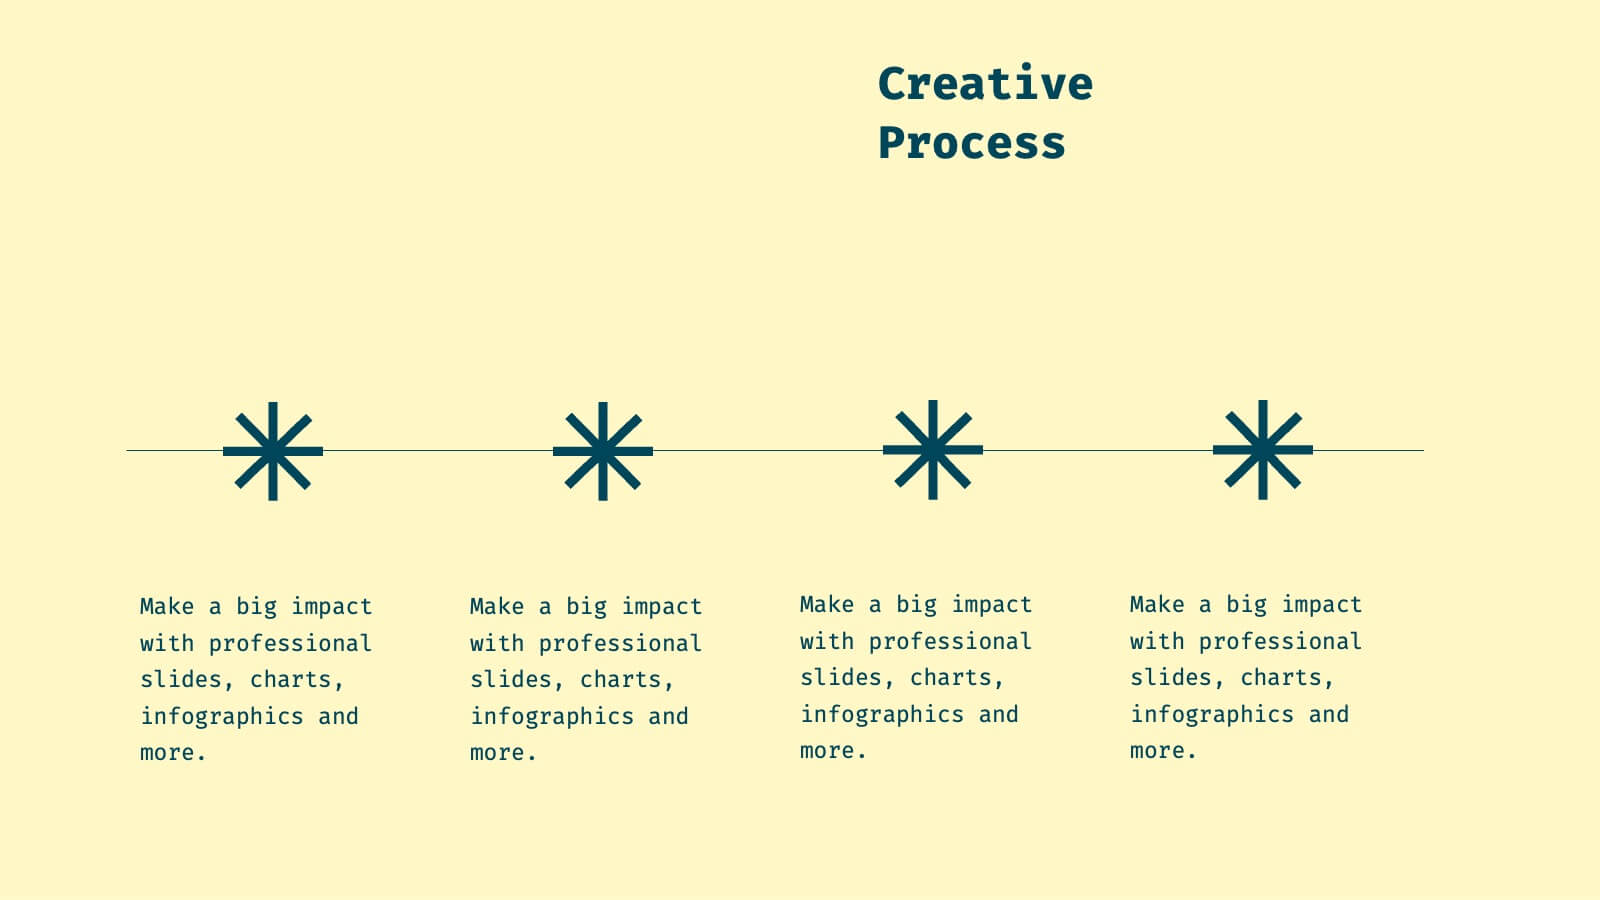
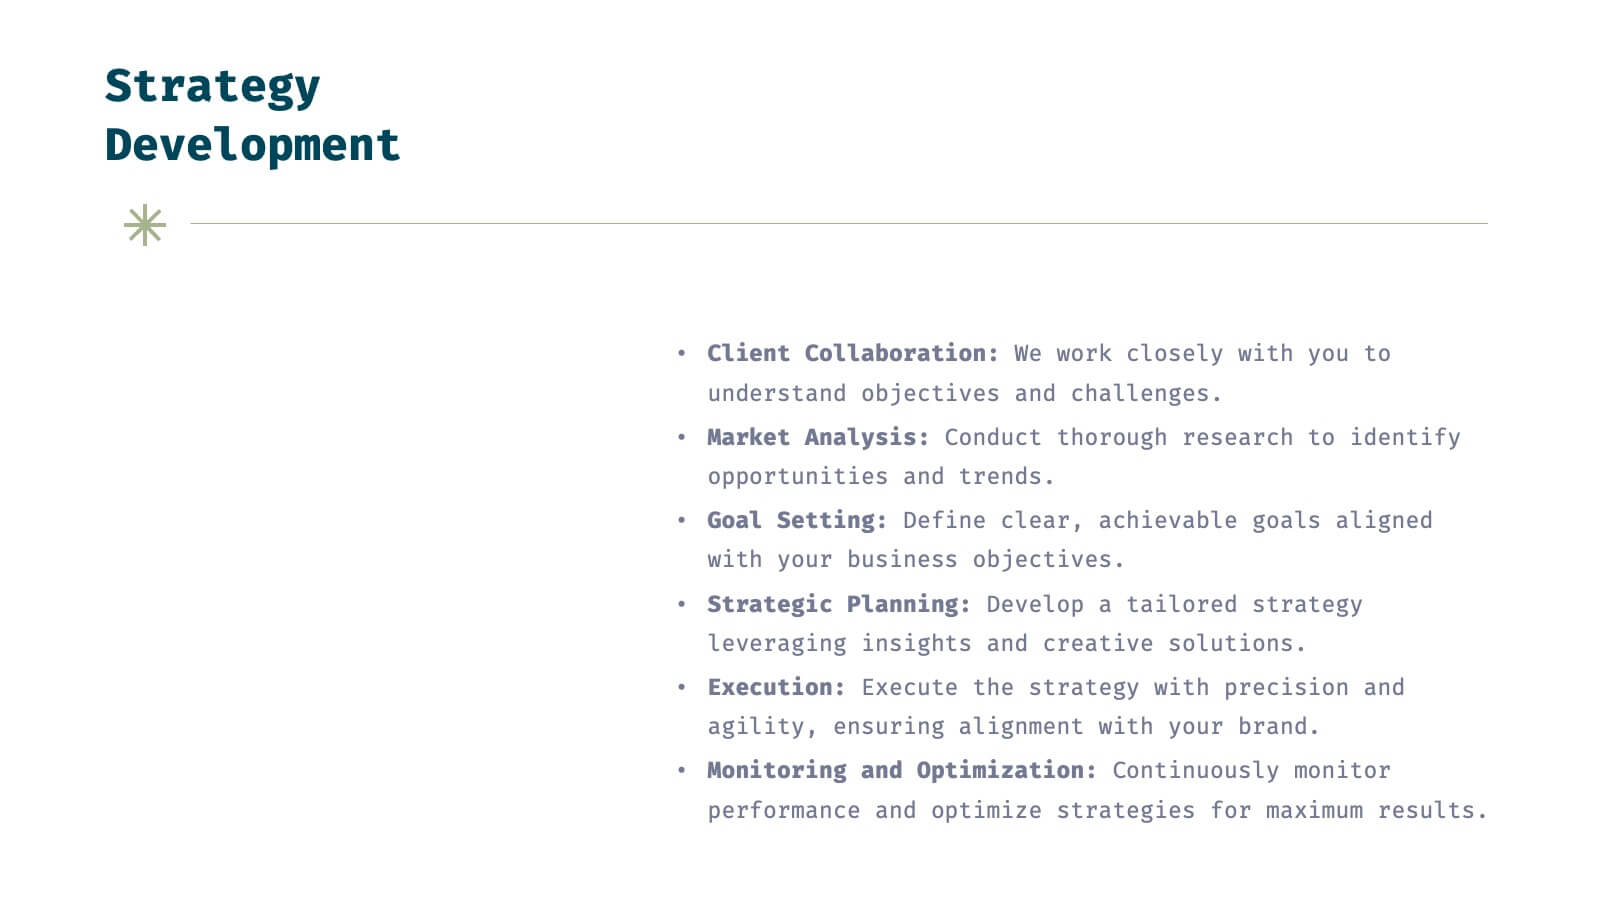
Helix Full-Service Agency Project Plan Presentation
Showcase your agency's expertise with this sophisticated, minimalistic presentation template. Designed to present comprehensive market analysis, strategy development, and client success stories, this template ensures your agency's capabilities are clearly communicated. Its clean design and professional layout make it perfect for building trust and credibility. Compatible with PowerPoint, Keynote, and Google Slides, it's versatile for any platform.


6 diapositivas
KPI Overview in Dashboard Format Presentation
Track performance at a glance with this KPI Overview in Dashboard Format presentation. Featuring visual gauge meters and progress indicators, it's perfect for reporting on targets, performance metrics, and business KPIs. Clean and modern layout, fully customizable in Canva, PowerPoint, and Google Slides to match your data visualization needs.