


Características


¿Tienes alguna pregunta?
Recomendar


7 diapositivas
Human Resources Process Infographic
Dive deep into the intricate world of HR with our human resources process infographic. Designed for clarity and ease of understanding, this infographic provides a streamlined look into the diverse steps and stages involved in efficient management. With a clean white canvas complemented by various shades of blue and a spectrum of colors for differentiation, this infographic promises an insightful journey. This is a tool for professionals aiming to present complex processes in a digestible format. Given its universal design, it's perfect for integration into PowerPoint, Keynote, or Google Slides presentations, ensuring that your content not only educates but also engages.


6 diapositivas
Business Task Checklist Presentation
Bring order and focus to your workflow with a clean, structured layout that tracks progress and priorities at a glance. Ideal for project updates, task planning, or performance reviews, this presentation makes organization effortless. Fully compatible with PowerPoint, Keynote, and Google Slides for easy customization and professional use.


5 diapositivas
US State-by-State Sales Breakdown Presentation
Visualize regional performance with the US State-by-State Sales Breakdown Presentation. This slide uses a clean U.S. map layout to highlight state-specific sales metrics alongside color-coded legends and icons. Ideal for showcasing key market insights, regional trends, or territory growth. Fully editable in Canva, PowerPoint, and Google Slides.


3 diapositivas
Automation and AI Strategy Framework Presentation
Take your ideas for a high-tech spin with this bold and modern layout! This template visually breaks down strategic frameworks for automation and AI by using a clean, segmented circular flow. Ideal for showcasing processes, data integration, or tech-driven initiatives. Fully compatible with PowerPoint, Keynote, and Google Slides for seamless editing.


10 diapositivas
Overcoming Market Challenges Presentation
Overcome business obstacles with confidence using this Overcoming Market Challenges template. Designed with a dynamic step-by-step growth visual, this slide helps illustrate challenges, solutions, and progress in an engaging way. Ideal for strategy meetings, financial forecasts, and competitive analysis, this template makes complex information easy to understand. Fully editable for PowerPoint, Keynote, and Google Slides.


8 diapositivas
Achievements and Goals Milestone
Illustrate your team's journey with this visually engaging milestone roadmap. Featuring a step-by-step block design with space for five key accomplishments, it's perfect for goal tracking, progress reviews, or roadmap presentations. Fully editable in PowerPoint, Keynote, and Google Slides.


6 diapositivas
Governance Tools Infographics
Enhance your understanding of Governance Tools with our customizable infographic template. This template is fully compatible with popular presentation software like PowerPoint, Keynote, and Google Slides, allowing you to easily customize it to illustrate and communicate various governance tools and practices. The Governance Tools infographic template offers a visually engaging platform to explore and explain the tools, frameworks, and strategies used to facilitate effective governance within organizations. Whether you're a governance professional, business leader, or interested in corporate governance, this template provides a user-friendly canvas to create informative presentations and educational materials. Deepen your knowledge of Governance Tools with this SEO-optimized infographic template, thoughtfully designed for clarity and ease of use. Customize it to showcase governance frameworks, compliance mechanisms, risk management tools, and best practices, ensuring that your audience gains valuable insights into this critical field. Start crafting your personalized infographic today to delve into the world of Governance Tools.

22 diapositivas
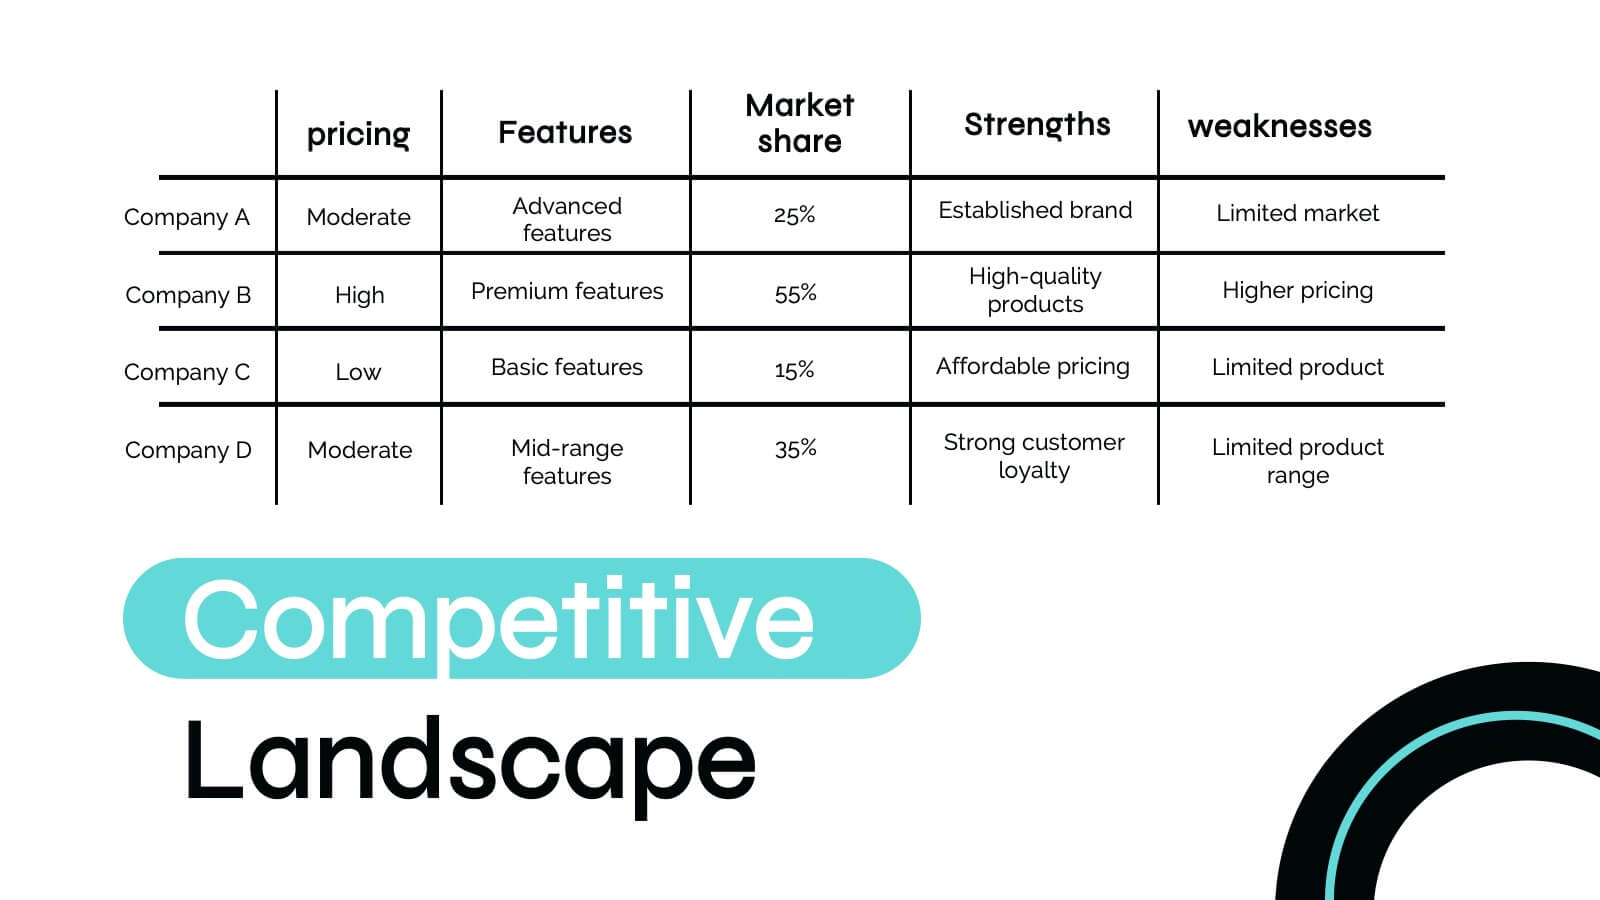
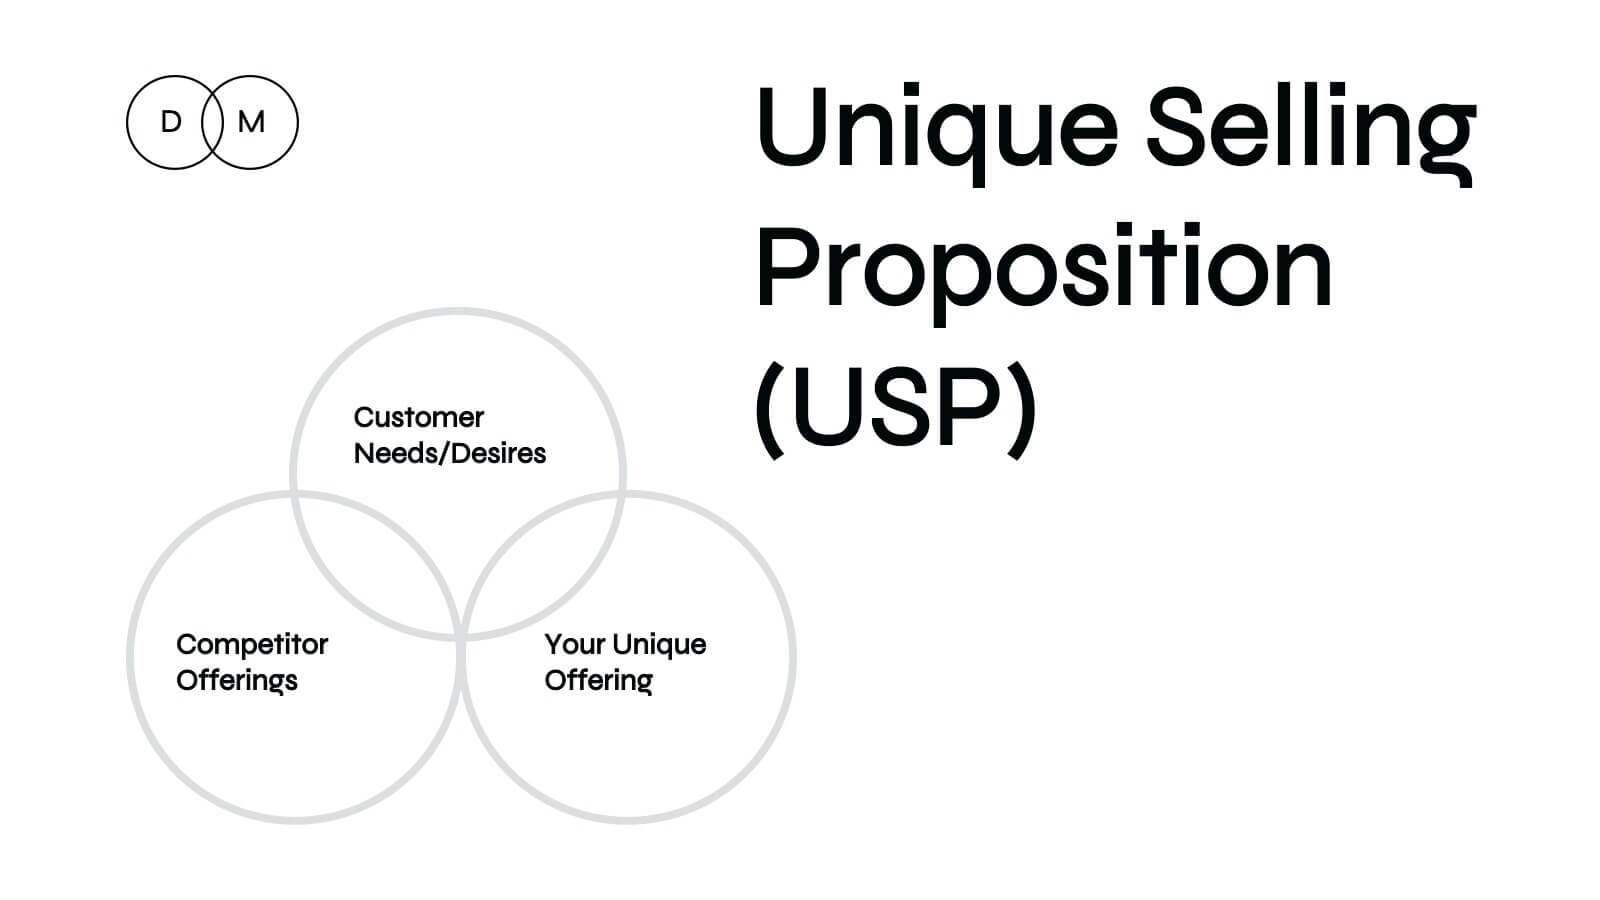
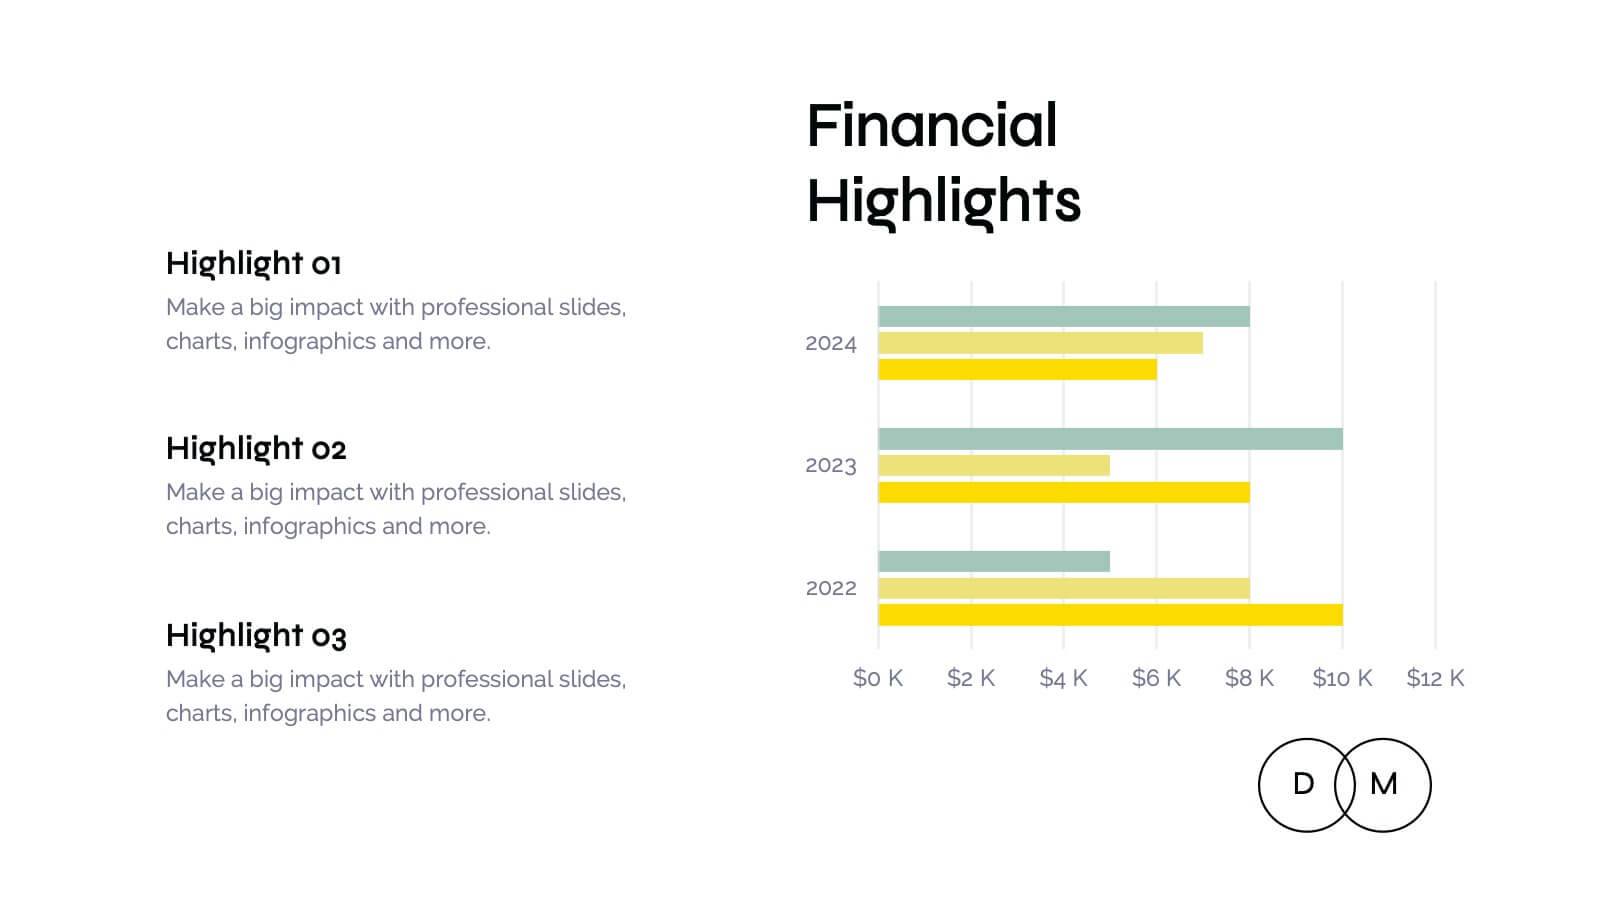
Hercules Digital Marketing Strategy Plan Presentation
Ignite your next marketing presentation with this bold, dynamic template that showcases every key element of your marketing strategy! From company history and target audience insights to competitive landscape analysis, this design makes presenting your marketing message a breeze. Perfect for professionals, it’s fully compatible with PowerPoint, Keynote, and Google Slides for seamless usage across platforms.


6 diapositivas
Agriculture Jobs Infographic
Agriculture jobs encompass a wide range of career opportunities that involve the cultivation, production, processing, and distribution of crops, livestock, and other agricultural products. This infographic template showcases the diversity of jobs within the agriculture industry, highlighting the roles, required skills, and potential career growth. This infographic can be organized into different categories of agriculture jobs, such as Farming and Crop Production, Livestock Management, Agricultural Engineering, and Agricultural Research. This template is compatible with Powerpoint, Keynote, and Google Slides.


21 diapositivas
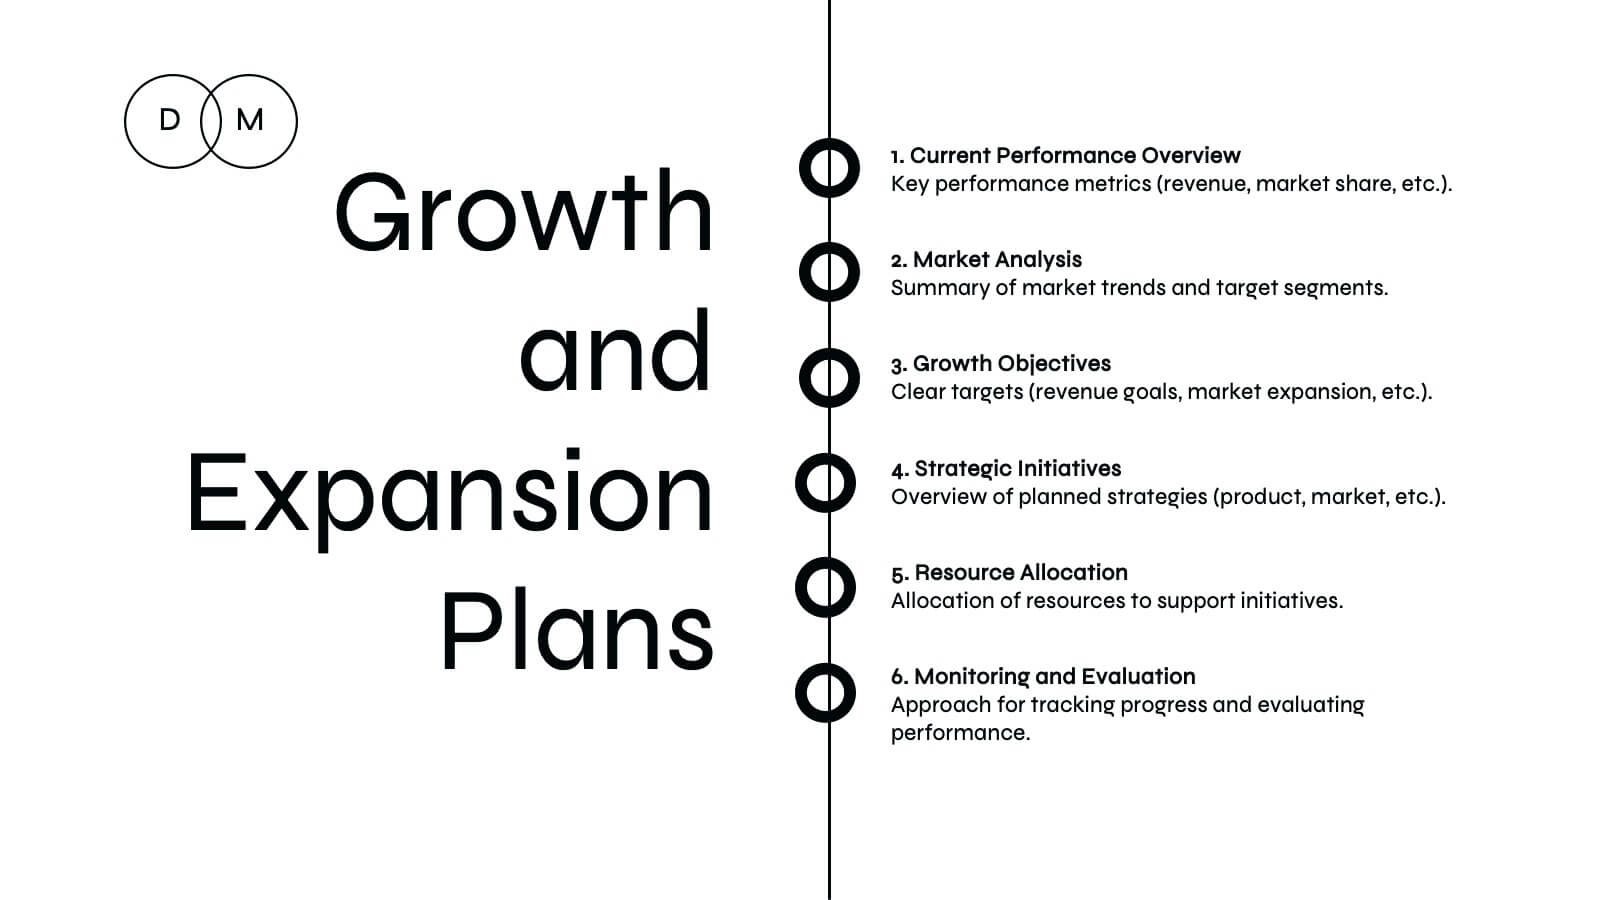
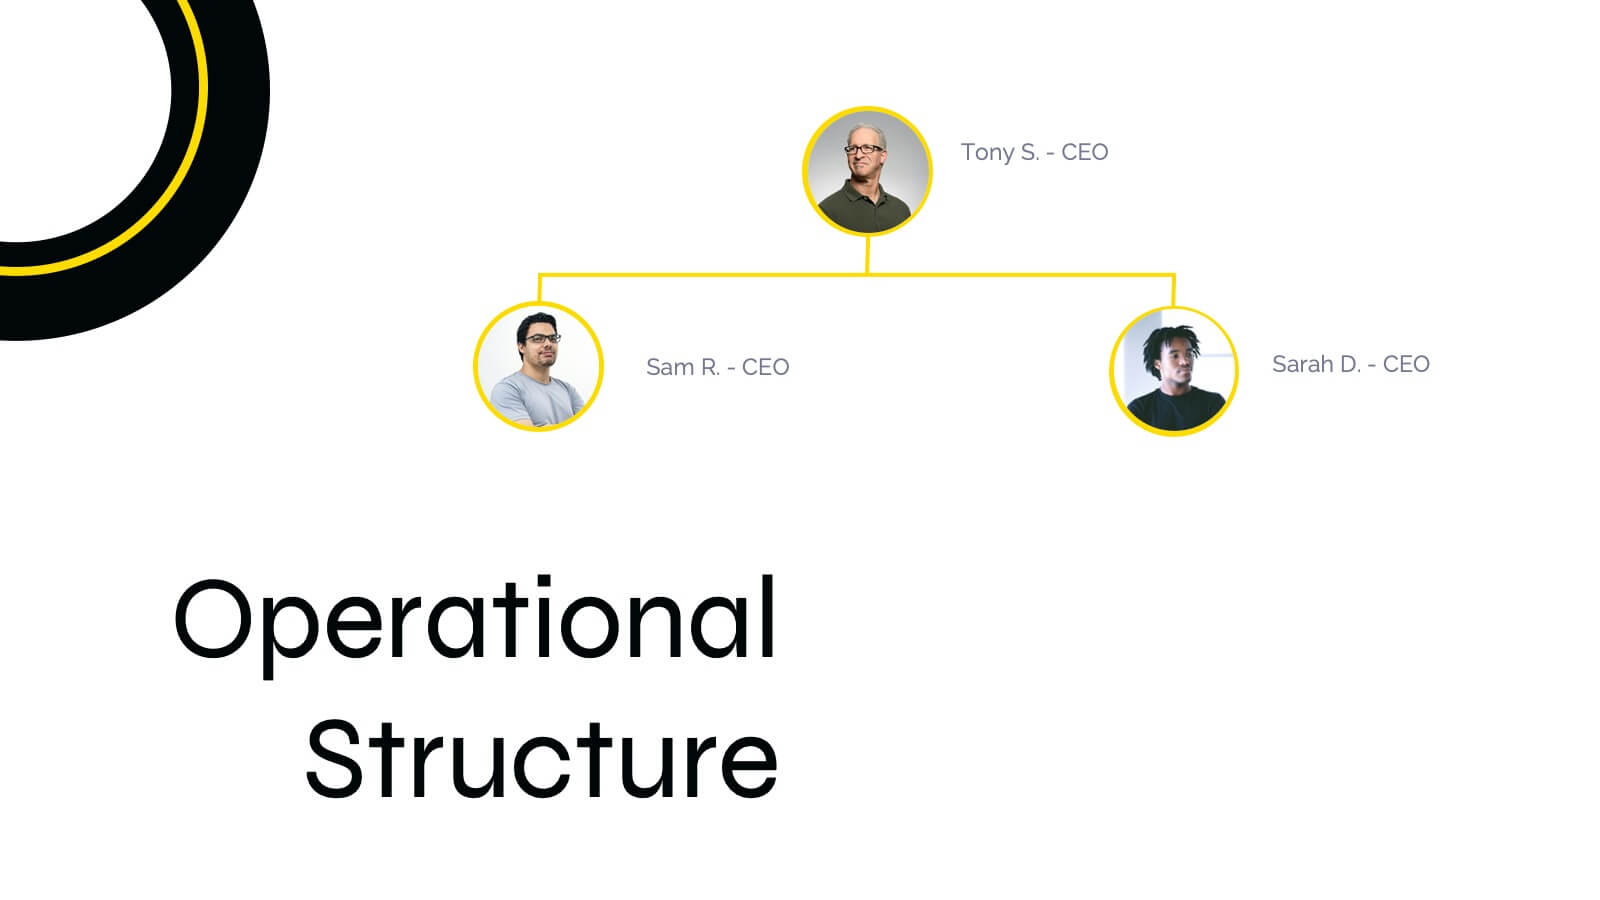
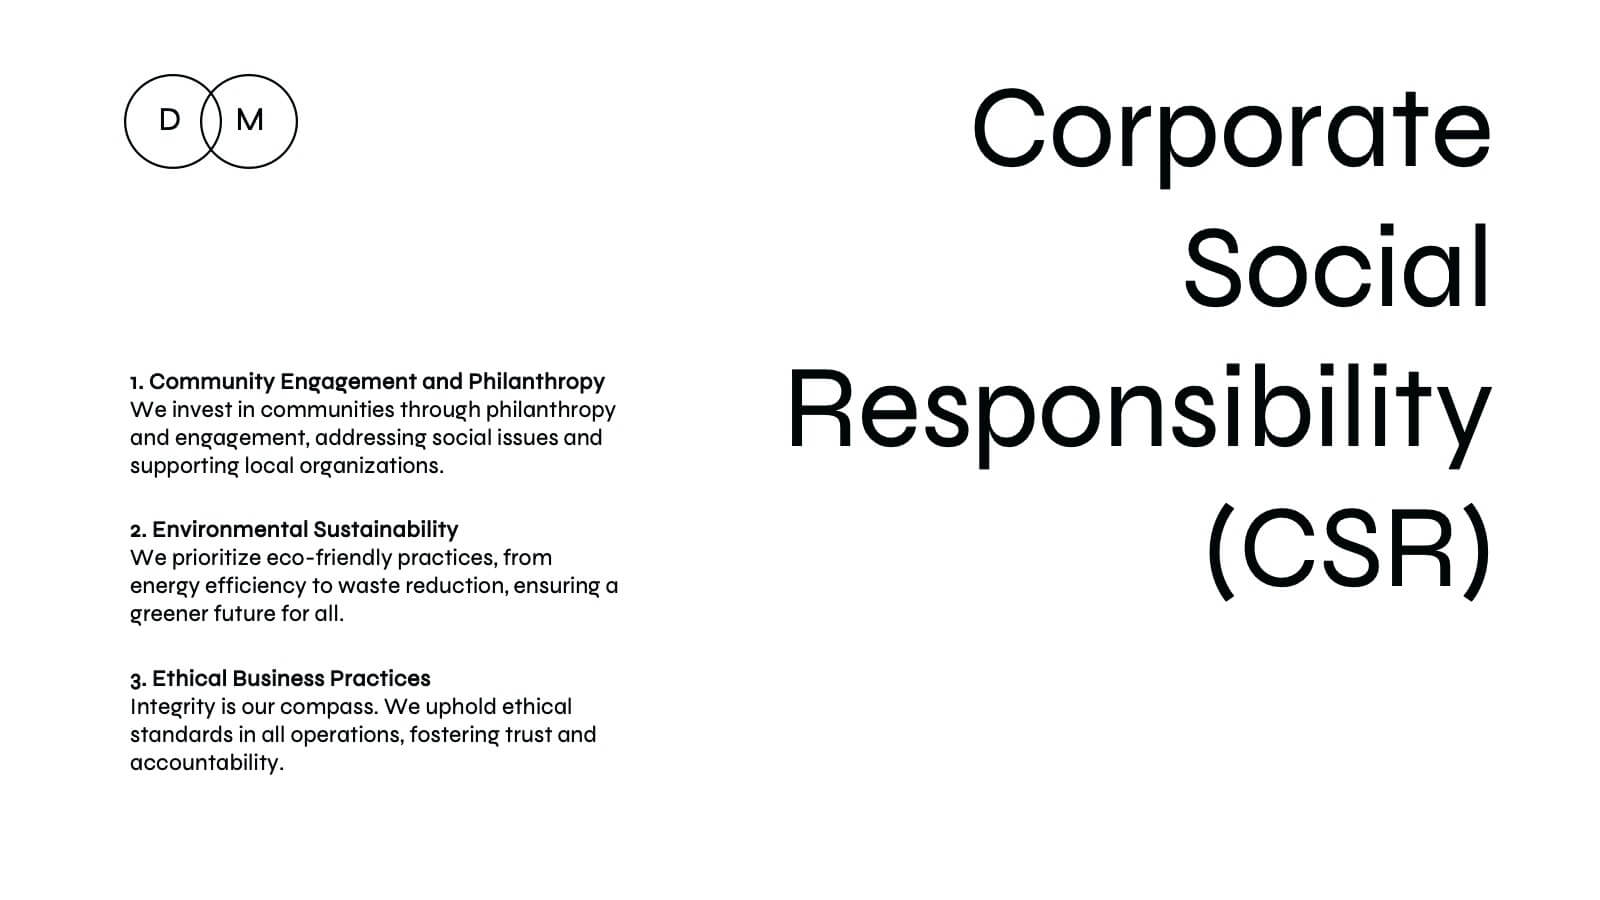
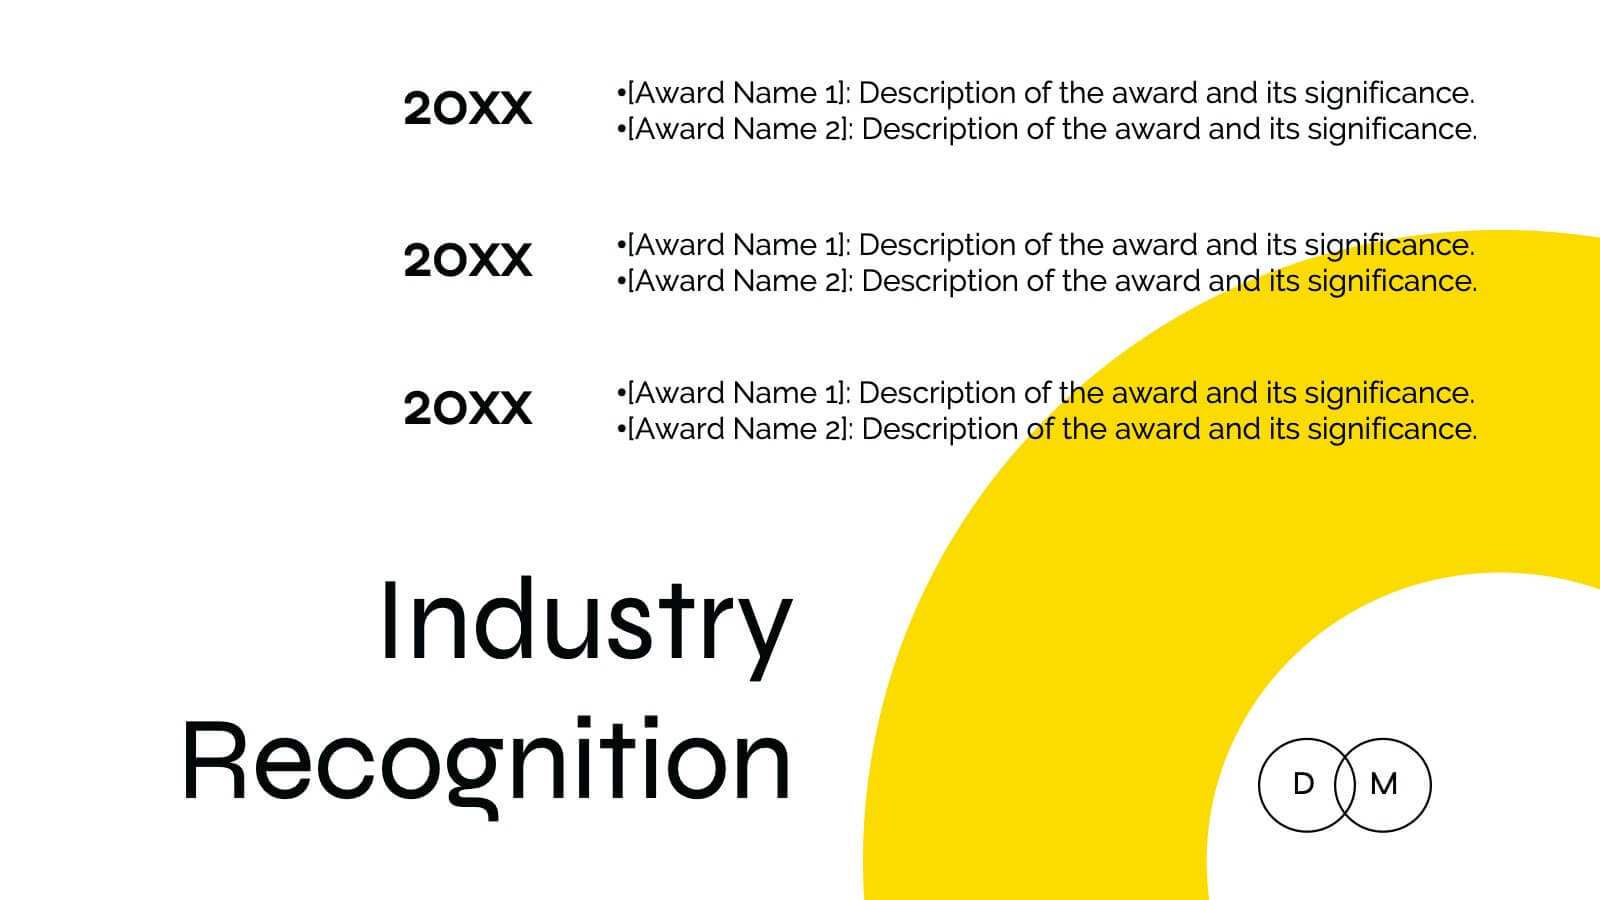
Ironveil Annual Report Presentation
A professional annual report template for showcasing performance metrics, key highlights, financial summaries, and strategic initiatives. Includes sections for customer feedback, competitor insights, and future priorities. Fully customizable and ideal for business reviews. Compatible with PowerPoint, Keynote, and Google Slides for seamless presentation delivery.


8 diapositivas
Economic Impact on Stock Market Presentation
Illuminate your financial presentation with the "Economic Impact on Stock Market" template, ideal for displaying the interconnected influences of economic variables on market performance. These slides feature clear, visual representations through pie charts and percentage indicators, allowing for an engaging analysis of trends and impacts. This template is fully compatible with PowerPoint, Keynote, and Google Slides, ensuring versatility across different presentation platforms.


6 diapositivas
Business Security Compliance Presentation
Visualize your security framework with this clear and modern infographic layout. This slide is ideal for presenting compliance steps, risk assessments, or regulatory requirements, featuring a shield-centered hub with 5 editable sections. Customize easily in PowerPoint, Keynote, or Google Slides.


34 diapositivas
Founder Startup
A Founder Startup, is a newly established business venture that is typically founded by one or more individuals or groups with an innovative idea, concept, or product. This template is designed to help you create a professional and compelling presentation that showcases your startup and its founders in a impactful way. Compatible with PowerPoint, Keynote, and Google Slides. Included in this template are a variety of pre-designed slides that will help cover different aspects of your startup, such as team introduction, overview, vision and mission, product or service description, market analysis, financials, and more.


6 diapositivas
Go-to-Market Launch Plan Presentation
Launch with confidence using this Go-to-Market Launch Plan Presentation. This clean, step-by-step visual framework highlights each phase of your GTM strategy—from market research to execution metrics. Ideal for startups, product managers, and marketing teams. Fully customizable in PowerPoint, Keynote, and Google Slides.


7 diapositivas
Success Iceberg Infographic
Iceberg Infographic are visual guides to understanding the world of business. Ideal for anyone who wants to understand the basics of business, from what it is and how it works to why it matters. This template is easy to read, and can be used for everything from data visualization to teaching people how to use a new product. Give your audience a look at the most important parts of your business. The template is easy to use, and allows you to highlight your data. Fully customizable and compatible with Powerpoint, Keynote, and Google Slides. There are multiple color themes, fonts, and shapes to choose from, and endless combinations to make it truly yours.


6 diapositivas
Simple Step-by-Step Strategy Slide
Present your ideas with clarity and focus using this clean, minimal step-by-step template. Designed with a modern, easy-to-follow layout, it’s ideal for business strategies, timelines, or process explanations. Fully editable in PowerPoint, Keynote, and Google Slides for effortless customization.


5 diapositivas
Content Strategy for Social Platforms
Plan and present your platform-specific approach with the Content Strategy for Social Platforms Presentation. This template features a central laptop graphic with circular icons representing key content types, surrounded by five customizable text areas to outline your strategic priorities. Ideal for breaking down tactics by platform, content type, or marketing funnel stage. Fully editable in PowerPoint, Keynote, and Google Slides.