


Características


¿Tienes alguna pregunta?
Recomendar


6 diapositivas
Public Health and Wellness Strategy Process
Promote holistic well-being with this visually engaging 6-step wellness infographic. Designed around a meditative figure and circular path, it’s ideal for health initiatives, public outreach, and lifestyle improvement strategies. Fully editable in PowerPoint, Keynote, and Google Slides—perfect for wellness coaches, health educators, and public health teams.


20 diapositivas
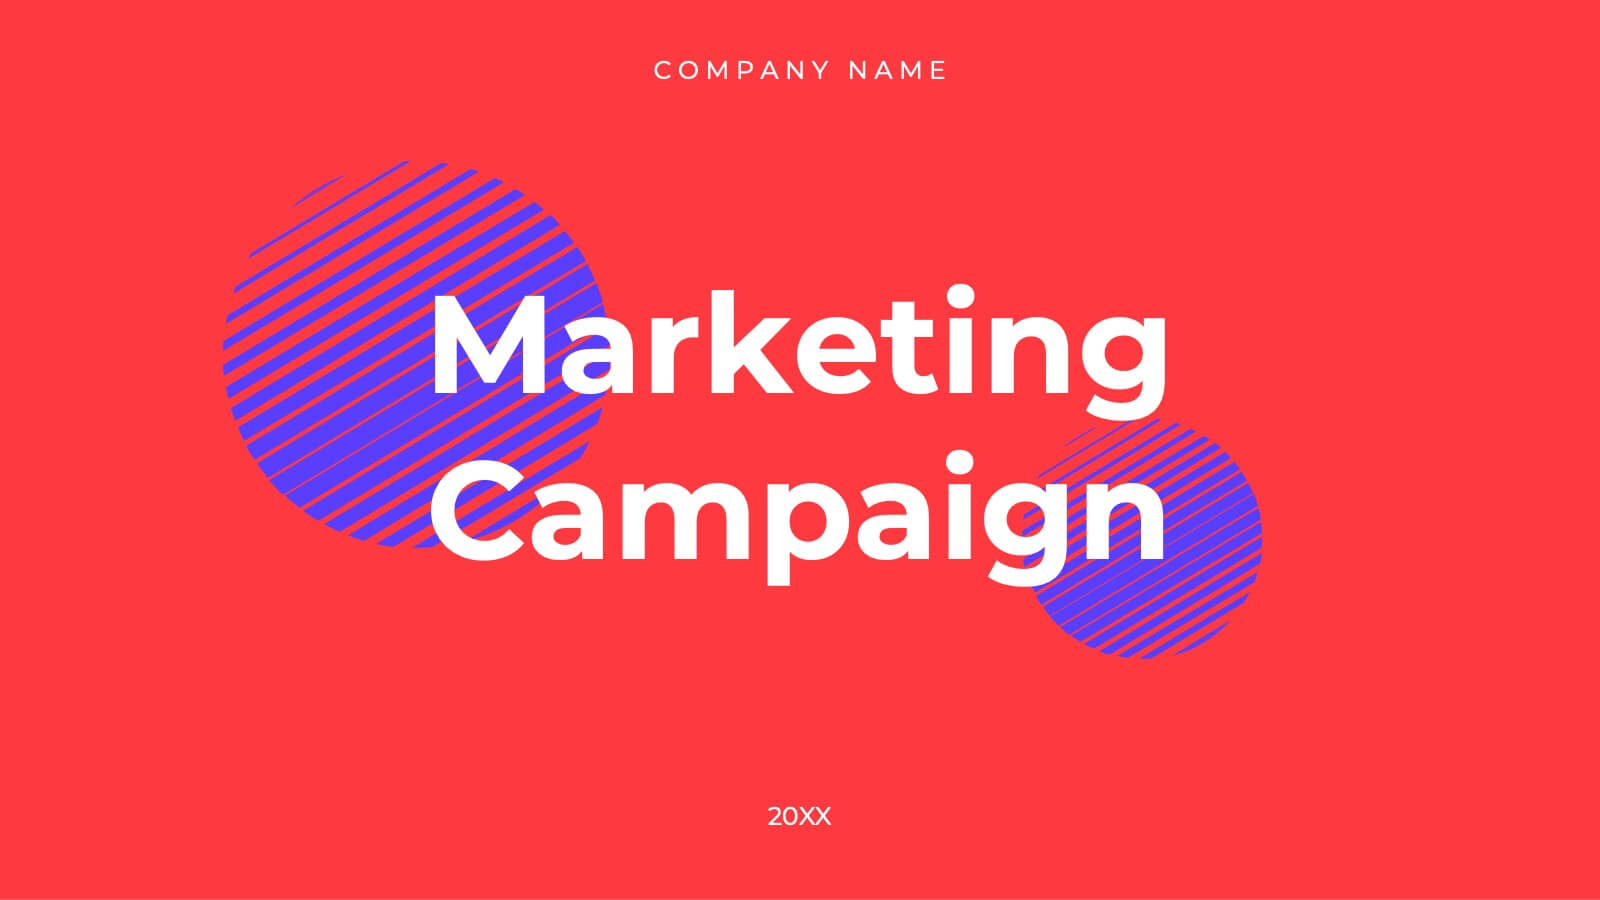
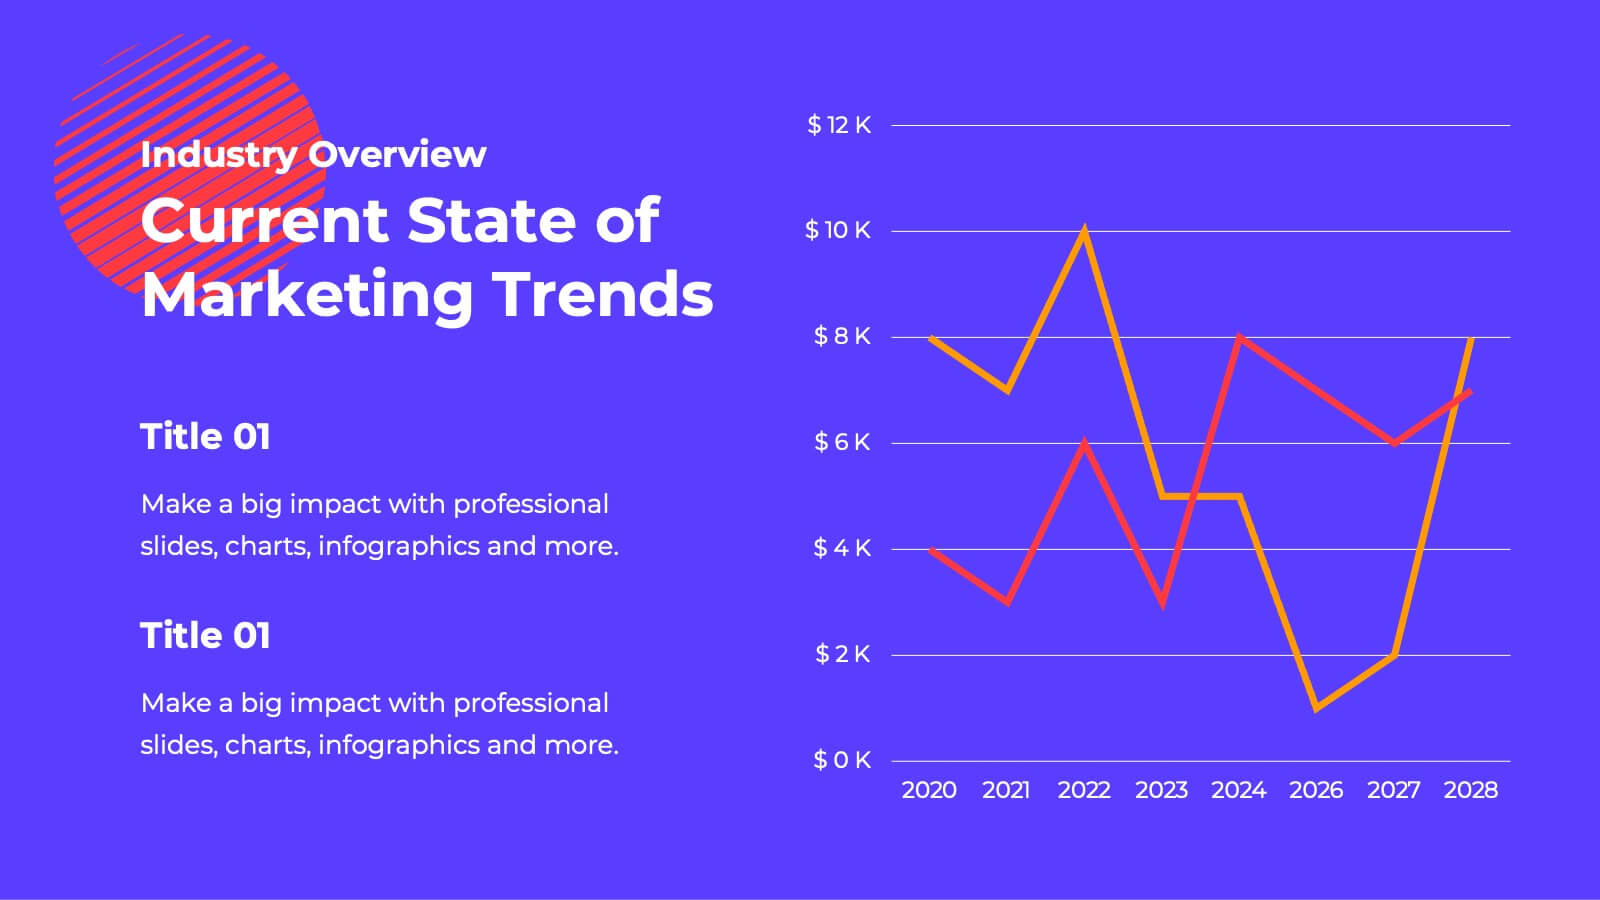
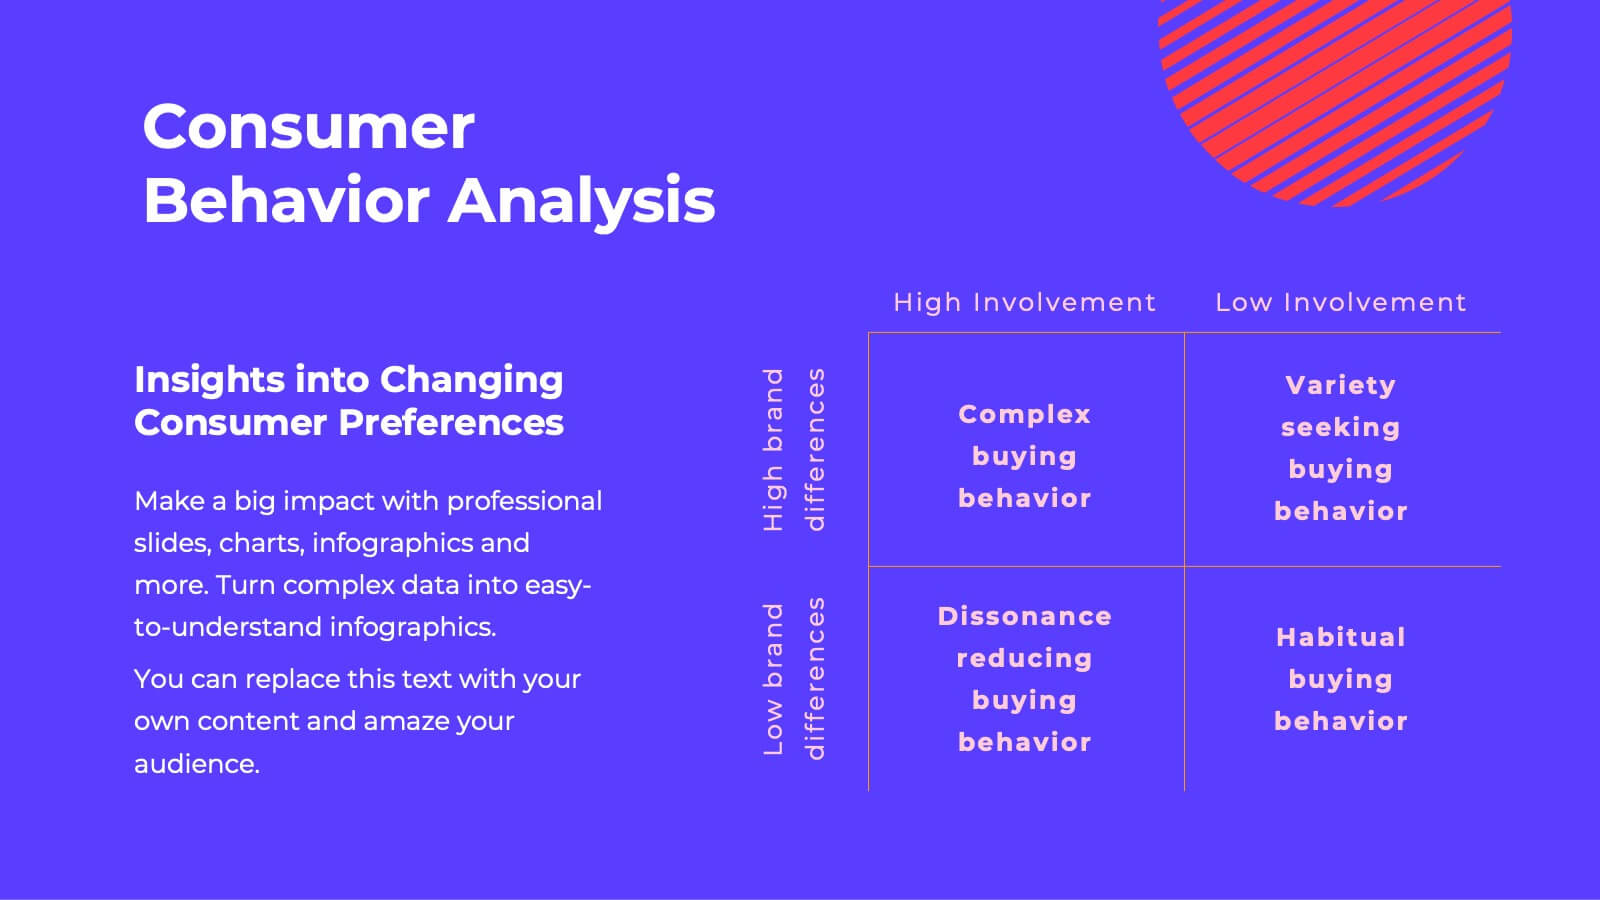
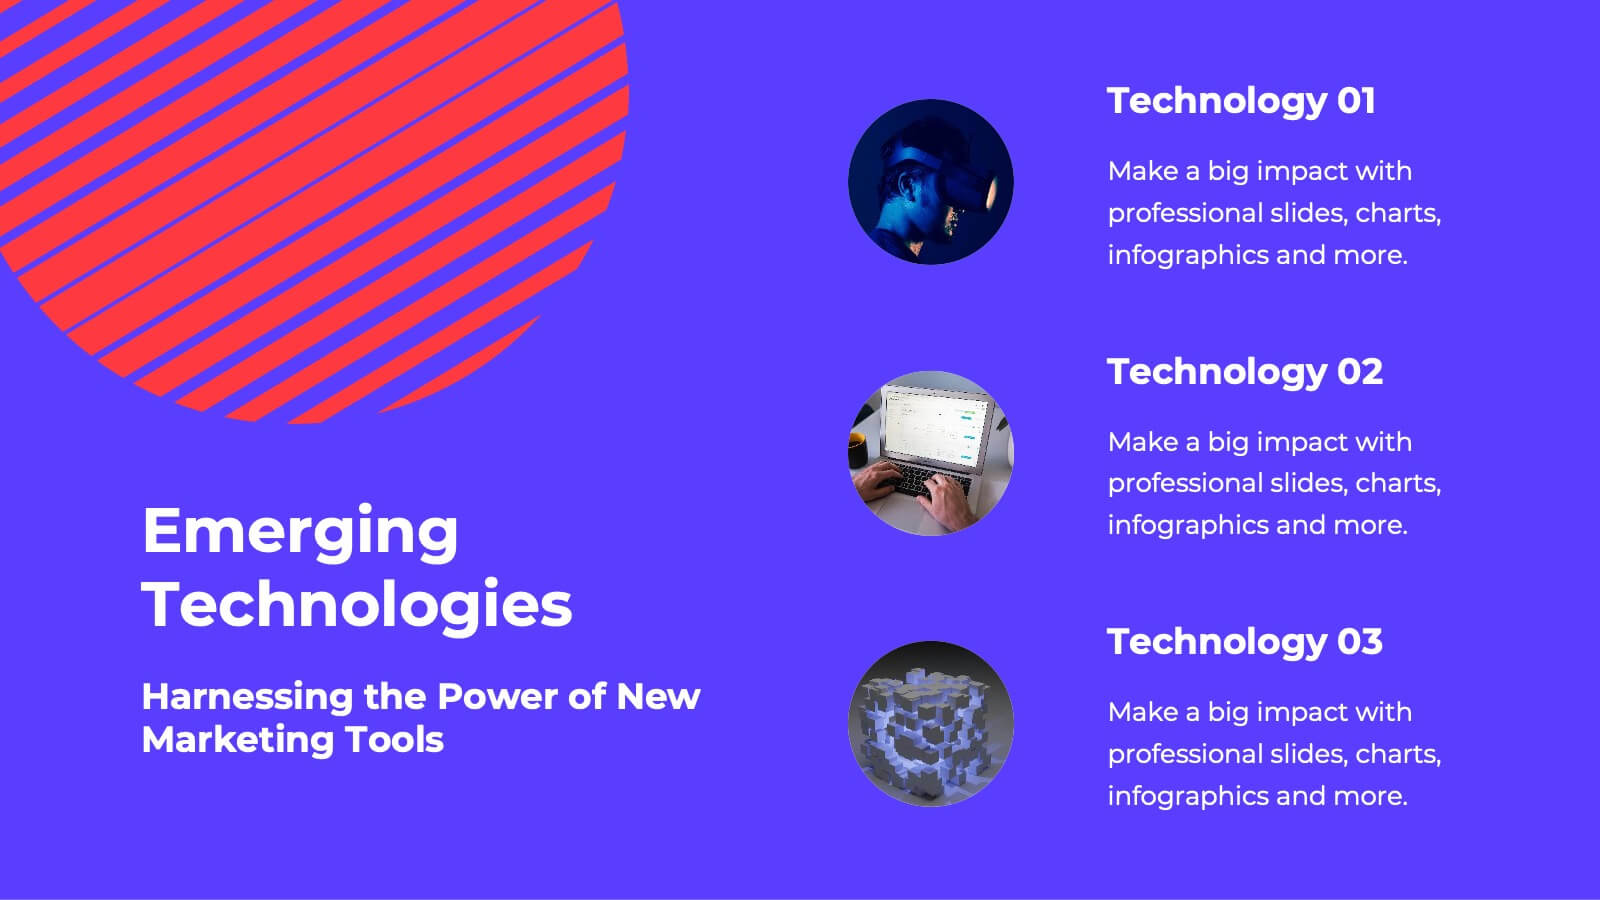
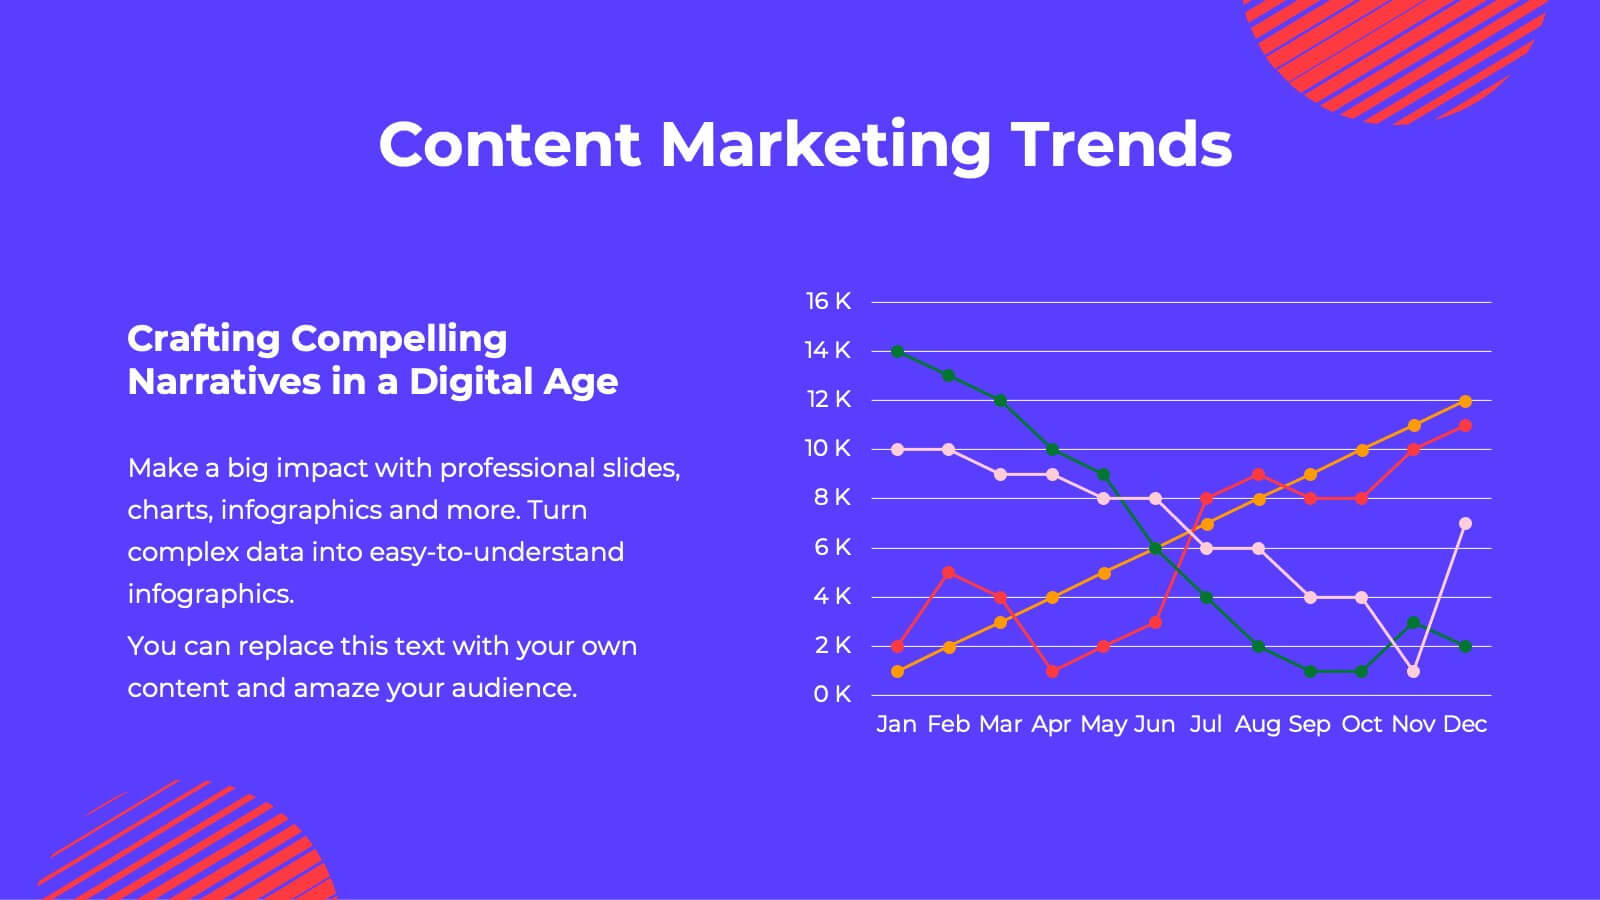
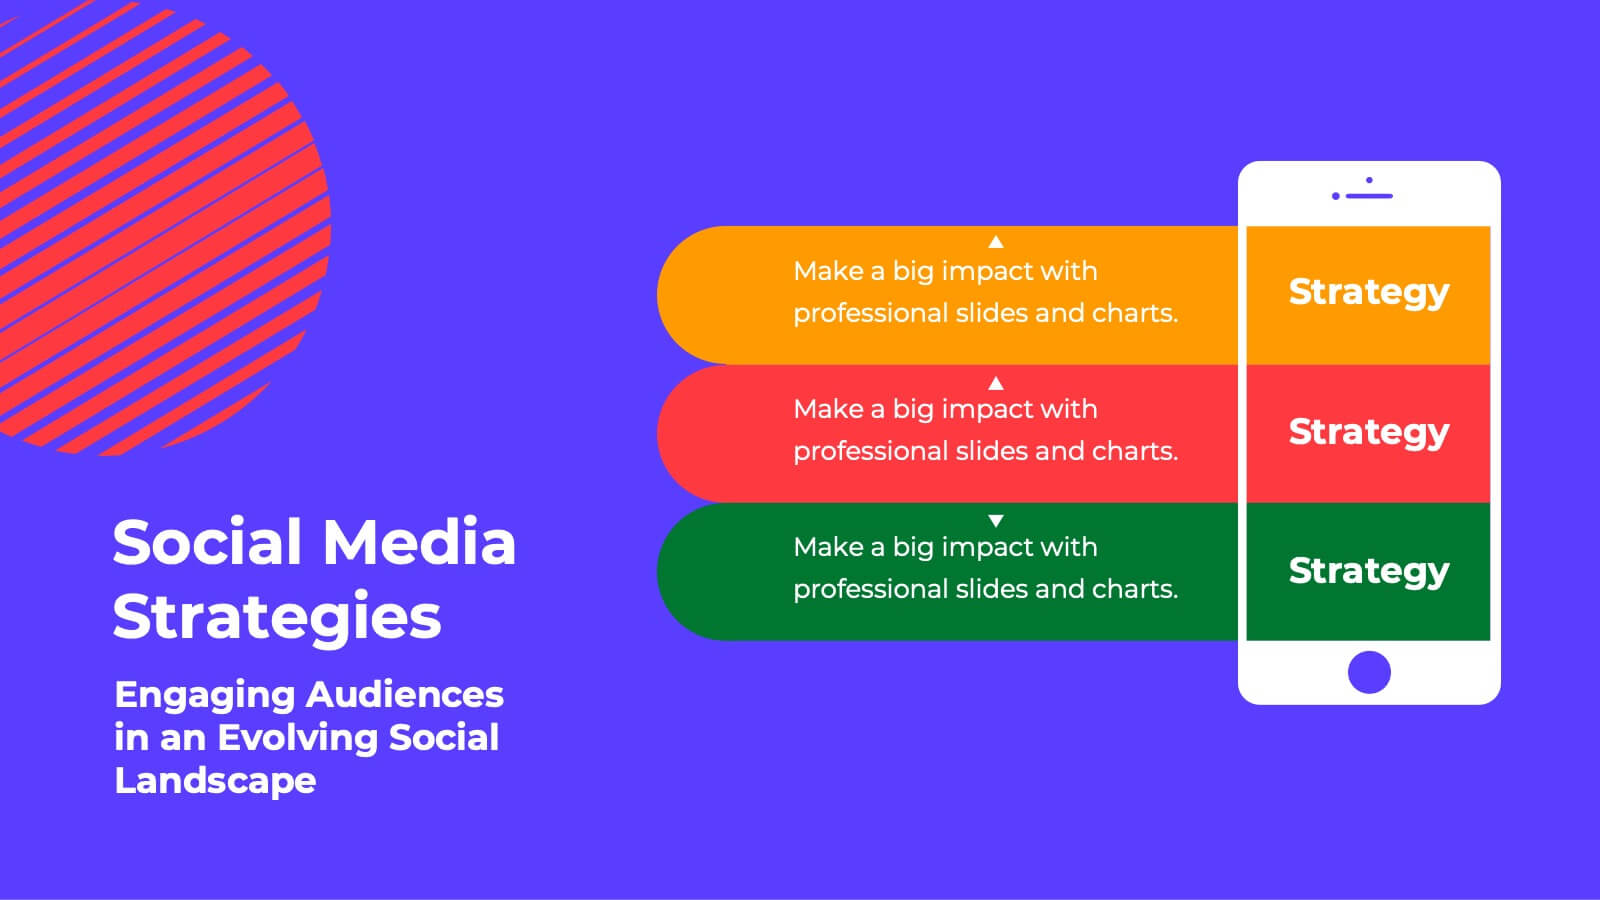
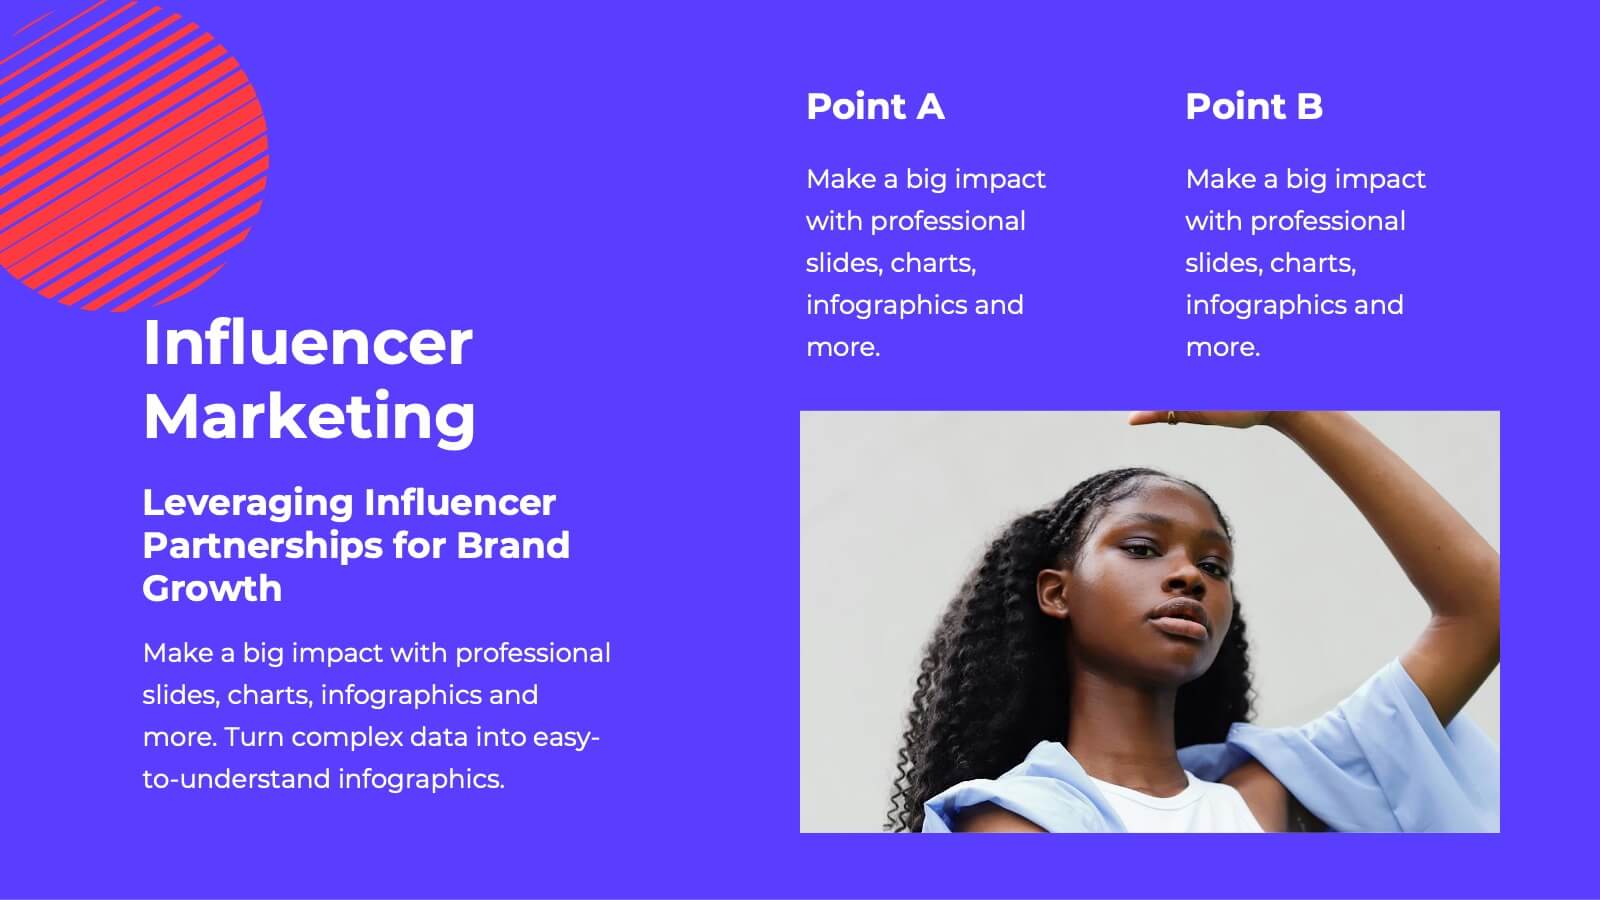
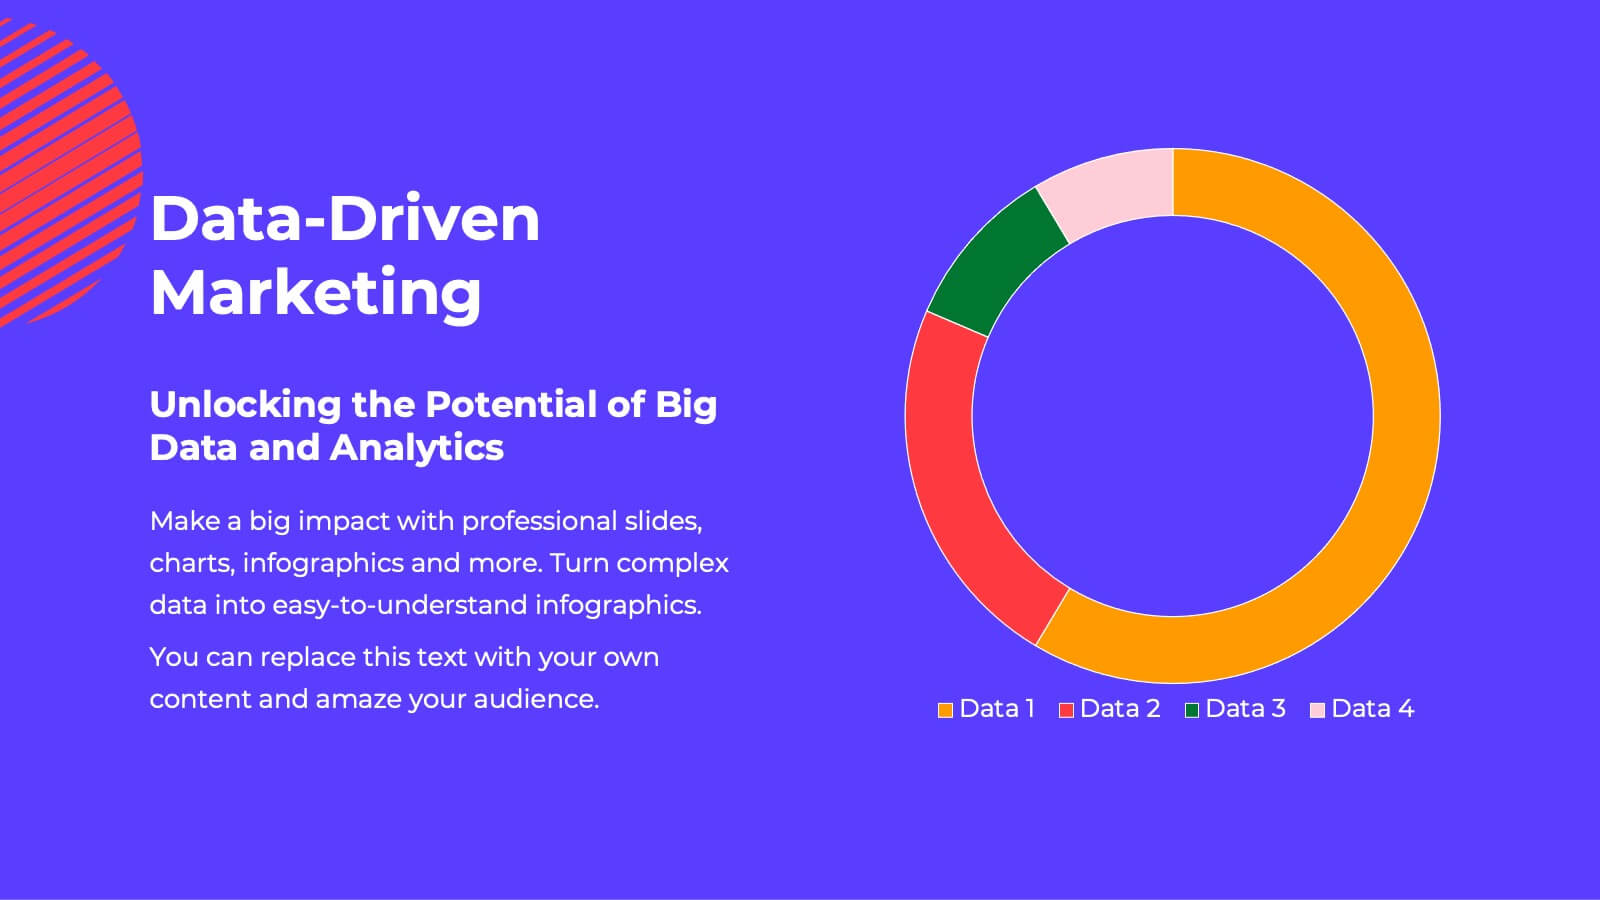
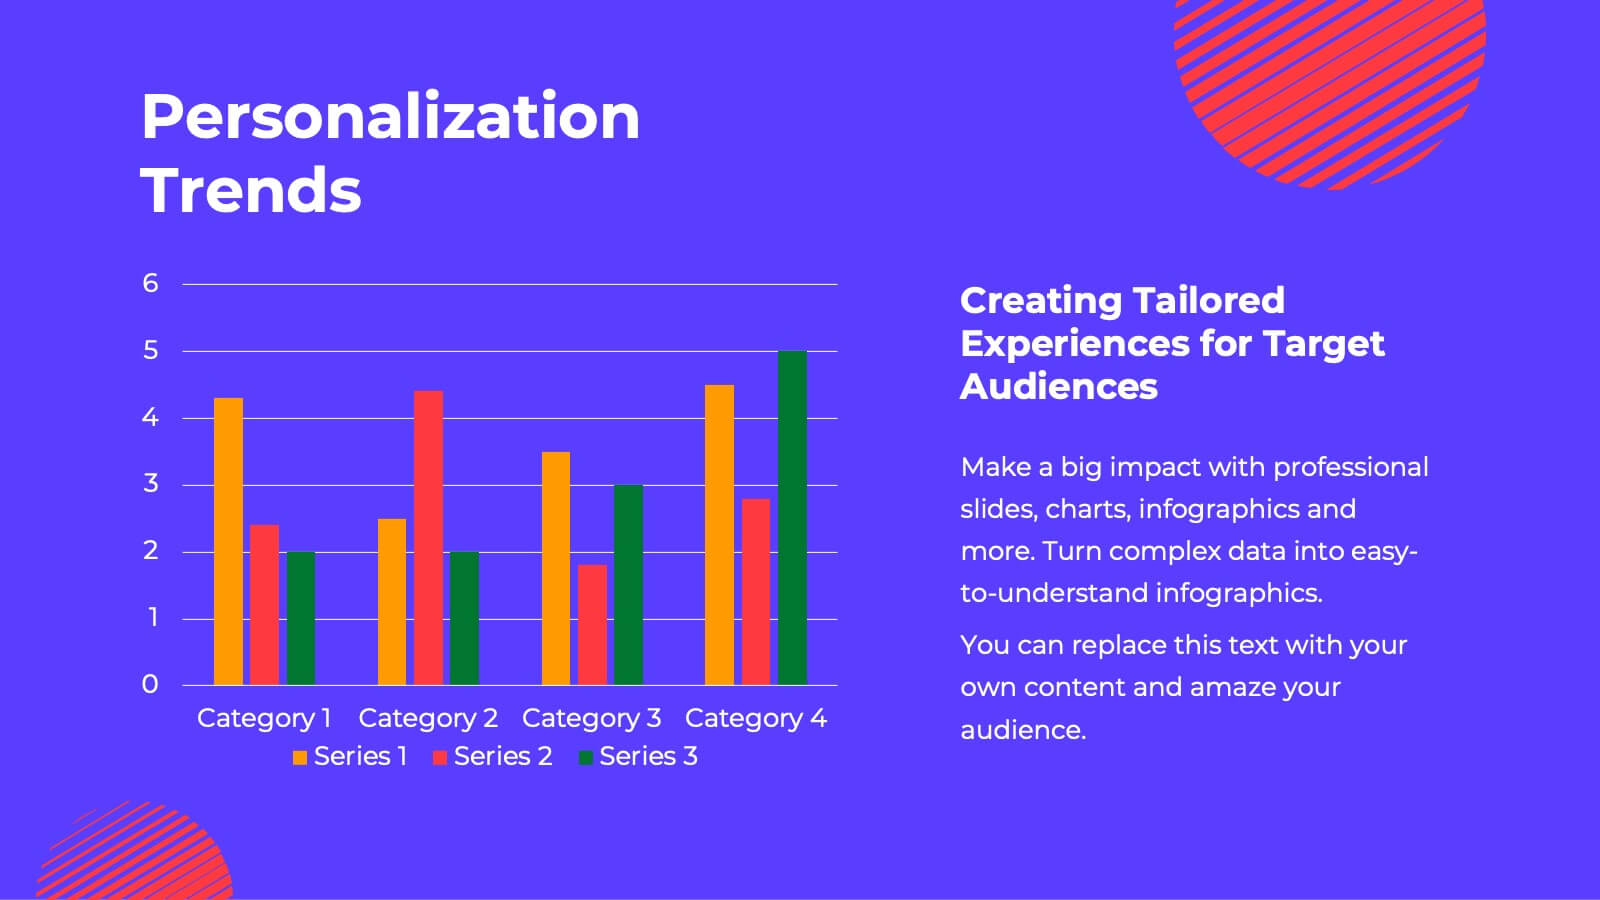
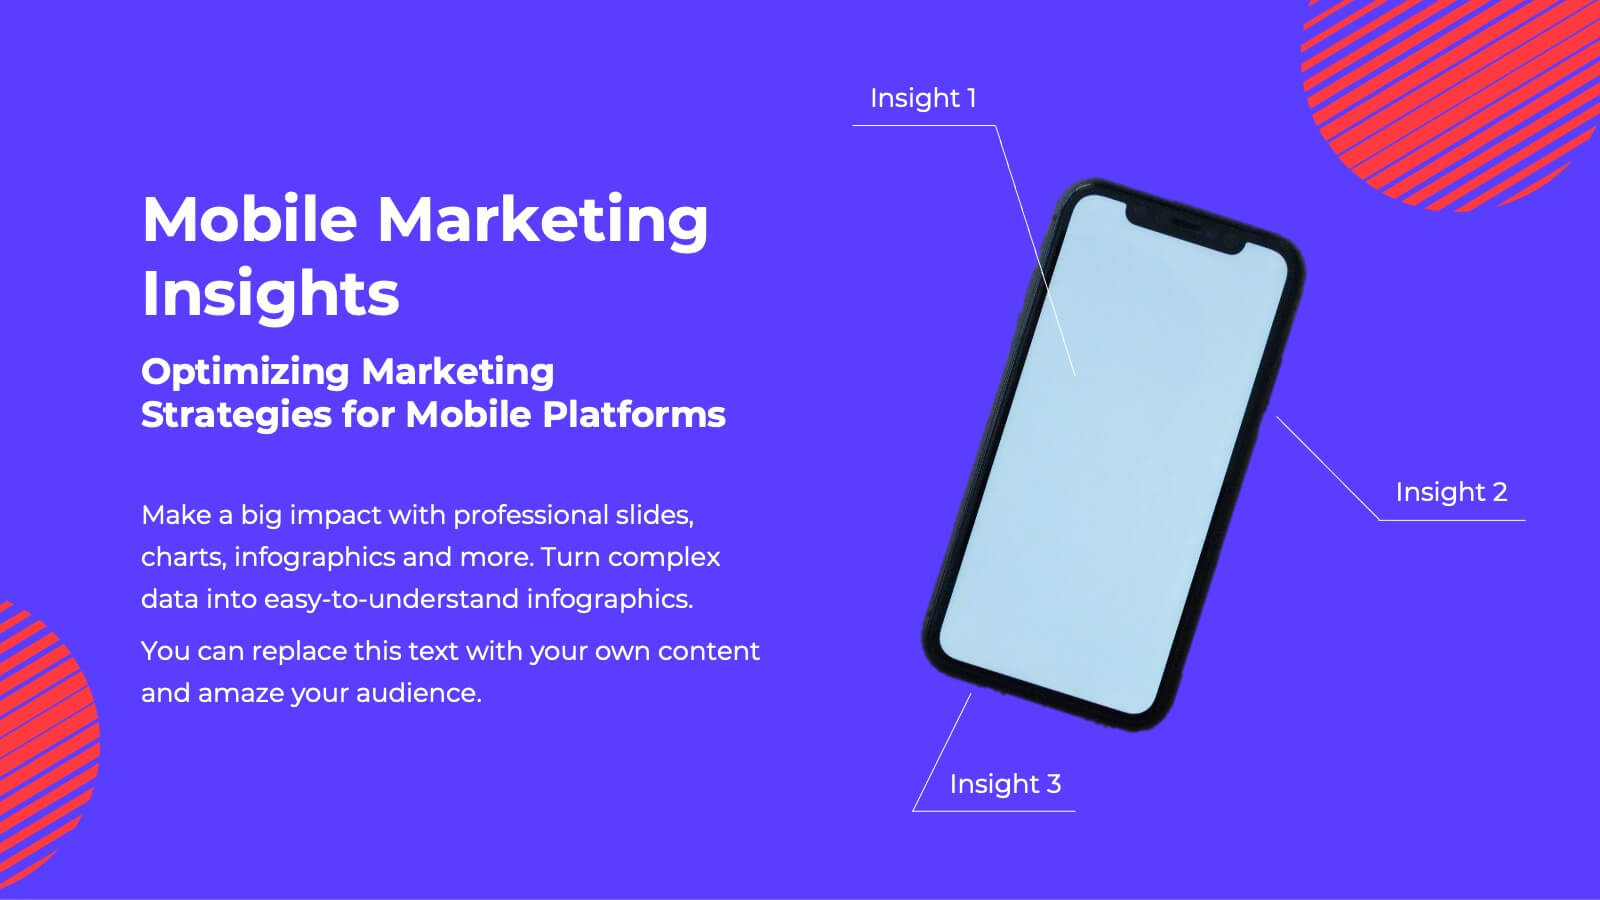
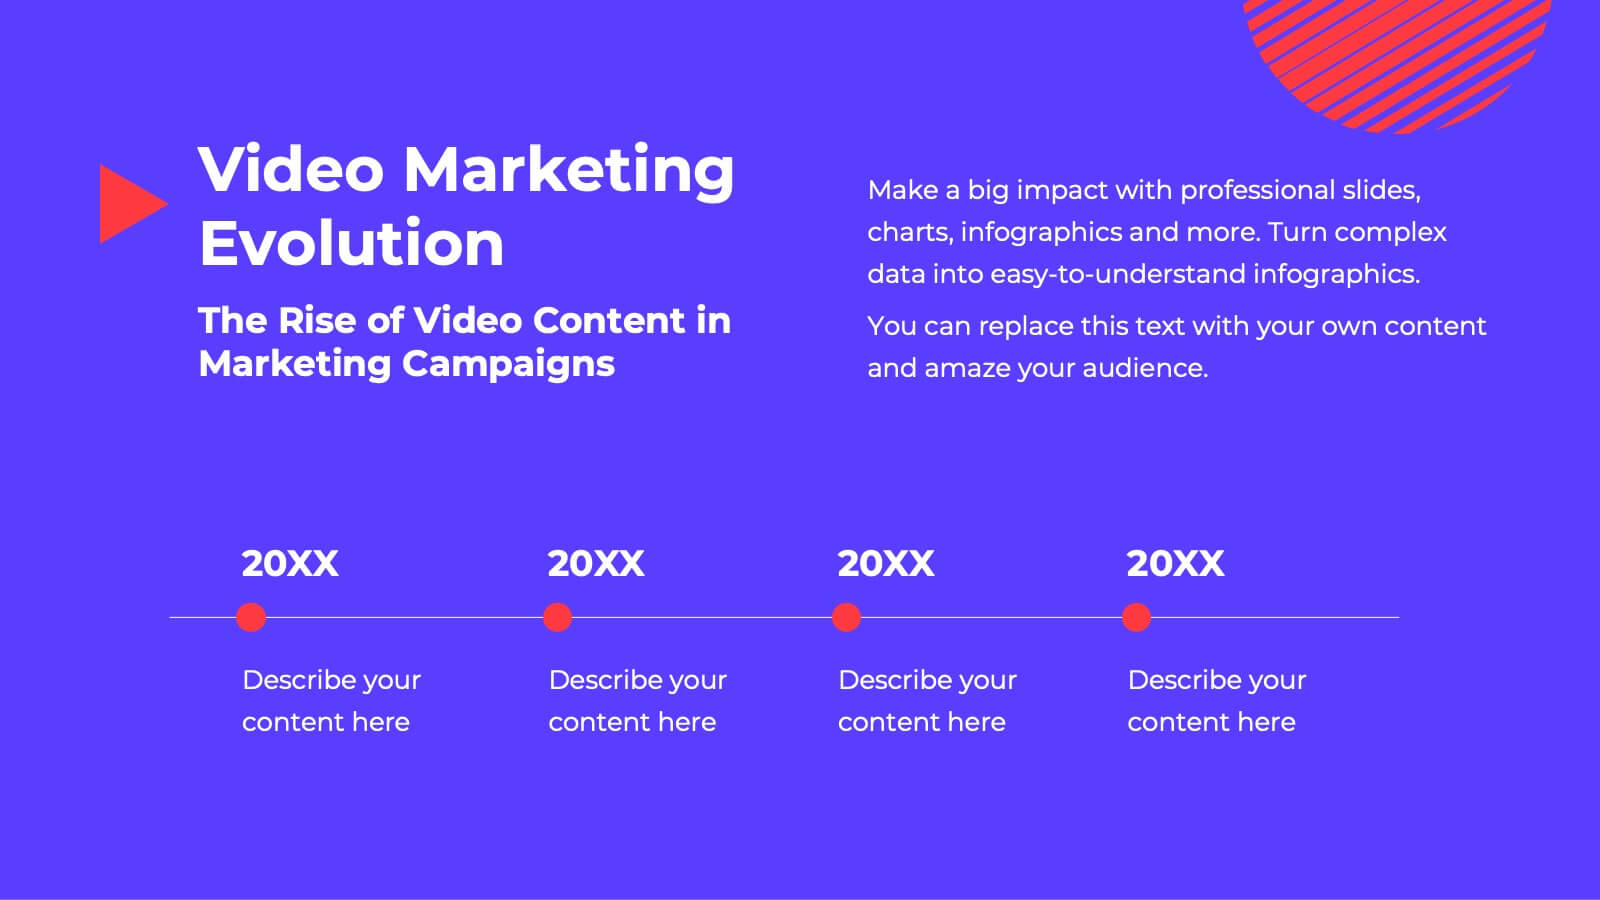
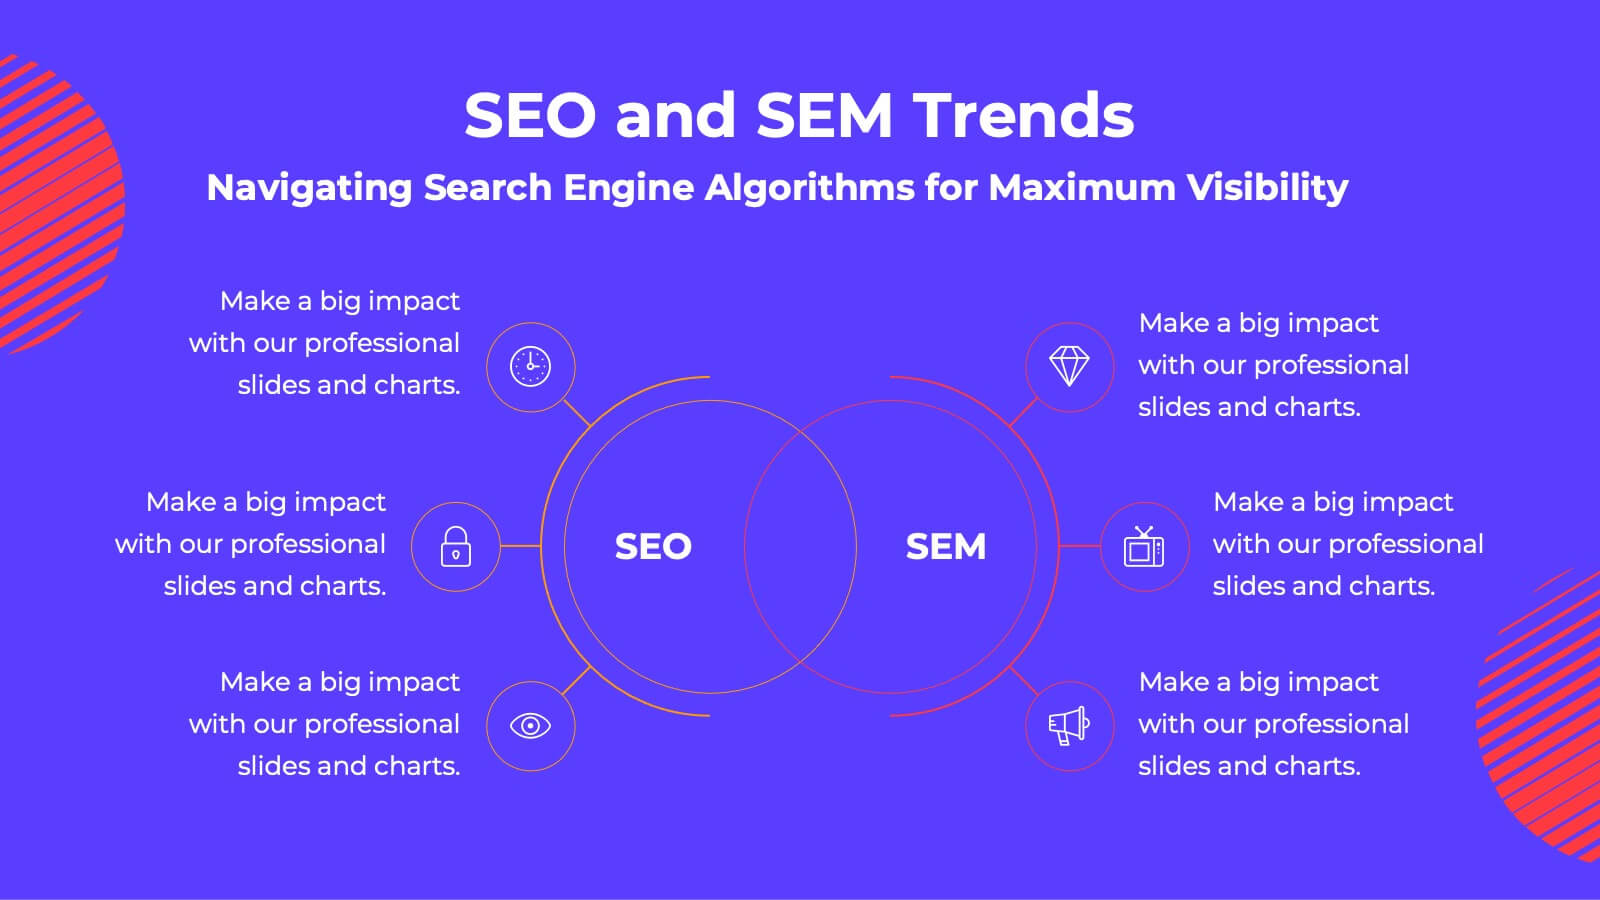
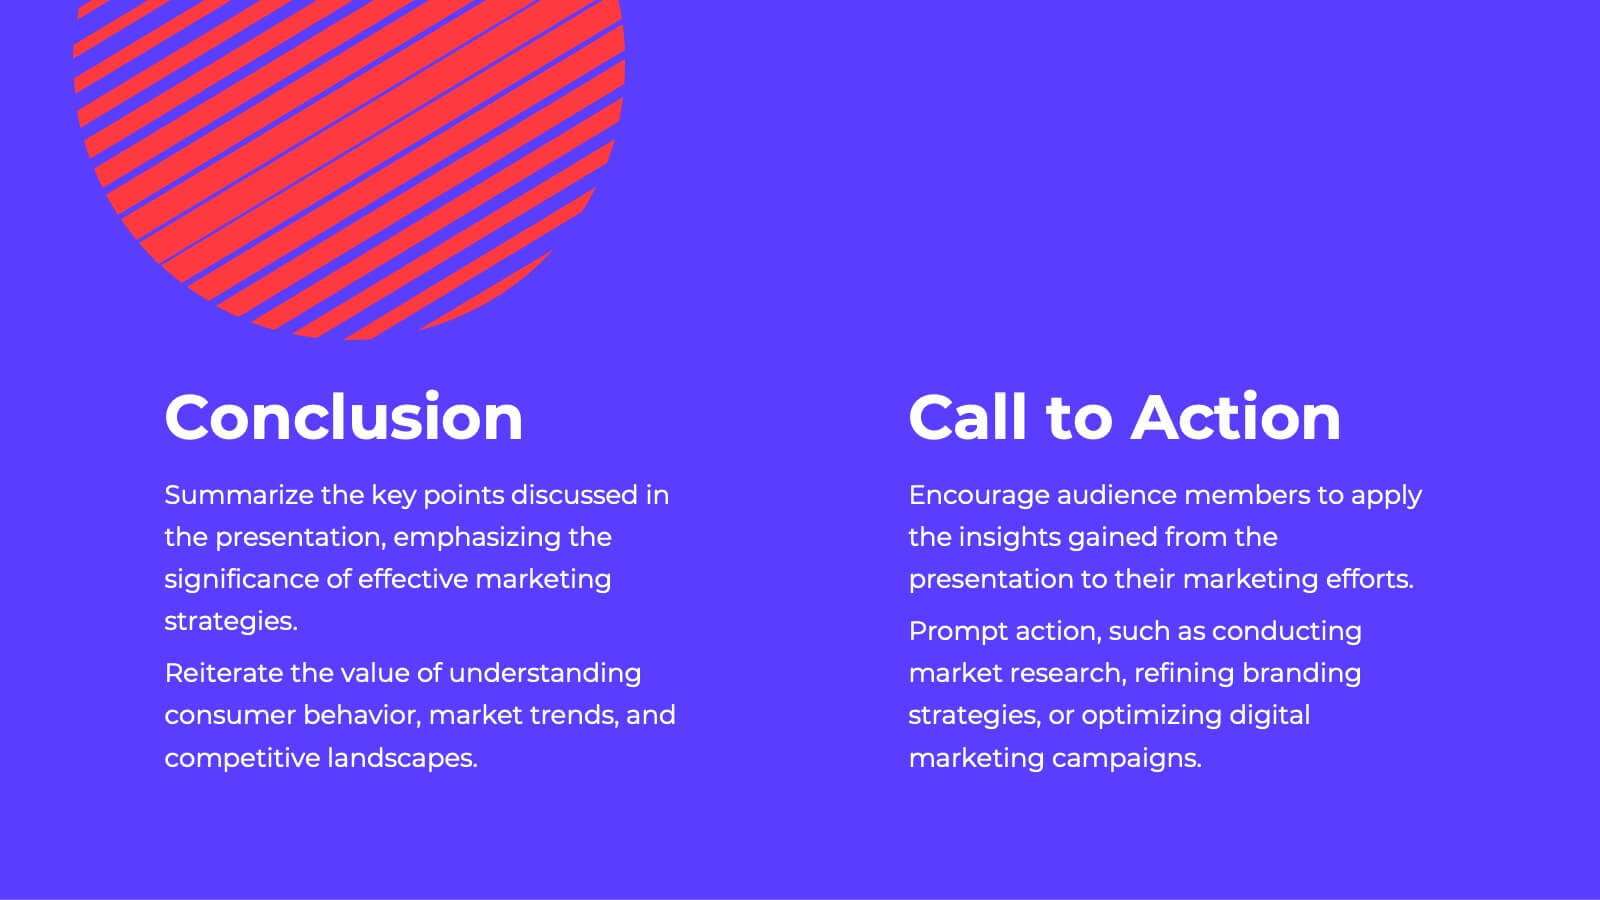
Fusion Marketing Campaign Presentation
Unleash the power of your marketing campaigns with this vibrant marketing campaign template! Dive into social media strategies, influencer marketing, data-driven insights, and more. Perfect for presenting to stakeholders and team members. Fully customizable and compatible with PowerPoint, Keynote, and Google Slides.


6 diapositivas
Creative Interior Design Portfolio Showcase Presentation
Showcase your creativity with the Creative Design Portfolio Showcase presentation. This template is perfect for graphic designers, architects, and creative professionals looking to display their work in a visually compelling format. Featuring modern layouts, high-quality image placeholders, and structured text sections, it allows for easy customization to highlight key insights. Fully compatible with PowerPoint, Keynote, and Google Slides.


7 diapositivas
Best Loyalty Program Infographic
A loyalty program is a structured marketing strategy designed to encourage customers to continue patronizing a business by offering them rewards, discounts, or other incentives based on their repeat purchases or engagement with the brand. This infographic template is a delightful and visually appealing guide to the world of rewarding loyalty. Dive into this vibrant infographic and discover how to spread happiness among your cherished customers through a top-notch loyalty program. Compatible with Powerpoint, Keynote, and Google Slides. Celebrate loyalty and reward your customers in the most delightful way.


21 diapositivas
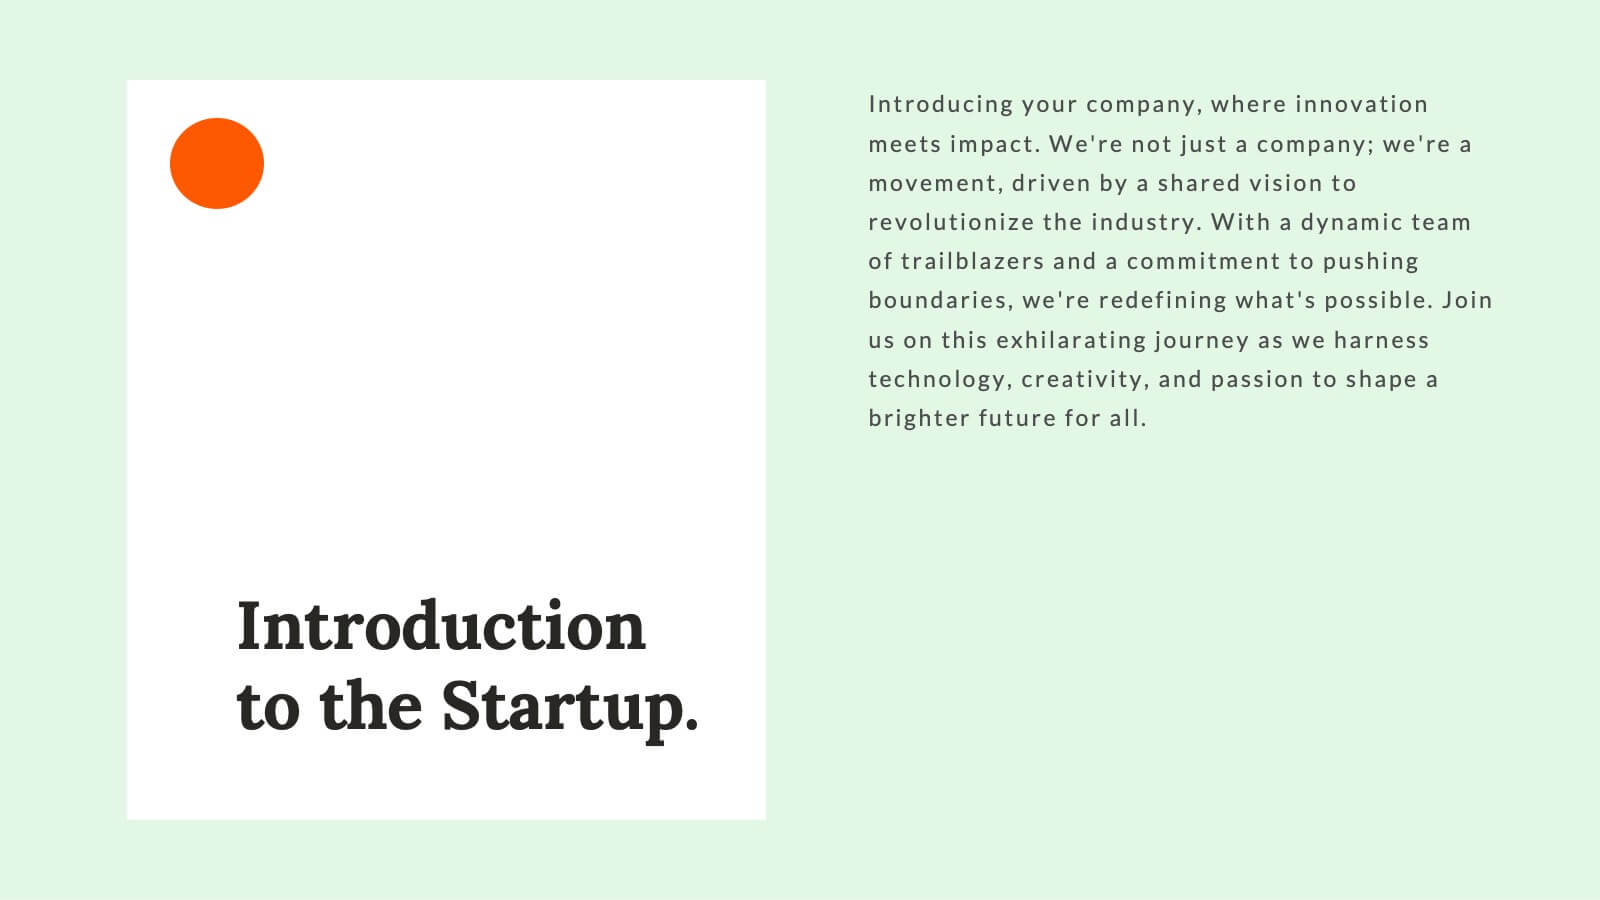
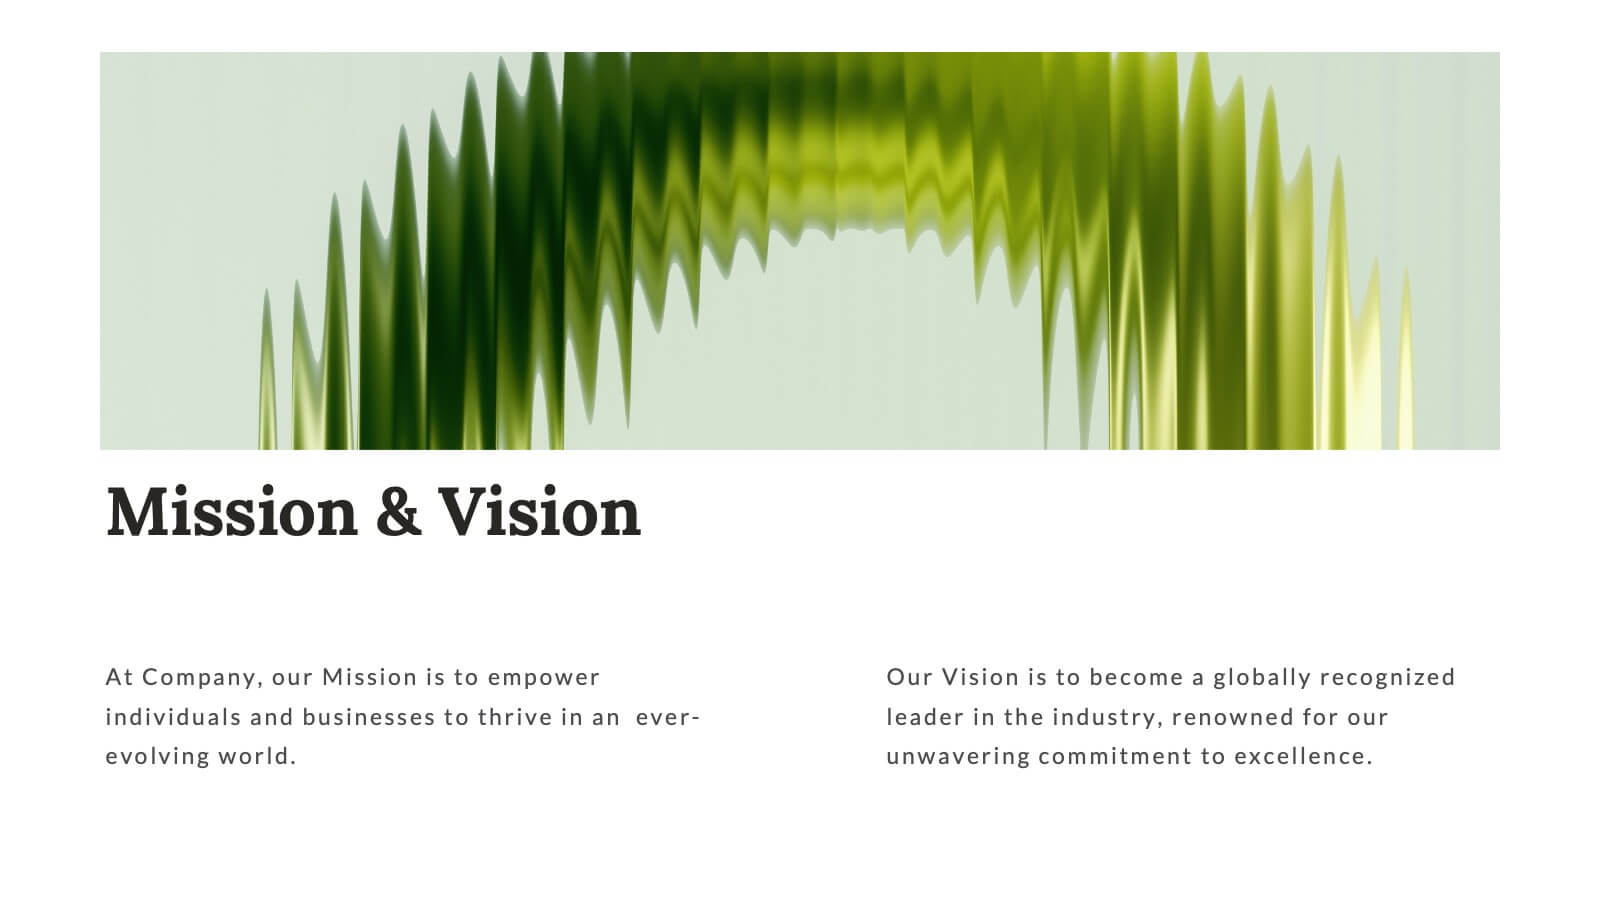
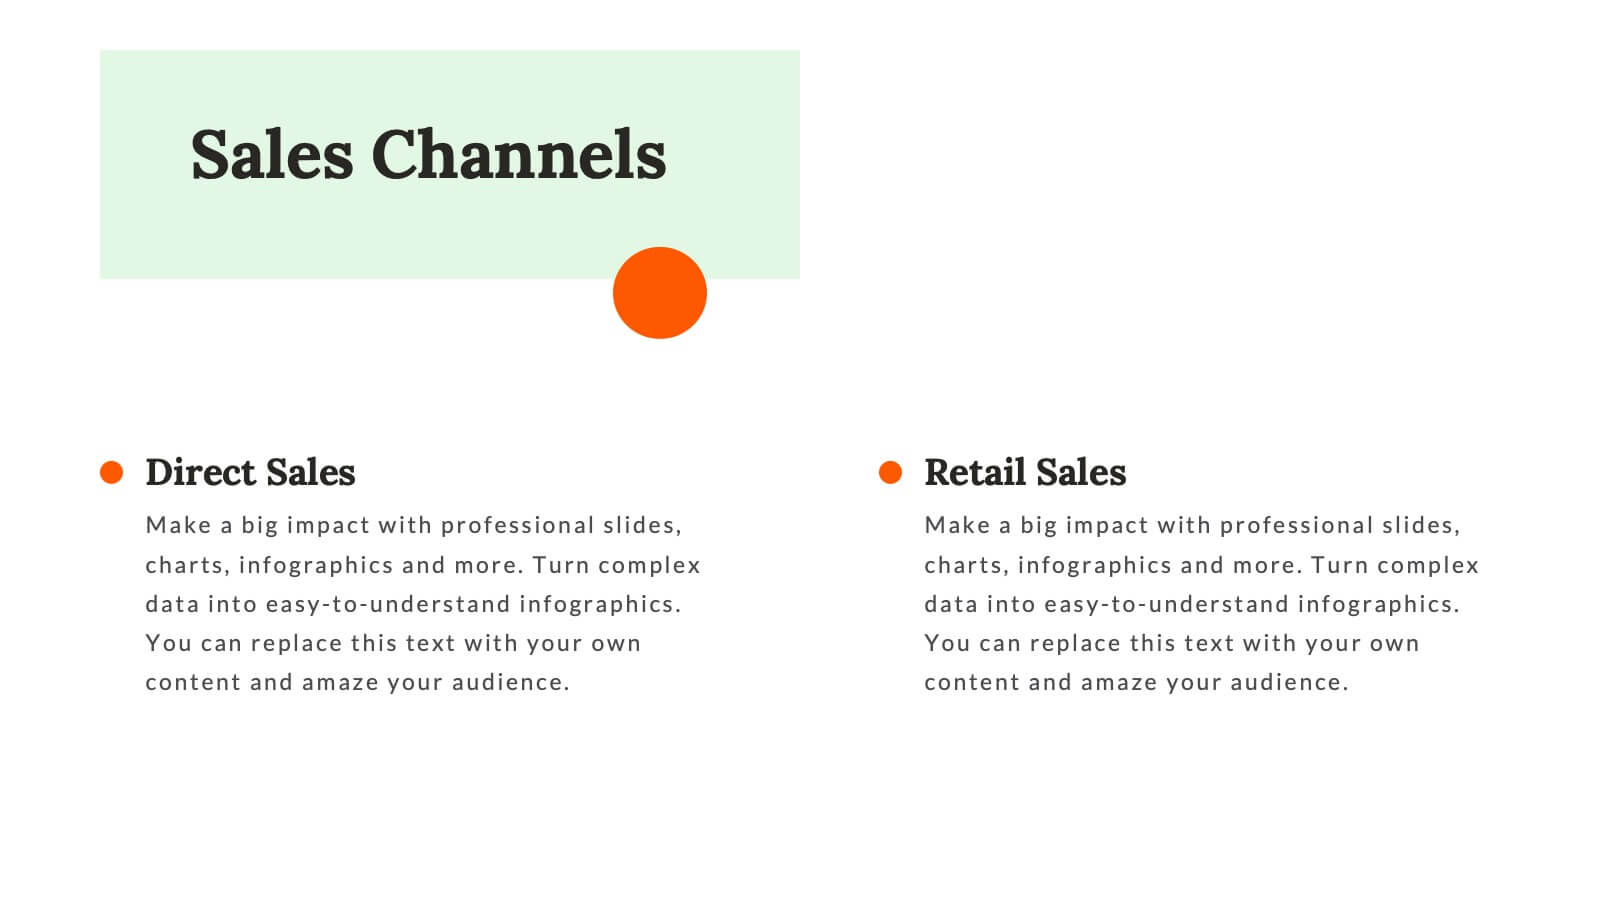
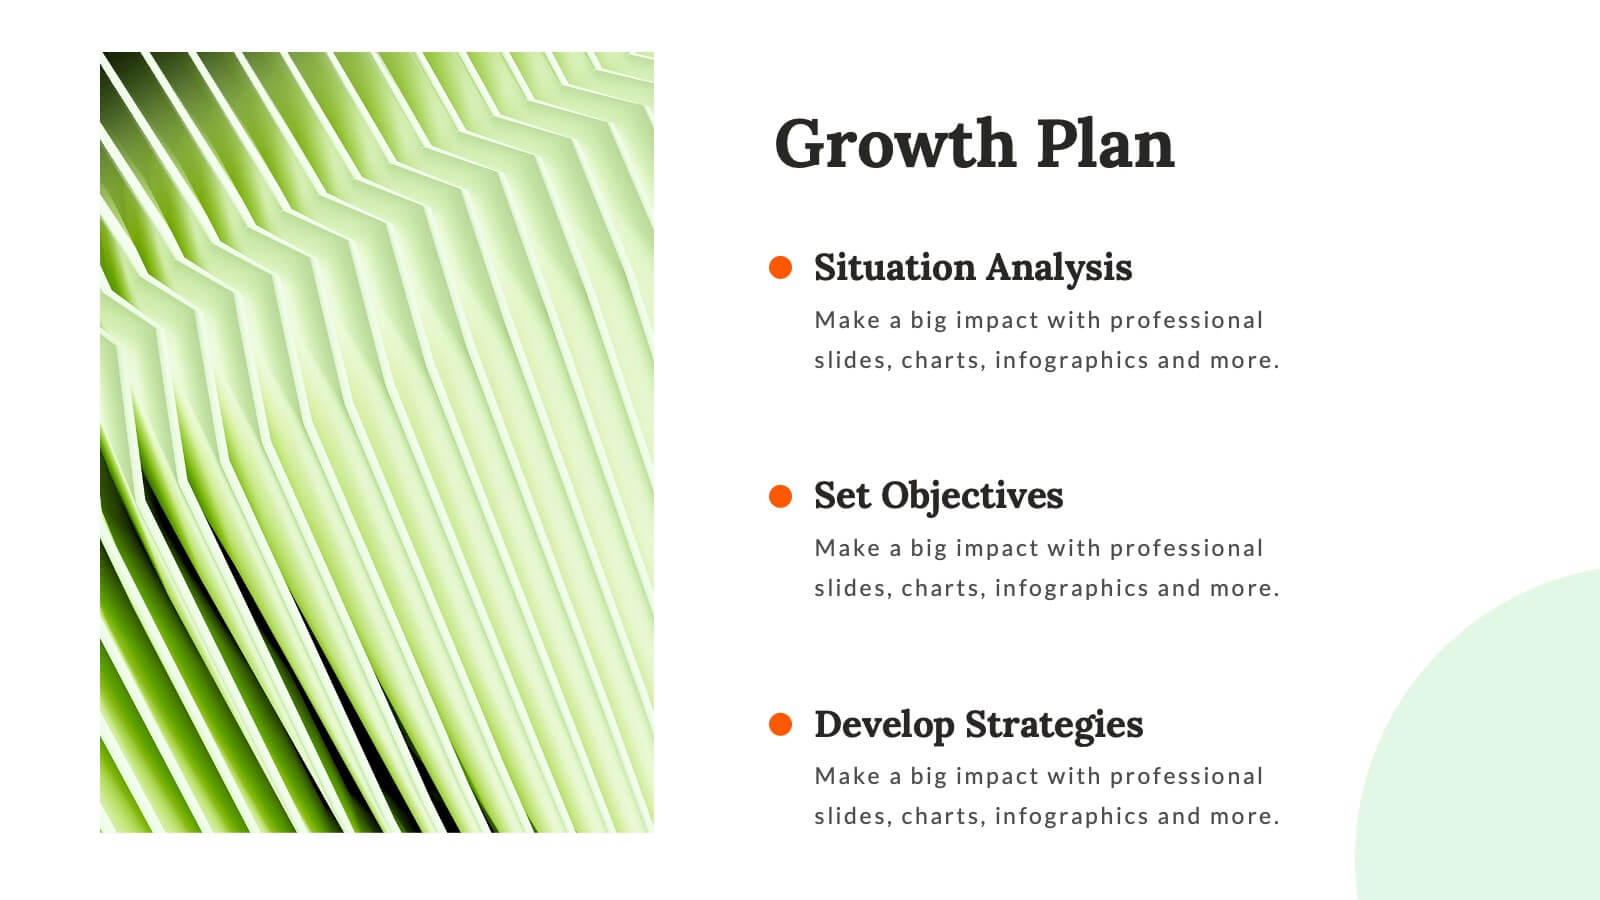
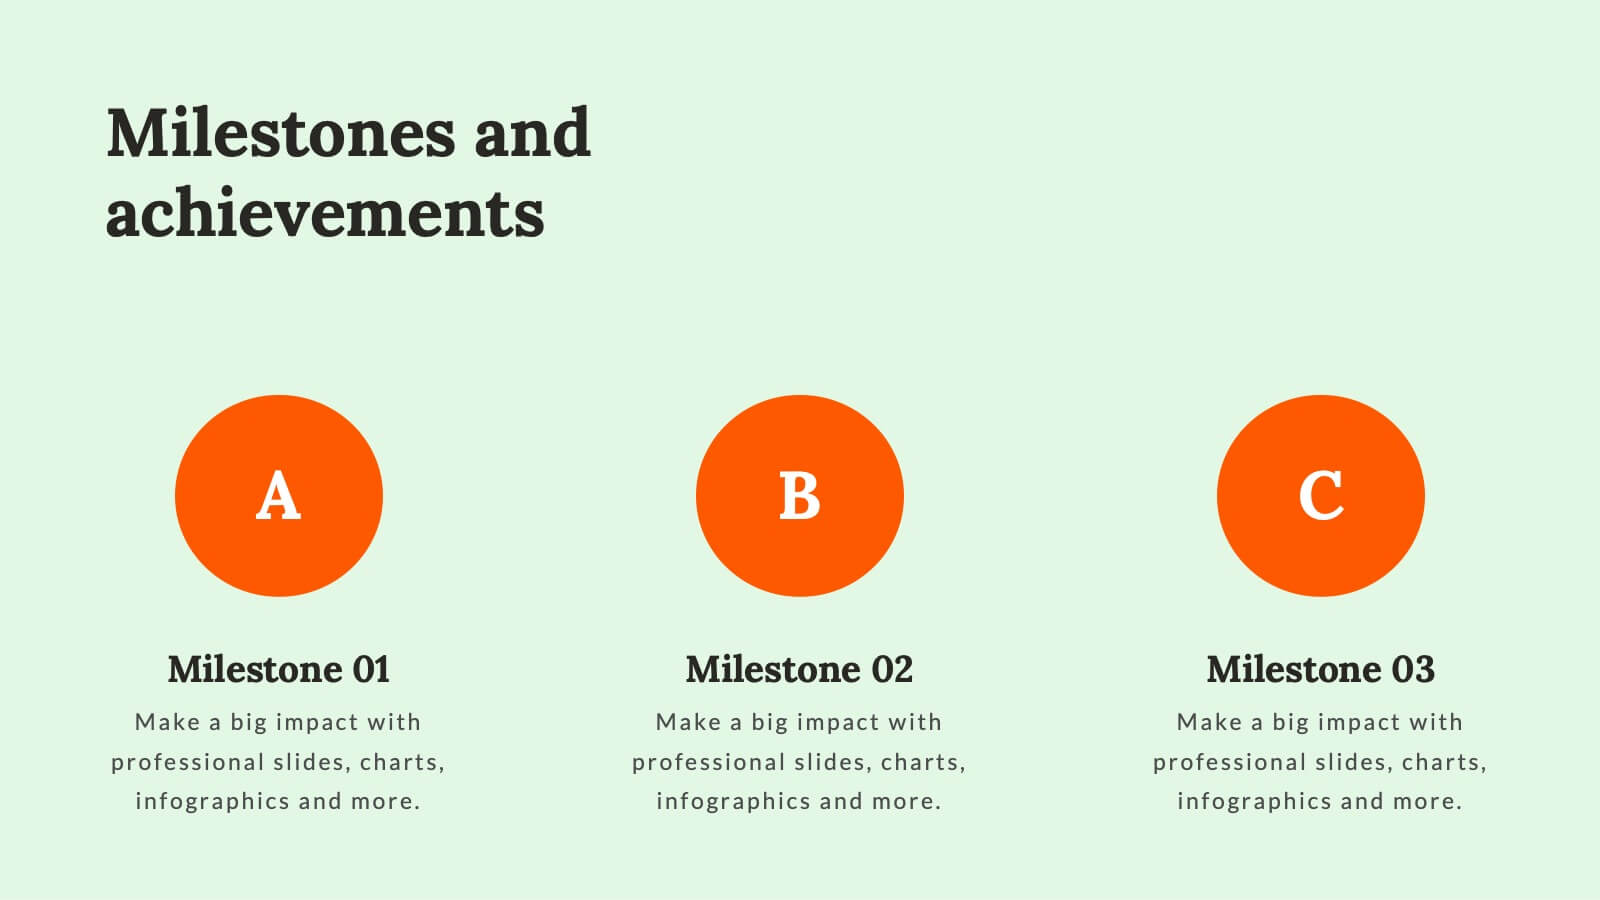
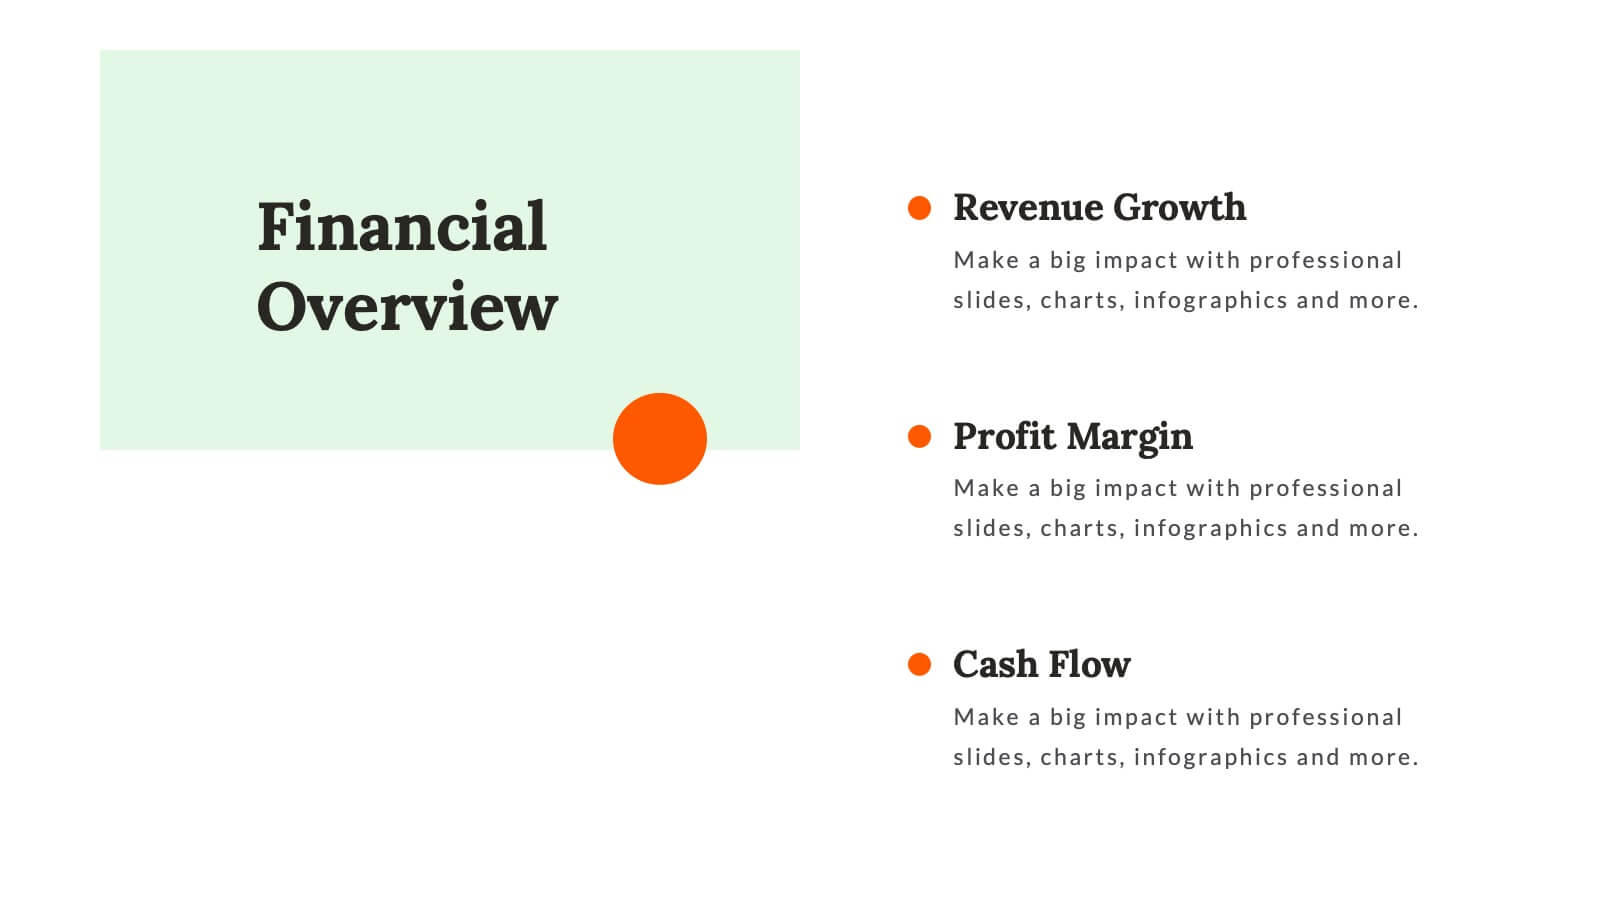
Astral Startup Business Plan Presentation
This sleek and professional Startup Business Plan template is designed to help you convey your startup’s potential to investors and stakeholders effectively. With a minimalist design and a structured flow, it covers all essential aspects of your business plan, from mission and vision to financial overview and growth plan. Each slide is crafted to present critical information in a clear and concise manner, making it easier for your audience to grasp the key points. This template is fully compatible with PowerPoint, Keynote, and Google Slides, allowing you to customize it to suit your branding and presentation style. Use this template to create a compelling and impactful presentation that will leave a lasting impression on your audience.


21 diapositivas
Terraflare Project Status Report Presentation
Keep stakeholders updated with this comprehensive project status report template, featuring agenda, key highlights, performance metrics, project progress, risk assessments, and goals. Easily track progress, strategic initiatives, and team productivity. Perfect for PowerPoint, Keynote, and Google Slides, ensuring clear communication of project updates and priorities.


6 diapositivas
Project Management Skills Infographic
Optimize your project management presentations with our Project Management Skills Infographic. This intuitive template breaks down complex project stages into an easy-to-follow visual flow, perfect for PowerPoint, Google Slides, and Keynote users. Ideal for managers, team leaders, and educators, it emphasizes critical skills in project management. Customize each segment with your milestones, timelines, or skill requirements. Its sleek design and adaptable format make it a go-to for illustrating project roadmaps and management strategies. Equip your audience with a clear understanding of project dynamics and foster a collaborative environment with this essential tool.


20 diapositivas
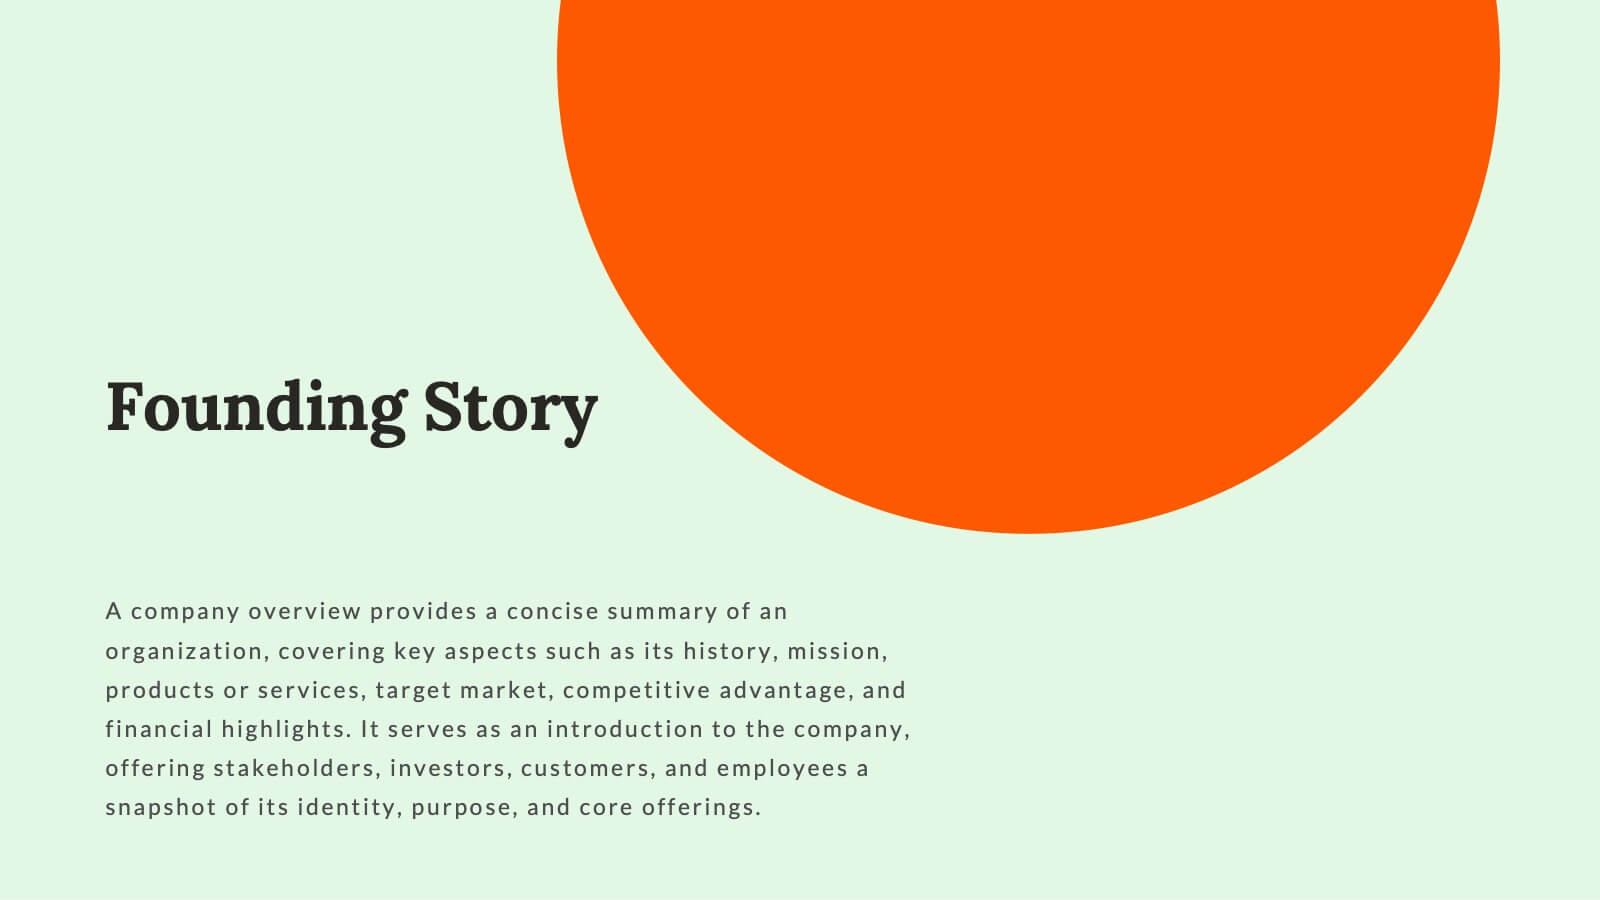
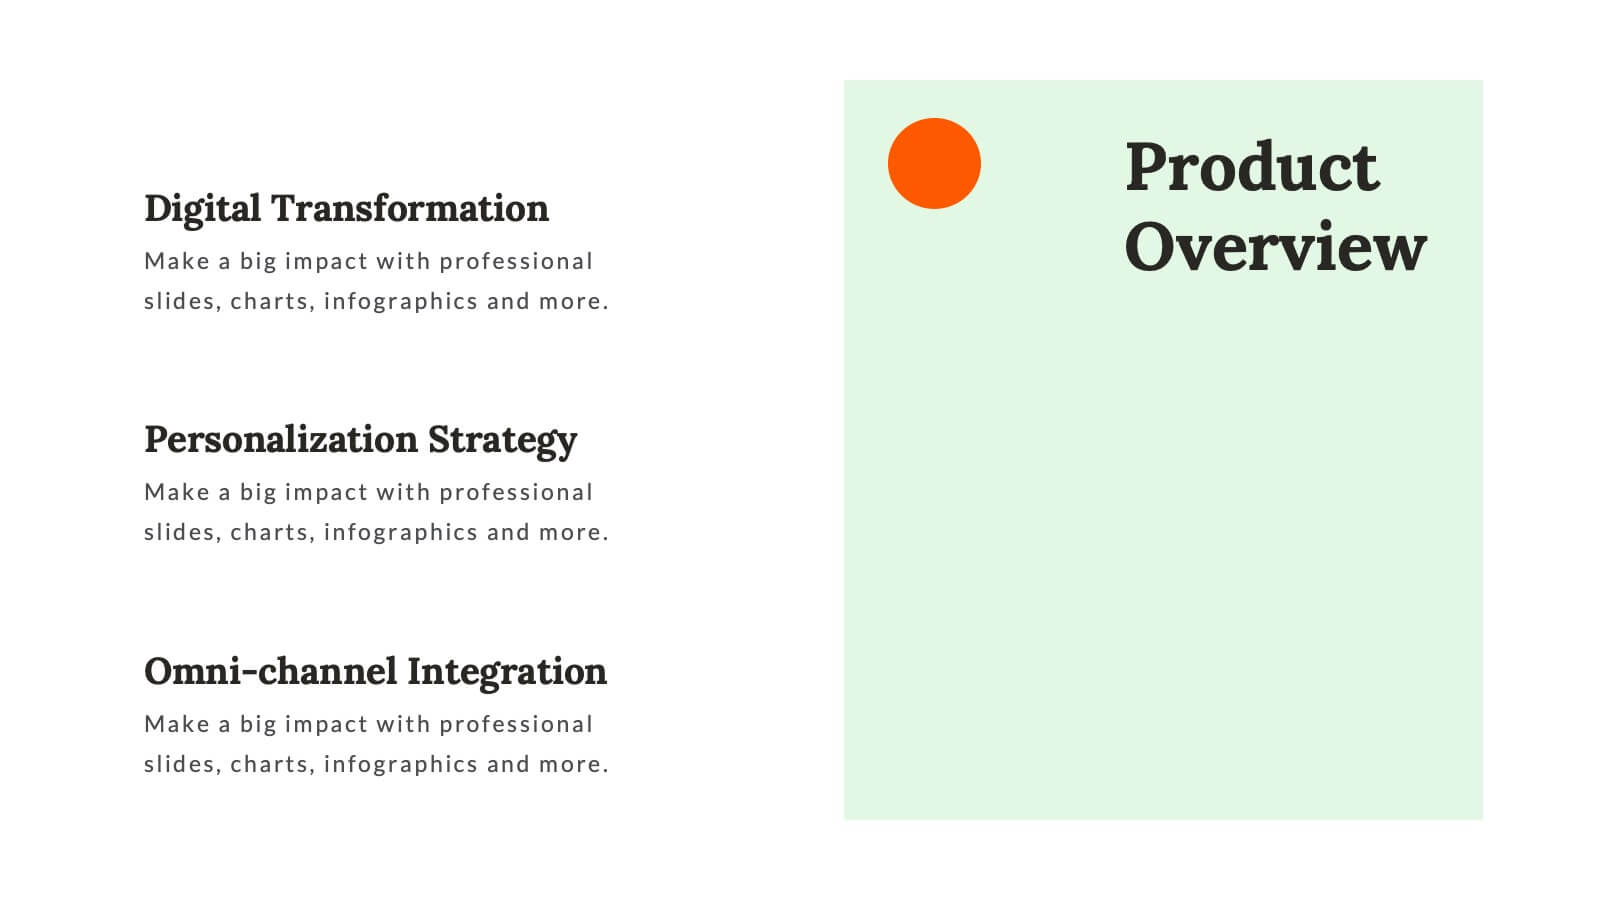
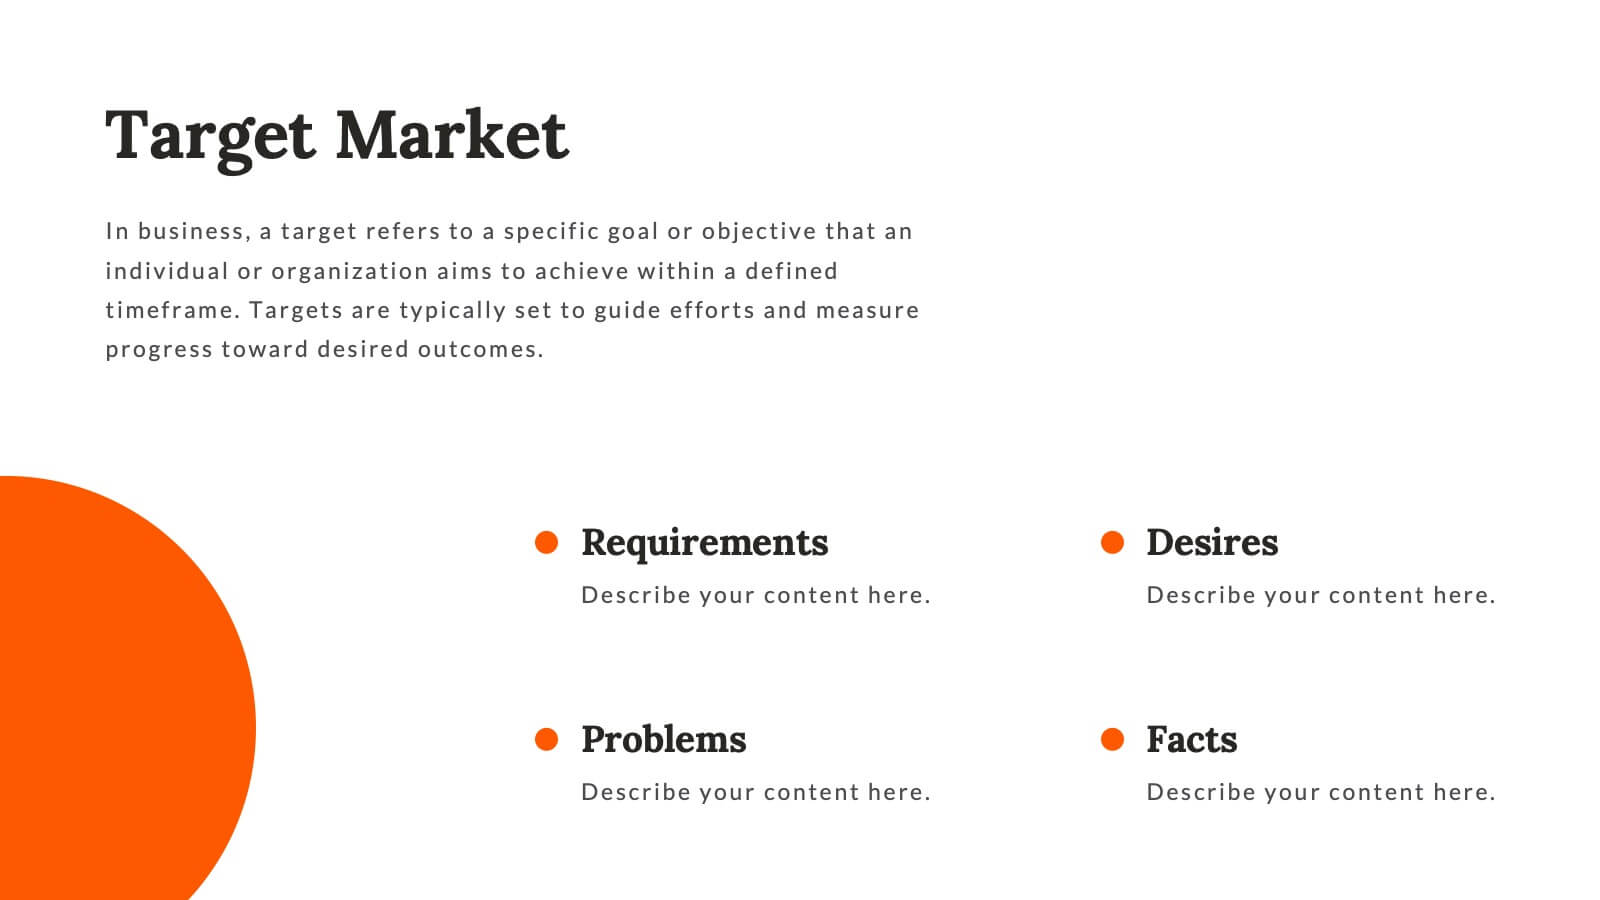
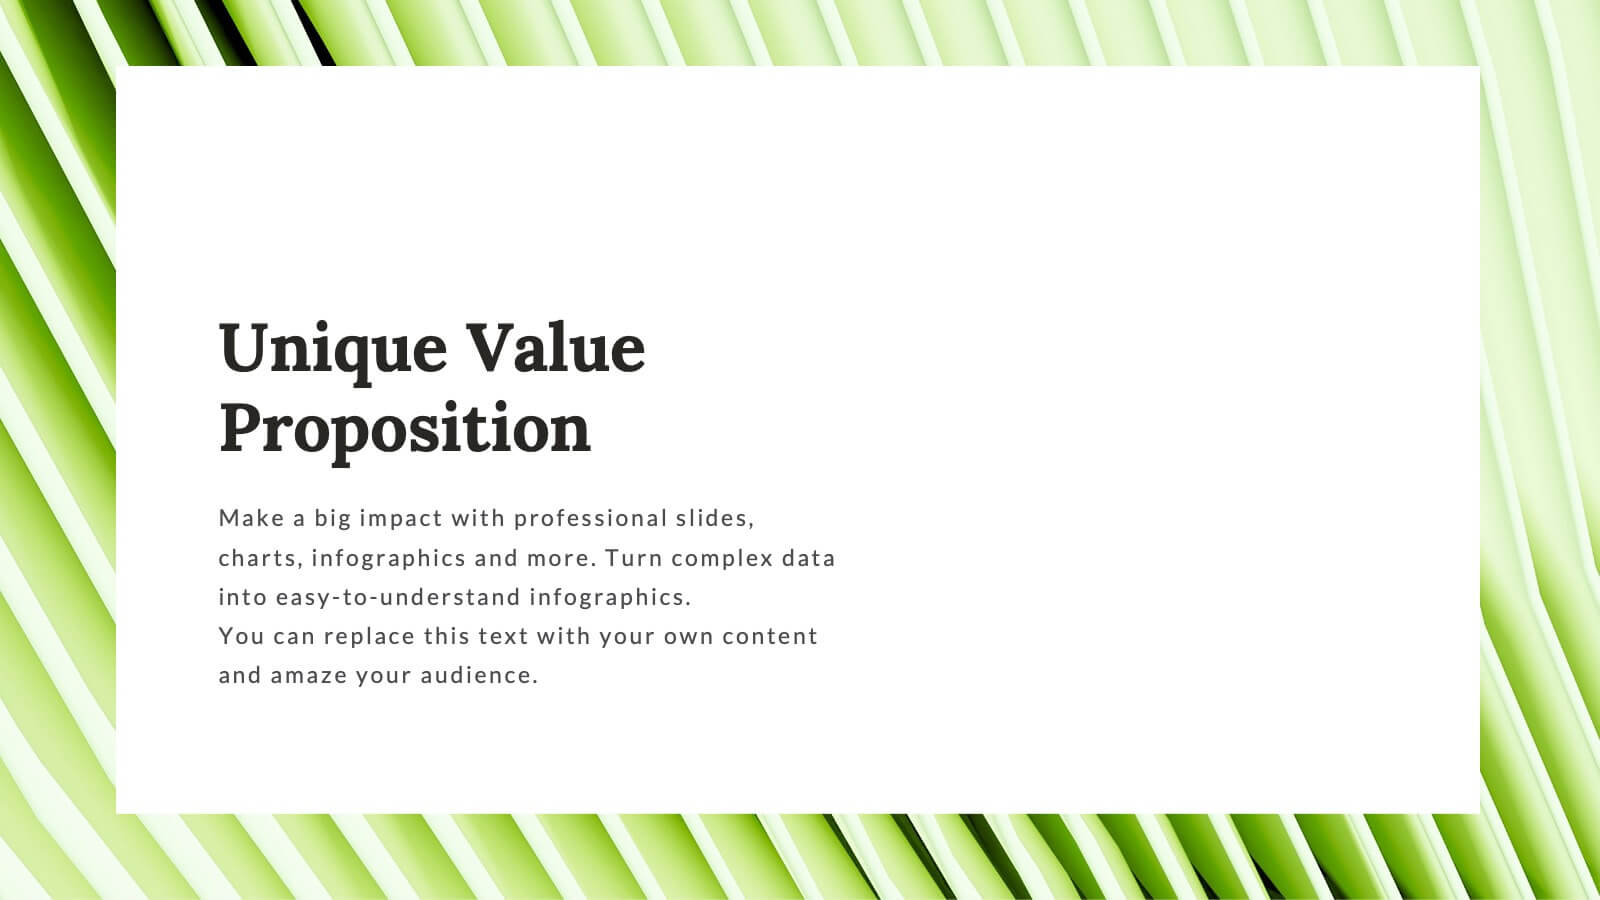
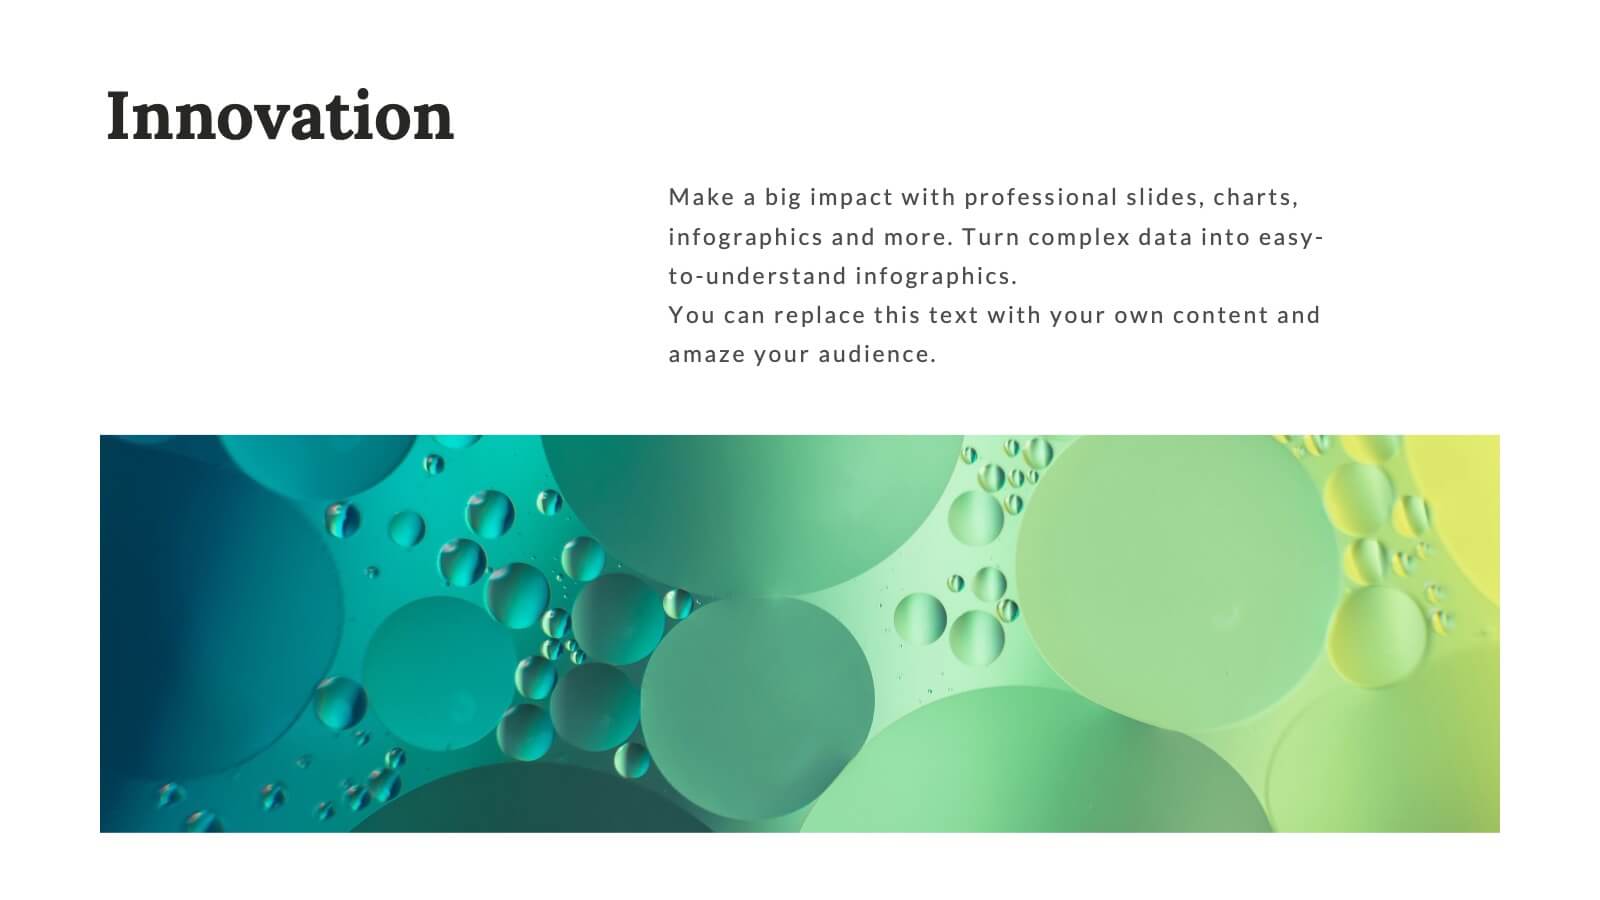
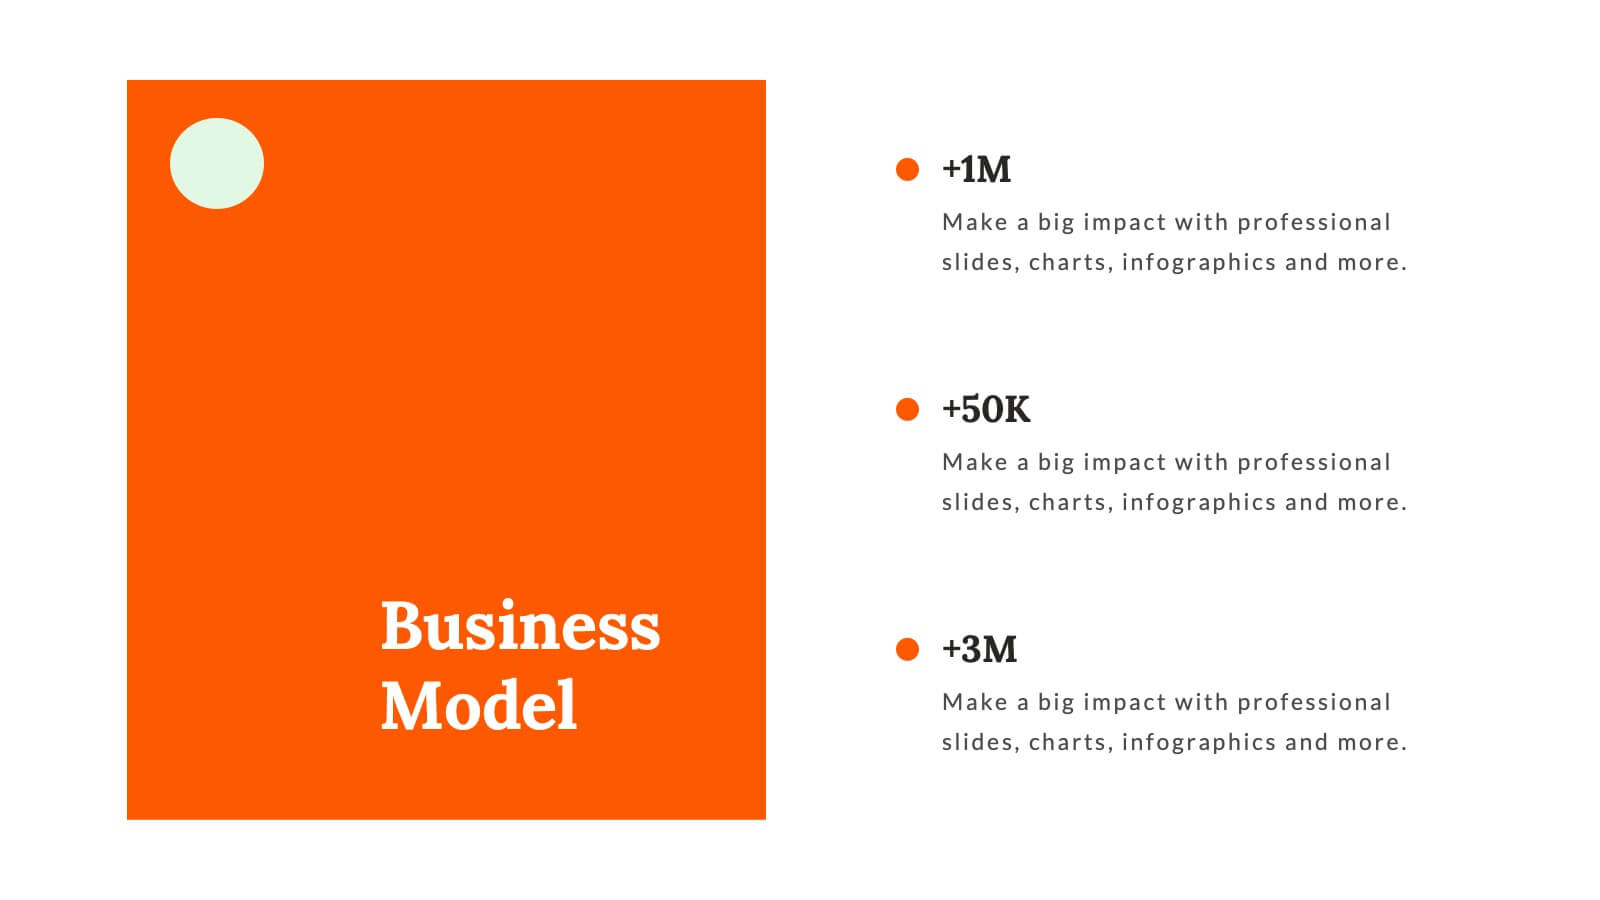
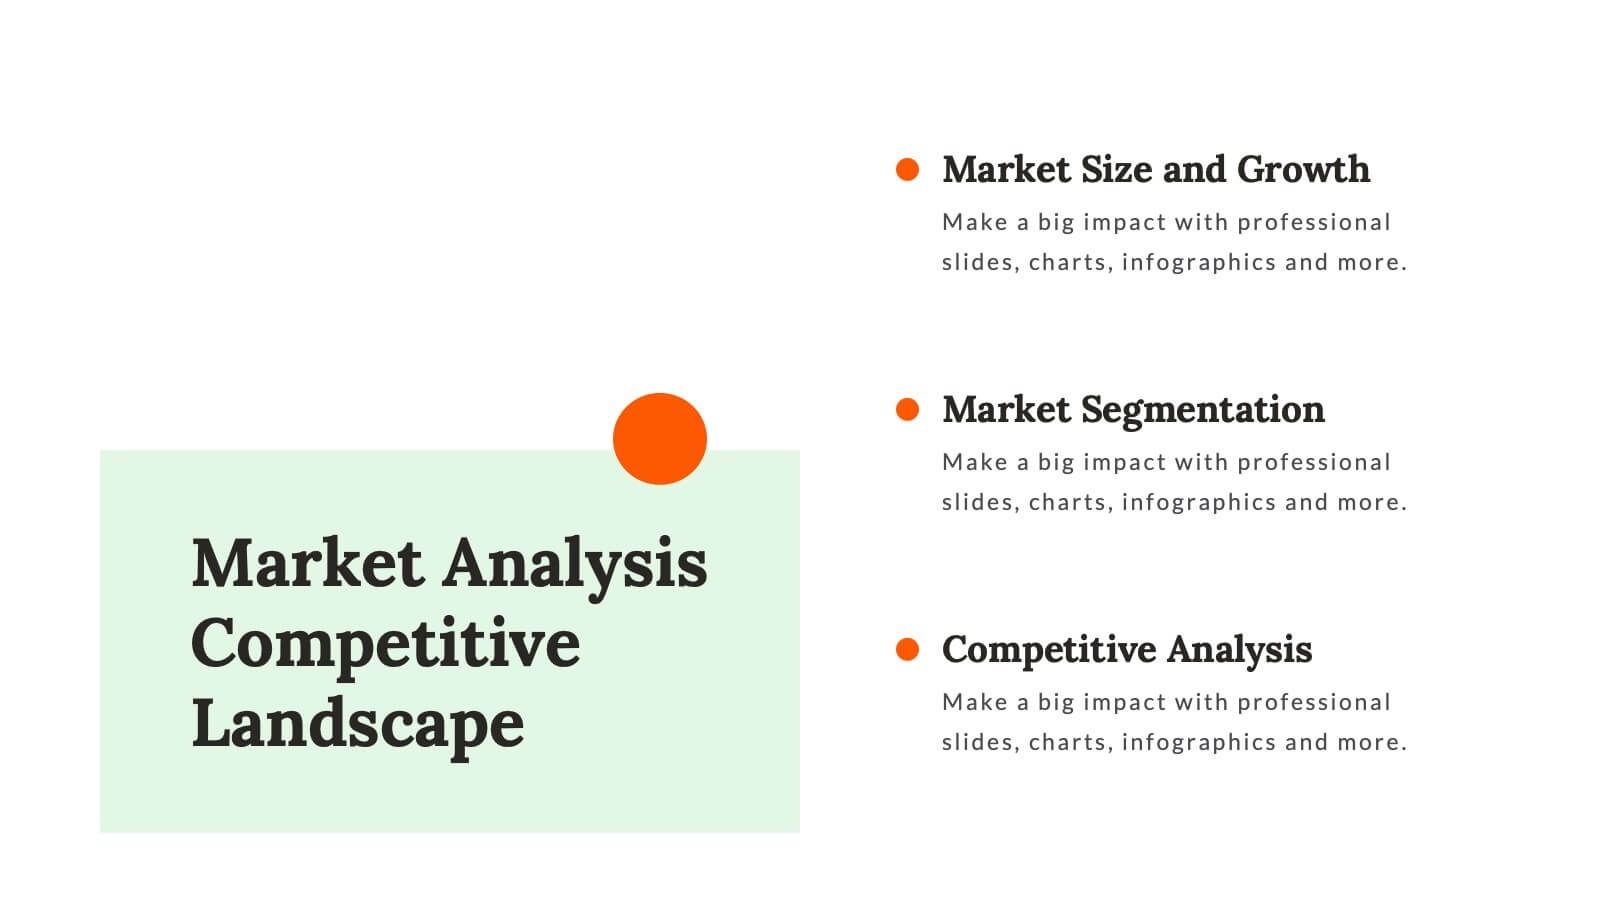
Whirlwind Startup Funding Proposal Presentation
Transform your startup funding proposals with this vibrant and professional template. Designed to impress potential investors, it features sections for mission & vision, founding story, market analysis, and financial overview. Highlight your unique value proposition and business model with clarity and style. This template is compatible with PowerPoint, Keynote, and Google Slides, ensuring seamless presentations on any platform. Perfect for conveying your innovative ideas and growth plans effectively.


7 diapositivas
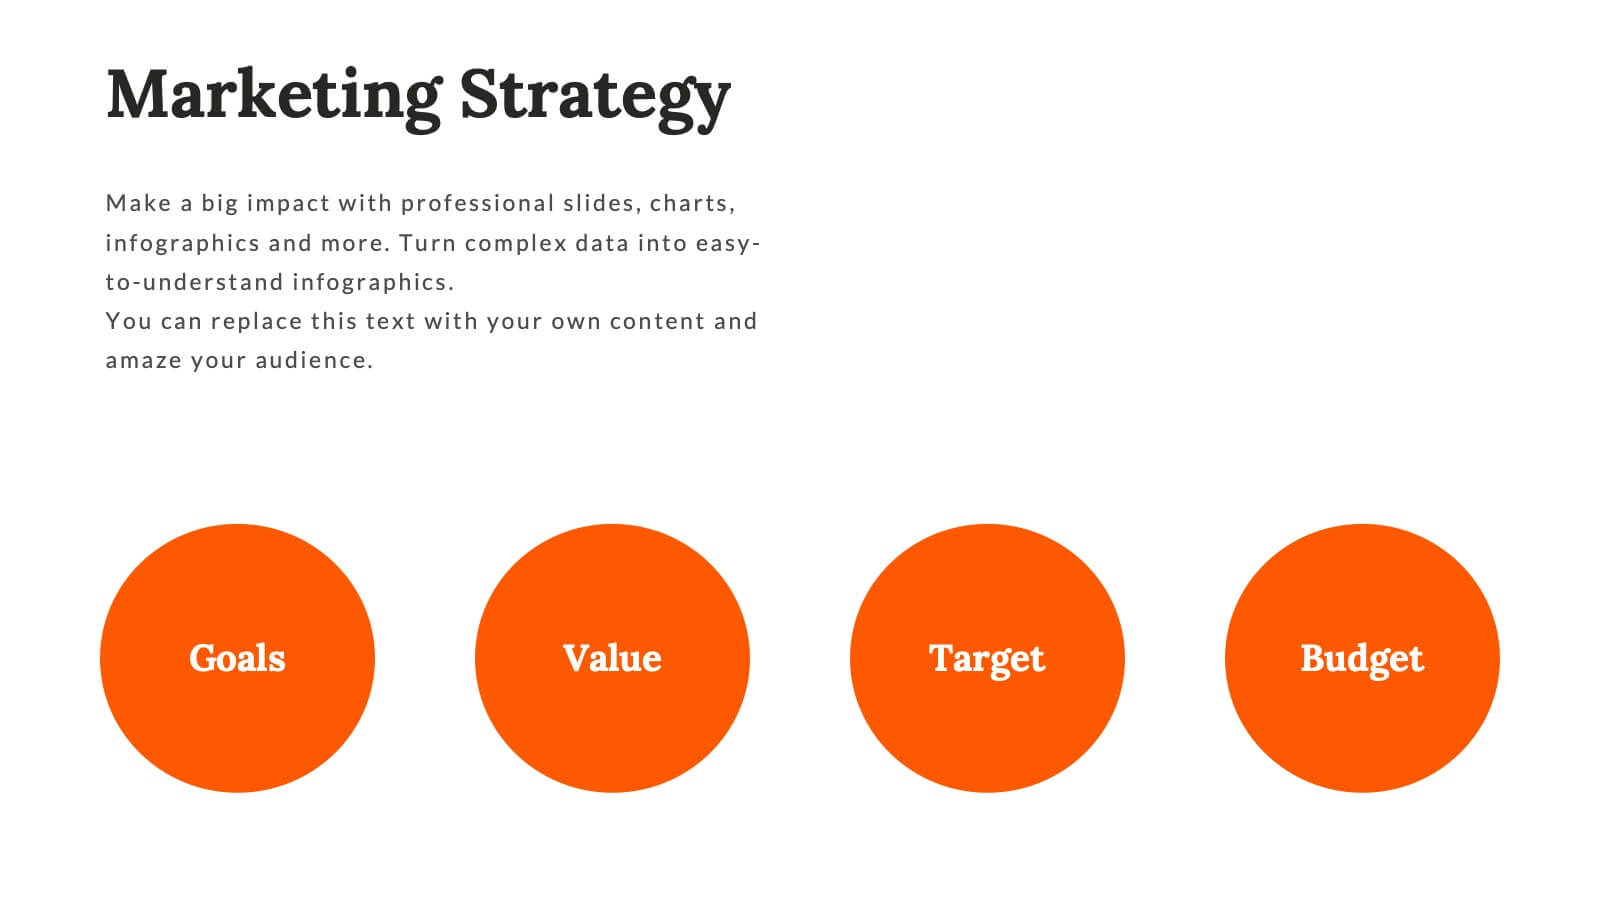
Marketing Strategy Wheel Infographic
Our Marketing Strategy Wheel Infographic is an invaluable asset for marketers, strategists, and business leaders. This visual tool is designed to outline the multi-faceted approach required for a successful marketing strategy, incorporating various elements that contribute to a comprehensive marketing plan. The infographic displays sections like market analysis, goal setting, budget allocation, and action plans in a circular layout, symbolizing the interconnected nature of marketing efforts. By presenting these components, the infographic serves as a guide for developing a balanced and effective marketing strategy. You can tailor this infographic to include specific tactics, channels, and metrics relevant to your organization, making it a versatile tool for internal strategy sessions, client presentations, or marketing education. This SEO-optimized graphic is crafted to communicate complex marketing plans in an accessible and engaging manner. Use our Marketing Strategy Wheel Infographic to visually communicate your marketing plan's structure and components, ensuring a holistic approach to reaching your business objectives.


7 diapositivas
Healthy Food Infographic
Healthy food is of paramount importance for overall well-being and a good quality of life. This infographic template aims to promote understanding and adoption of a healthy diet through a visually appealing and informative layout. This template is designed to showcase a balanced and nutritious diet by educating individuals on healthy food choices, portion control, and incorporating superfoods into their meals. This infographic is fully customizable and compatible with Powerpoint, Keynote, and Google Slides. This allows you to easily customize, add visuals, and design as per your needs and preferences.


22 diapositivas
SEO Report Presentation
Optimize your SEO strategies using our comprehensive SEO Report template. It includes sections for keyword performance, market trends, competitor insights, and client feedback. Tailored for digital marketers and SEO specialists, this template supports presentations in PowerPoint, Keynote, and Google Slides.


4 diapositivas
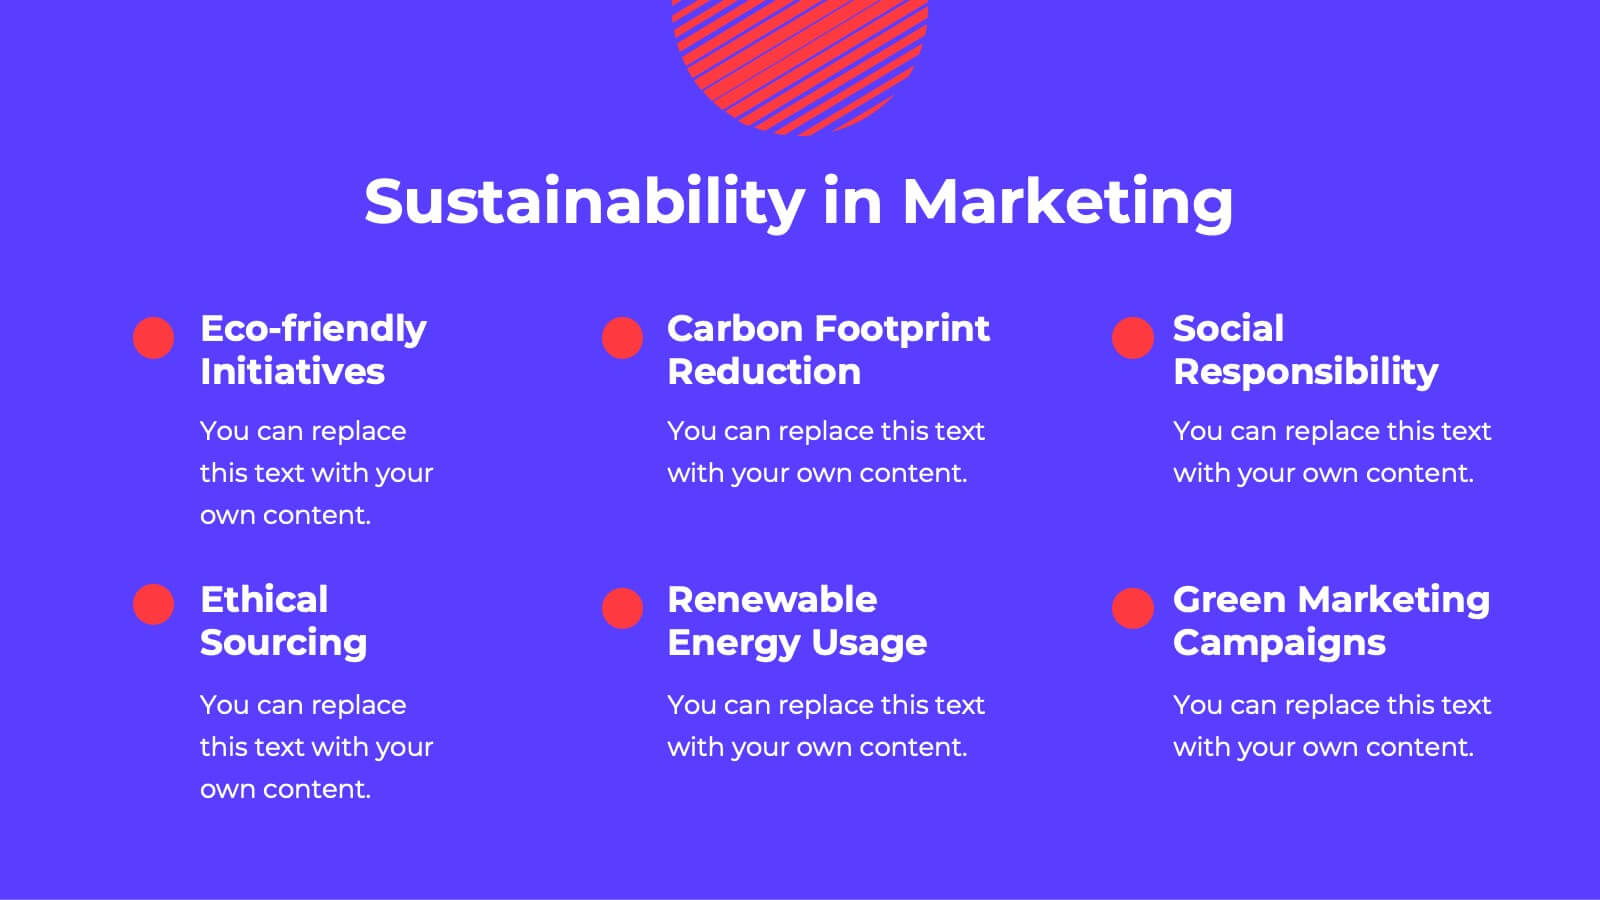
Green Initiatives & Climate Strategy Presentation
Highlight your sustainability roadmap with the Green Initiatives & Climate Strategy Presentation. Designed with a quadrant tree layout, this slide communicates four key environmental focus areas. Ideal for eco-friendly proposals, CSR updates, or climate reports. Fully customizable in PowerPoint, Keynote, and Google Slides—perfect for green strategies, goals, or impact summaries.


7 diapositivas
Project Stakeholder Analysis Infographic
Stakeholder analysis is a technique used in project management and organizational strategy to identify and understand the interests, influence, and impact of individuals or organizations that can significantly affect or be affected by a project or decision. This infographic template is your compass to navigating the intricate landscape of stakeholders, understanding their influence, and engaging them effectively for project success. Compatible with Powerpoint, Keynote, and Google Slides. The vibrant design and strategic insights of our template will empower you to navigate the stakeholder cosmos and steer your project towards triumph.


7 diapositivas
Oceania Countries Map Infographic
Set sail on an informative voyage across the enchanting islands of Oceania with our meticulously crafted map infographic. Dressed in the pristine shades of white, the vastness of blue, the lushness of green, and the richness of gold, our template encapsulates the beauty and diversity of Oceania's countries. Outfitted with pinpoint infographics, emblematic icons, and island-specific image placeholders, it offers a holistic view of this unique region. Expertly configured for Powerpoint, Keynote, or Google Slides. An essential compass for educators, geographers, or businesses exploring the Oceania market. Journey with knowledge; let each slide be a revelation of Oceania's splendors.


6 diapositivas
RAPID Responsibility Matrix Infographics
Efficiently manage responsibilities and tasks with our RAPID Responsibility Matrix infographic template. This template is fully compatible with popular presentation software such as PowerPoint, Keynote, and Google Slides, allowing you to easily customize it to meet your specific project needs. The RAPID Responsibility Matrix infographic template offers a structured framework for defining roles and responsibilities within your team or organization. Whether you're a project manager, team leader, or simply looking to streamline workflows, this template provides a user-friendly platform to create clear and concise matrices for your projects. Optimize your project management processes with this SEO-optimized RAPID Responsibility Matrix infographic template, thoughtfully designed for clarity and ease of use. Customize it to assign and communicate responsibilities effectively, ensuring smooth collaboration and project success. Start crafting your personalized infographic today!


6 diapositivas
Corporate Performance Annual Report
Present key business metrics with precision using this Corporate Performance Annual Report slide. Designed with progress bars and intuitive icons, this layout clearly communicates departmental or project-based performance. Ideal for year-end reviews, board meetings, and investor updates. Fully editable in PowerPoint, Keynote, and Google Slides.


6 diapositivas
Country Highlight Map North America Presentation
Showcase your regional focus with a clean, data-driven map that highlights key areas across the United States. Perfect for presenting business coverage, demographic data, or strategic expansion points, this layout keeps visuals sharp and organized. Fully compatible with PowerPoint, Keynote, and Google Slides for effortless customization and presentation.