


Características


¿Tienes alguna pregunta?
Recomendar


5 diapositivas
TAM SAM SOM Markets Analysis Presentation
Turn complex market insights into clear, visual storytelling with this dynamic layered presentation. Ideal for demonstrating market potential, target segments, and opportunity scope, it helps you communicate data with structure and impact. Fully compatible with PowerPoint, Keynote, and Google Slides for effortless editing and professional, presentation-ready results.


6 diapositivas
Executive Leadership Training Presentation
Enhance professional development with this executive leadership training template, designed with a step-by-step staircase layout symbolizing career progression. Perfect for leadership programs, corporate training, and skill-building workshops, it visually organizes six key topics for clarity. Fully editable in Canva, PowerPoint, or Google Slides, making customization effortless for any organization’s needs.


4 diapositivas
Economic Impact on Stock Market
Visualize financial cause and effect with this step-by-step economic impact infographic. Ideal for explaining market trends, policy changes, or fiscal outcomes, this slide uses a four-part arrow path starting with a money bag icon. Each stage—A to D—can be customized with data and analysis. Fully editable in PowerPoint, Keynote, and Google Slides.


21 diapositivas
Starchime UX Case Study Presentation
Showcase your UX design process with this case study template, covering research, user journey mapping, wireframes, and usability testing. Ideal for presenting design insights and outcomes. Compatible with PowerPoint, Keynote, and Google Slides, it’s perfect for a clear, professional, and impactful UX design presentation.


2 diapositivas
Creative Presentation Opening Title Slides
Step into a world of innovation with the "Creative Presentation" title slides, where vibrant geometric shapes meet clean, modern design. Perfect for showcasing your ideas and transforming them into impactful solutions, these slides set the stage for inspiration. Compatible with PowerPoint, Keynote, and Google Slides, they're ideal for anyone looking to make a memorable impression.


6 diapositivas
Event and Meeting Schedule Calendar Presentation
Simplify your weekly planning with this modern and visually intuitive event calendar template. Featuring a clean grid layout, this presentation allows you to organize key meetings, deadlines, or project highlights across six weeks. Each week is color-coded for quick reference, and each event box is fully editable to include titles and custom notes. Ideal for team leaders, educators, corporate planners, and event organizers. Compatible with PowerPoint, Keynote, and Google Slides for effortless use.


5 diapositivas
IT Support and Systems Presentation
Streamline your tech communication with a clean, structured layout that highlights your IT services, support processes, and system workflows. Perfect for teams presenting solutions, infrastructure overviews, or technical strategies, this presentation brings clarity to complex topics. Fully compatible with PowerPoint, Keynote, and Google Slides for effortless editing and delivery.


20 diapositivas
Scriptorium Design Portfolio Presentation
Showcase your creative work with a sophisticated design portfolio presentation template tailored for designers and creators. This template includes clean, minimalist slides to highlight your introduction, portfolio overview, design philosophy, and style. Showcase featured projects with dedicated project highlight slides, complete with client testimonials and awards for added credibility. With sections for your design process, services, pricing, and blog integration, this template provides a professional framework for sharing your creative journey. The editable layout ensures seamless customization to reflect your unique brand, making it suitable for freelancers, agencies, or design teams. Compatible with PowerPoint, Google Slides, and Keynote, this versatile template offers an elegant way to communicate your expertise and leave a lasting impression on clients or stakeholders. Tailor it to your needs and take your portfolio presentations to the next level!


8 diapositivas
Medical Case Study Presentation
Elevate your medical presentations with our "Medical Case Study Presentation" template. This infographic is expertly designed to outline medical case studies or healthcare data, showcasing a central image flanked by related statistics and information. Each segment is linked to a visually distinct icon, representing different health metrics or case points, making it easier to digest complex medical information. This template is perfect for medical professionals, educators, and healthcare analysts, providing a structured way to present findings, research, or patient data effectively. Compatible with PowerPoint, Keynote, and Google Slides, it ensures your medical data is communicated clearly and professionally.


6 diapositivas
Mission Goals Infographic
These professionally designed slide templates are tailored to help you articulate your organization's mission goals with clarity and impact. Each slide is structured to emphasize the strategic objectives that guide your operations, making them ideal for communicating with stakeholders, teams, and external partners. Featuring a variety of layouts that include real-life imagery and concise text areas, these templates not only convey your goals but also illustrate the values that underpin your mission. They are perfect for enhancing corporate presentations, annual meetings, or internal strategy discussions, providing a visual and textual guide to what drives your organization forward. Customizable for various communication needs, these templates can be adapted to highlight specific mission goals or to align with different thematic elements of your presentations. They are an essential tool for organizations aiming to foster a unified understanding of their mission and to inspire alignment and action among all stakeholders.


5 diapositivas
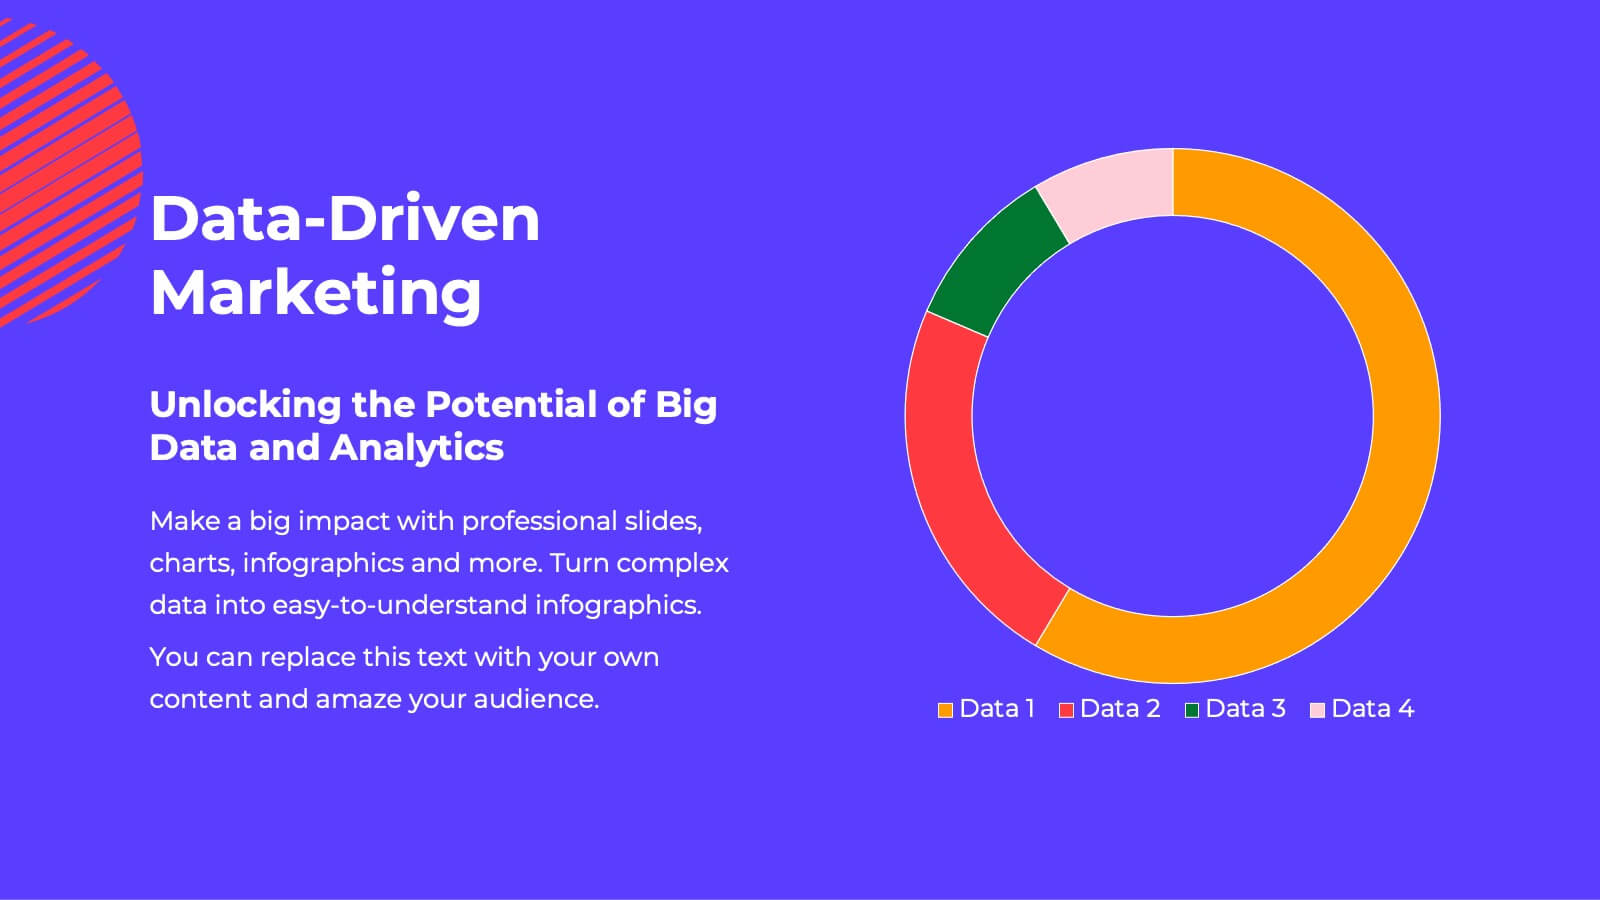
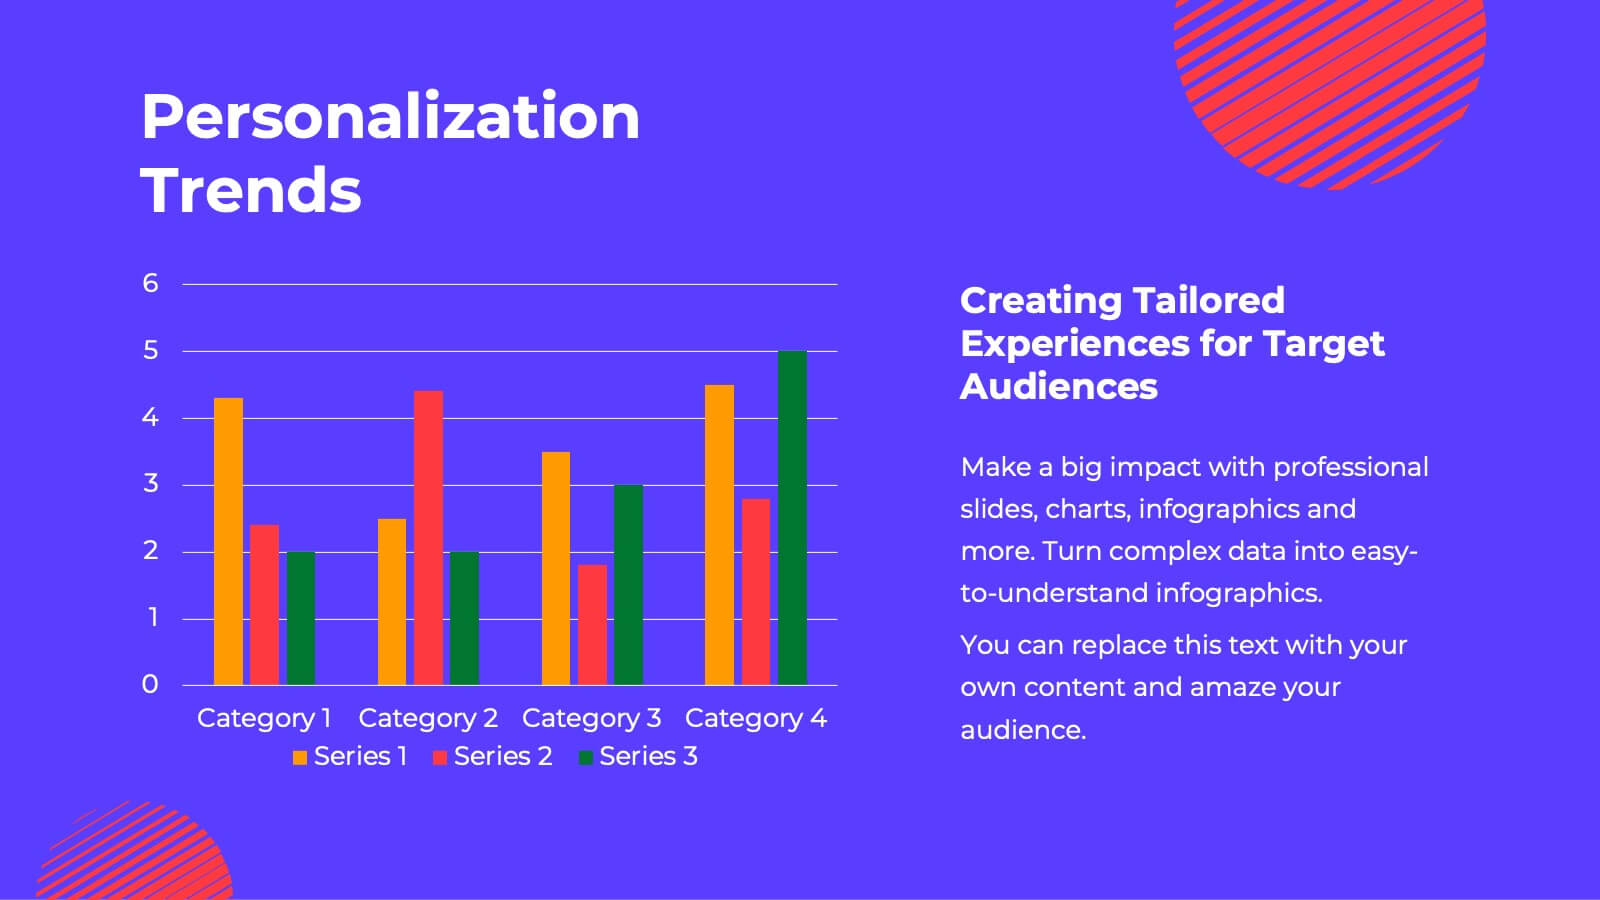
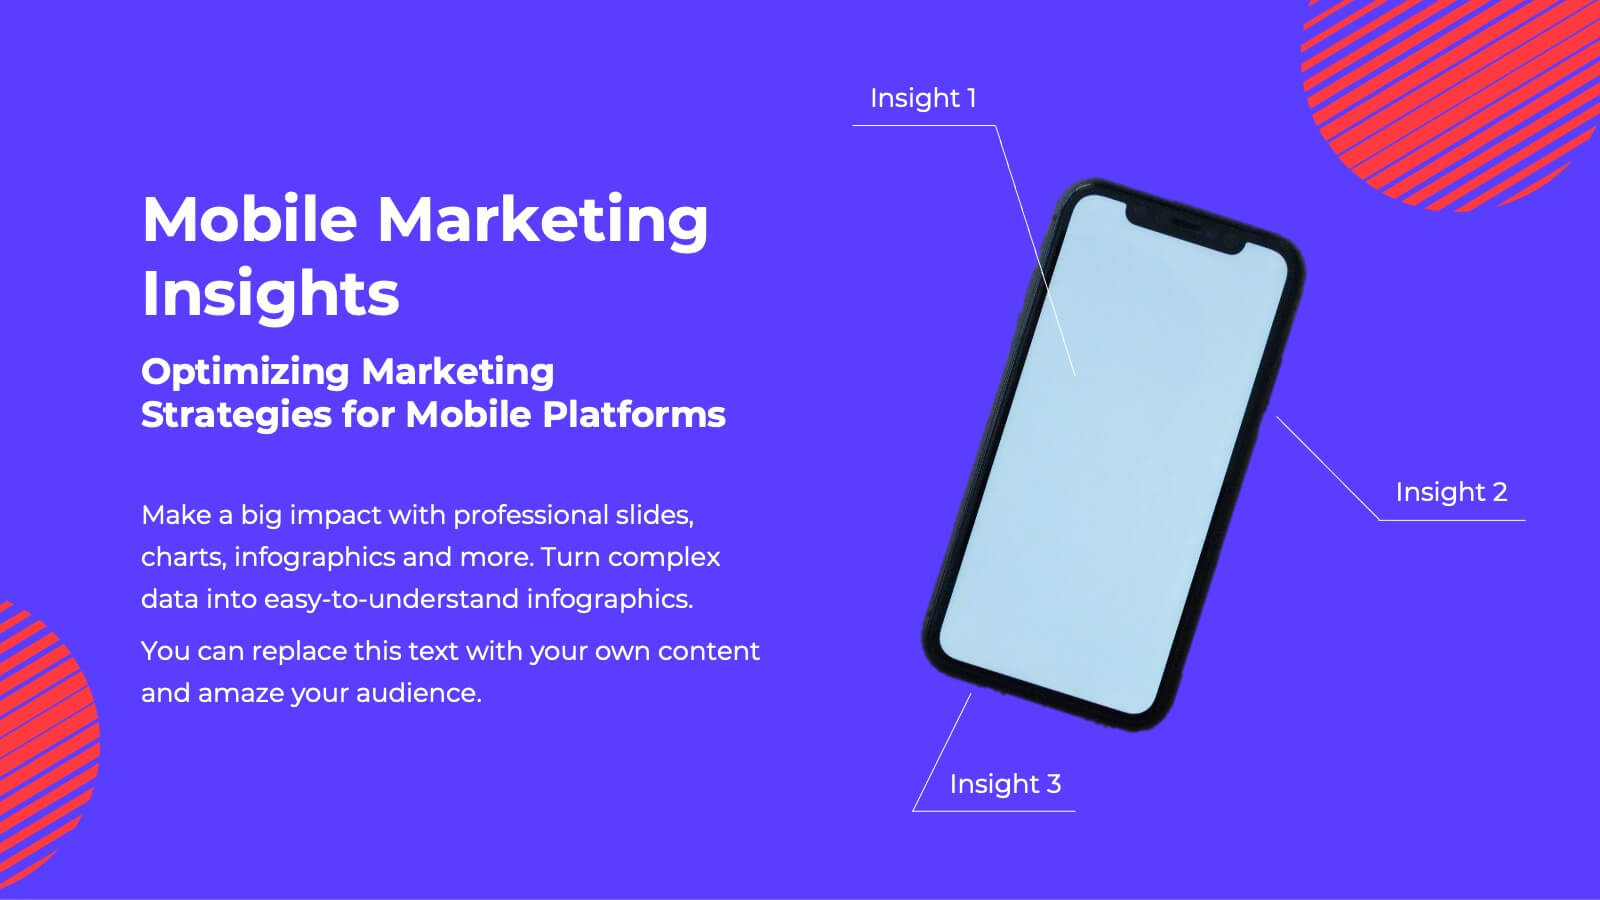
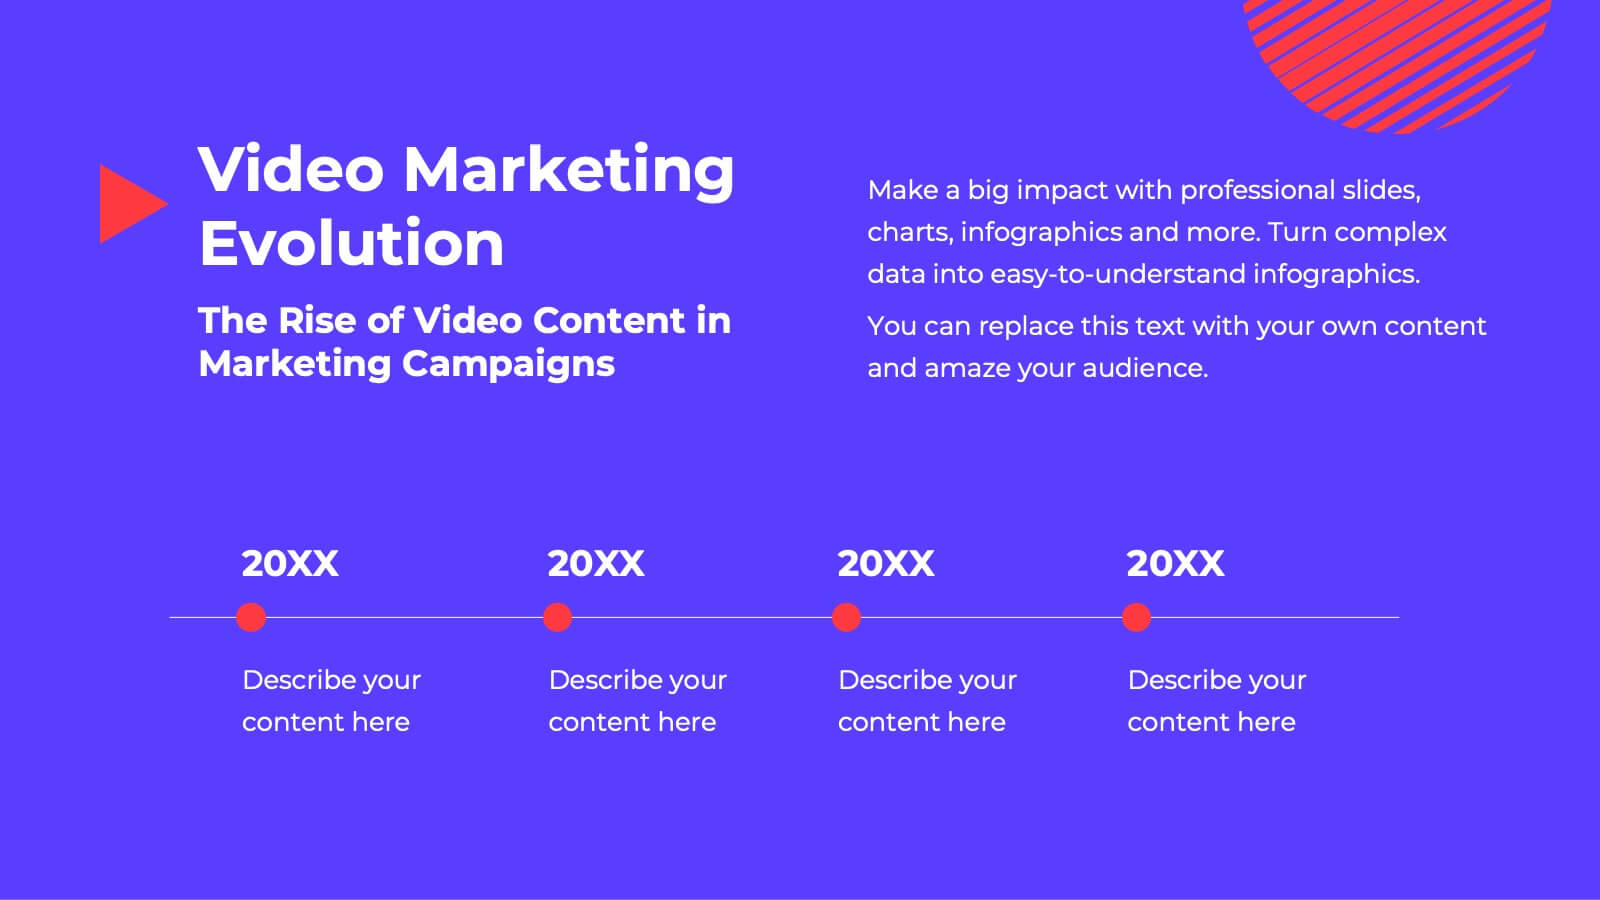
Big Data Analytics Process Presentation
Visualize your data journey with this clean and professional slide layout. Featuring four circular icons around a central cloud graphic, it’s ideal for showcasing data collection, processing, analysis, and storage. Perfect for tech briefings or analytics teams. Fully editable and compatible with PowerPoint, Keynote, and Google Slides.


5 diapositivas
New Hire Employee Onboarding Flow Presentation
Make a lasting first impression with a clear, engaging flow that guides new hires through every step of their onboarding journey. Perfect for HR teams and managers, this presentation simplifies complex processes with visual structure and clarity. Fully compatible with PowerPoint, Keynote, and Google Slides for easy customization and use.

20 diapositivas
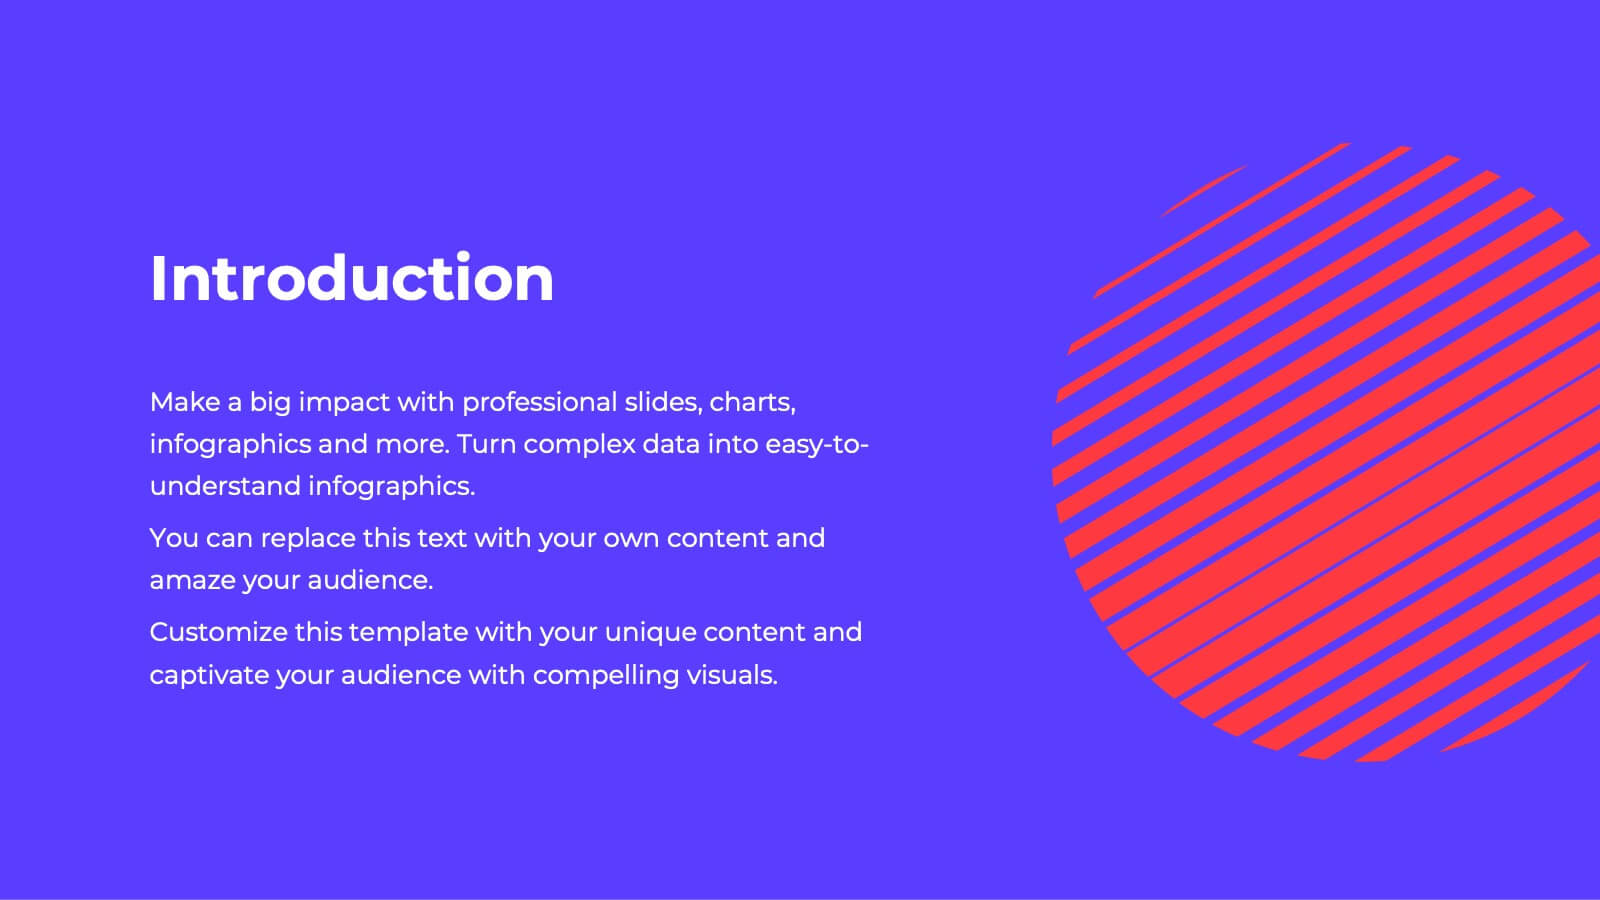
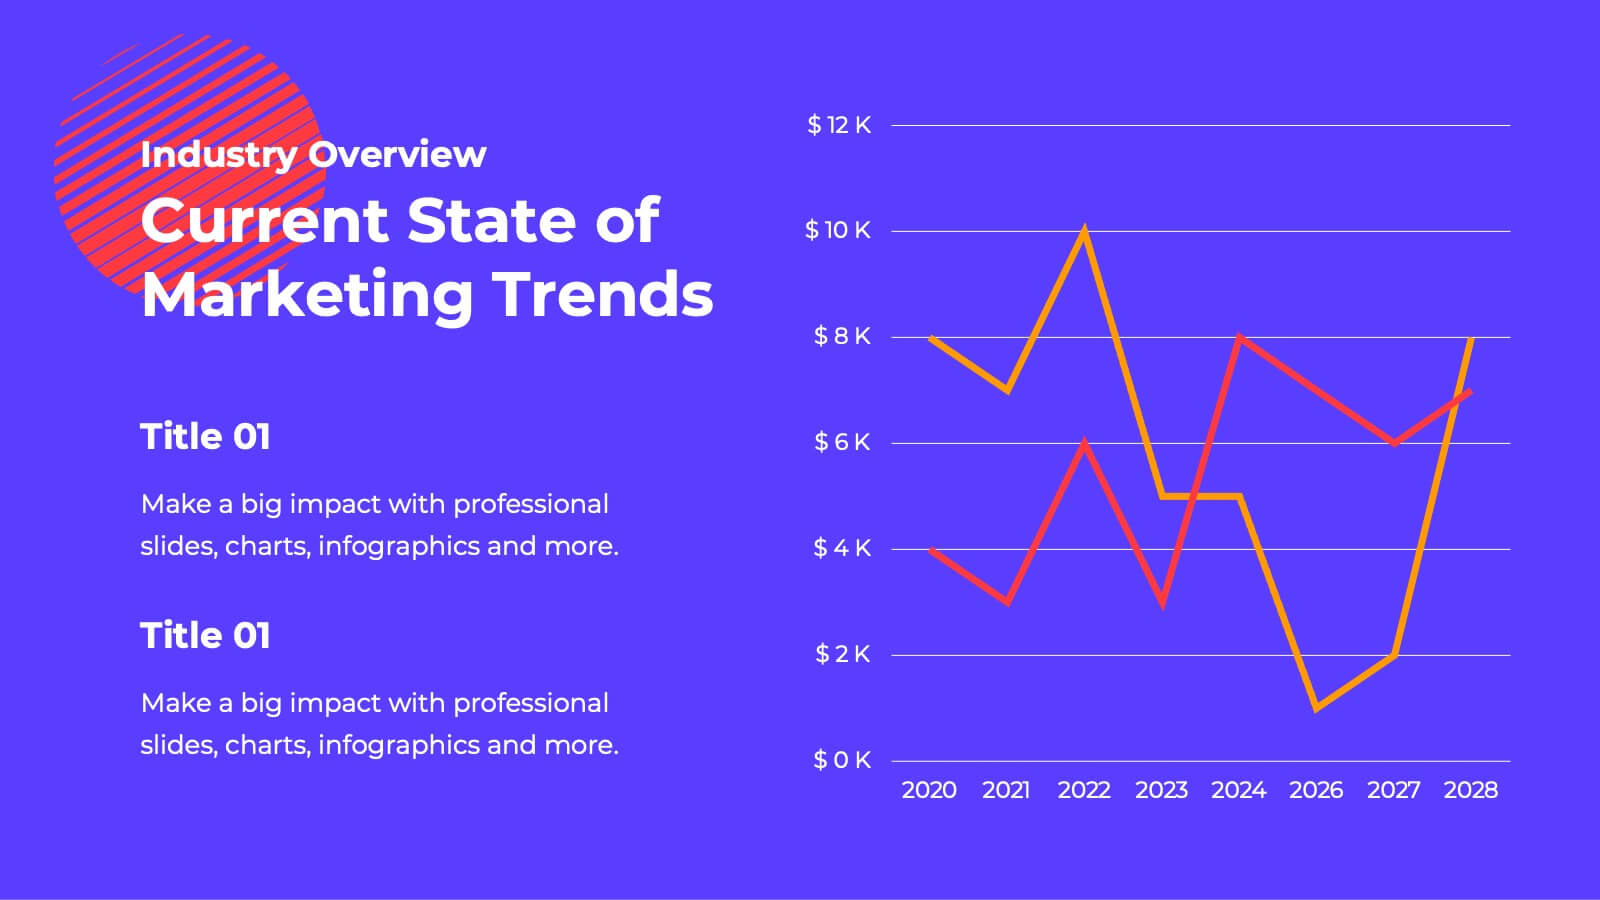
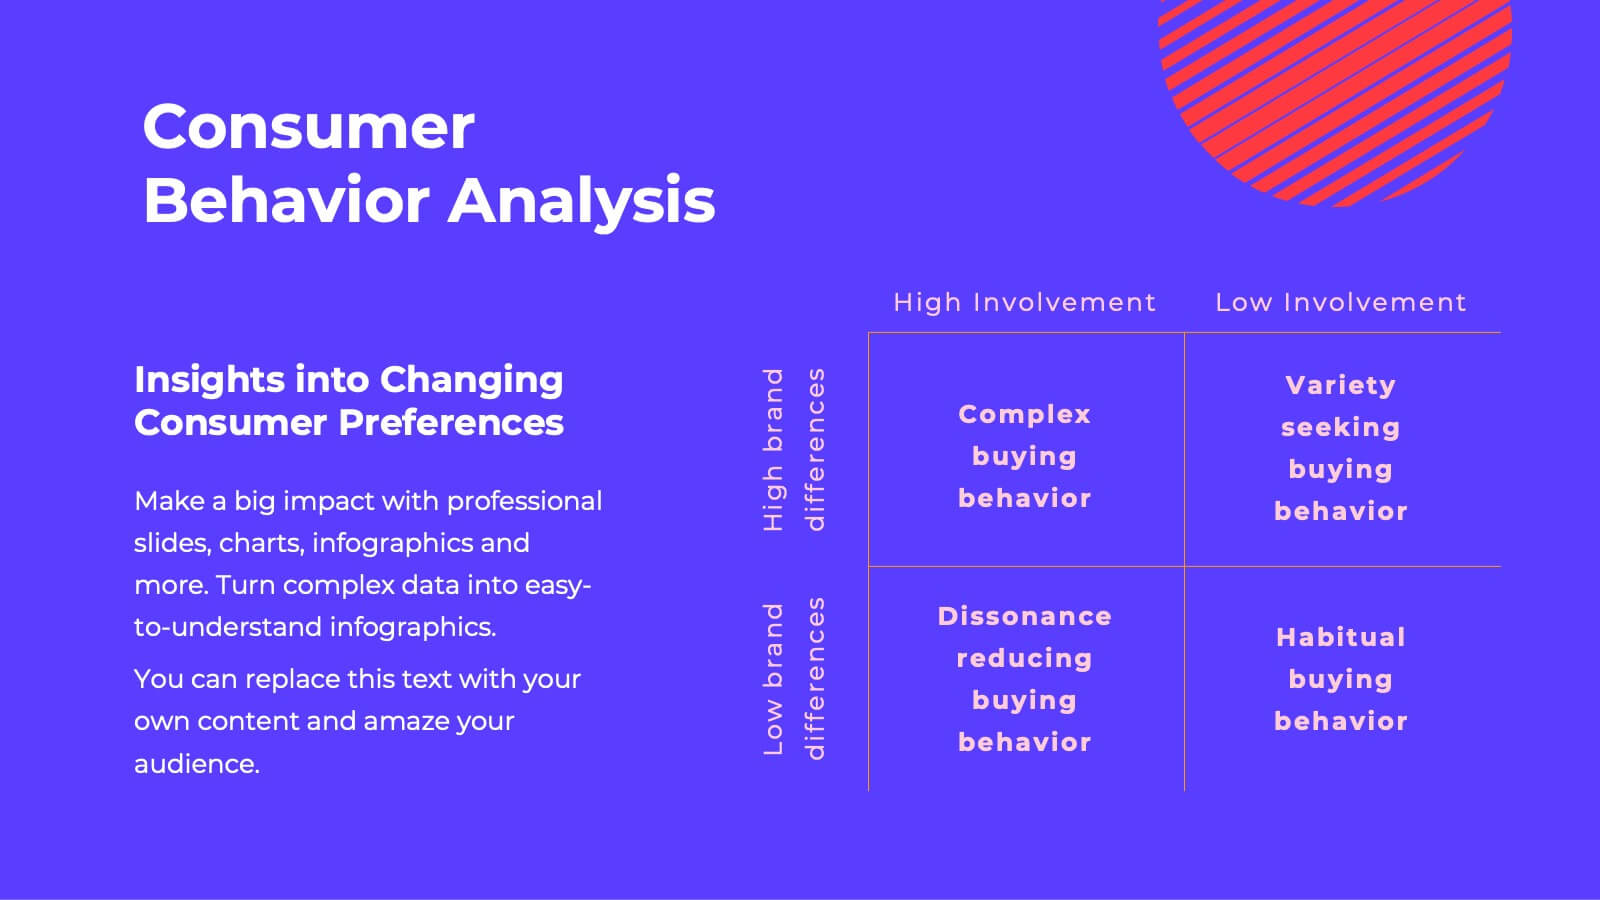
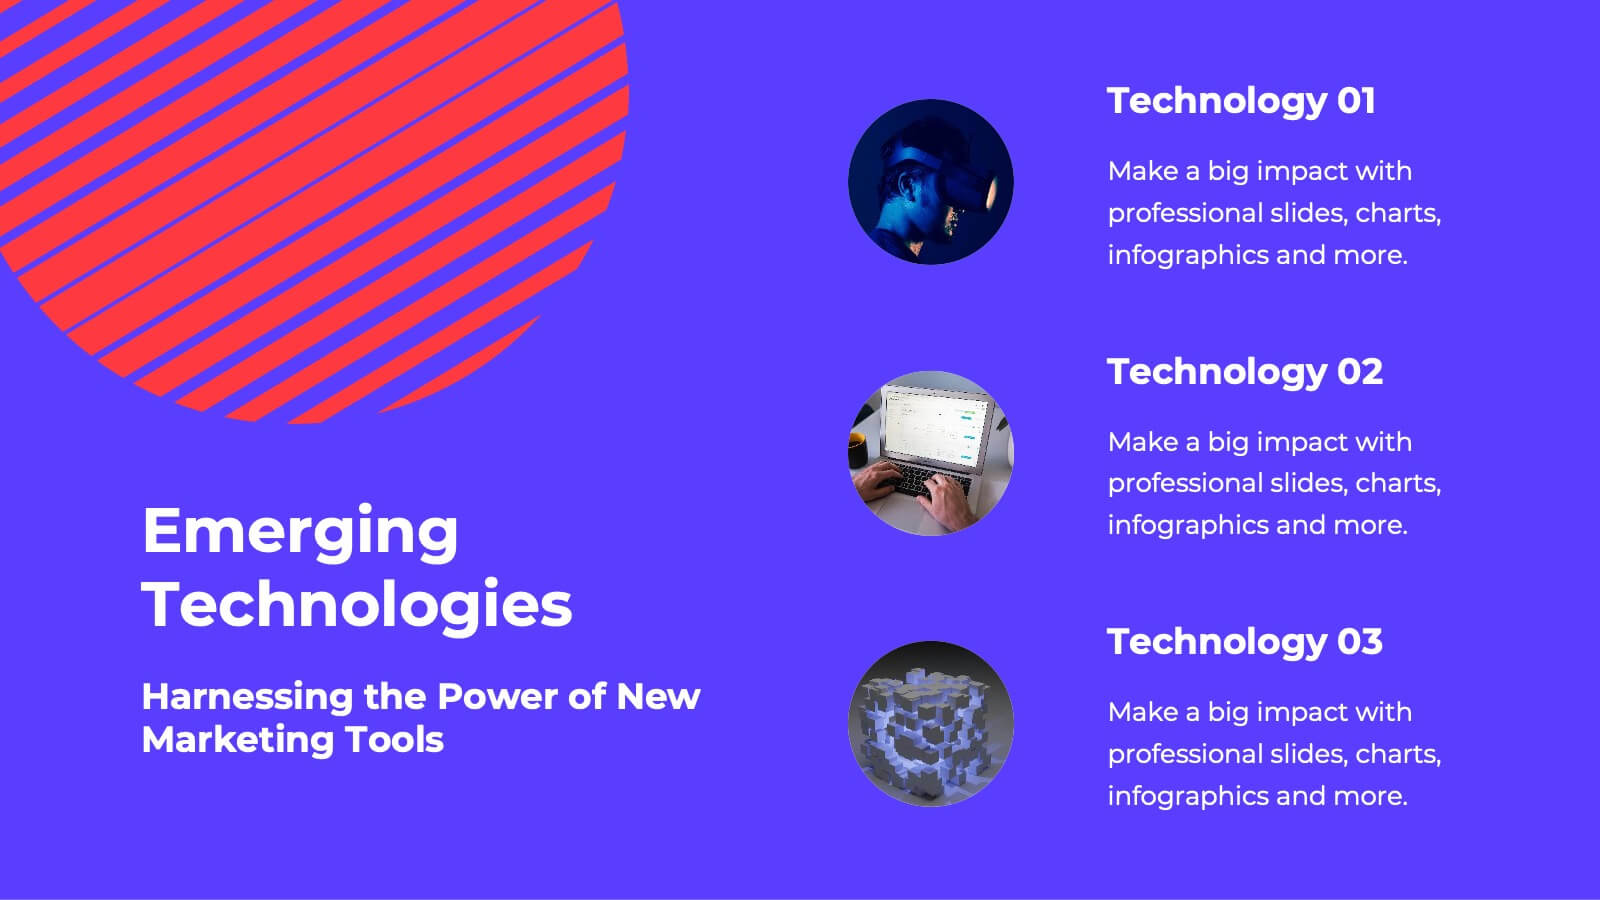
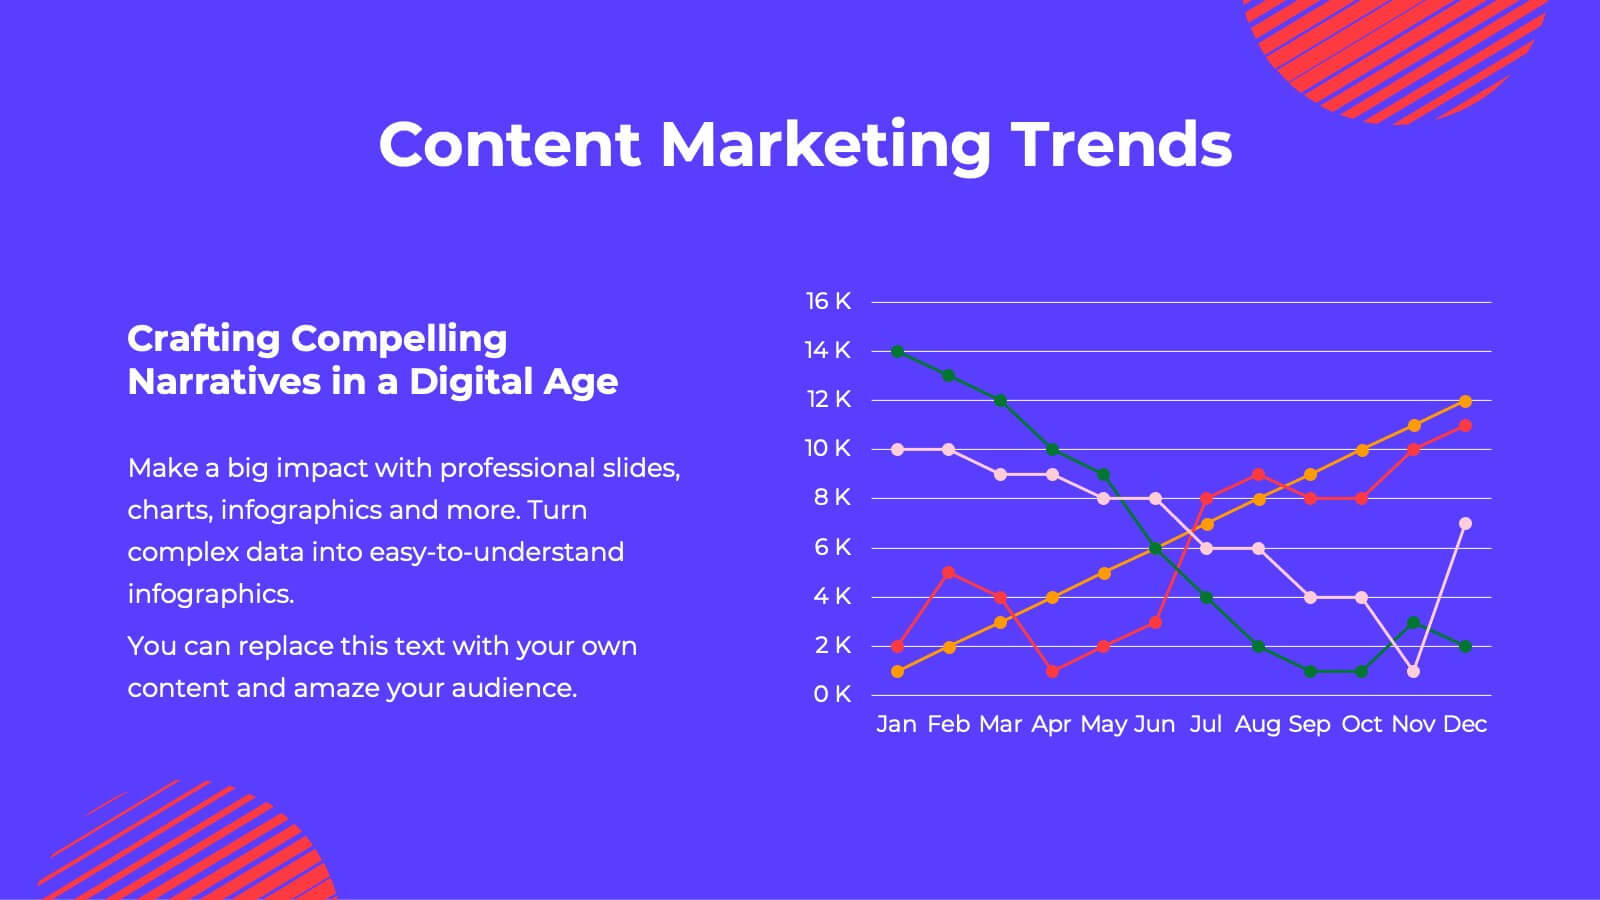
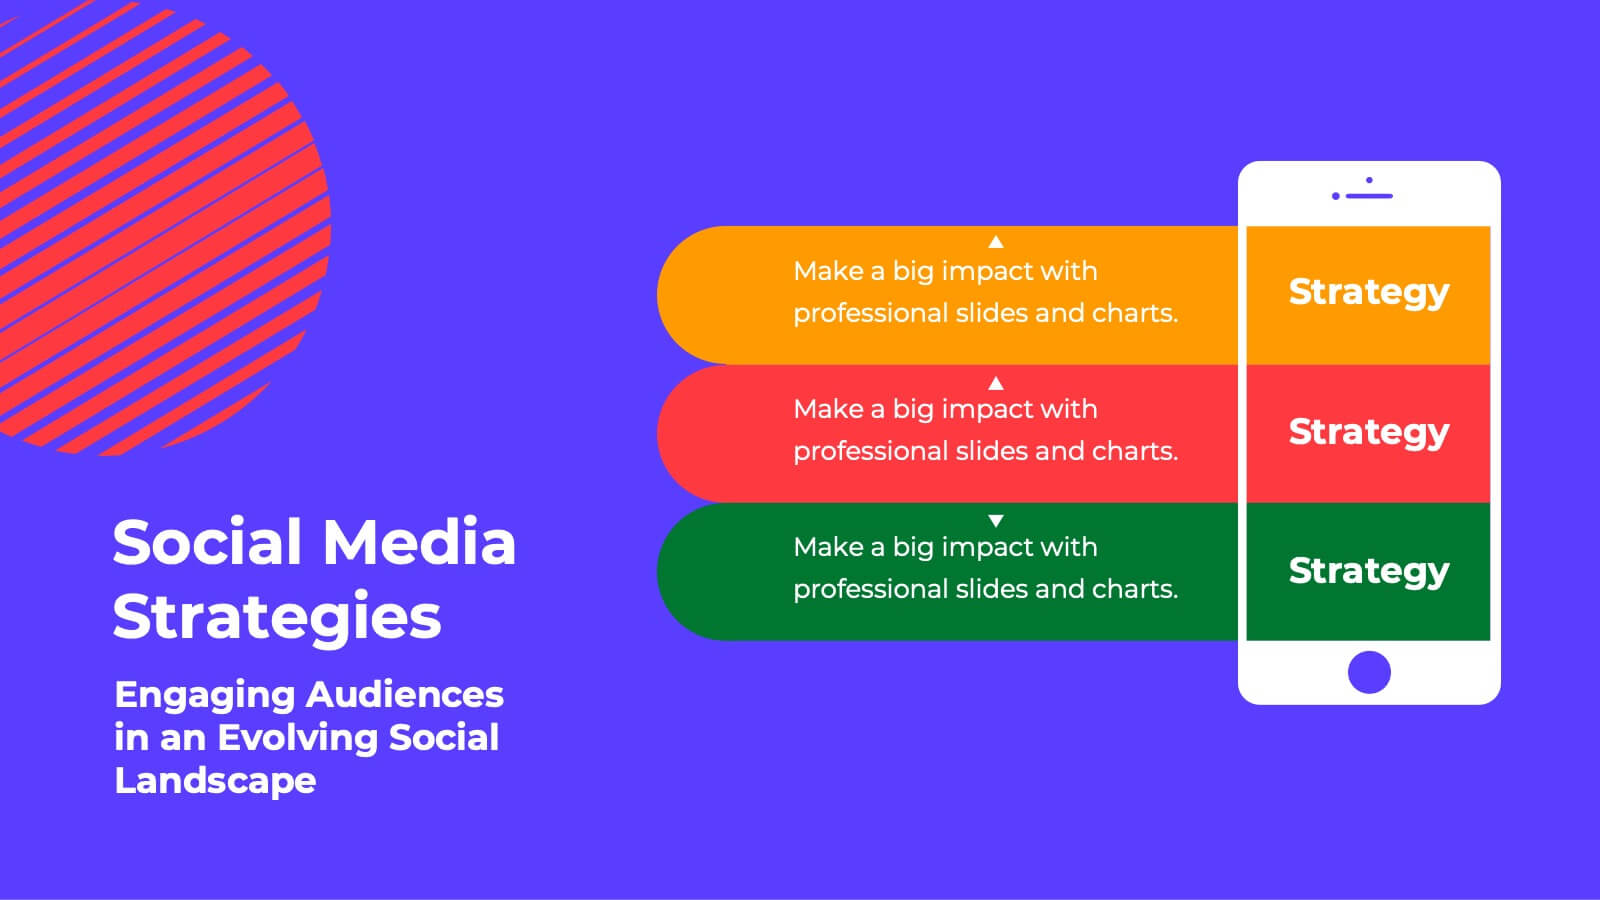
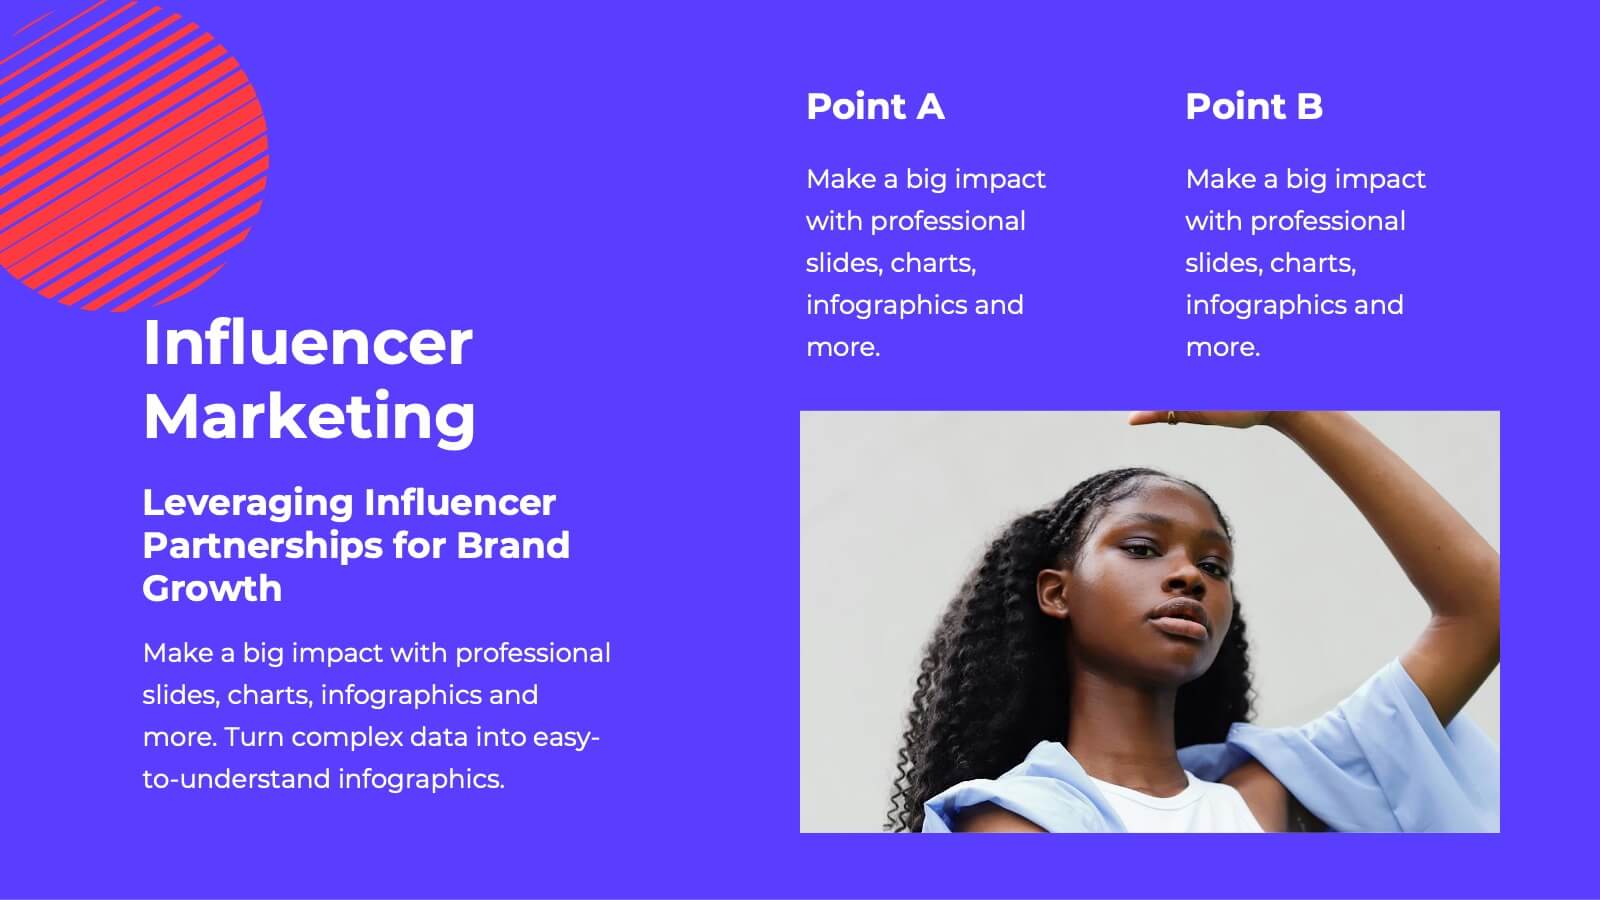
Fusion Marketing Campaign Presentation
Unleash the power of your marketing campaigns with this vibrant marketing campaign template! Dive into social media strategies, influencer marketing, data-driven insights, and more. Perfect for presenting to stakeholders and team members. Fully customizable and compatible with PowerPoint, Keynote, and Google Slides.


7 diapositivas
Relationship Communication Infographic
A Relationship Communication Infographic is a visual representation of key concepts and strategies related to effective communication in relationships. This template can be used to provide practical tips and advice for improving communication skills, resolving conflicts, and building stronger, healthier relationships. This infographic can be a helpful resource for individuals seeking to improve their communication skills and build stronger, more fulfilling relationships. This template is compatible with Powerpoint, Keynote and Google Slides making it easily customizable to fit your needs.


8 diapositivas
Machine Learning Overview Presentation
The "Machine Learning Overview" presentation template features a central circular design that effectively illustrates the interconnectedness of various components in machine learning processes. Each segment of the circle is dedicated to a key area such as data acquisition, algorithm development, model training, validation, and deployment, which are critical to understanding and executing machine learning projects. This visual arrangement makes it easy to follow and is ideal for educational environments or professional settings where clarity and concise information delivery are essential.


22 diapositivas
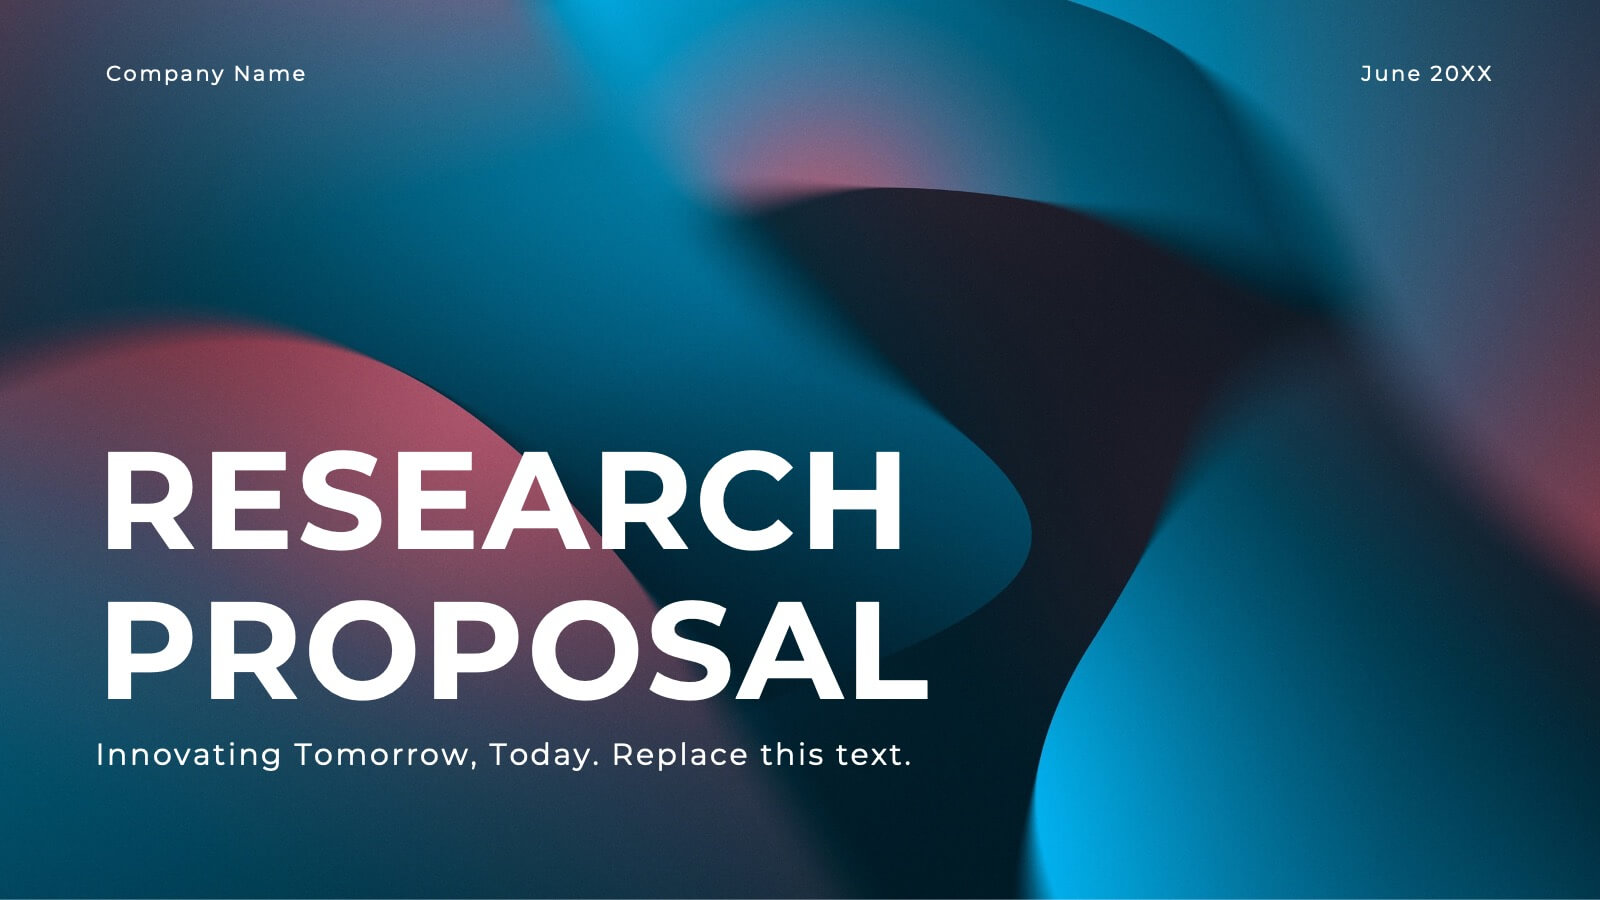
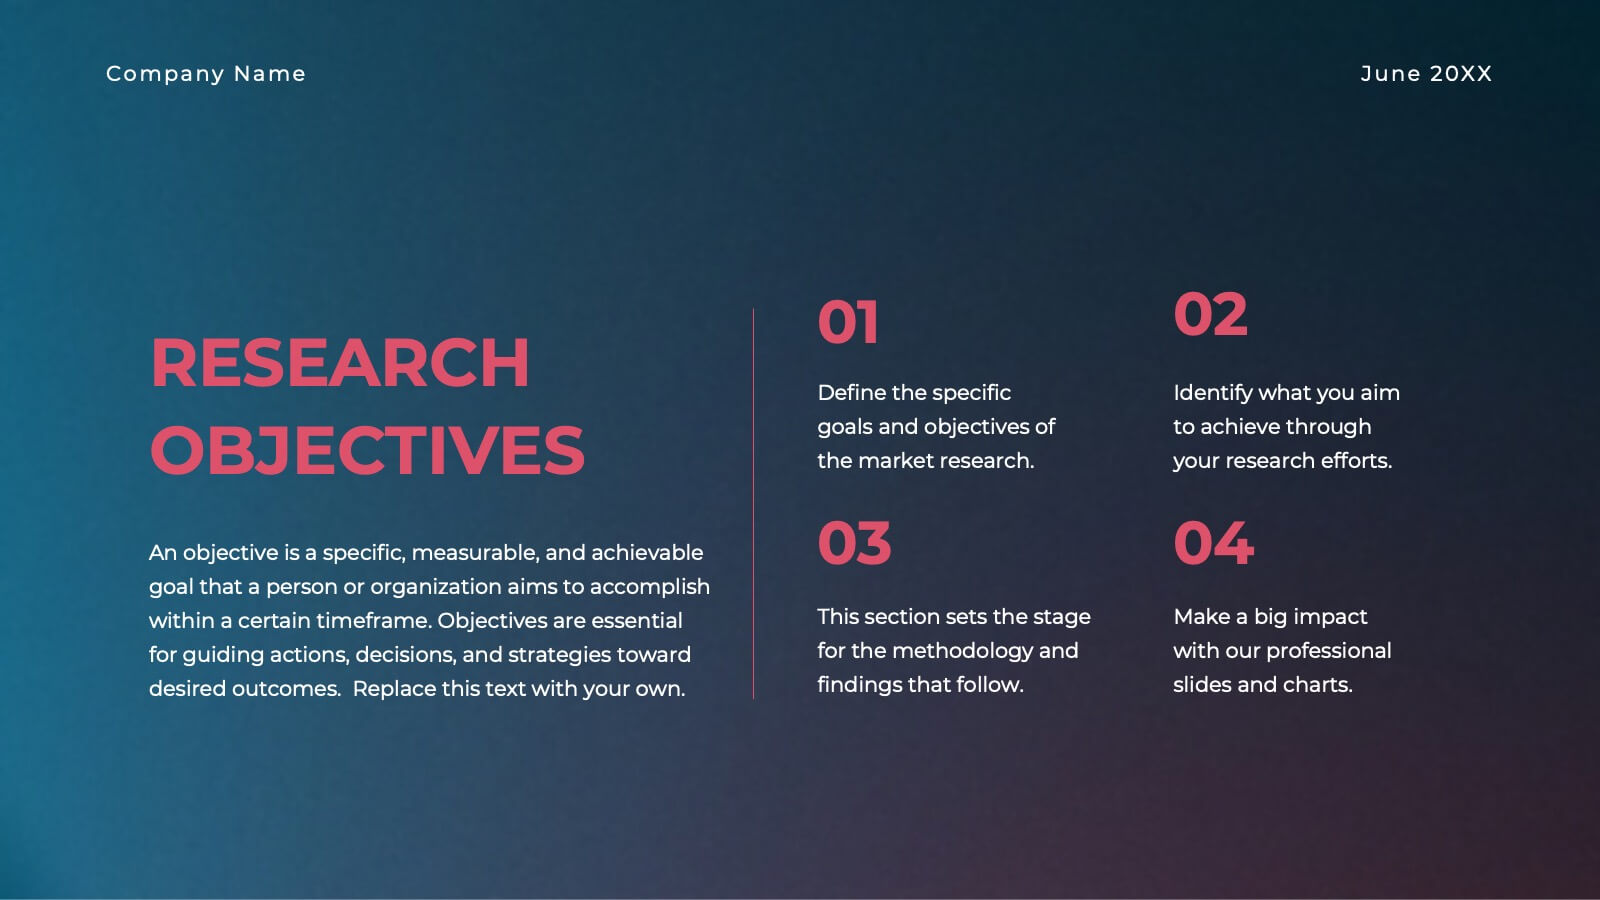
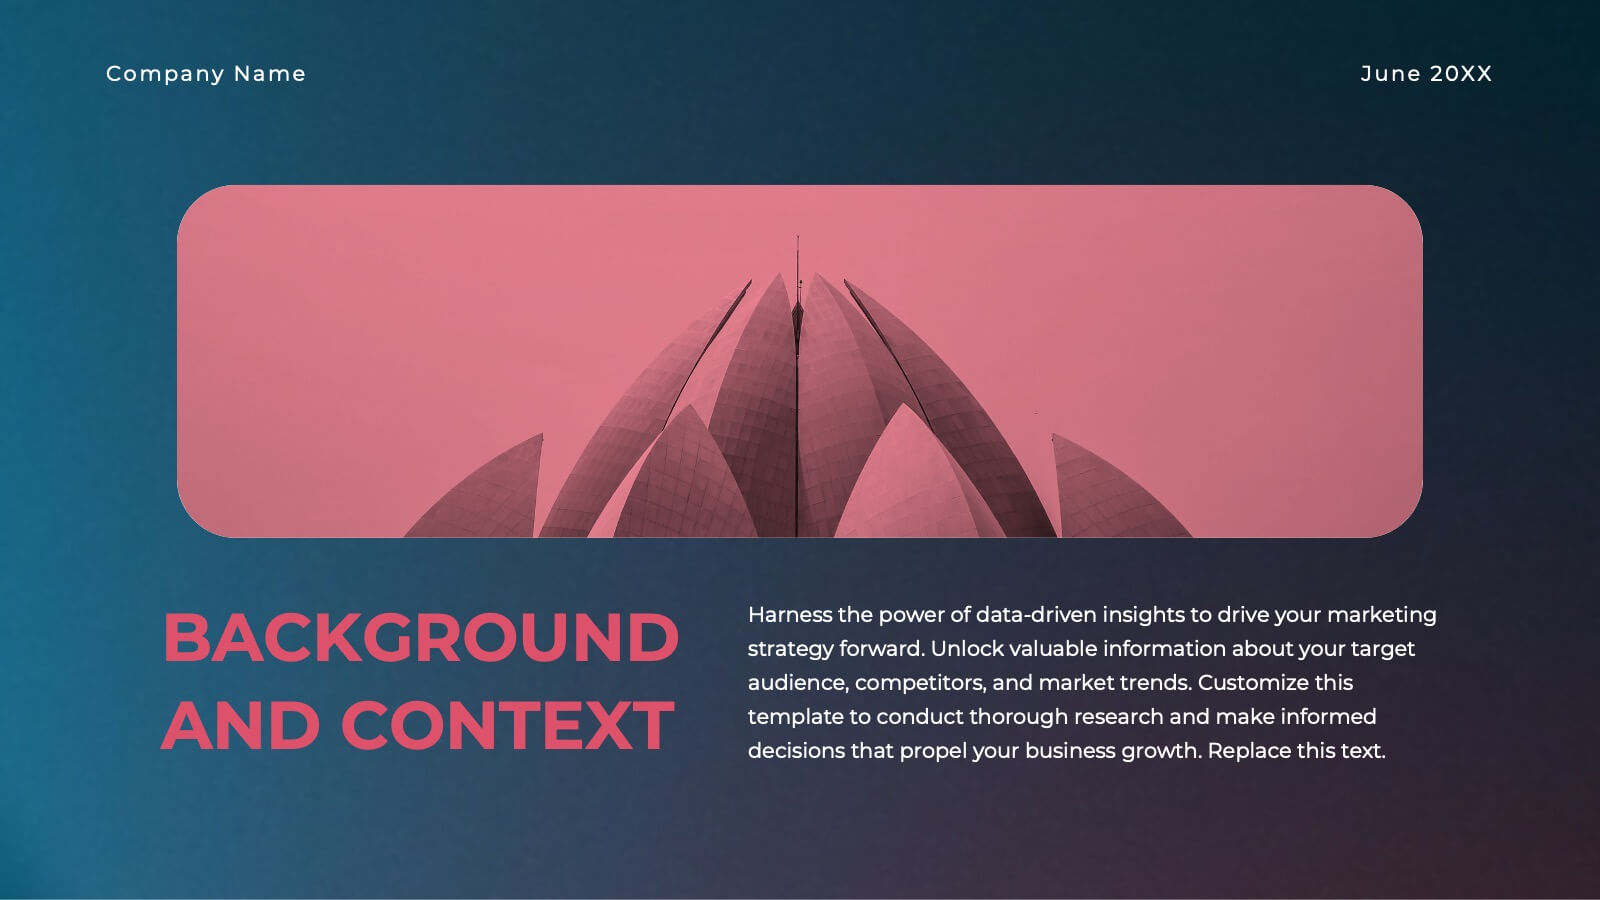
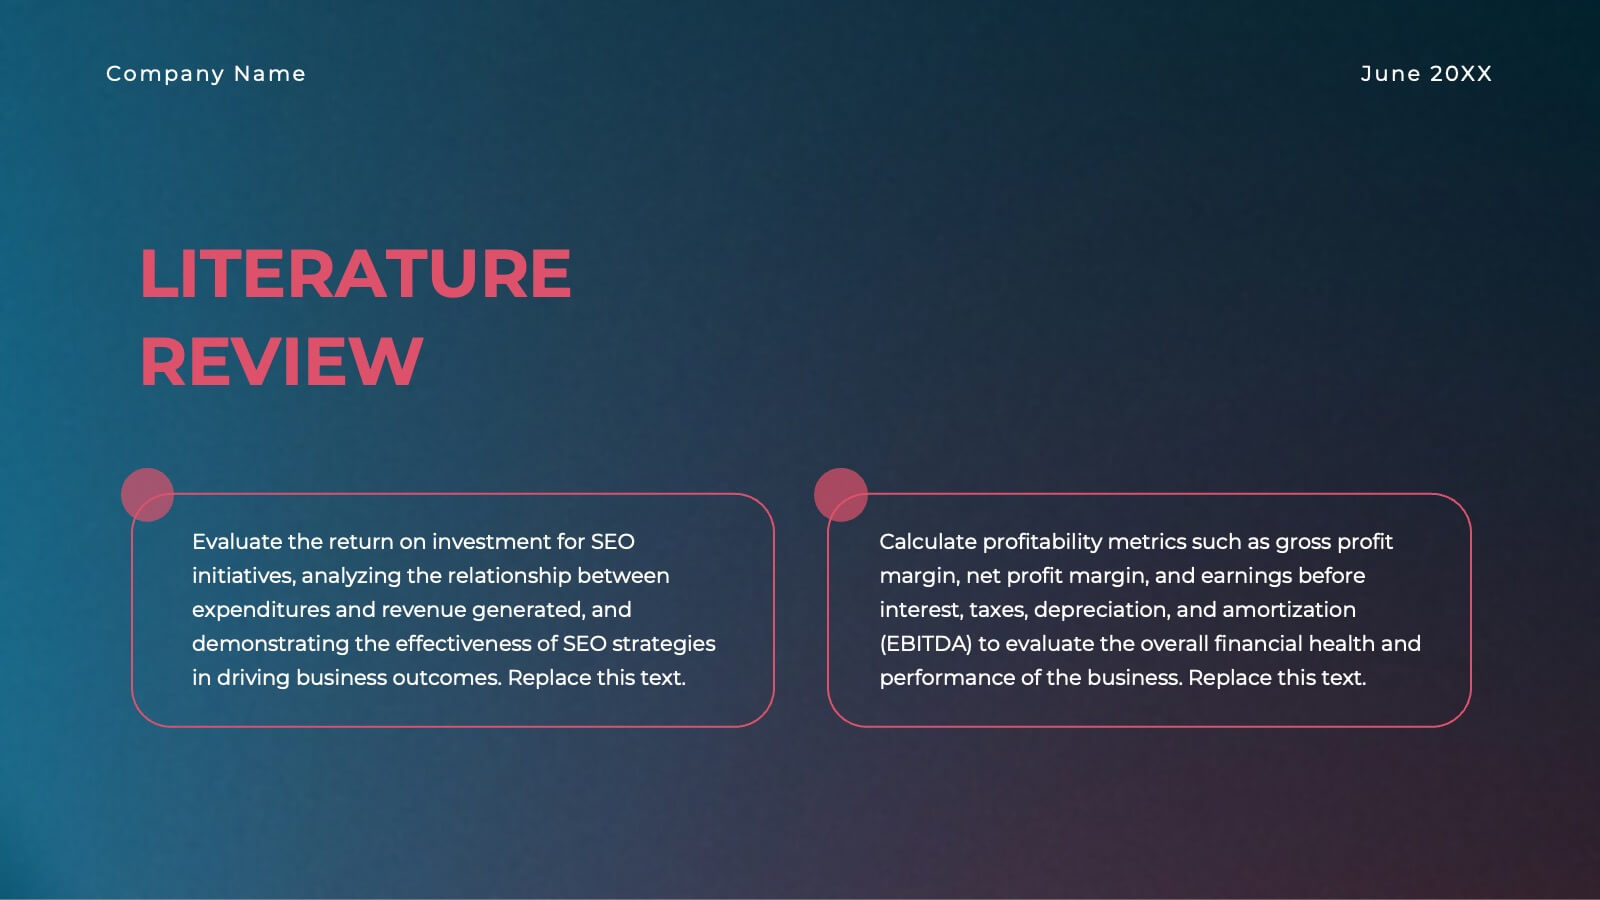
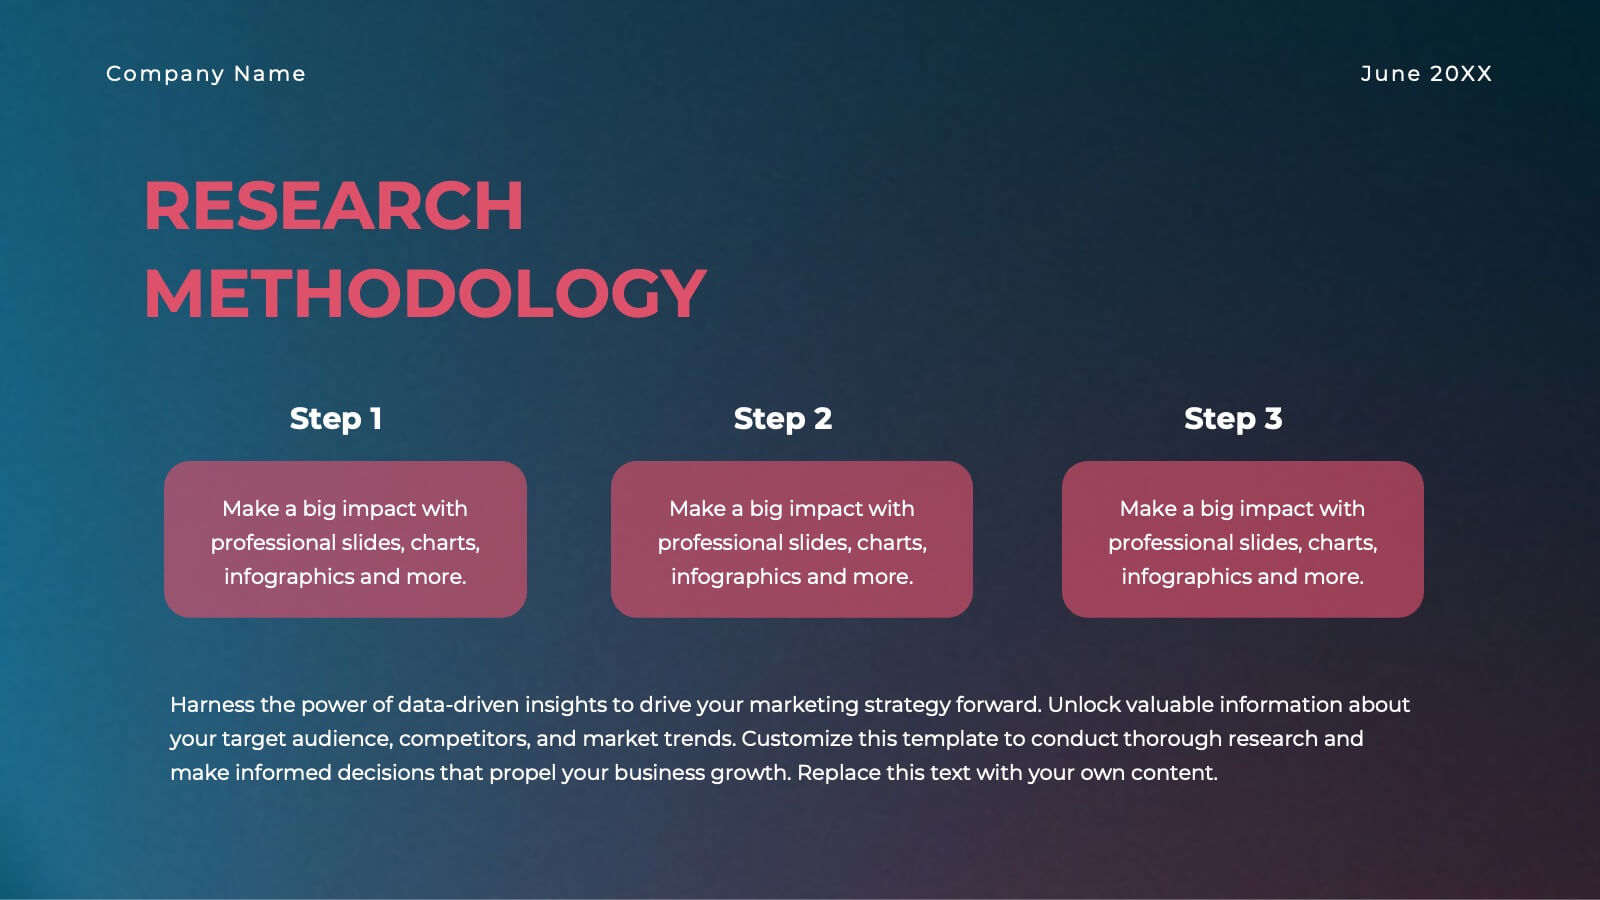
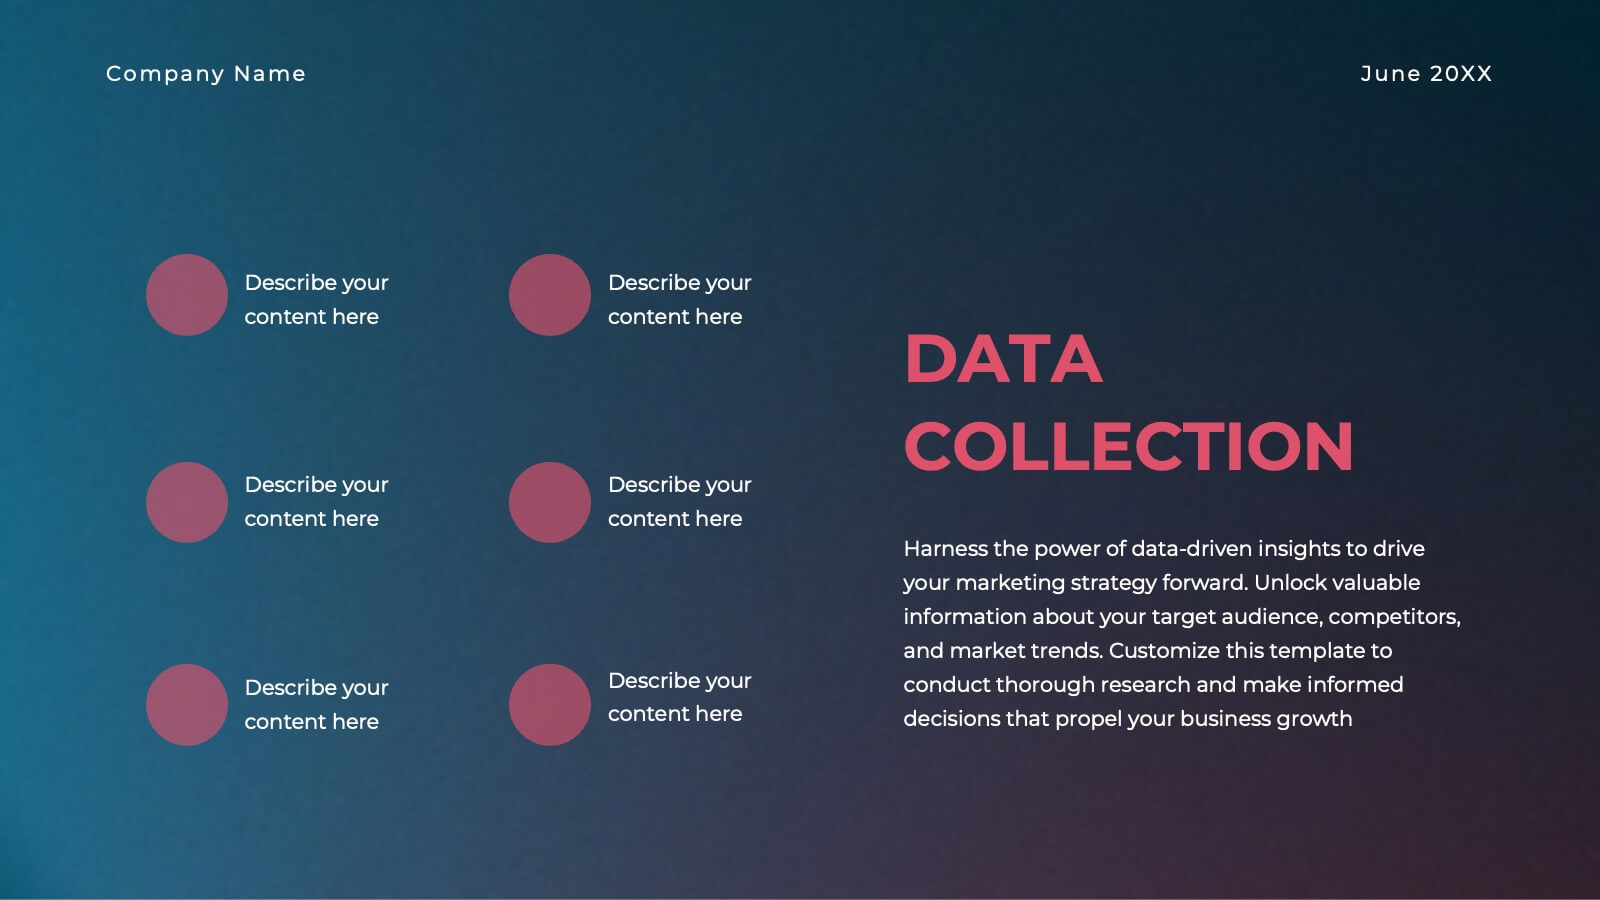
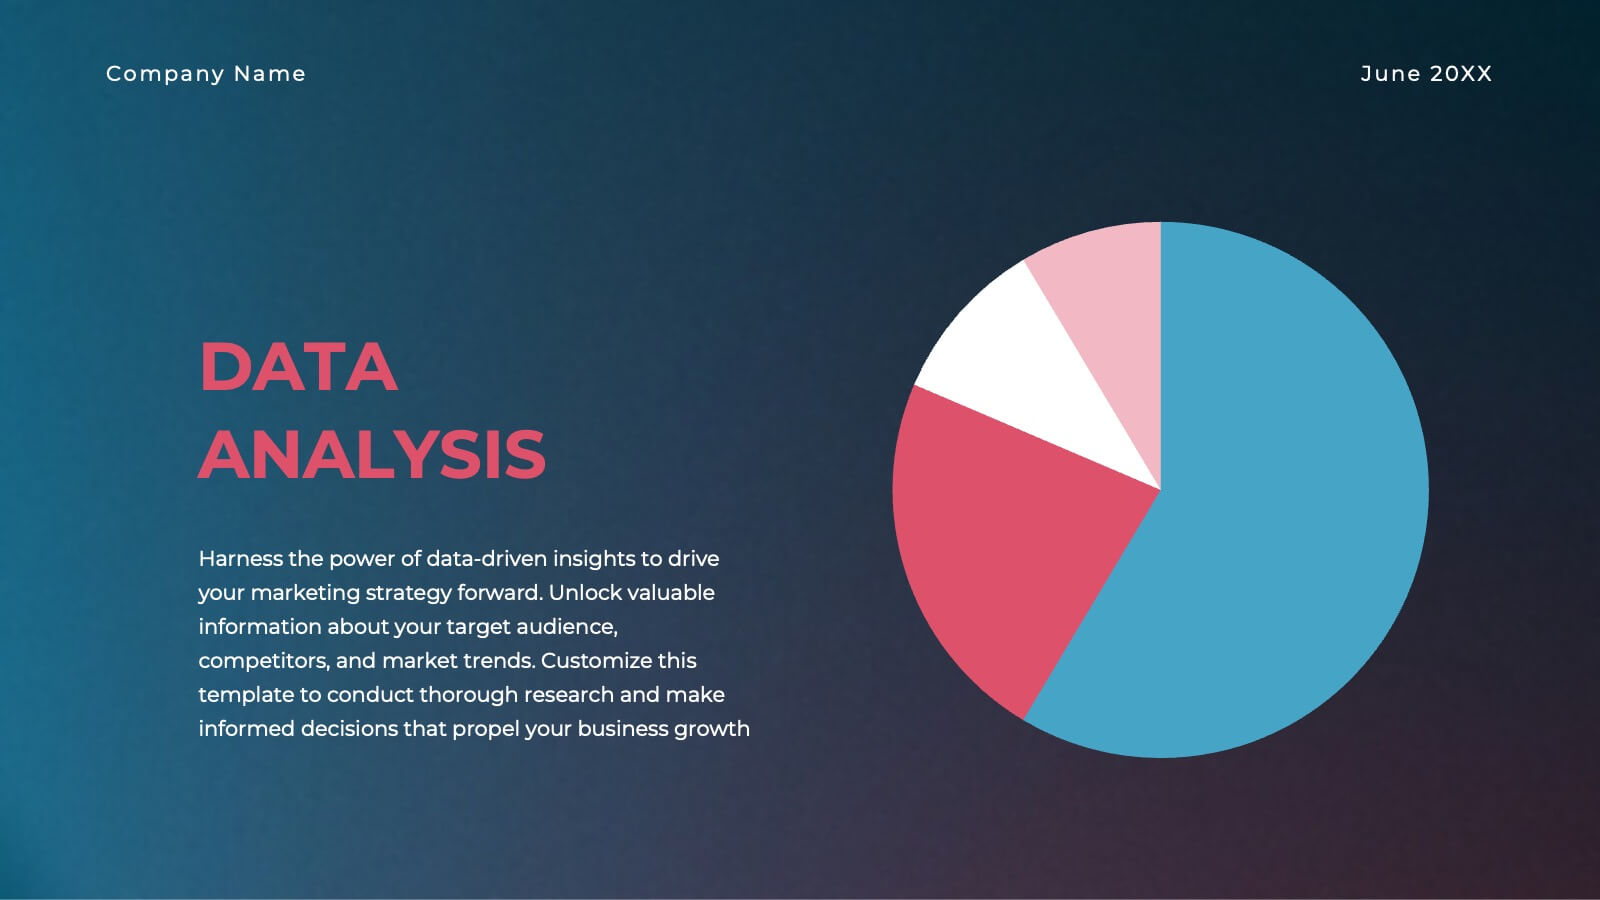
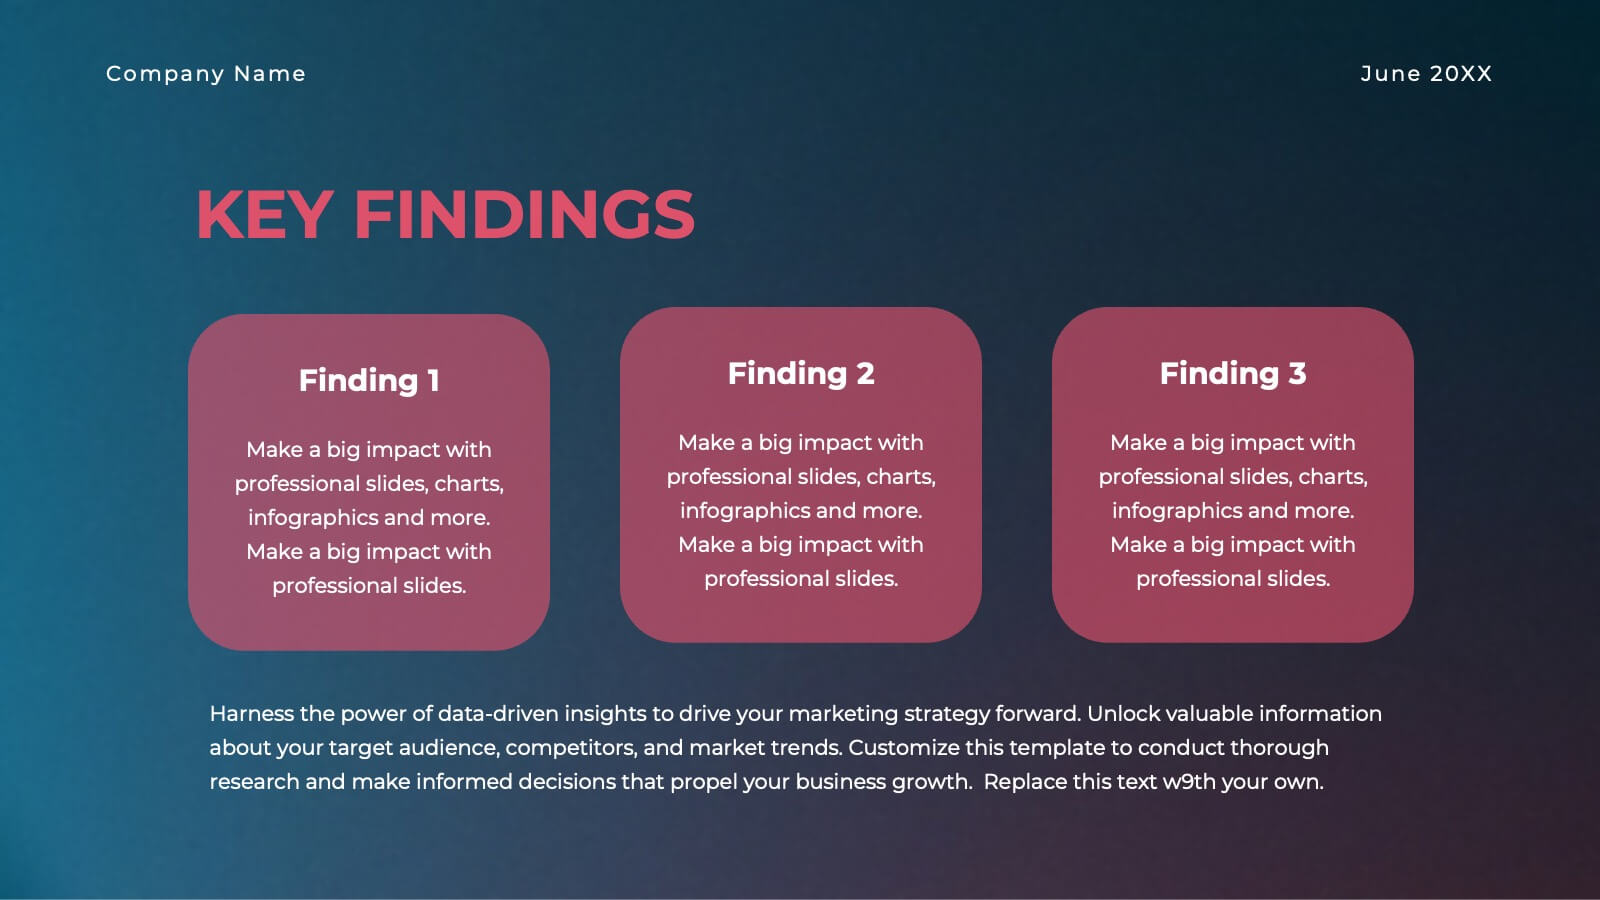
Gold Research Proposal Presentation
Present your research with impact using this sleek and modern research proposal template! Featuring sections for objectives, data collection, analysis, key findings, and recommendations, this template helps organize your research clearly and professionally. Fully customizable and compatible with PowerPoint, Keynote, and Google Slides, it's ideal for any research presentation.


5 diapositivas
Project Execution Next Steps Presentation
Streamline your workflow with the Project Execution Next Steps Presentation template. Designed for project managers and teams, this visual slide helps break down execution phases into clear, actionable steps. The connected chain layout ensures smooth project tracking, making it easy to communicate progress and responsibilities. Fully customizable in PowerPoint, Keynote, and Google Slides for seamless project planning and execution.