


Características


¿Tienes alguna pregunta?
Recomendar


6 diapositivas
Annual Report Company Infographic
An annual report is a comprehensive document that provides an overview of a company's performance and financial activities over the course of a year. This Infographic template is a great way to present key highlights, accomplishments, and data from a year in a visually engaging and concise format. Designing an Annual Report Infographic can effectively convey the year's achievements and progress to stakeholders, investors, clients, and employees in a visually compelling and concise manner. This is designed to gather feedback from colleagues, team members, or stakeholders and make any necessary revisions to enhance the clarity and impact of the infographic.


12 diapositivas
Milestone Achievement Progress Map Presentation
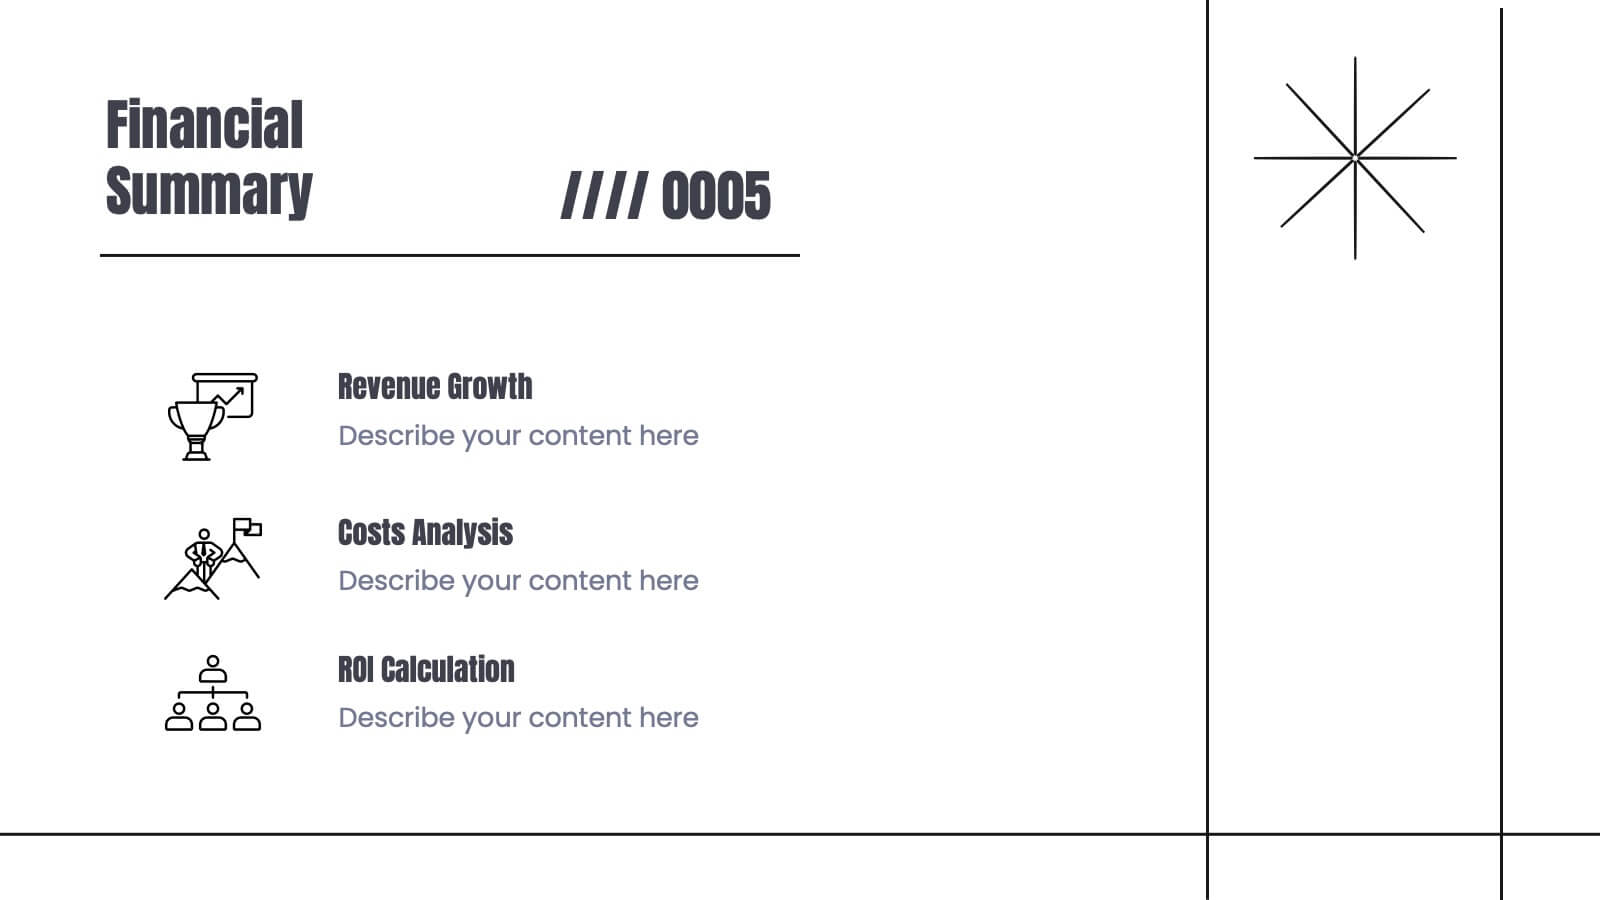
Visualize progress with clarity using this dynamic Milestone Achievement Progress Map. Each slide combines bar charts and upward arrows to showcase key accomplishments, performance phases, or goal tracking. With three customizable titles and color-coded segments, this layout is perfect for project updates, strategy reviews, or performance recaps. Fully editable in PowerPoint, Keynote, and Google Slides.


26 diapositivas
Clean Company Profile Presentation
Present your organization with poise using this clean company profile template. The design marries minimalist aesthetics with functional elegance, embodying a professional and polished look. The crisp layout is dotted with geometric shapes and a calm color palette, reflecting a modern corporate image. It’s perfect for businesses wanting to communicate their mission, team, and milestones succinctly. The 'Meet Our CEO' slide introduces leadership with clarity, while the 'Four Option Slide' breaks down services or products into an easy-to-digest format. Financial achievements gain prominence on the 'Big Number Slide', and the 'World Map Infographic' illustrates global reach. This design is not just about presenting facts; it’s about telling your company’s story with sophistication. From first glance to final slide, it’s crafted to convey a narrative of reliability, innovation, and corporate integrity. Use it for investor briefings, internal meetings, or partnership pitches and establish an image of impeccable professionalism.


6 diapositivas
Peak Flow Chart Infographic
A flowchart is a visual representation of a process or workflow using various symbols, arrows, and connectors to show the sequence of steps and decisions involved in that process. This infographic template is a powerful tool for illustrating complex processes in a clear and easy-to-understand manner. Compatible with Powerpoint, Keynote, and Google Slides. The flowcharts featured consist of various shapes or symbols that represent different process steps or activities. The infographic depicts the sequential order of steps in a process, showing the logical progression from one step to another. Each step is connected to the next step using arrows.


21 diapositivas
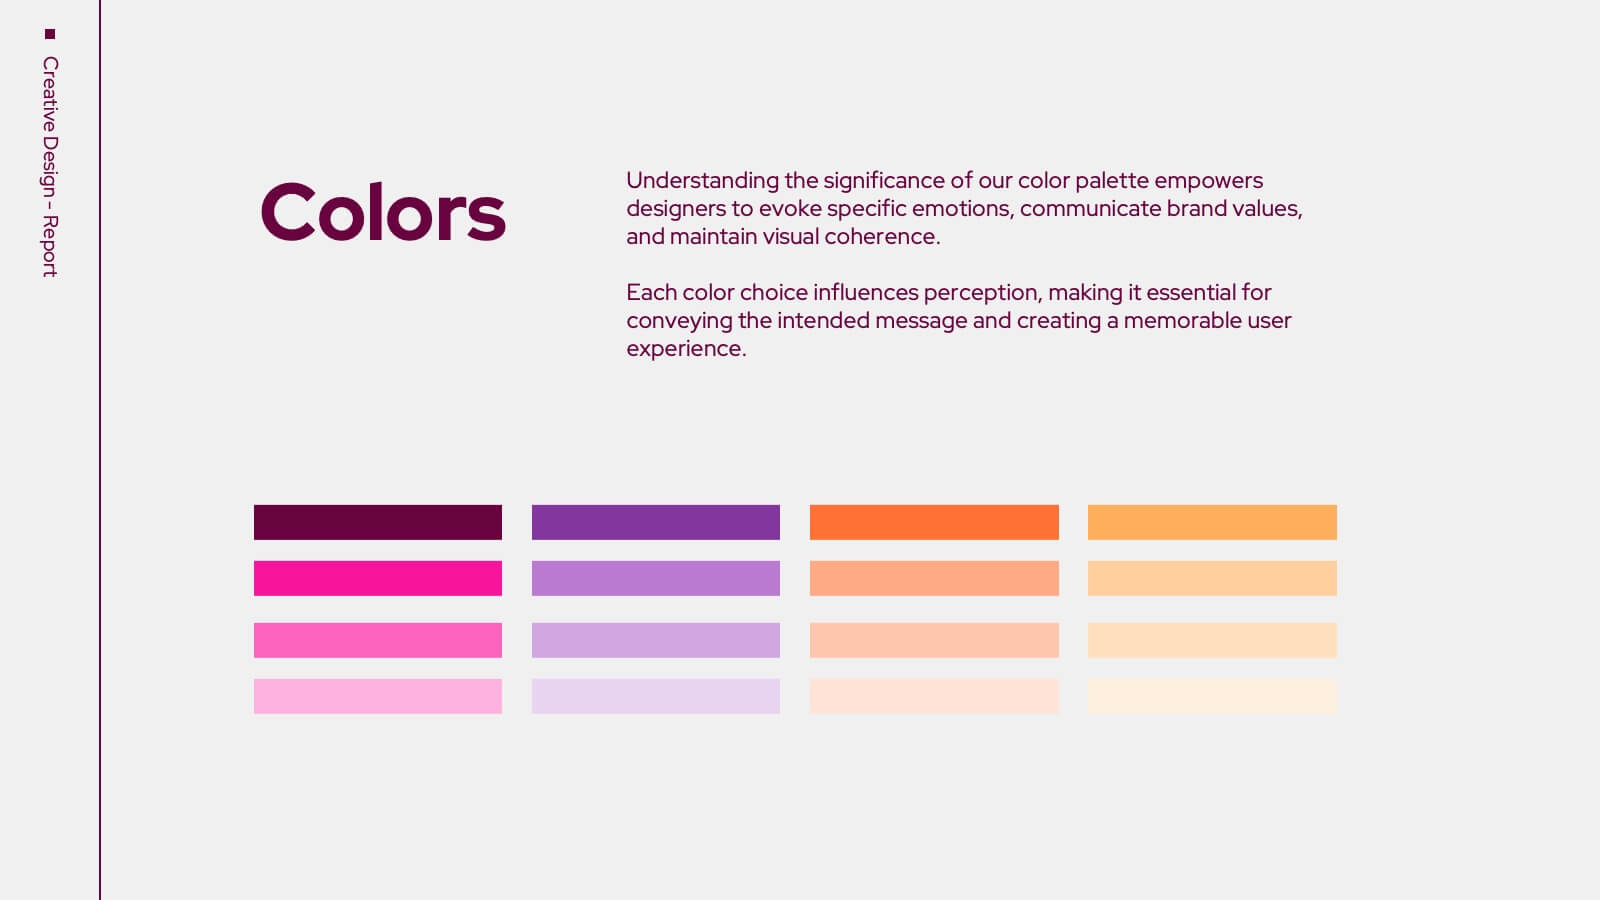
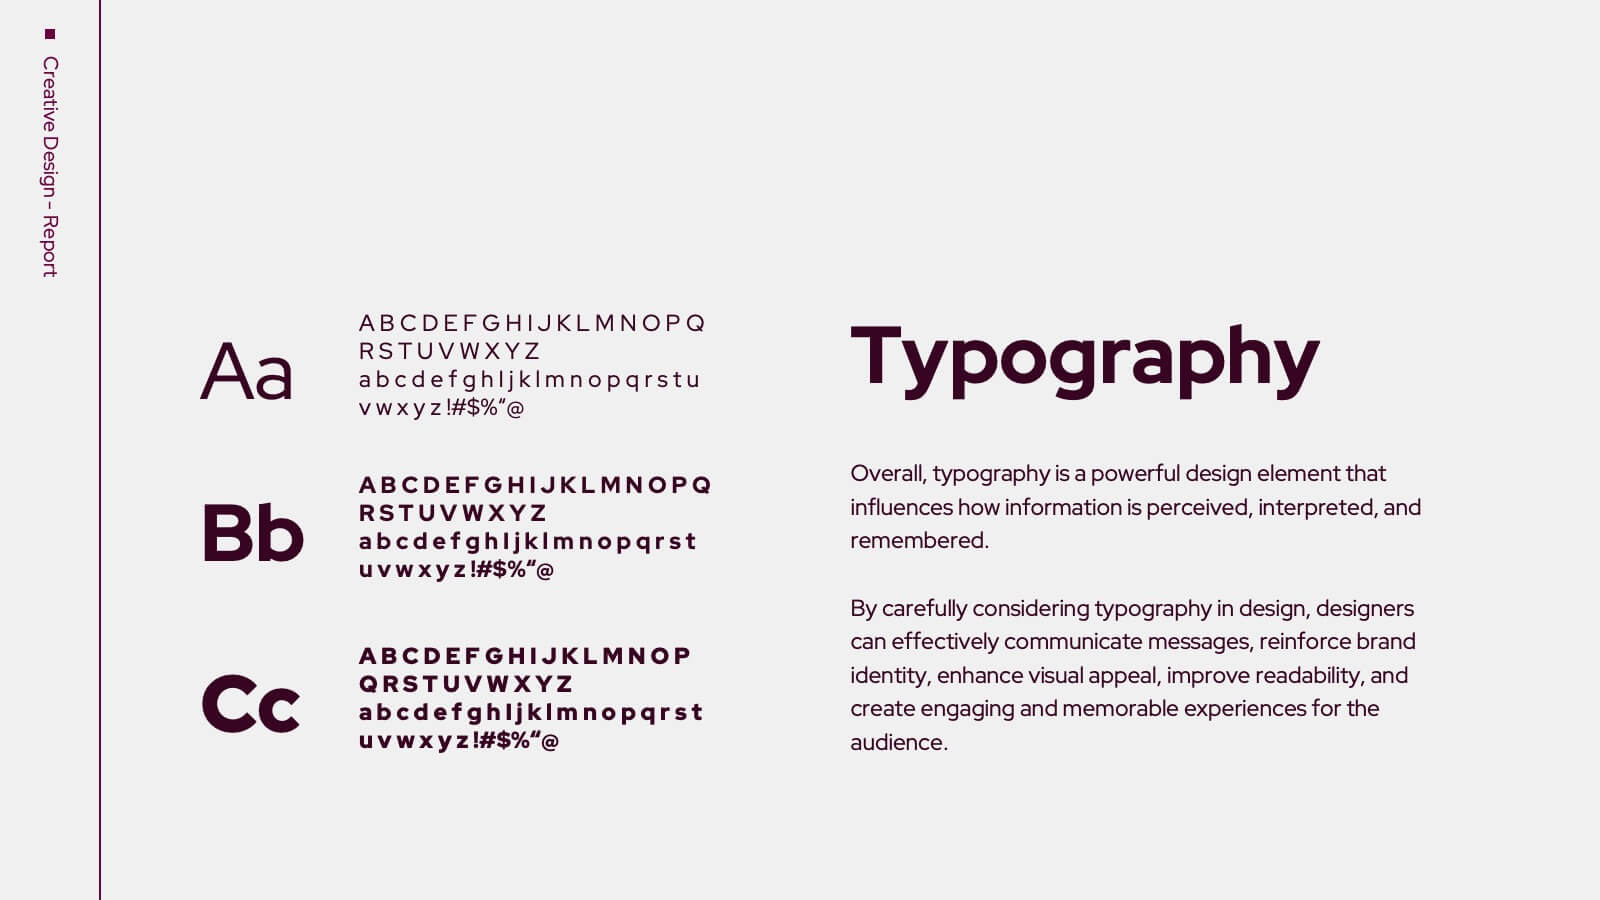
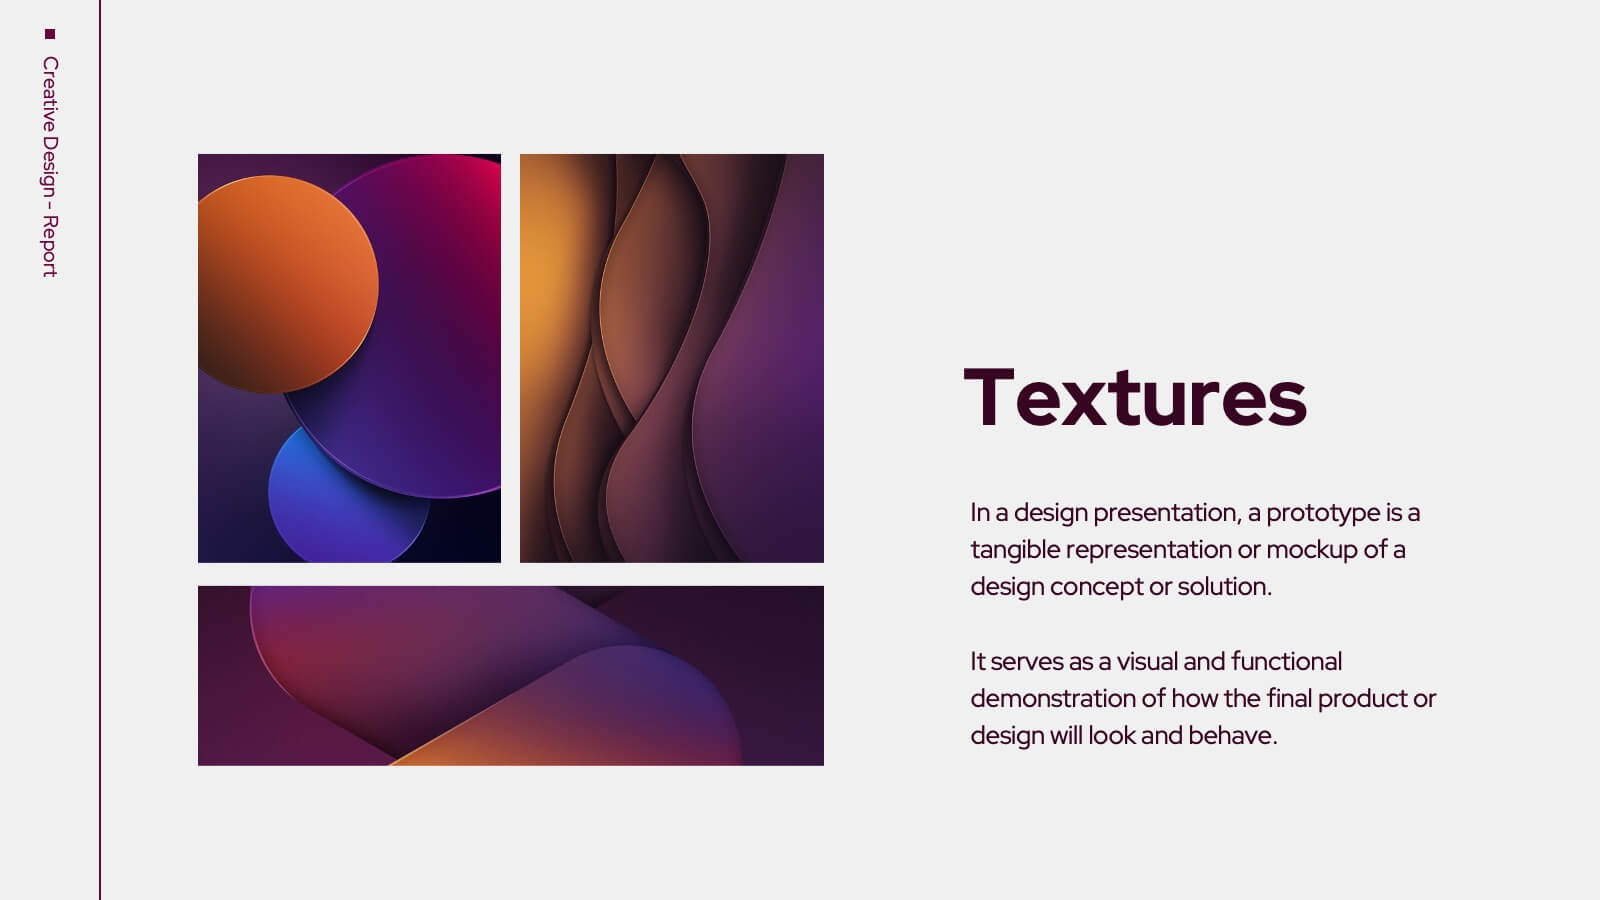
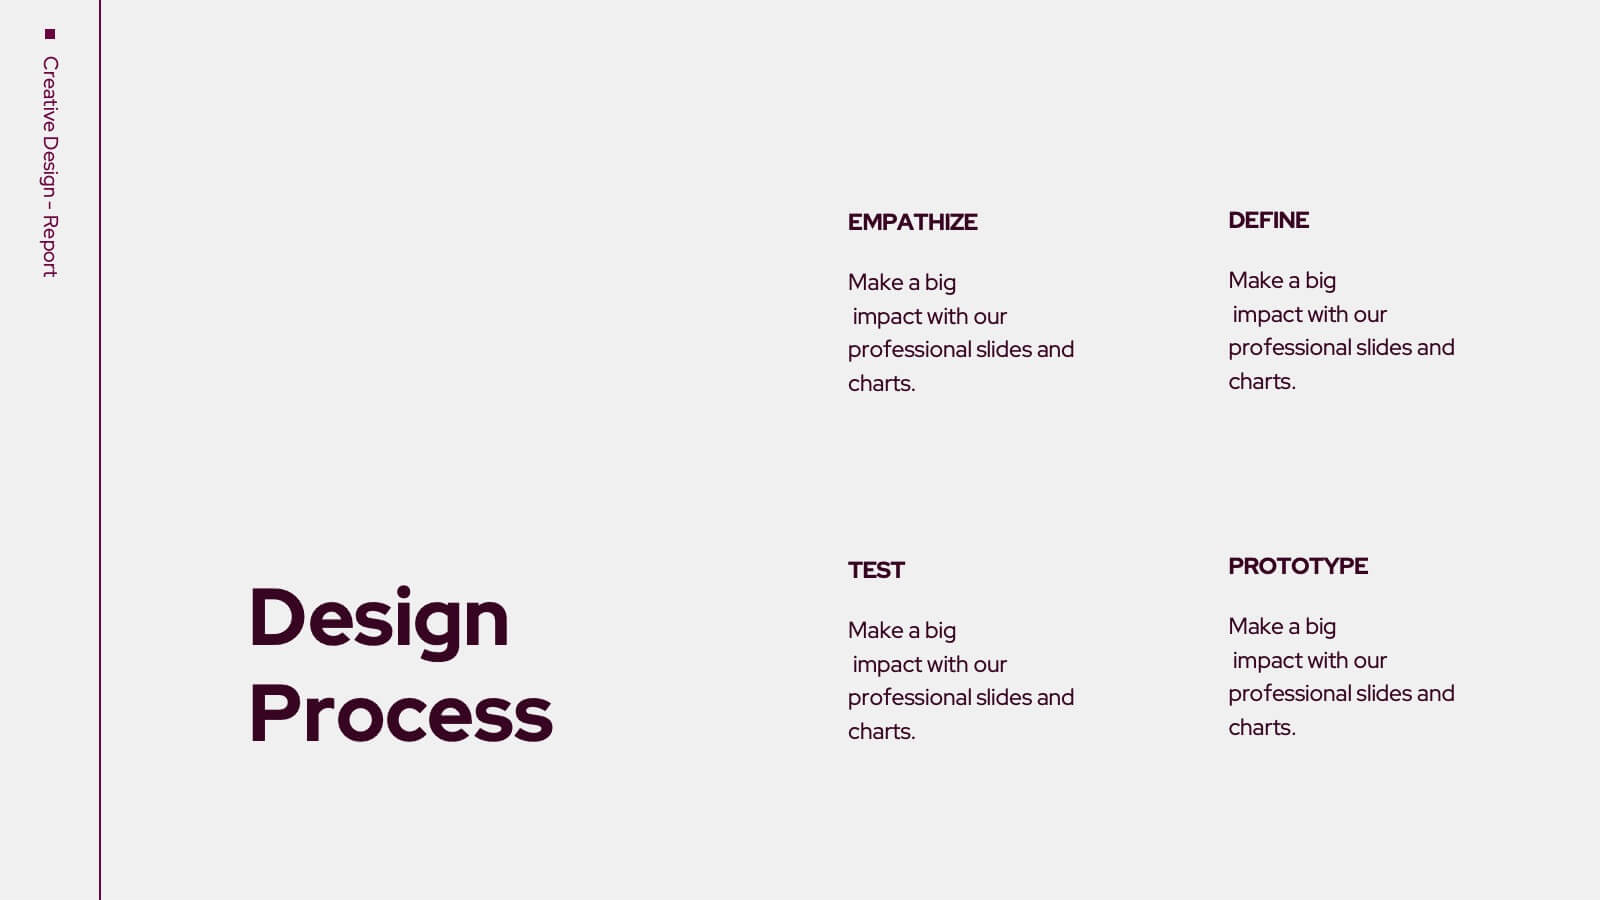
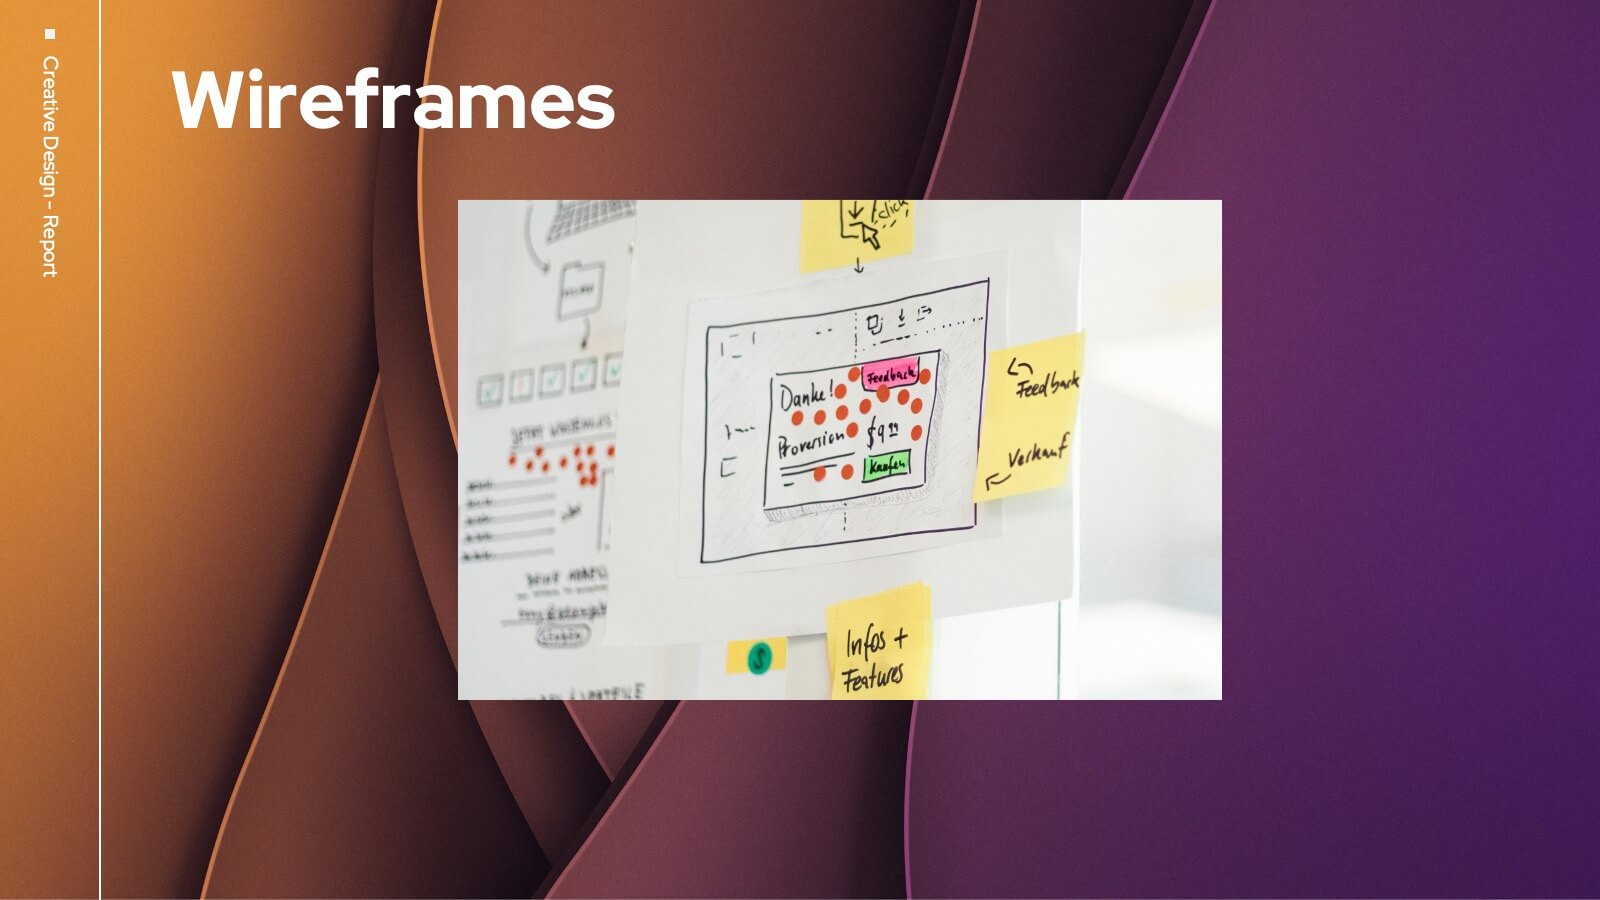
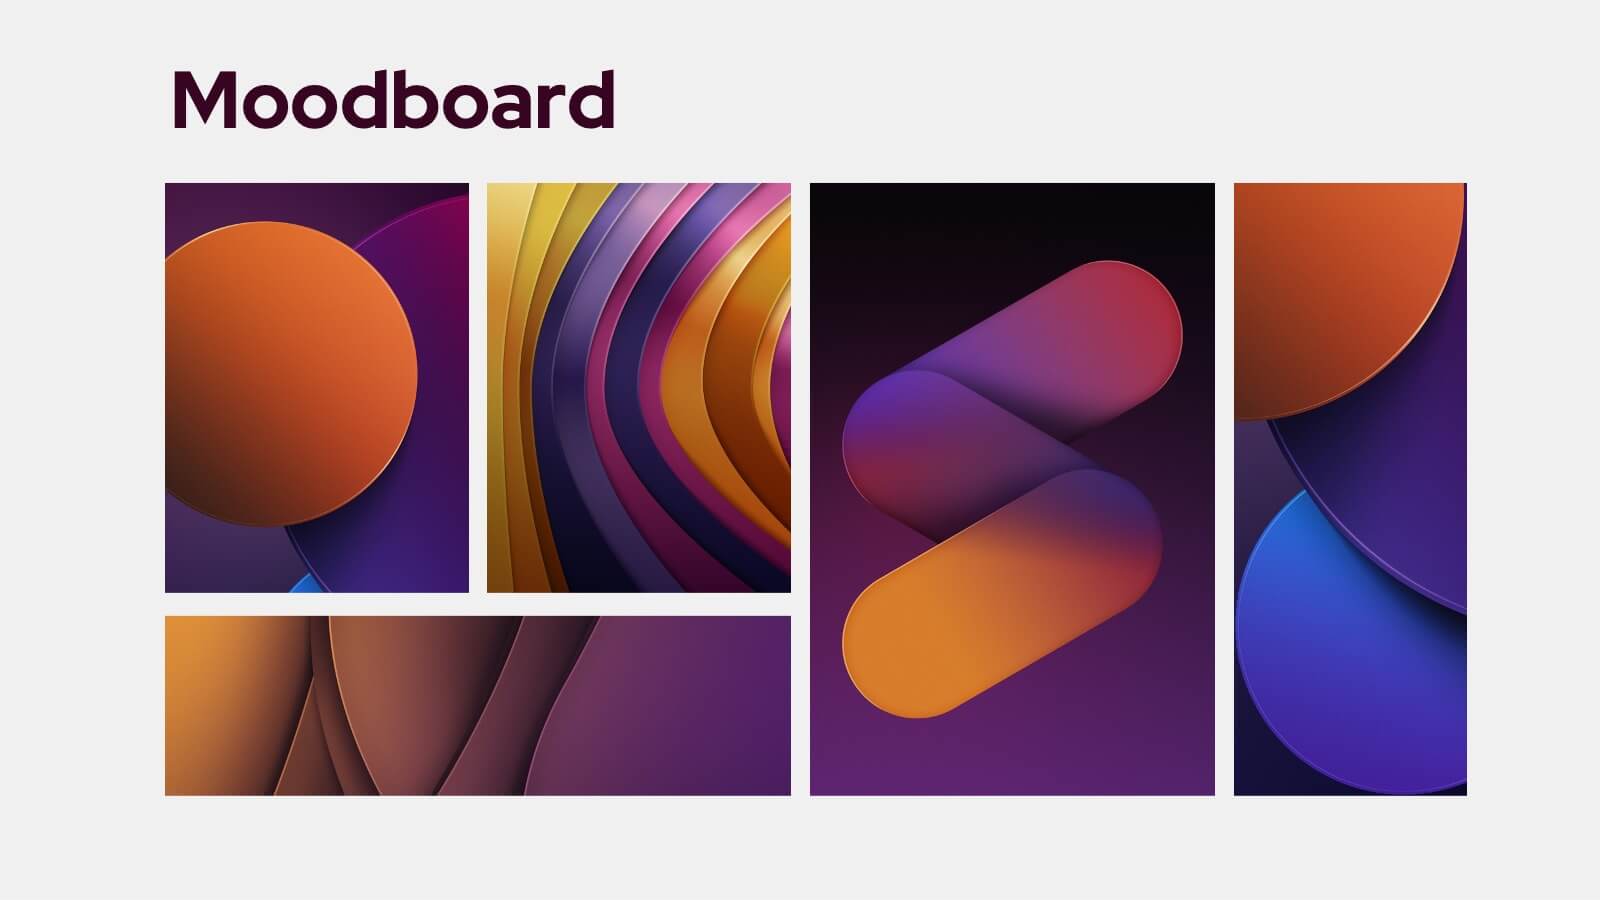
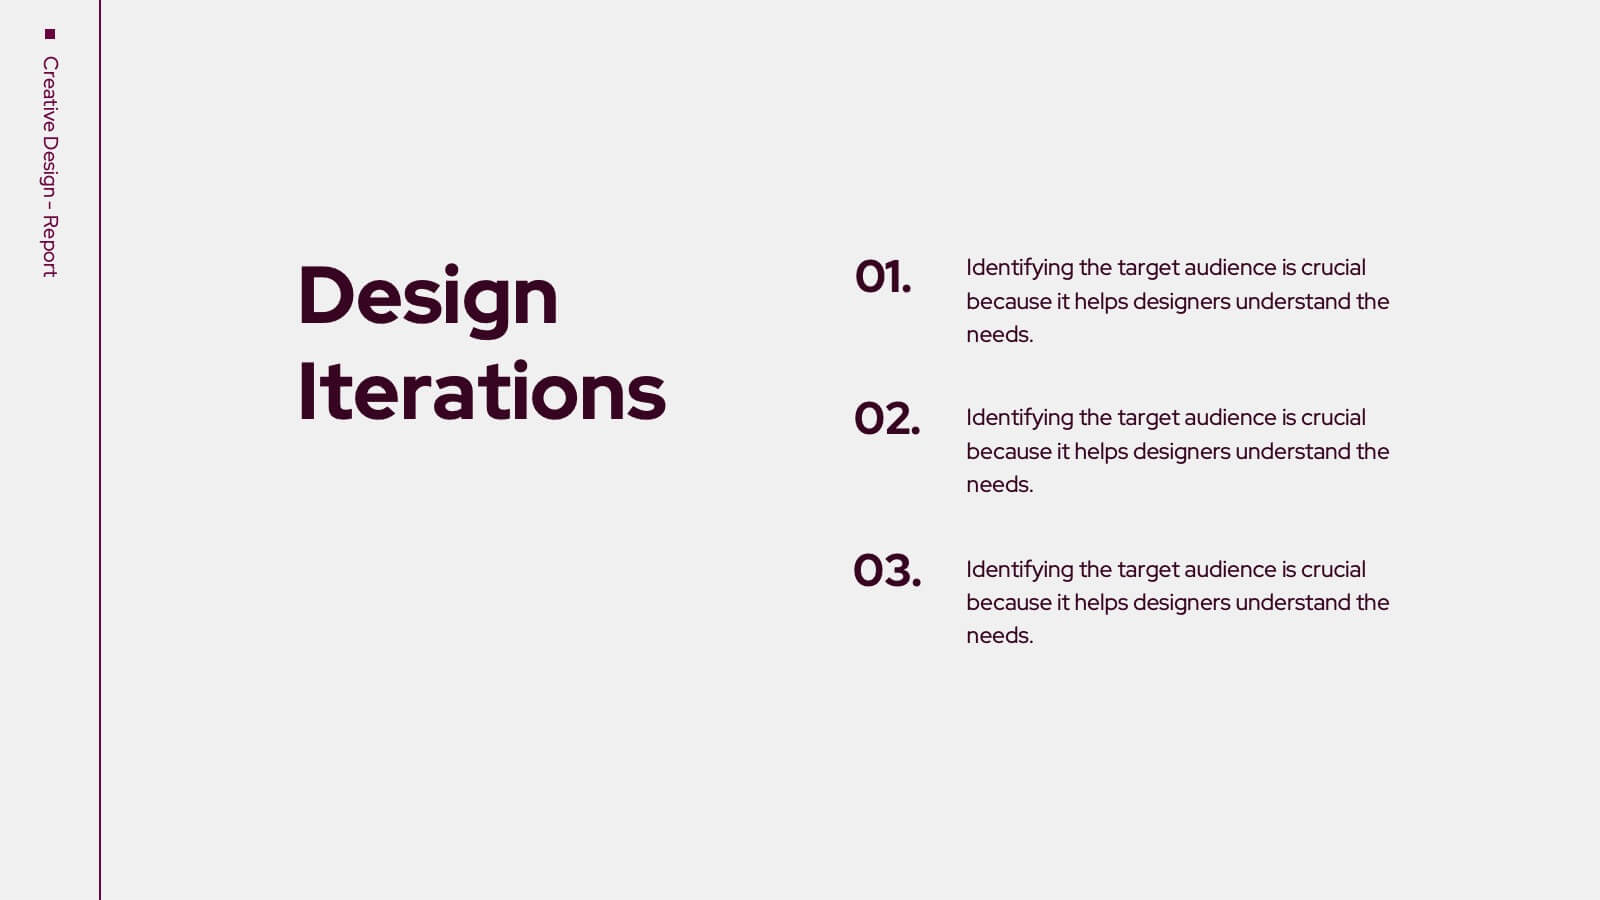
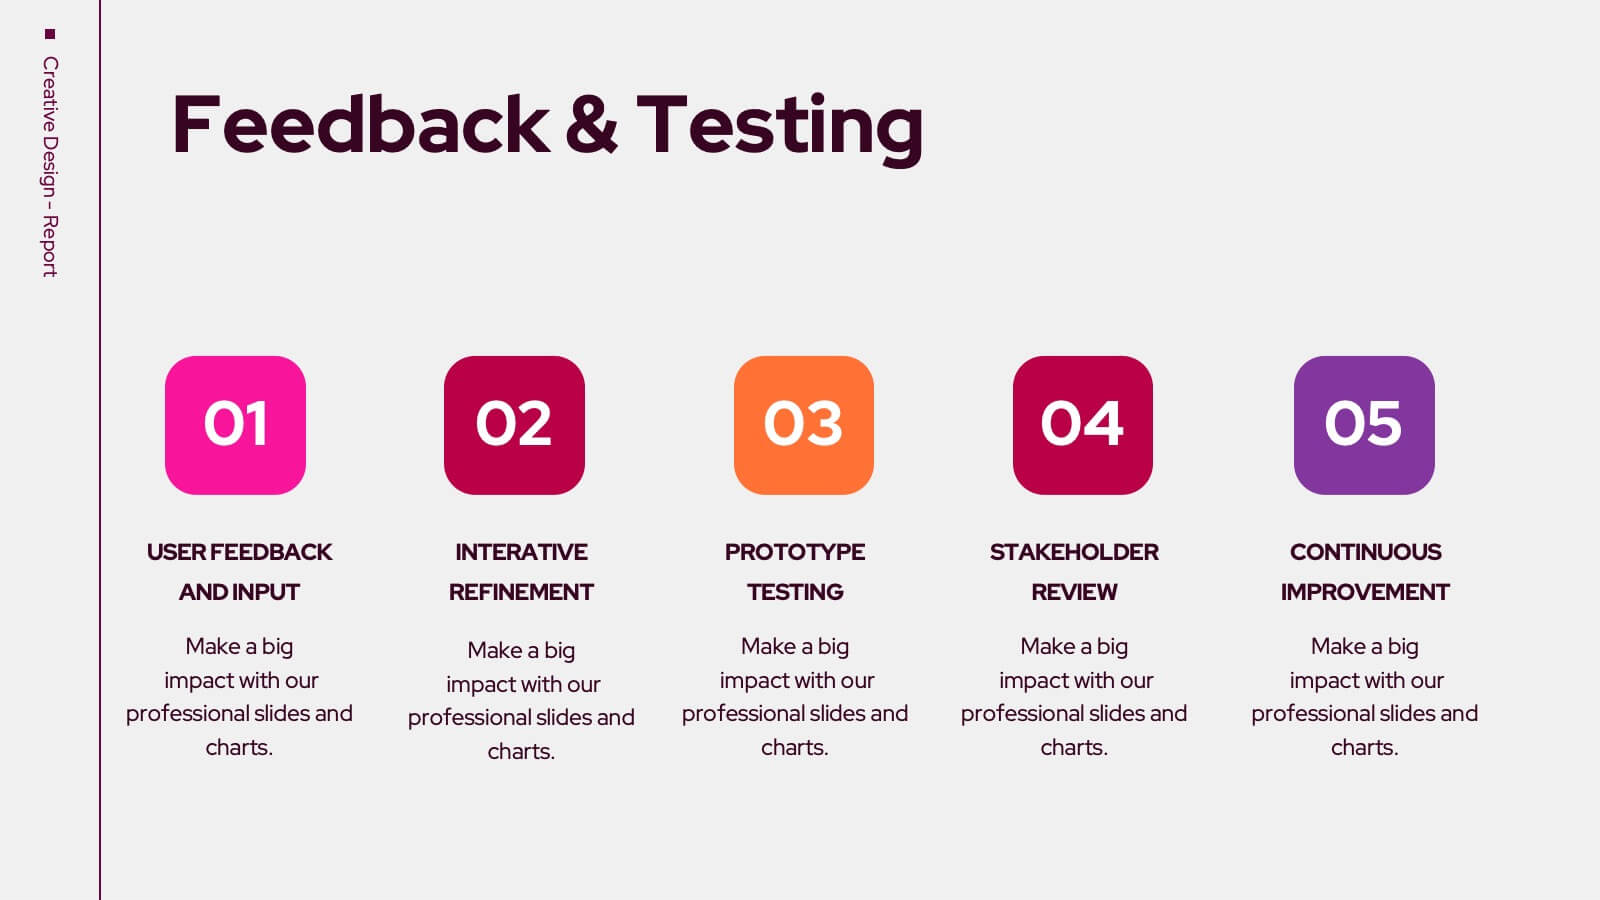
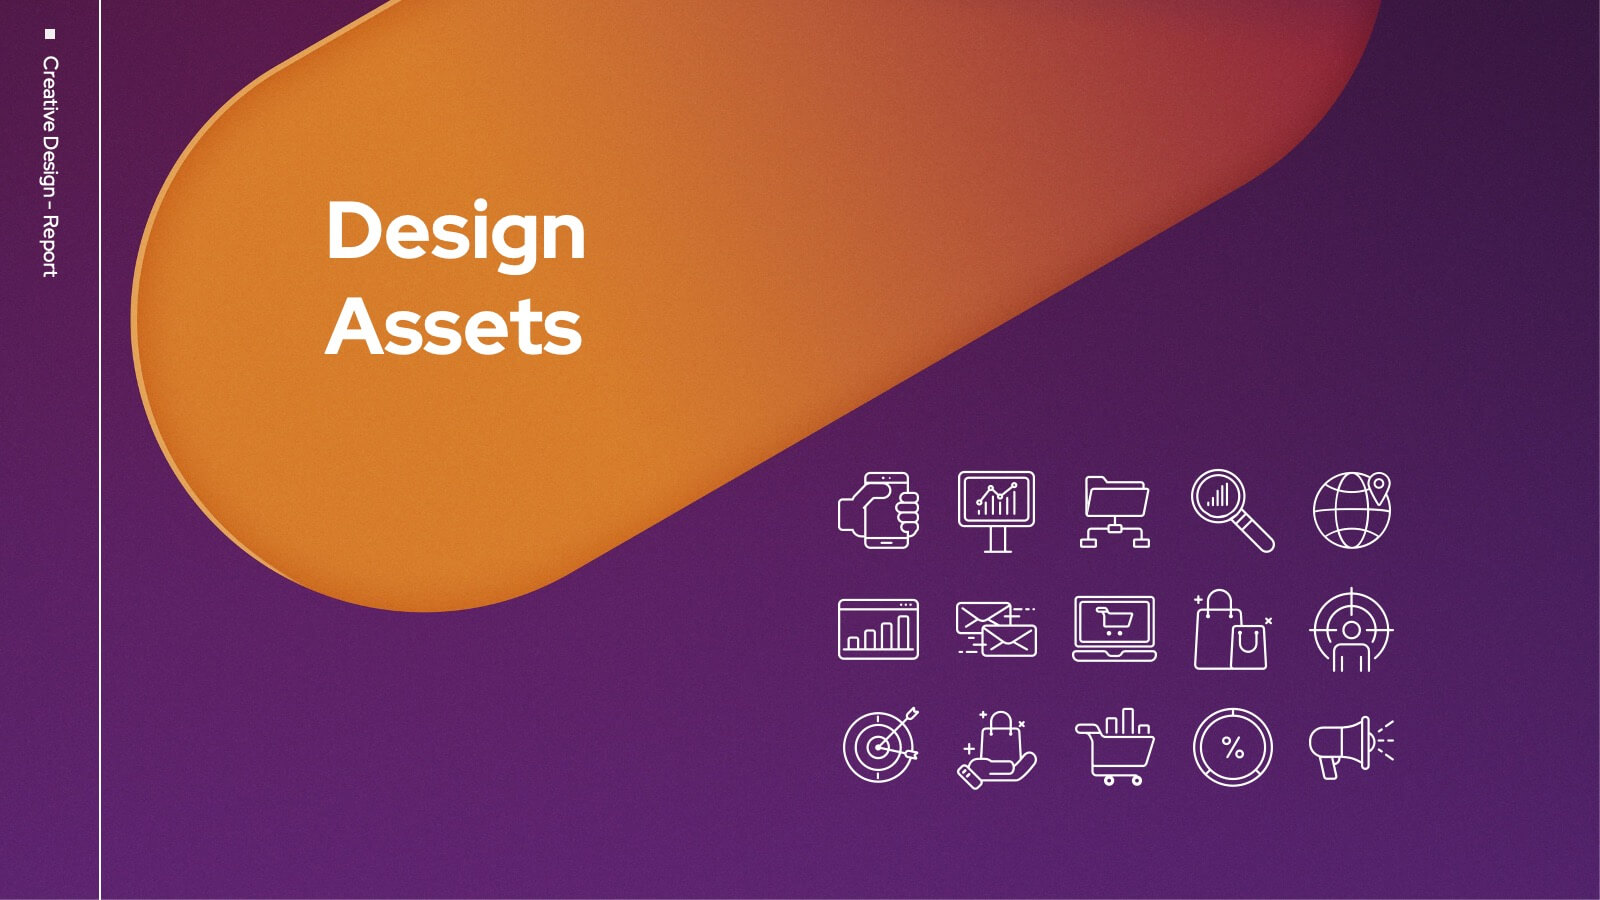
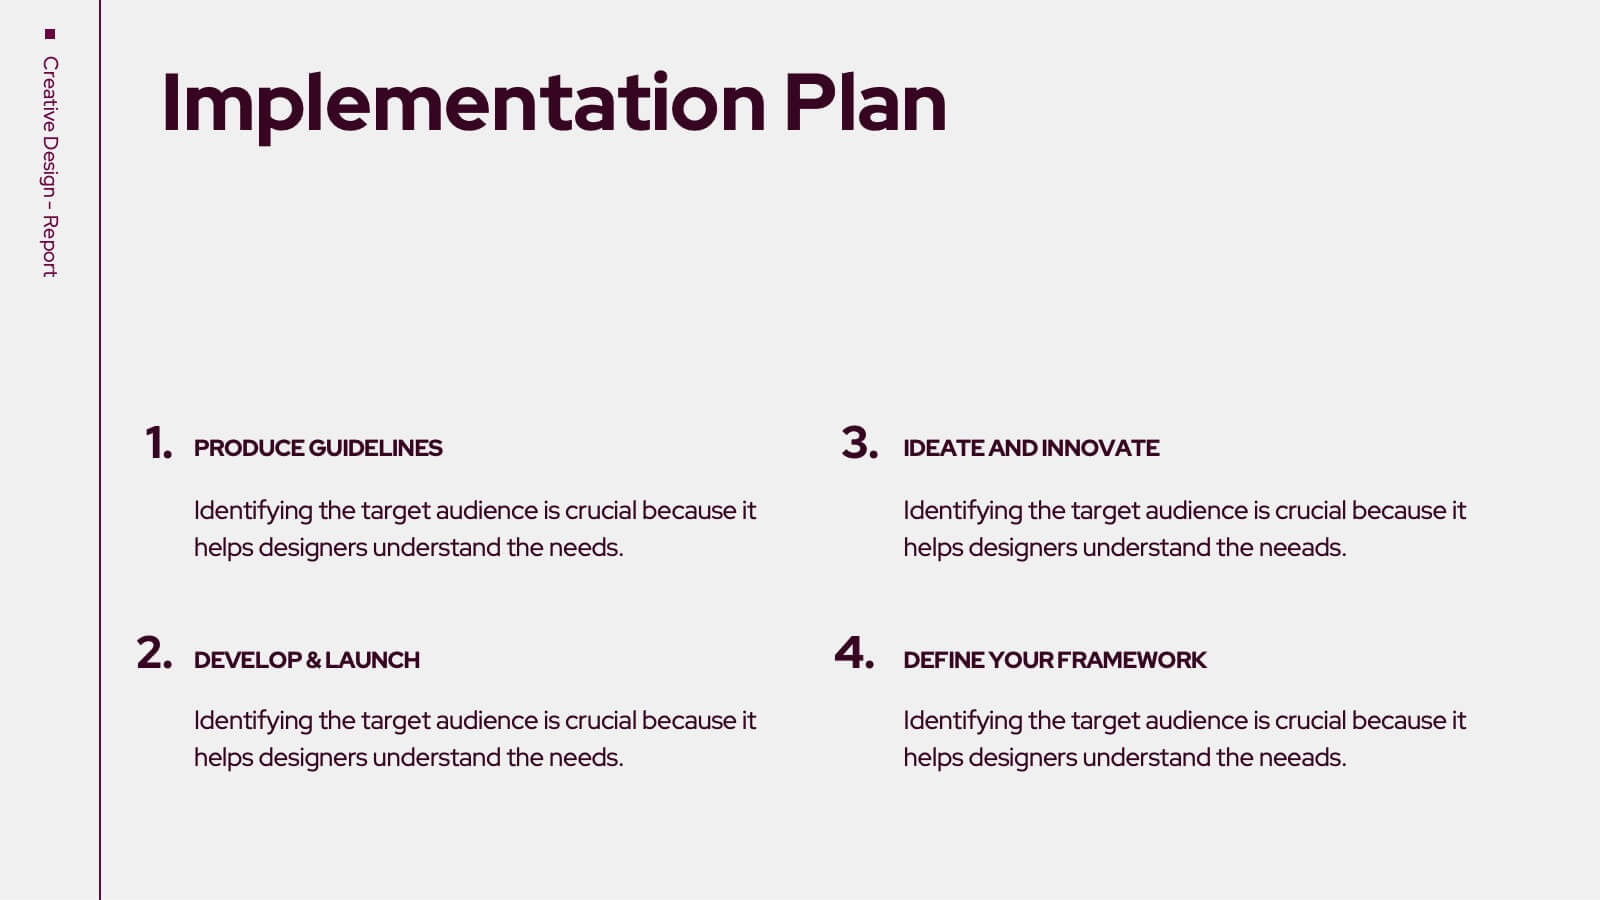
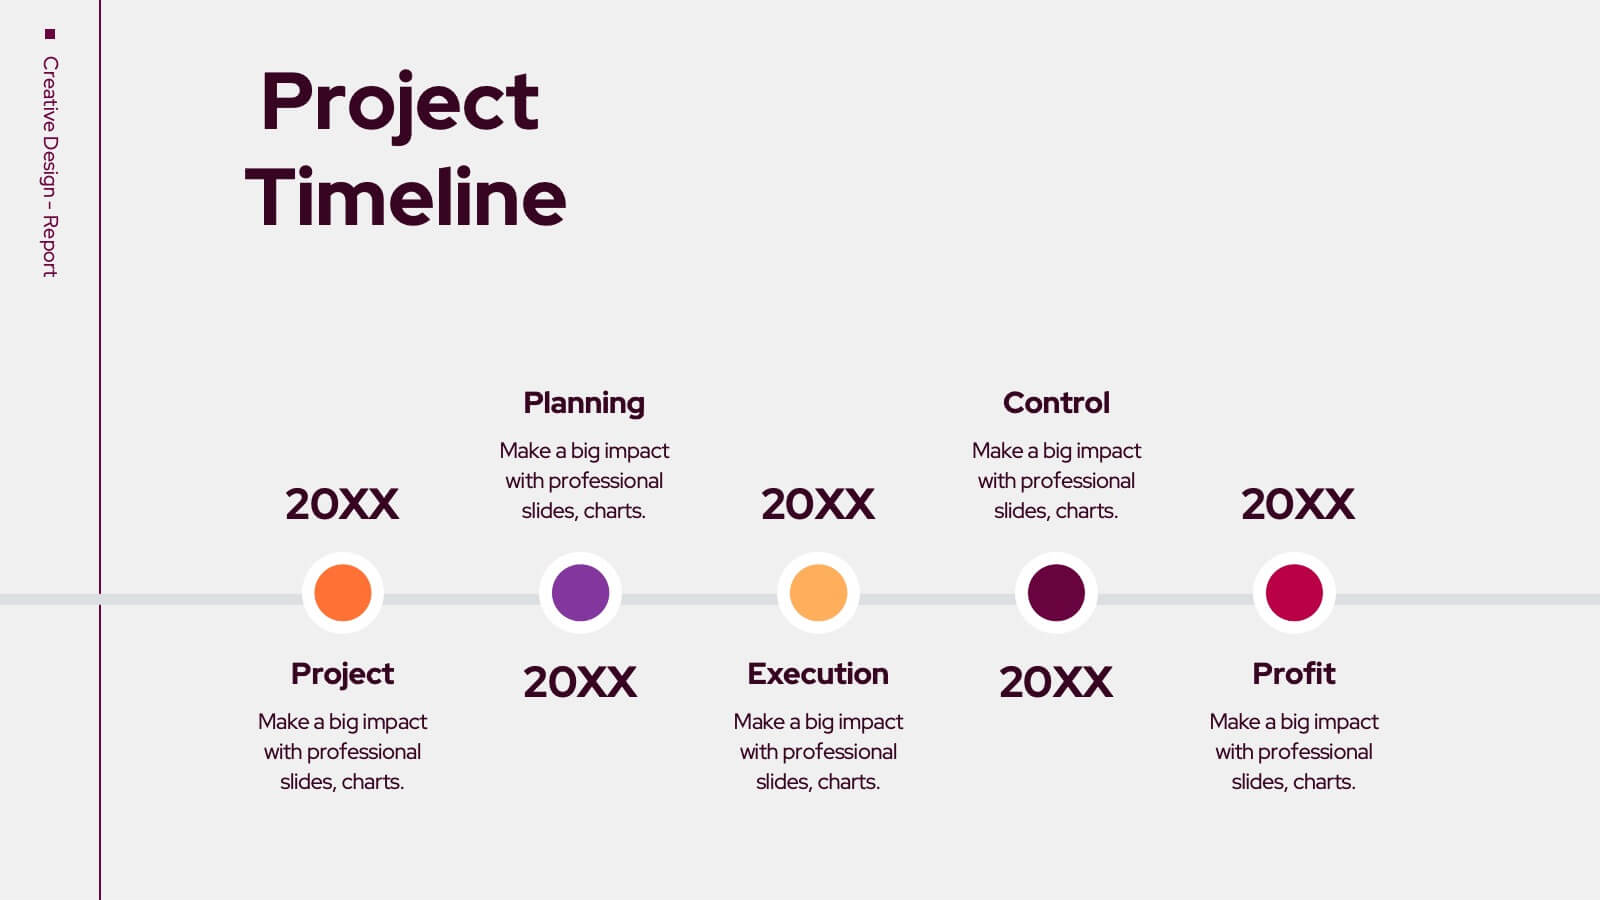
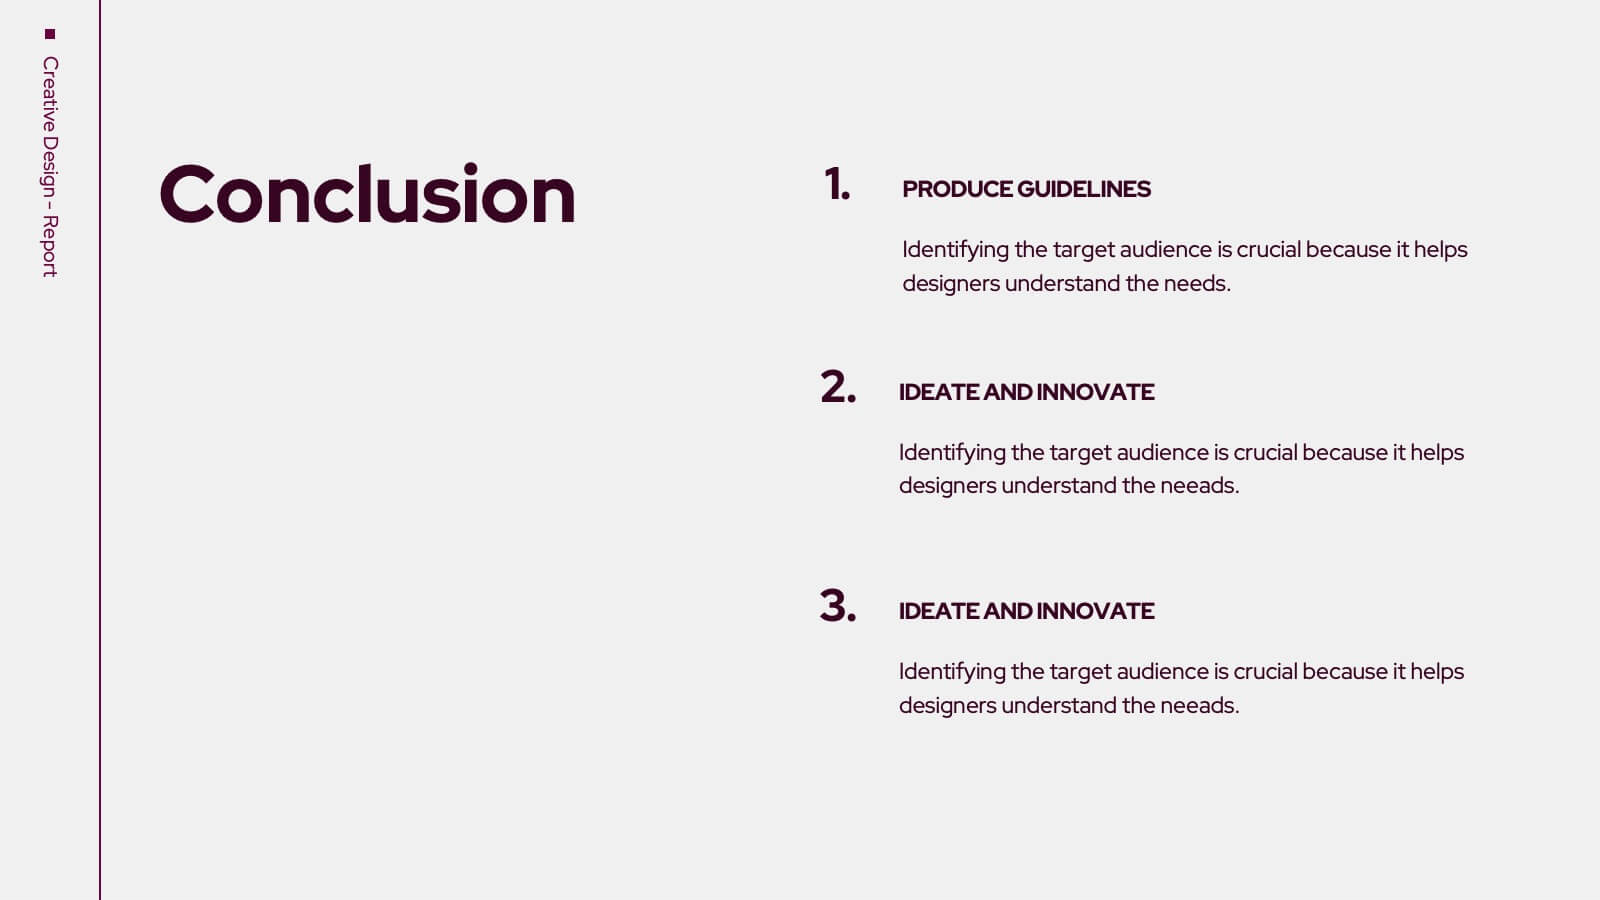
Trojan Creative Design Report Presentation
Unleash your creativity with this striking Trojan-inspired presentation template! Ideal for showcasing your design projects, this presentation enables you to highlight key concepts, inspirations, and visual elements effectively. Its engaging layout ensures your ideas shine through, captivating your audience. Compatible with PowerPoint, Keynote, and Google Slides for seamless presentations.
5 diapositivas
Transportation Flow and Inventory Tracking Presentation
Track movement and stock like a pro with this clean shipping infographic layout. Featuring a cargo ship graphic and segmented titles, it's perfect for illustrating supply chain progress, delivery checkpoints, or inventory updates. Use it to present logistics insights with clarity. Fully compatible with PowerPoint, Keynote, and Google Slides.


3 diapositivas
Company Mission Overview Presentation
Bring your message to life with a bright, modern slide that highlights purpose, direction, and organizational goals in a clean, engaging layout. This presentation helps you communicate mission-driven insights with clarity and visual impact, making it ideal for internal teams or stakeholders. Fully compatible with PowerPoint, Keynote, and Google Slides.


10 diapositivas
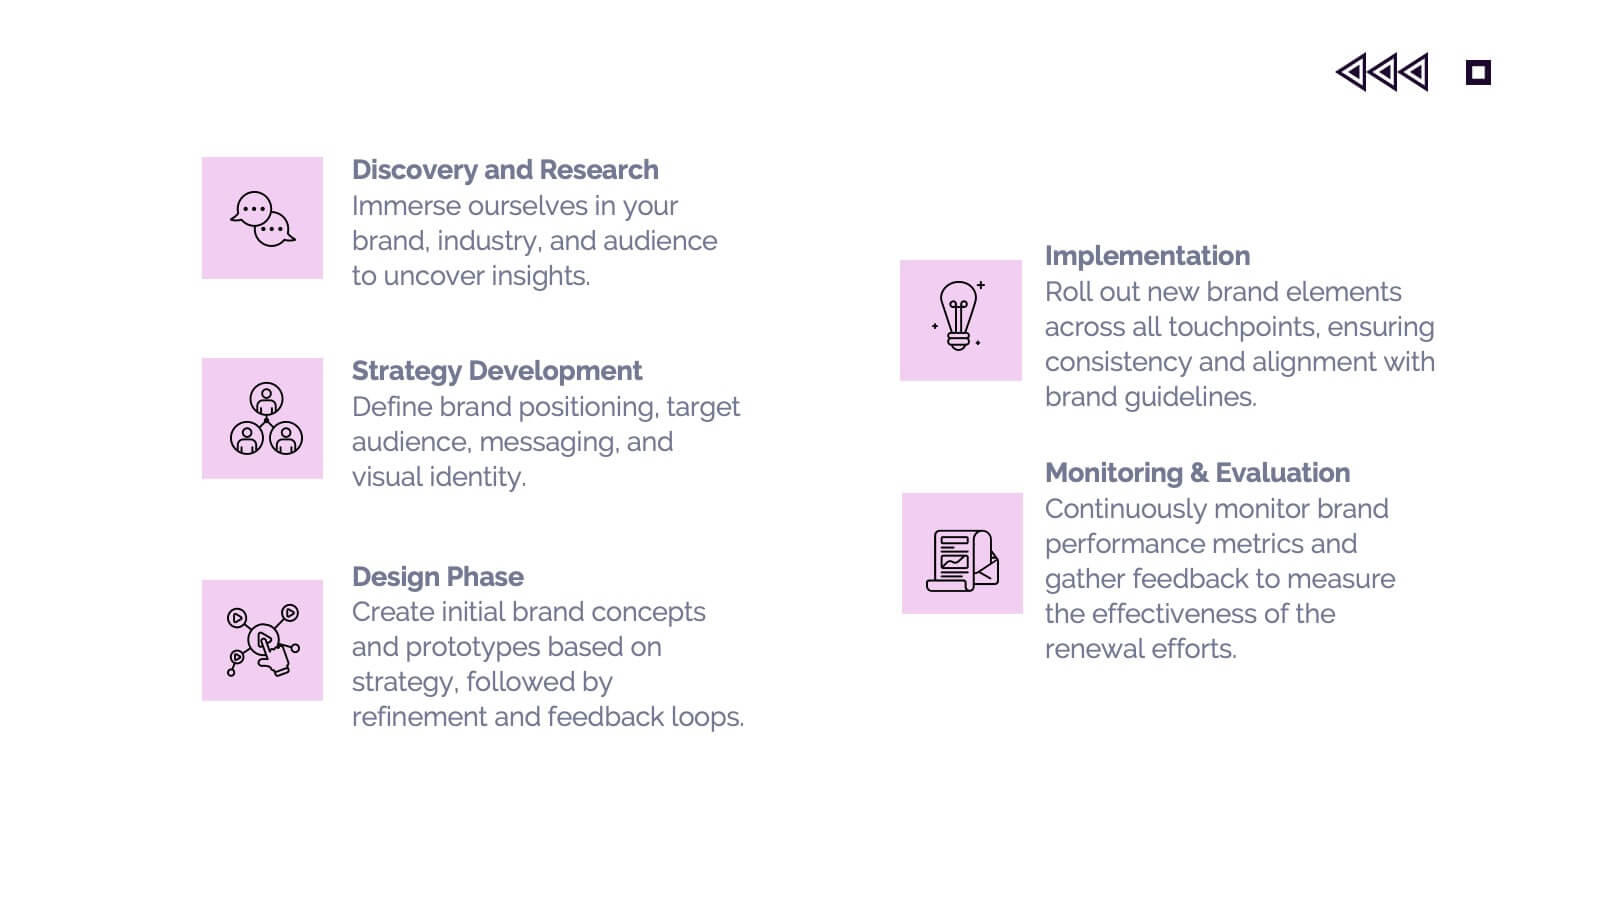
Teamwide Business Implementation Plan Presentation
Visualize your implementation roadmap with this team-focused progress slide. Featuring circular avatars, percentage bars, and milestone titles, it’s ideal for highlighting departmental progress or execution timelines. Fully editable in PowerPoint, Keynote, and Google Slides—perfect for internal updates, leadership reviews, or showcasing collaborative performance across business functions.


4 diapositivas
Incident Prevention and Safety Culture Presentation
Promote a proactive approach to workplace wellbeing with the Incident Prevention and Safety Culture presentation. This visually structured slide uses bold safety icons—such as warning signs, first aid, and hazard symbols—to represent core pillars of a safety-first environment. Ideal for outlining safety protocols, risk mitigation strategies, training initiatives, and cultural values, each section includes editable placeholders for concise messaging. The clean layout supports quick communication in HR briefings, onboarding, or compliance meetings. Fully customizable and compatible with PowerPoint, Keynote, and Google Slides.


21 diapositivas
Mystorin Market Analysis Report Presentation
Present your market analysis findings with this sleek and professional report presentation template. Covering essential sections such as key highlights, performance metrics, competitor insights, and strategic initiatives, it provides a comprehensive framework for data-driven decisions. Ideal for businesses and analysts. Compatible with PowerPoint, Keynote, and Google Slides for easy customization.


7 diapositivas
Construction Jobs Infographic
Construction jobs refer to various roles and professions within the construction industry involved in planning, designing, building, and maintaining structures such as buildings, roads, bridges, dams, and other infrastructures. This infographic template sheds light on various career opportunities within the construction industry, offering a roadmap for aspiring professionals. Compatible with Powerpoint, Keynote, and Google Slides. With this infographic you're not just exploring careers; you're navigating a landscape of opportunities, ready to build a successful career in the dynamic world of construction.


5 diapositivas
Market Positioning and SWOT of Rivals Presentation
Clearly define your competitive edge with the Market Positioning and SWOT of Rivals Presentation. This layout helps you showcase strengths, weaknesses, opportunities, and threats across key market players using a unique interlinked format. Easy to edit in Canva, PowerPoint, Keynote, and Google Slides—perfect for strategic business overviews.


6 diapositivas
Business Roadmap Strategy Presentation
Map your path to success with this Business Roadmap Strategy template. Designed for clarity and impact, it helps you outline goals, milestones, and timelines in a visual journey. Ideal for team planning, strategy meetings, and pitches. Compatible with PowerPoint, Keynote, and Google Slides for seamless editing.


4 diapositivas
Creative Title Layout Presentation
Give your presentation a fresh, artistic flair with a bold and playful cover design that instantly grabs attention. Ideal for creative portfolios, branding pitches, or modern business decks, this layout blends minimalism with fluid shapes for a dynamic look. Fully customizable in PowerPoint, Keynote, and Google Slides.


5 diapositivas
Optimized Process Flow Diagram Presentation
Streamline workflows with the Optimized Process Flow Diagram. This professional template visualizes key business processes for efficient decision-making and execution. Designed for project managers, analysts, and strategists, it ensures a clear, structured overview of sequential steps. Fully editable and compatible with PowerPoint, Keynote, and Google Slides.


23 diapositivas
Wendigo Agency Portfolio Presentation
This sleek agency portfolio template showcases your mission, services, and success stories with modern flair. From case studies and strategy development to campaign execution and client testimonials, it’s designed to highlight your agency’s strengths. Perfect for agency presentations across PowerPoint, Keynote, and Google Slides, this template makes your content shine effortlessly.


4 diapositivas
Freight & Logistics Route Planning Presentation
Track every mile with this smart and stylish logistics flowchart. Visualize freight movement across air, sea, rail, and road using bold, intuitive icons and directional arrows. A great fit for supply chain managers and route optimization strategies. Easily customizable in PowerPoint, Keynote, and Google Slides.