


Características


¿Tienes alguna pregunta?
Recomendar


21 diapositivas
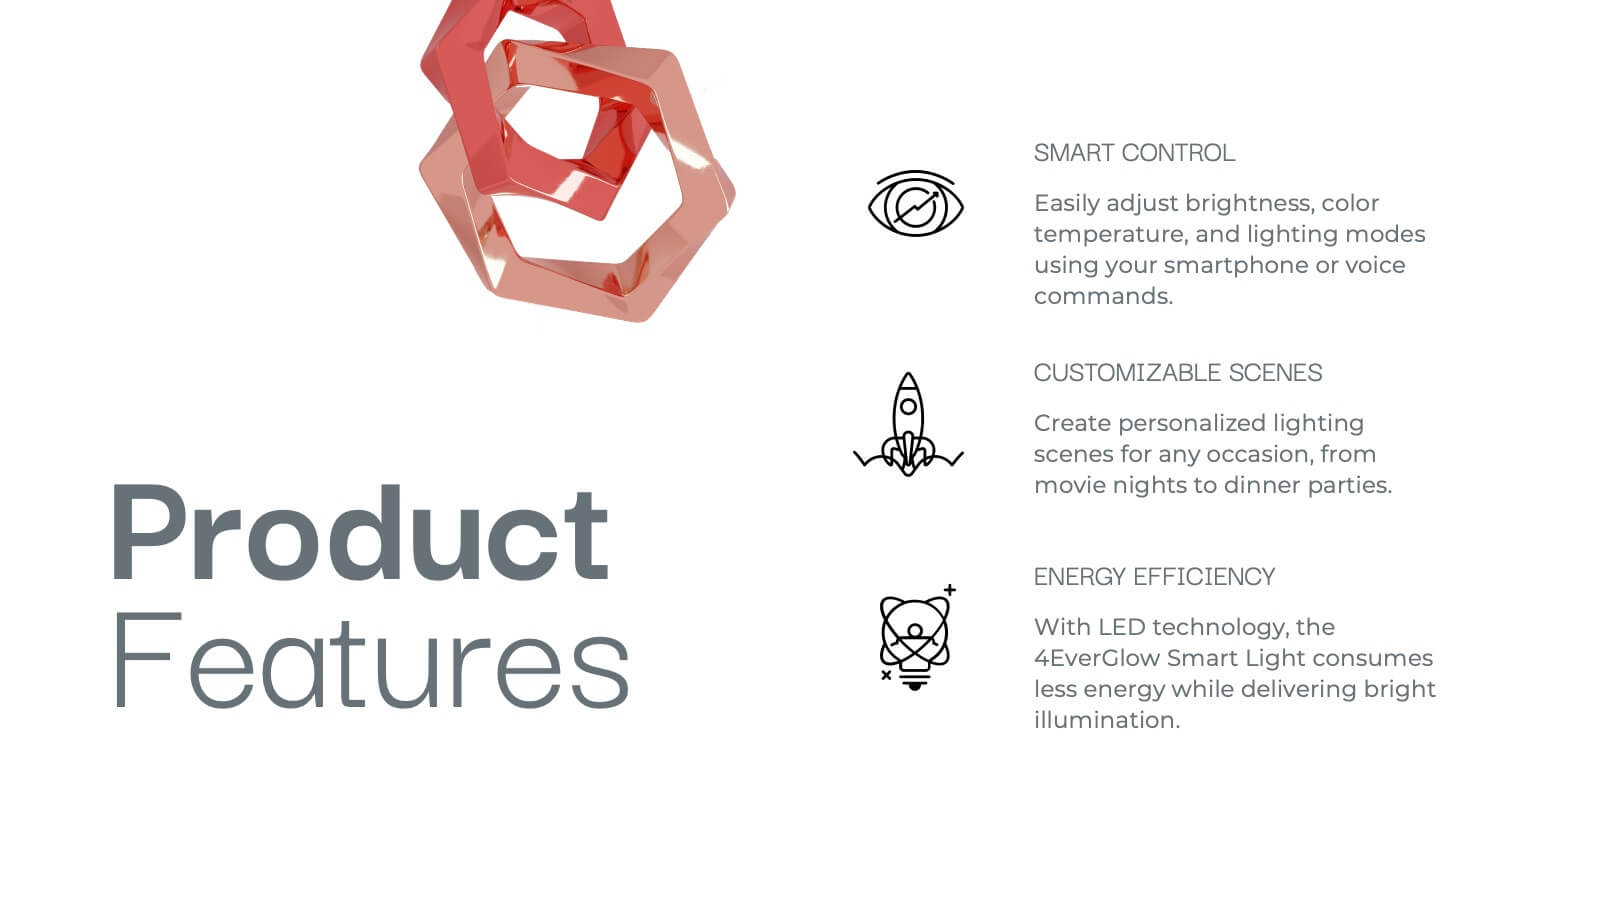
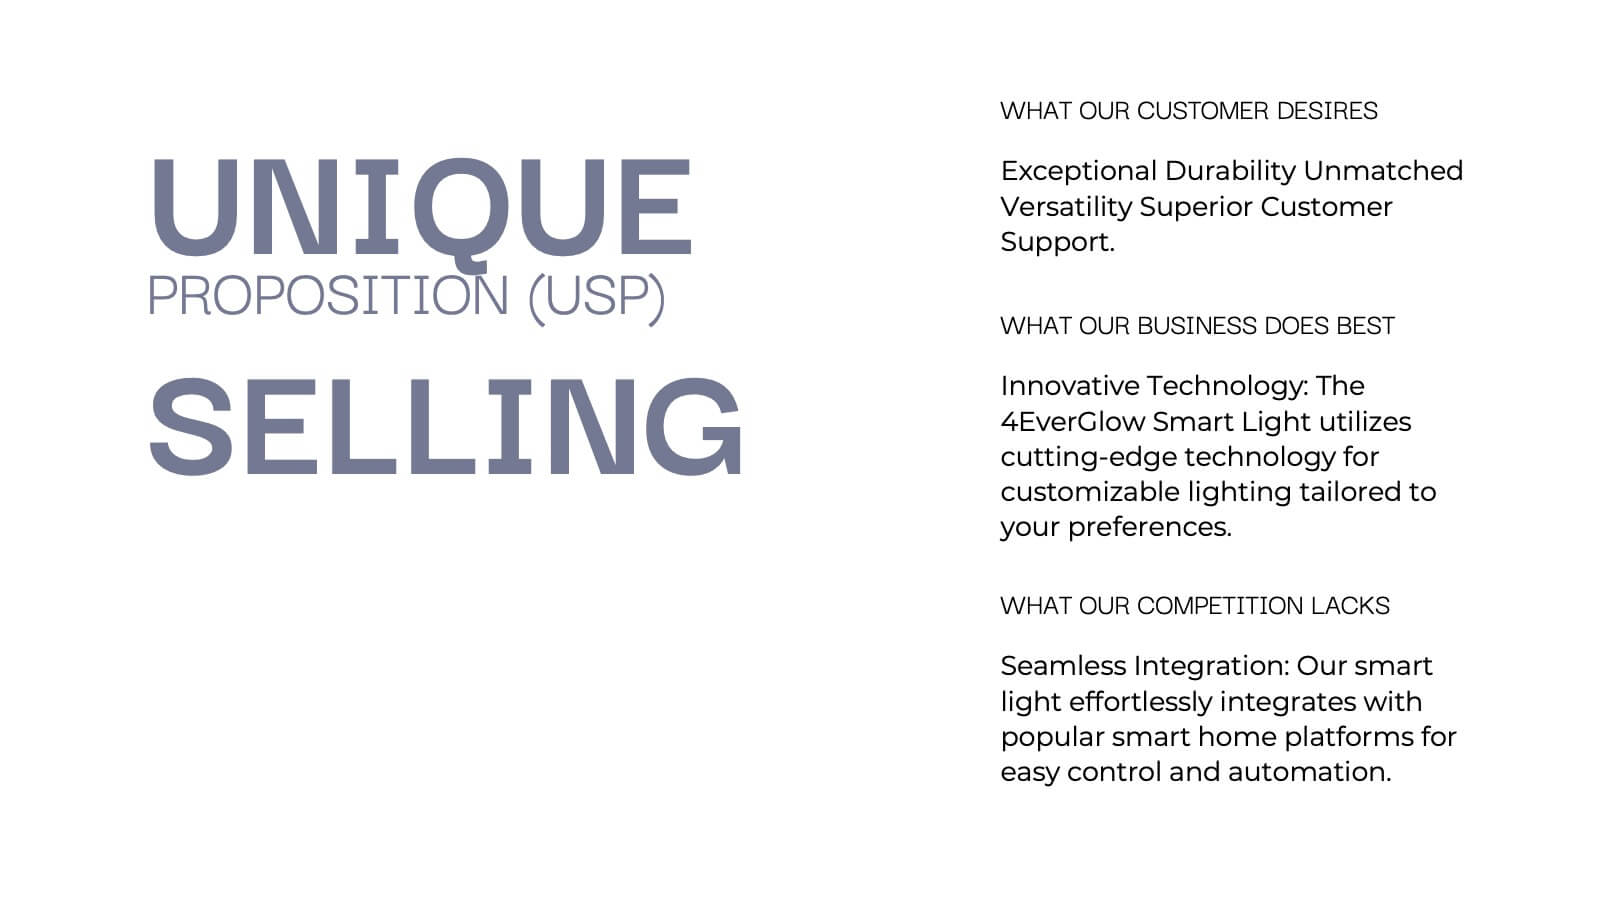
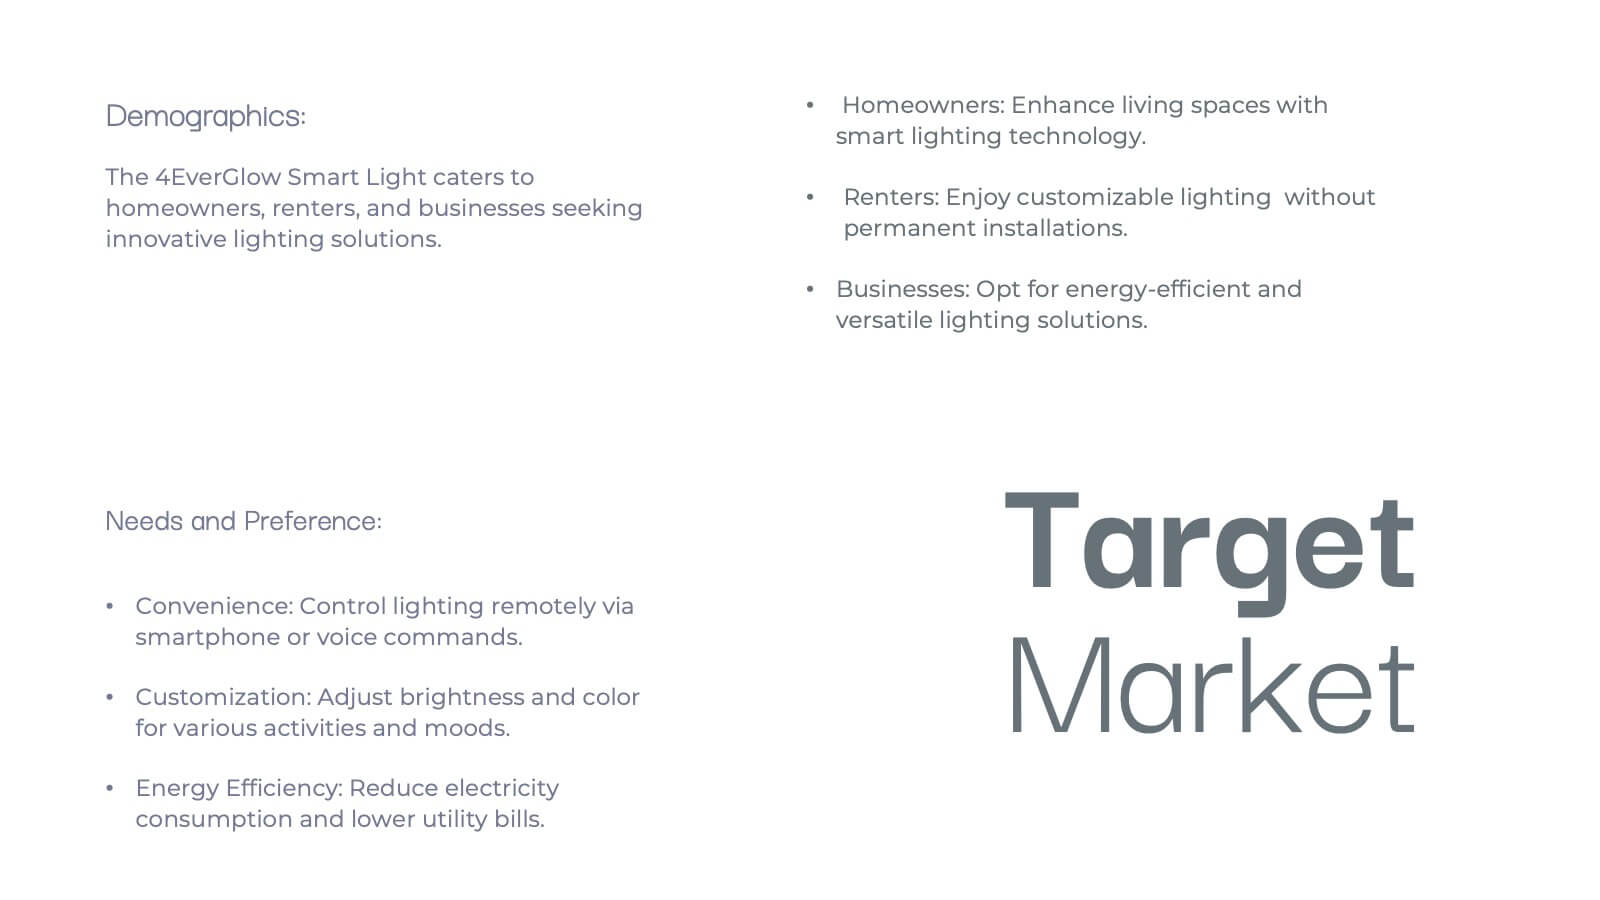
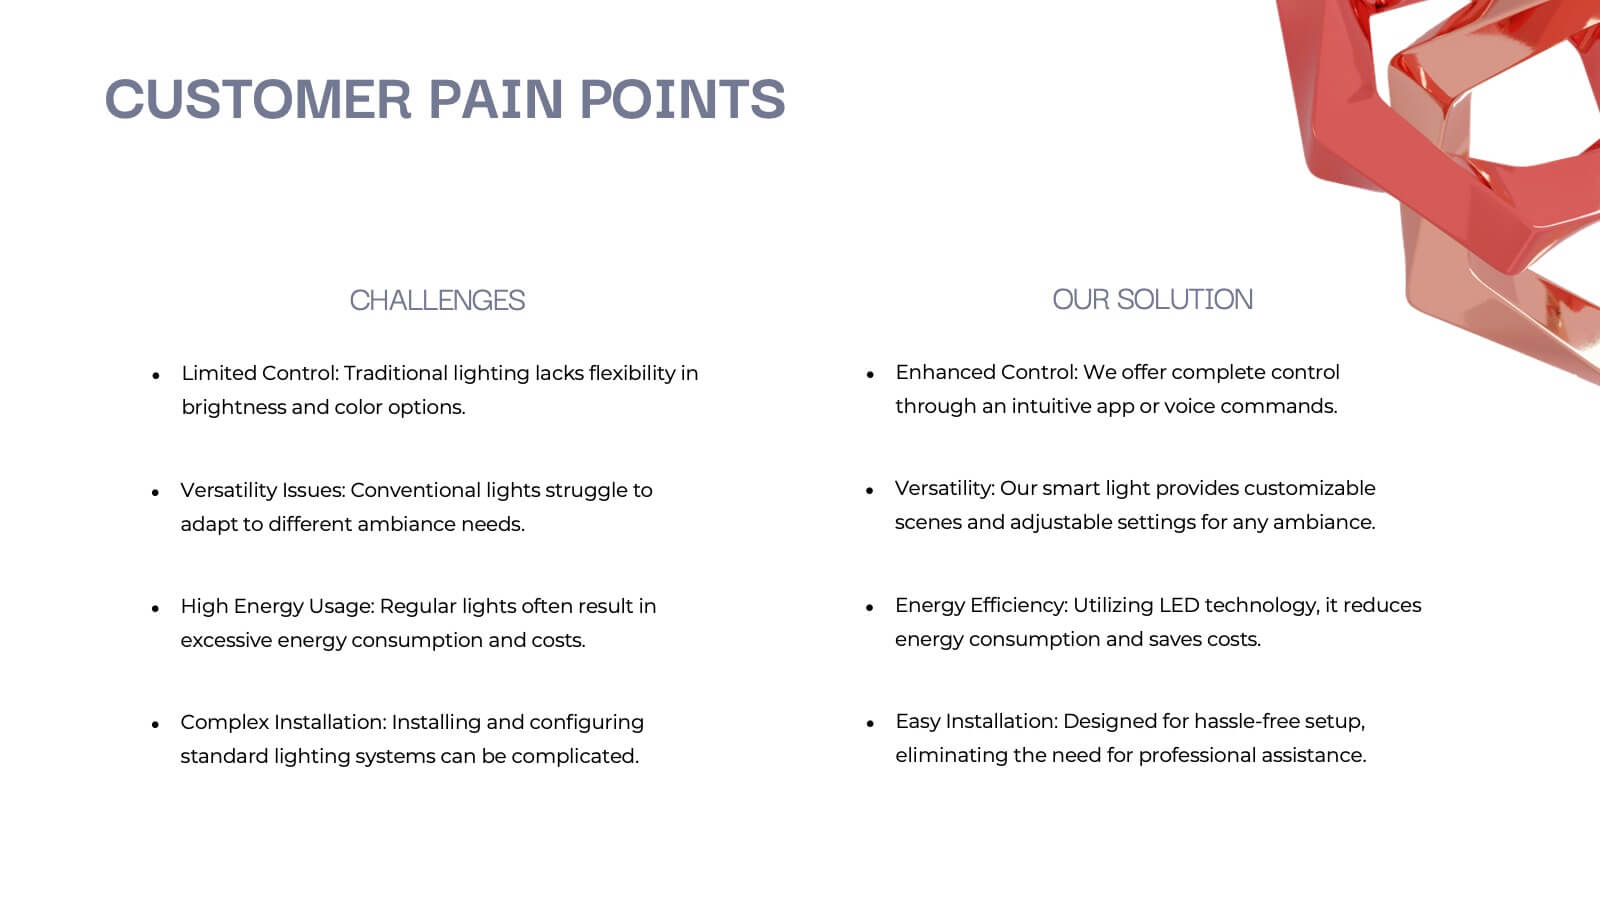
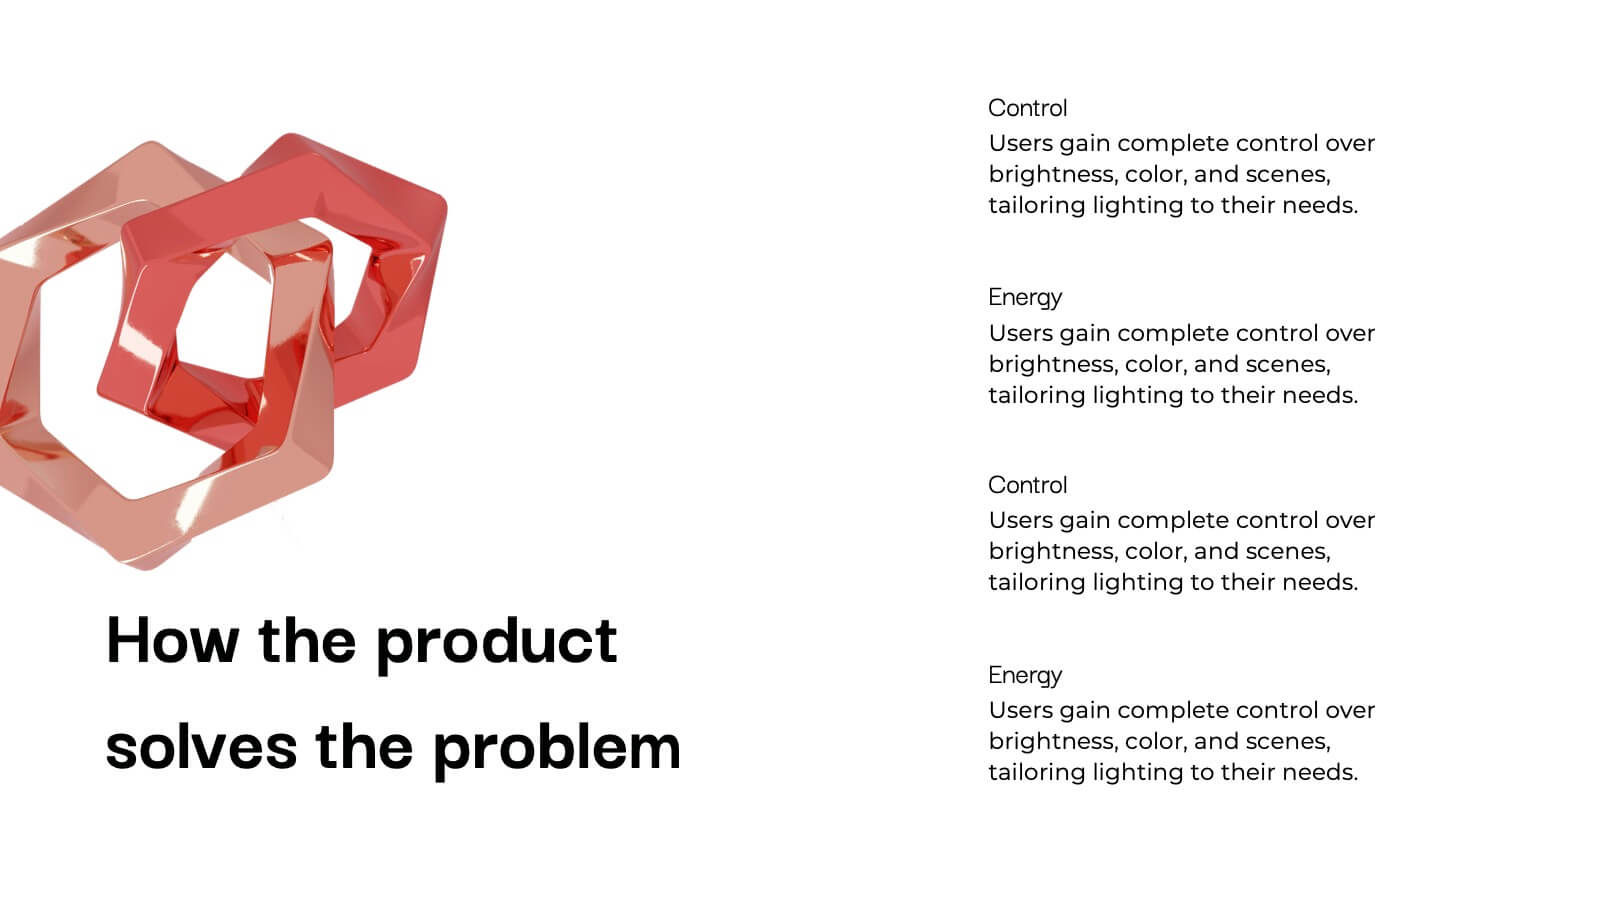
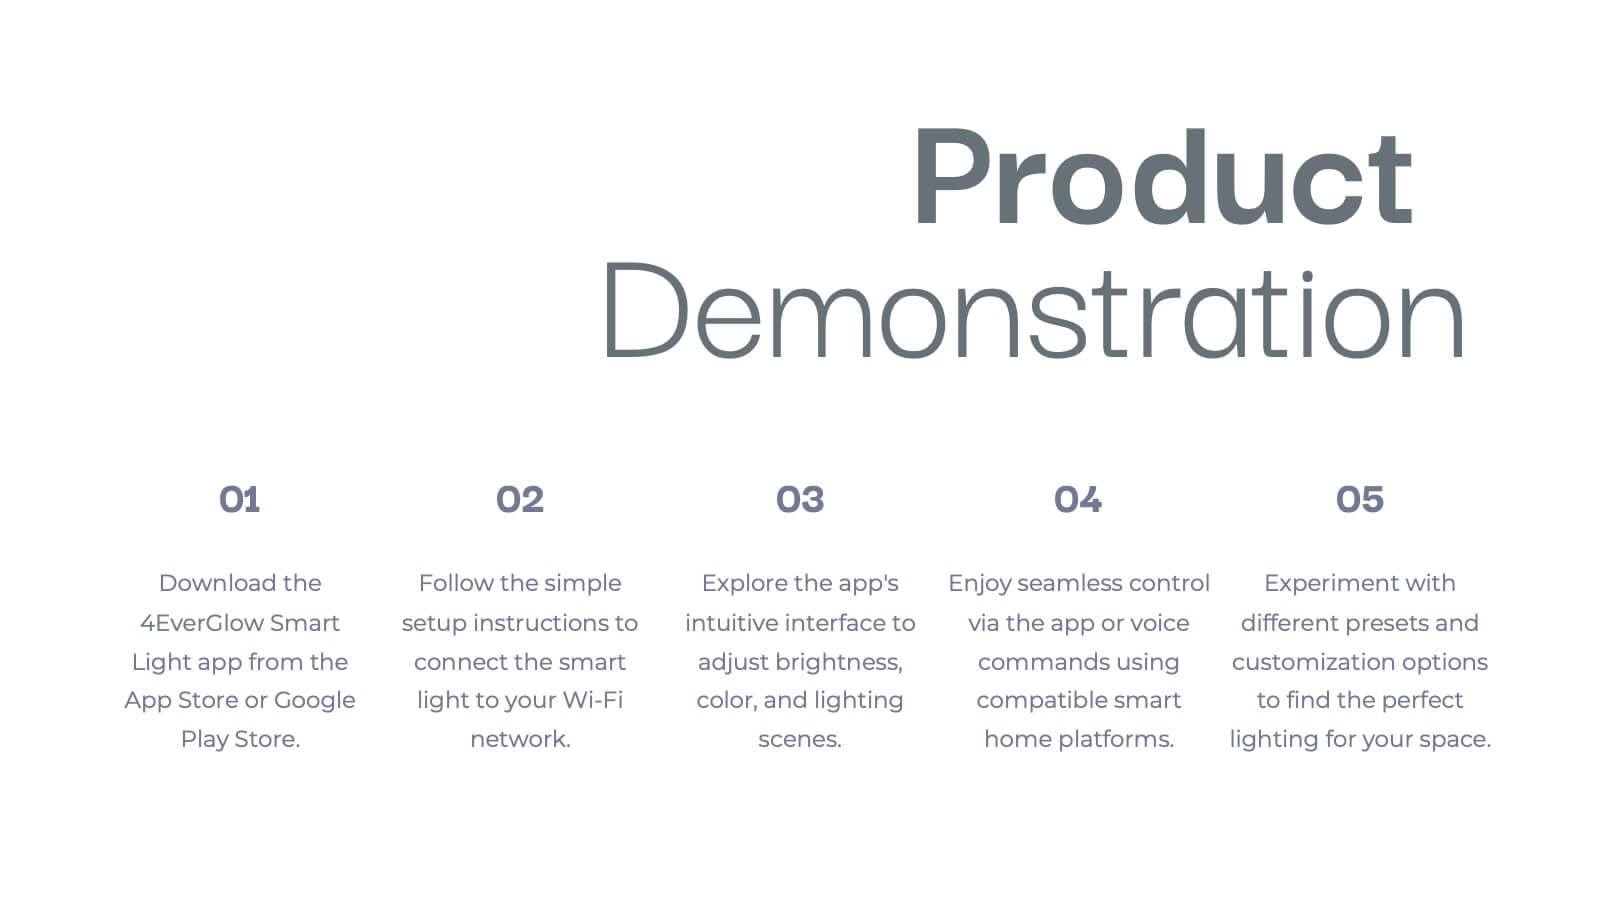
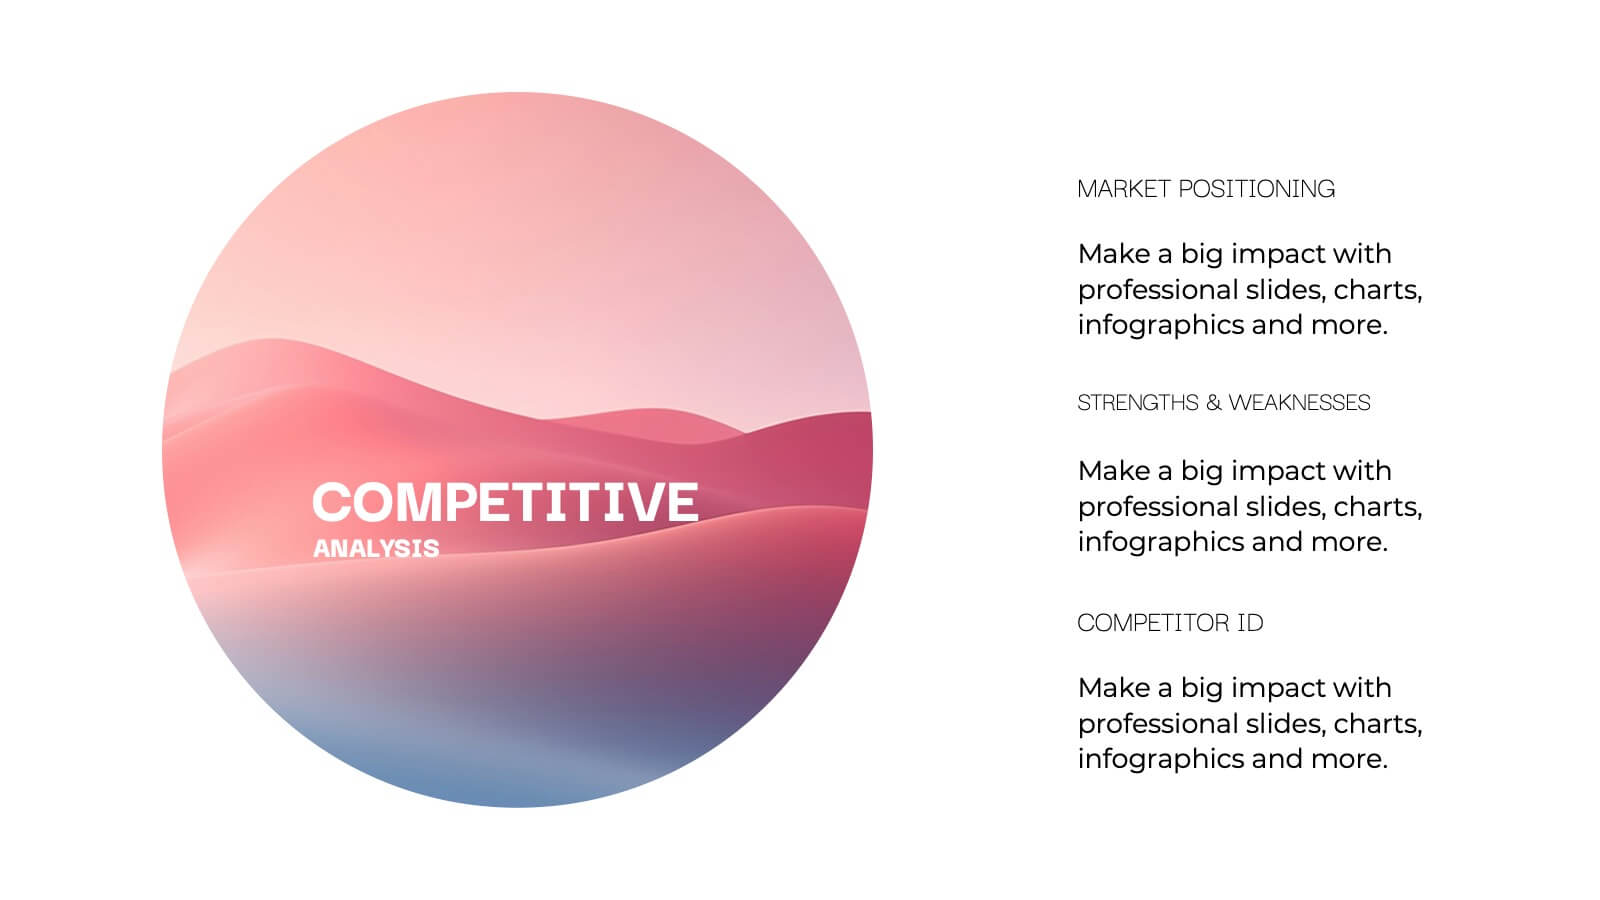
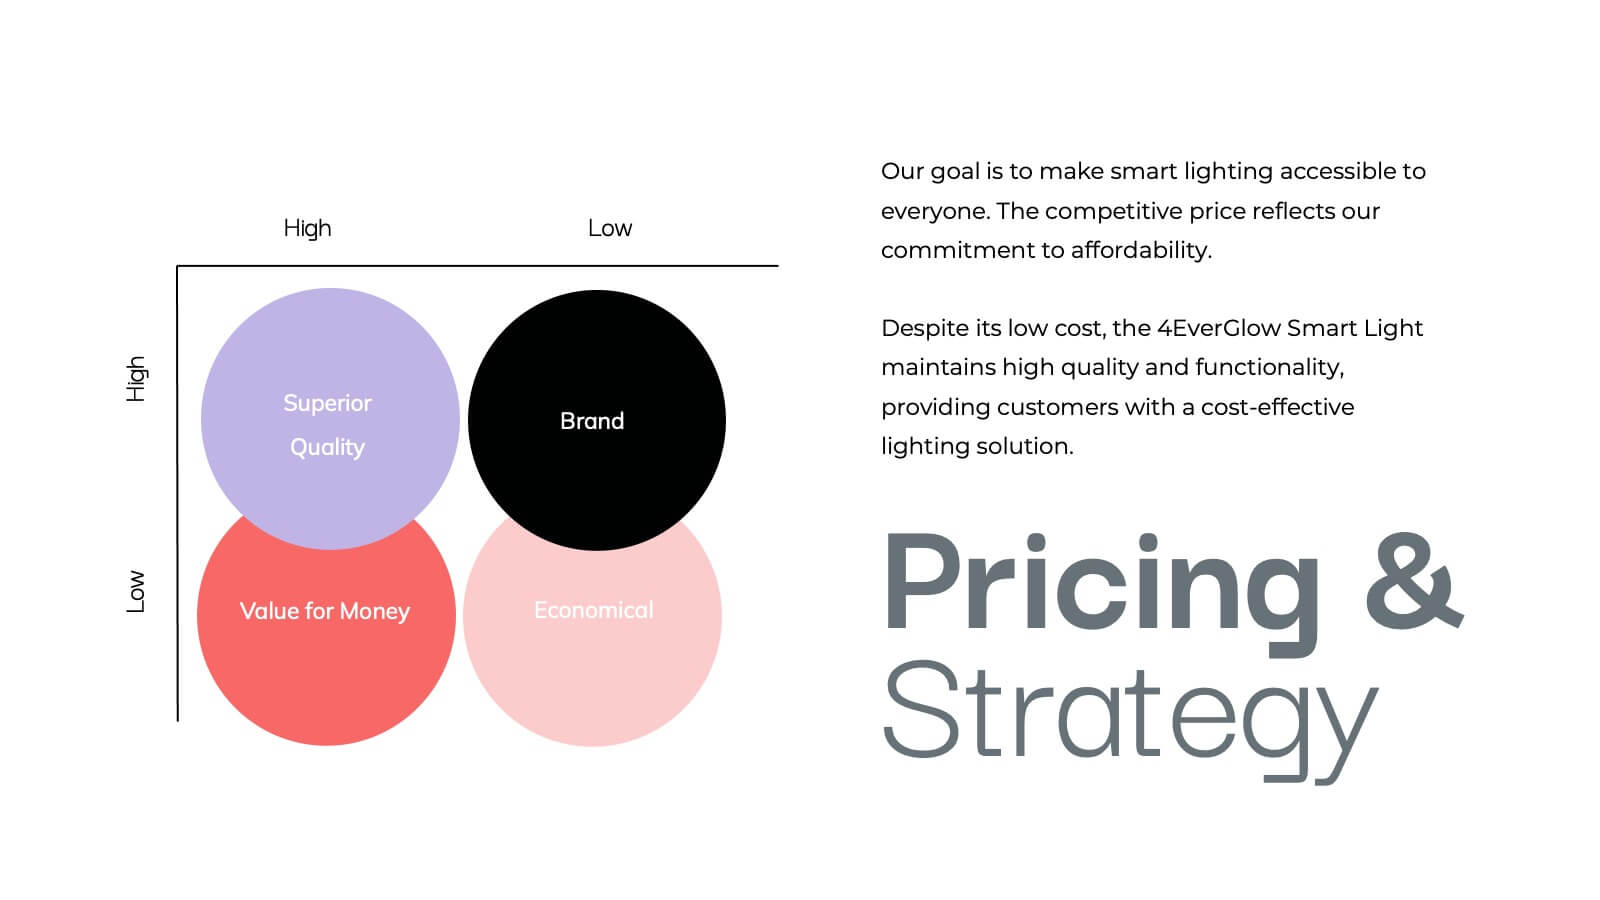
Vulcan New Product Proposal Presentation
Launch your next product with confidence using this comprehensive presentation template! Covering everything from product features and target market to pricing strategy and customer pain points, this template ensures a smooth and engaging flow for your audience. It’s ideal for product proposals, demonstrations, and marketing strategies. Compatible with PowerPoint, Keynote, and Google Slides for seamless presentations.


4 diapositivas
Sustainable Farming Practices Presentation
Explore the essentials of sustainable farming with our visually engaging presentation template. Perfect for educational and advocacy purposes, it outlines key practices that promote environmental sustainability in agriculture. This template features easy-to-understand graphics and placeholders for comprehensive discussions on eco-friendly farming techniques.


7 diapositivas
Executive Summary Format Infographic
Concisely communicate your organization's high-level insights with our Executive Summary Infographic, perfect for business reports and strategic presentations. This infographic is a vital tool for executives, managers, and business analysts to encapsulate key information. Our Executive Summary Infographic offers a visually engaging layout that summarizes complex data into digestible segments. It includes sections for financial highlights, performance metrics, strategic goals, and key achievements. With its customizable features, you can tailor the infographic to represent organizational successes, growth percentages, target completions, and forecasted trends. This SEO-optimized infographic ensures that your executive insights capture the attention of stakeholders and team members alike. Incorporate our infographic into your business documentation to provide a snapshot of your company's performance and strategic direction efficiently.


6 diapositivas
Unique Intersection Comparison Diagram
Illustrate complex relationships with clarity using the Unique Intersection Comparison Diagram Presentation. This visually engaging 5-circle diagram highlights overlaps and distinct points, ideal for showcasing cross-functional collaboration, multi-variable strategies, or layered comparisons. Each segment supports titles and brief text, making it perfect for business planning, product features, or audience segmentation. Fully editable in PowerPoint, Keynote, and Google Slides.


6 diapositivas
Business Journey Roadmap Planning Presentation
Map out strategic progress with this Business Journey Roadmap Planning presentation. Ideal for outlining key steps, milestones, and achievements, this staircase-style layout visually guides your audience through your business journey. Fully editable in Canva, PowerPoint, and Google Slides—perfect for project planning, goal setting, and executive updates.


5 diapositivas
Restaurant Experience Infographics
The Restaurant industry plays a vital role in providing food, employment, and social spaces while contributing to economic growth and cultural exchange. These infographic templates are designed to showcase various aspects of the restaurant experience. It is an ideal tool for restaurant owners, managers, and marketers to present data, statistics, and key information about their establishment's unique features and offerings. The template includes a collection of eye-catching infographics that cover different elements of the restaurant experience. The graphics are designed in a modern and vibrant style, with attractive colors that capture attention.


4 diapositivas
Stock Market Insights and Trends Presentation
Visualize complex financial data with ease using the Stock Market Insights and Trends presentation template. This layout features a bold line chart with labeled milestones to highlight key shifts in performance, market patterns, or strategic indicators. Ideal for investment reports, financial briefings, and economic updates. Perfect for analysts, finance professionals, and business strategists. Fully editable and compatible with PowerPoint, Keynote, and Google Slides.


6 diapositivas
Circular Wheel Diagram Presentation
Bring motion and balance to your ideas with this clean, circular design that connects every element in a seamless flow. Ideal for showcasing continuous processes, team dynamics, or strategic cycles, it keeps your message clear and engaging. Fully compatible with PowerPoint, Keynote, and Google Slides for easy editing.


7 diapositivas
Skills Gap Analysis Infographic Presentation Template
A skills gap analysis is a process that identifies organizational skill gaps and develops a plan to fill them. Employers use this process when they are trying to gauge their current skill sets, identify future needs and understand the best ways to meet those needs. This is an important part of your organization's recruiting strategy. Use this customizable template to gather your own insights into the skills gap in your organization. With this template you can analyze the current state of your company and team, identify areas for improvement, and create a roadmap for growing your team.


10 diapositivas
5G Technology and Network Advancements Presentation
Showcase key milestones and trends in modern telecom evolution with this dynamic 5G network infographic. The slide features a clean, wave-like flow connecting five signal tower icons, perfect for outlining technological phases, speed upgrades, or infrastructure rollouts. Suitable for IT professionals, telecom analysts, and future-tech strategists. Fully customizable in PowerPoint, Keynote, and Google Slides.


7 diapositivas
Buyer Infographic
Discover the power of visual storytelling with our dynamic Infographic Template, designed to bring the buyer's journey to life in full color and engaging detail! Each slide is a palette of opportunity, with bold hues and intuitive layouts that transform standard data into a compelling narrative. This template is a marketer’s dream, perfect for delineating complex buyer behaviors, demographics, and decision processes in an easily digestible format. It leverages striking graphics and concise text to illuminate key insights that drive consumer actions, making it indispensable for presentations, reports, or online content. Customize to your heart’s content, adjusting colors, fonts, and layouts to align perfectly with your branding. Whether you're detailing market trends, consumer feedback, or purchase patterns, this template ensures your data not only informs but also inspires. Ideal for strategists, sales teams, and marketers, it's your secret weapon in crafting stories that not only tell but also sell.


5 diapositivas
Essential Education Infographics
Education is a key driver of individual and societal progress, and investing in education is essential for building a better future for all. This vertical infographic template is designed for educators, trainers, and other professionals who want to create informative and visually appealing educational materials. The theme of the template is centered around education, with bright and colorful illustrations of books, pencils, and other educational tools. Compatible with PowerPoint, Keynote, and Google Slides. Each slide is fully editable, allowing you to easily change the colors, fonts, and content to suit your needs.


5 diapositivas
Marketing Funnel AIDA Breakdown
Visually map out your marketing strategy with the Marketing Funnel AIDA Breakdown Presentation. This template clearly illustrates the four essential stages—Attention, Interest, Desire, and Action—using a clean funnel design for easy audience understanding. Ideal for sales pitches, marketing plans, and campaign reports. Fully editable in PowerPoint, Keynote, and Google Slides.


6 diapositivas
Side-by-Side Comparison Slide Presentation
Bring your ideas to life with a bold, flowing layout that makes comparing two options feel effortless and visually engaging. This presentation helps you break down differences, highlight strengths, and guide viewers toward clear conclusions using a clean, modern design. Fully compatible with PowerPoint, Keynote, and Google Slides.


7 diapositivas
Agile Methodology Process Infographic
Introducing our agile methodology infographic template, designed to help you visualize and communicate the principles and processes of Agile project management. Agile is about flexibility, collaboration, and achieving efficient results. This template makes it easy to convey these concepts in a clear and engaging manner. This infographic is fully customizable and compatible with Powerpoint, Keynote, and Google Slides. This is clearly structured and sectioned to represent key aspects of Agile, from sprints to retrospectives. Utilize pie charts, timelines, and process flows to demonstrate Agile workflows and iterations.


2 diapositivas
Professional Introduction Slide Presentation
Make a lasting first impression with this Professional Introduction Slide. Designed for business presentations, personal branding, and team introductions, this modern layout features bold shapes, a photo placeholder, and space for key details. Ideal for PowerPoint, Keynote, and Google Slides, this fully editable template lets you customize colors, text, and images to match your brand identity.


7 diapositivas
Business Concept Mind Map Presentation
Visualize strategic thinking with the Business Concept Mind Map Presentation. This clear, central-diagram layout helps organize six core ideas around a business theme, making complex concepts easy to grasp. Ideal for planning, brainstorming, or presentations. Fully editable and compatible with PowerPoint, Keynote, and Google Slides for maximum flexibility.