


Características


¿Tienes alguna pregunta?
Recomendar


6 diapositivas
Environmental Protection and Ecology Plan Presentation
Highlight your green initiatives with the Environmental Protection and Ecology Plan Presentation. Featuring a lightbulb-leaf graphic, this template helps you present sustainability goals, eco strategies, and key action steps clearly. Ideal for environmental reports, proposals, or educational content. Fully customizable in Canva, PowerPoint, or Google Slides.


6 diapositivas
Process Flow Charts Presentation
Bring your workflow to life with a clean, modern layout that transforms complex steps into a simple visual path. This presentation helps teams explain processes, percentages, and progress with clarity and ease, making it ideal for planning and optimization. Fully compatible with PowerPoint, Keynote, and Google Slides.


6 diapositivas
Quarterly Sales Overview Presentation
Bring your numbers to life with a clear, colorful layout that makes quarterly progress instantly easy to understand. This presentation helps you break down trends, compare performance across quarters, and highlight key insights with simple bar visuals. Perfect for reports and meetings, and fully compatible with PowerPoint, Keynote, and Google Slides.


6 diapositivas
Business Network Diagram Presentation
Bring your digital ecosystem to life with this modern presentation design. Ideal for showcasing system connections, IT workflows, or organizational networks, it helps visualize how key components interact seamlessly. Clean, structured, and fully customizable—compatible with PowerPoint, Keynote, and Google Slides for a professional and cohesive presentation every time.


4 diapositivas
Patient Care Plan and Metrics Presentation
Turn healthcare data into meaningful stories with this modern and professional presentation. Perfect for highlighting patient progress, clinical outcomes, and care efficiency, it balances visuals and data for clarity and impact. Easy to edit and fully compatible with PowerPoint, Keynote, and Google Slides for smooth customization.


4 diapositivas
Cost Analysis and Budget Overview Presentation
Break down financial details with clarity using the Cost Analysis and Budget Overview Presentation. This slide helps you present cost structures, budget allocations, and key financial metrics side by side using icons and visual data blocks. Perfect for reports, planning, or investment decks. Fully editable in PowerPoint, Google Slides, Keynote, and Canva.


8 diapositivas
Europe Market Trends with Europe Map Presentation
Showcase key market insights with this Europe-focused presentation. Highlight regional trends using data-driven visuals, including percentage indicators and color-coded country comparisons. Ideal for marketing reports, business expansion plans, or performance reviews. Fully editable and compatible with PowerPoint, Keynote, and Google Slides for seamless customization across platforms.


8 diapositivas
Value Chain Optimization and Analysis Presentation
Streamline Your Business for Maximum Efficiency with this Value Chain Optimization and Analysis presentation template. This visually engaging template is designed to map, analyze, and enhance the key activities in your value chain, helping businesses identify opportunities for cost reduction, performance improvements, and strategic advantages. Featuring a clean flowchart layout, intuitive color-coded sections, and editable placeholders, this template is ideal for business analysts, consultants, and executives. Fully compatible with PowerPoint, Keynote, and Google Slides, ensuring seamless customization and professional delivery.


5 diapositivas
3-Level Concentric Diagram Presentation
Bring clarity and structure to your ideas with a clean, layered diagram design that simplifies complex concepts. Perfect for showcasing stages, hierarchies, or interconnected systems, it keeps your audience engaged with visual balance and flow. Fully compatible with PowerPoint, Keynote, and Google Slides for effortless customization and presentation flexibility.


21 diapositivas
Novaeon Corporate Strategy Proposal Presentation
A sleek and professional presentation template designed for strategy proposals. Includes slides for SWOT analysis, growth opportunities, strategic initiatives, and performance metrics. Fully customizable to fit any corporate need, ensuring impactful communication. Compatible with PowerPoint, Keynote, and Google Slides for seamless presentations.


26 diapositivas
Kohen Presentation Template
Kohen is a minimal coffee shop template that features slide designs you can use together, making it perfect for sharing your business and services. It is easy to use, resulting in convenient high quality presentations. This template design can be used to create more elaborate presentations about food and restaurants. It is complete with charts, images, and text boxes for endless presentation possibilities. This template will help make your message more compelling and informative. The presentation includes a variety of tools and resources, to highlight key points and ideas with minimal text.


20 diapositivas
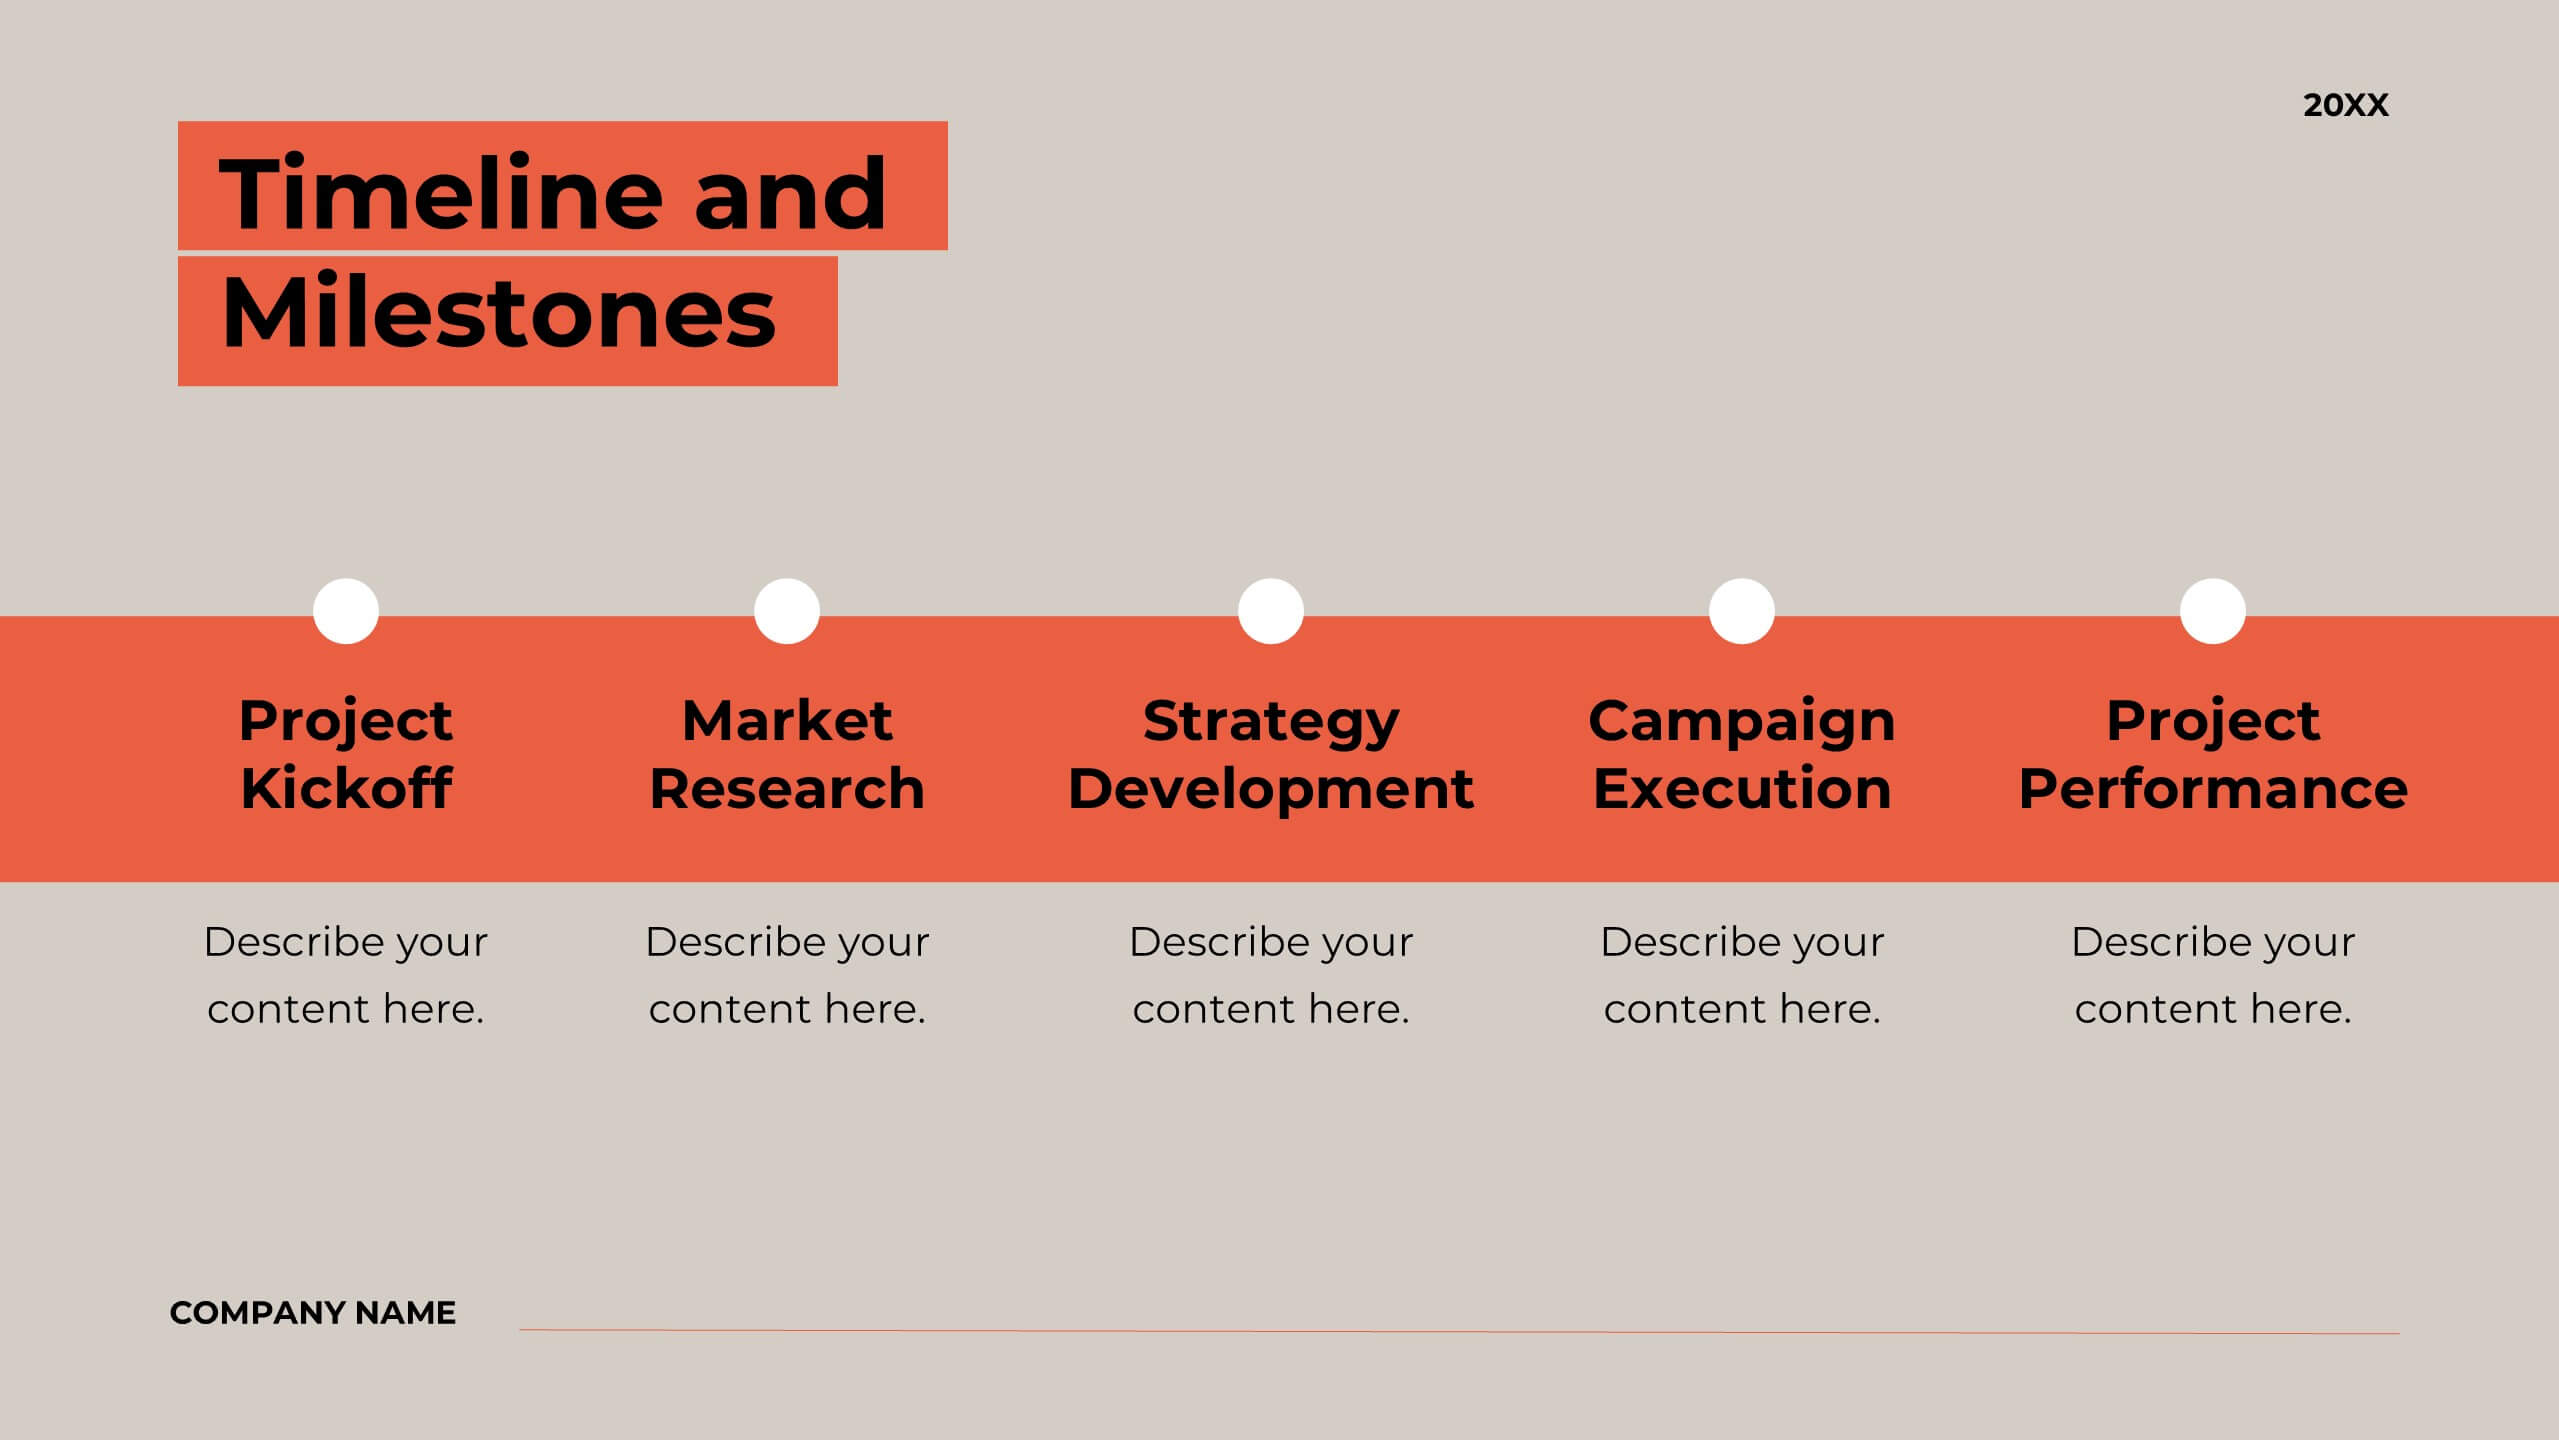
Bentom Marketing Proposal Presentation
This marketing proposal template is crafted to communicate your strategy with impact. With sections covering company overview, project summary, objectives, methodology, budget breakdown, and deliverables, it provides a professional layout for presenting key details to clients. Tailor it to fit your needs, and present confidently using PowerPoint, Keynote, or Google Slides.


5 diapositivas
Agile Scrum Task Board Workflow Presentation
Simplify your Agile process with this task board workflow diagram. Clearly outline backlog, sprint planning, task execution, and delivery steps in a visually engaging format. Perfect for Agile teams, project managers, or software developers. Fully customizable in PowerPoint, Keynote, and Google Slides to fit your sprint and scrum documentation needs.


21 diapositivas
Phantomwood Product Roadmap Presentation
A comprehensive presentation template designed to outline product strategies and roadmaps. Covers key aspects like target market, competitive analysis, pricing, and technical specifications. Highlight marketing approaches, production processes, and support information effectively. Fully editable, this template is compatible with PowerPoint, Keynote, and Google Slides for seamless collaboration and professional delivery.


2 diapositivas
Business Briefing Executive Summary Presentation
Summarize your strategy with impact using this Business Briefing Executive Summary Presentation. Featuring modern layout options, photo placeholders, and bold typography, this cover slide is ideal for team updates, pitch decks, or project reports. Fully editable in PowerPoint, Google Slides, Keynote, and Canva.


4 diapositivas
Side-by-Side Comparison Butterfly Chart Presentation
Compare data clearly and effectively with the Side-by-Side Comparison Butterfly Chart Presentation. This layout is perfect for showcasing performance metrics, survey results, or A/B comparisons in a symmetrical, easy-to-read format. Editable in Canva, PowerPoint, Google Slides, and Keynote to match your brand and presentation style effortlessly.


6 diapositivas
Business Growth with TAM SAM SOM Framework
Fuel your next big idea with a clear, structured breakdown of market potential. This easy-to-follow visual helps explain the TAM, SAM, and SOM layers of business growth—ideal for investors, strategy teams, or product managers. Fully editable in PowerPoint, Keynote, and Google Slides for fast, seamless presentation design.