


Características


¿Tienes alguna pregunta?
Recomendar


7 diapositivas
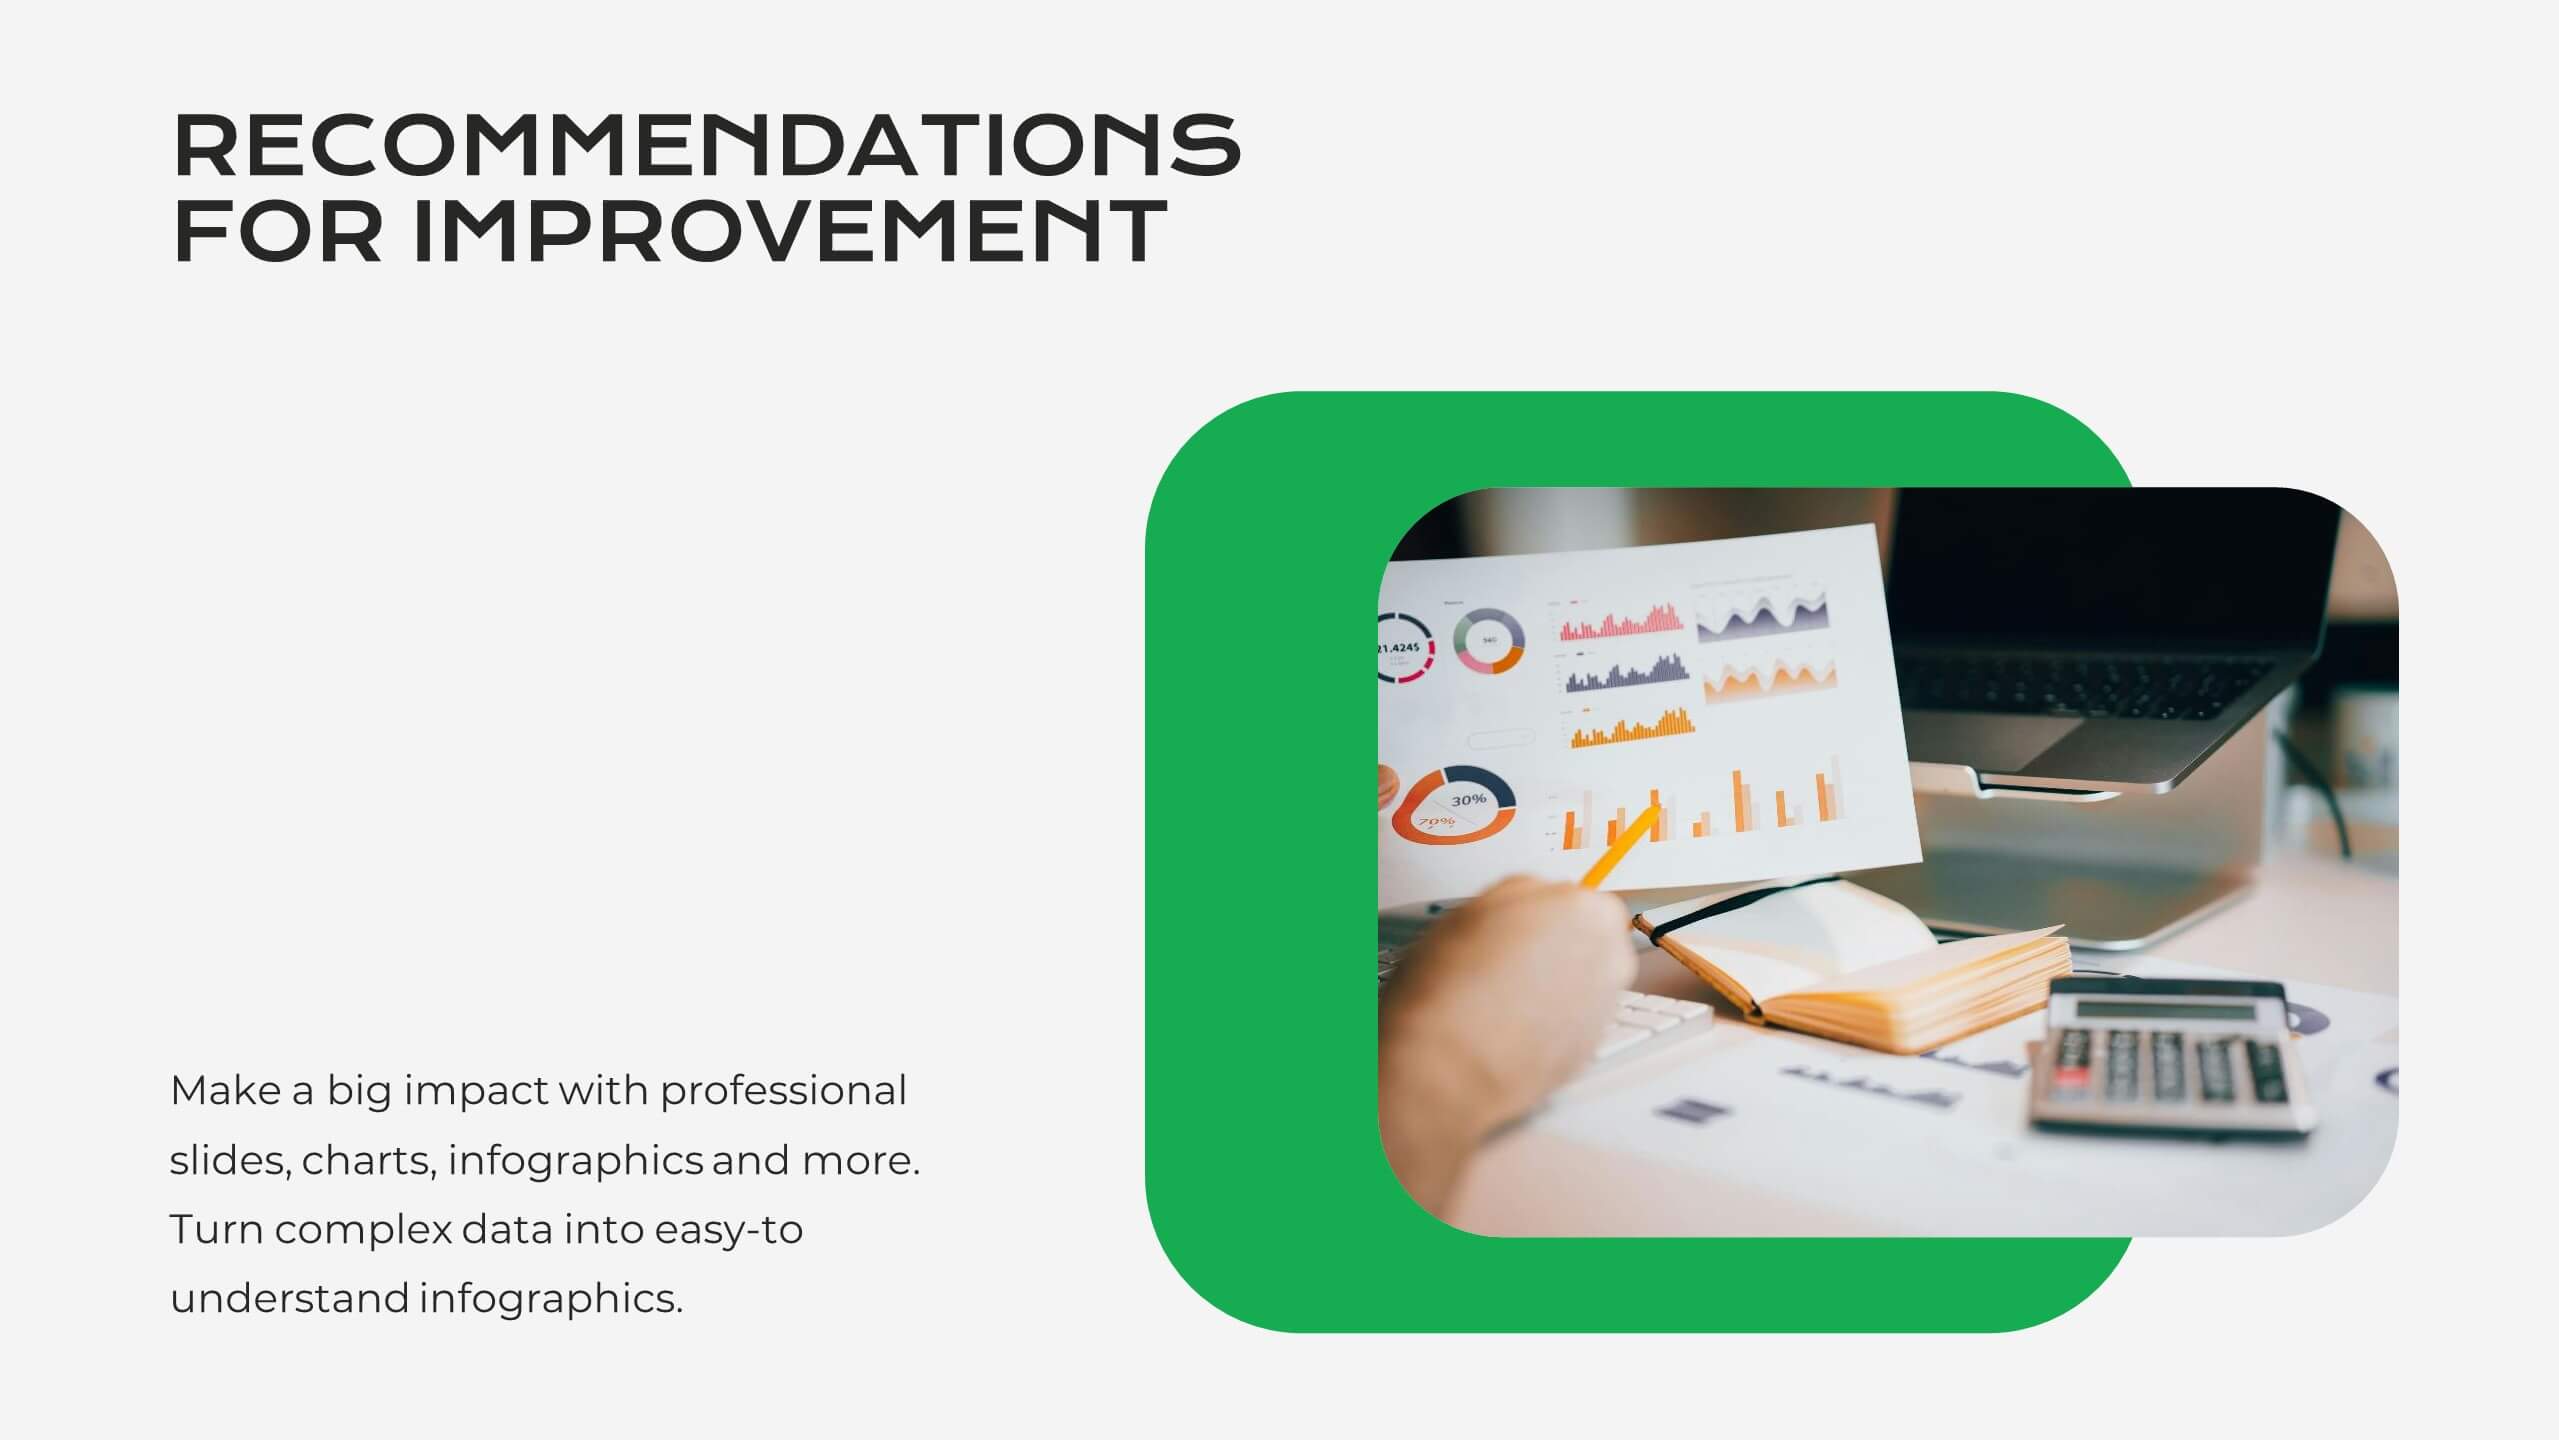
Product Roadmap Infographic Presentation
A well-designed Roadmap infographic can be a powerful tool used to communicate your vision. This template highlights important dates, objectives and milestones to achieve over a period of time. The roadmap provides a clear view of what needs to be done, and when it needs to be done. This template is fully editable in PowerPoint, Keynote and Google Slides, making it easily personalized and customized to suit your project needs. Use this roadmap infographic to help you display a plan for accomplishing a long-term goal, and communicate your vision in an appealing and memorable way!


2 diapositivas
Professional Thank You Closing Slide Presentation
Make your last impression count with a clean, modern closing slide that wraps up your presentation in style. This template is designed to help you leave a professional mark while displaying contact info, brand visuals, or a thank-you note. Fully compatible with PowerPoint, Keynote, and Google Slides for flexible use.


5 diapositivas
Business Gaps and Solutions Assessment Presentation
Spot the gaps and climb to clarity with this smart pyramid-style assessment design. Perfect for identifying weaknesses and matching them with targeted solutions, this layout helps teams visualize challenges at every level of the business. Use it to guide strategy with confidence. Works great in PowerPoint, Keynote, and Google Slides.


6 diapositivas
Framework Version Infographic
A framework infographic is a visual representation that outlines a structured approach, model, or framework for understanding a concept, solving a problem, or making decisions. This infographic template involves visually presenting different versions of a software or system framework along with their features and benefits. Summarize the improvements and benefits introduced by each framework version. This template provides a clear overview of the evolution of the framework and how each version brought value to users. By using icons, graphics, and concise descriptions, you can make the information easily digestible and engaging for your audience.


6 diapositivas
Relationship Compatibility Infographic
Relationship compatibility refers to the degree to which two individuals are well-suited for each other in a relationship. This infographic can be a fun and informative way to explore the compatibility between individuals in a relationship. This template is designed to help individuals gain a better understanding of their relationships and make informed decisions about their interactions with others. Compatible with Powerpoint, Keynote, and Google Slides. The combination of visual elements and informative content can make this topic engaging and accessible. Making it easy for readers to navigate and understand the content.


5 diapositivas
Internal Communication Flow Chart Presentation
Visualize key communication channels within your organization using this internal communication flow chart. With a clean radial layout, this template helps you illustrate how information travels between departments or roles. Ideal for HR teams, managers, or consultants. Fully editable in Canva, PowerPoint, and Google Slides for seamless customization.


6 diapositivas
Six Sigma Process Infographic
Dive into the world of process improvement with our six sigma process infographic. Crafted with a harmonious blend of blue, yellow, and white, this infographic elucidates the principles of Six Sigma methodology in an engaging manner. Ideal for business analysts, quality assurance teams, and corporate trainers, it delineates the DMAIC process in vivid detail. The design encapsulates the rigorous methodology of Six Sigma, providing clarity and fostering knowledge retention. This versatile template is a perfect fit for PowerPoint, Keynote, and Google Slides, making your presentations both captivating and insightful.


6 diapositivas
Vision Statement Infographic
Define and share your organization's aspirations with our Vision Statement Infographic Template. Designed for impact and clarity, this template offers a modern, sleek way to communicate your company's vision to team members, stakeholders, and the public. With its clean lines and focused layout, it provides the perfect backdrop to highlight your strategic intentions. This template features a series of customizable slides, each structured to help you articulate different elements of your vision statement. Utilize engaging icons, bold color blocks, and concise text to make your message resonate. It’s ideal for integrating into annual reports, company presentations, or onboarding materials, ensuring that your vision is not only shared but also inspires. Tailor each slide to suit your corporate identity, adjusting colors and fonts for consistency with your brand aesthetics. This tool is essential for leaders looking to instill a sense of purpose and direction throughout their organization.


6 diapositivas
Strategic Planning with PESTEL Presentation
Dive into comprehensive environmental scanning with our "Strategic Planning with PESTEL" presentation template. This layout meticulously breaks down Political, Economic, Social, Technological, Environmental, and Legal factors, enabling thorough market analysis and strategy formulation. Perfect for strategists and analysts, the template supports PowerPoint, Keynote, and Google Slides, facilitating a dynamic and engaging planning session.


7 diapositivas
Project Management Tools Infographic
Project management is the discipline of planning, organizing, securing, and managing resources to achieve specific goals within a defined time frame and budget. This visually appealing and informative template allows you to represent project lifecycles, key milestones, team roles, and more, making complex project data easily digestible. Fully customizable and compatible with Powerpoint, Keynote, and Google Slides. Illustrate the project lifecycle from initiation to completion for a comprehensive understanding. Utilize this template to effectively show project progress and objectives, ensuring your audience is informed throughout the project's lifecycle.


5 diapositivas
Renewable Energy Sector Infographics
Illuminate your audience's knowledge with our renewable energy sector infographics. Radiating with vibrant shades of orange, yellow, and blue, this creative, vertical template breathes life into data and trends in the clean energy realm. Compatible with Powerpoint, Keynote, and Google Slides. Whether you're an environmental advocate or an academic researcher, these infographics, embellished with relevant graphics and icons, serve as a catalyst for enlightening discussions. From solar power breakthroughs to wind energy statistics, these visual aids are geared to power impactful presentations and reports in the renewable energy sector.


7 diapositivas
Stakeholder Strategy Infographic
Empower your organization's approach to its stakeholders with our stakeholder strategy infographic. Colored in a mix of vibrant orange, crisp white, and bold red, this infographic not only informs but also captures attention. Ideal for business strategists, project managers, and team leaders, it visually dissects the intricate layers of stakeholder engagement and strategy. Its design includes specialized graphics, tailored icons, and strategic image placeholders to guide your storytelling. Whether you're presenting in PowerPoint, Keynote, or Google Slides, this template is your key to a well-orchestrated stakeholder communication.


6 diapositivas
Financial Trading and Stock Performance Presentation
Explore market dynamics with the "Financial Trading and Stock Performance" presentation template. Perfect for finance professionals, these slides offer a visual analysis of stock trends over the years. Featuring bar graphs and gauge charts for annual comparison, it's designed for impactful presentations. These templates are compatible with PowerPoint, Keynote, and Google Slides, enhancing their accessibility across different platforms.


7 diapositivas
Strategy Wheel Options Infographic Presentation
A Strategy Wheel Infographic is a visual tool that helps organizations develop and communicate their strategic plans. This template uses a circular diagram that breaks down the elements of a strategy into categories or segments, with each segment representing a different aspect of the plan. This infographic includes a central circle that represents the organization's overall goal, surrounded by smaller circles or segments that represent specific strategies or tactics. Each segment may include additional information such as goals, objectives, key performance indicators, and action items.


5 diapositivas
Cognitive Behavioral Therapy Overview Presentation
Help your audience connect the dots between thoughts, feelings, and behaviors with this clean, illustrated layout. Designed to simplify complex mental health concepts, this CBT infographic template is perfect for educators, coaches, or therapists. Fully editable and compatible with PowerPoint, Keynote, and Google Slides for effortless customization.
9 diapositivas
Arrow Security Infographic
Introducing our new "Arrow Security Infographic", this is a visually engaging and informative presentation template that focuses on various aspects of arrow infographics. This template can be used to provide an overview of different security measures, techniques, and technologies that can be implemented to enhance safety and protect against potential threats. This is designed with a variety of arrow infographics that can help help individuals and organizations understand the importance of security and make informed decisions to safeguard their assets and interests. Compatible with Powerpoint, Keynote, and Google Slides.
21 diapositivas
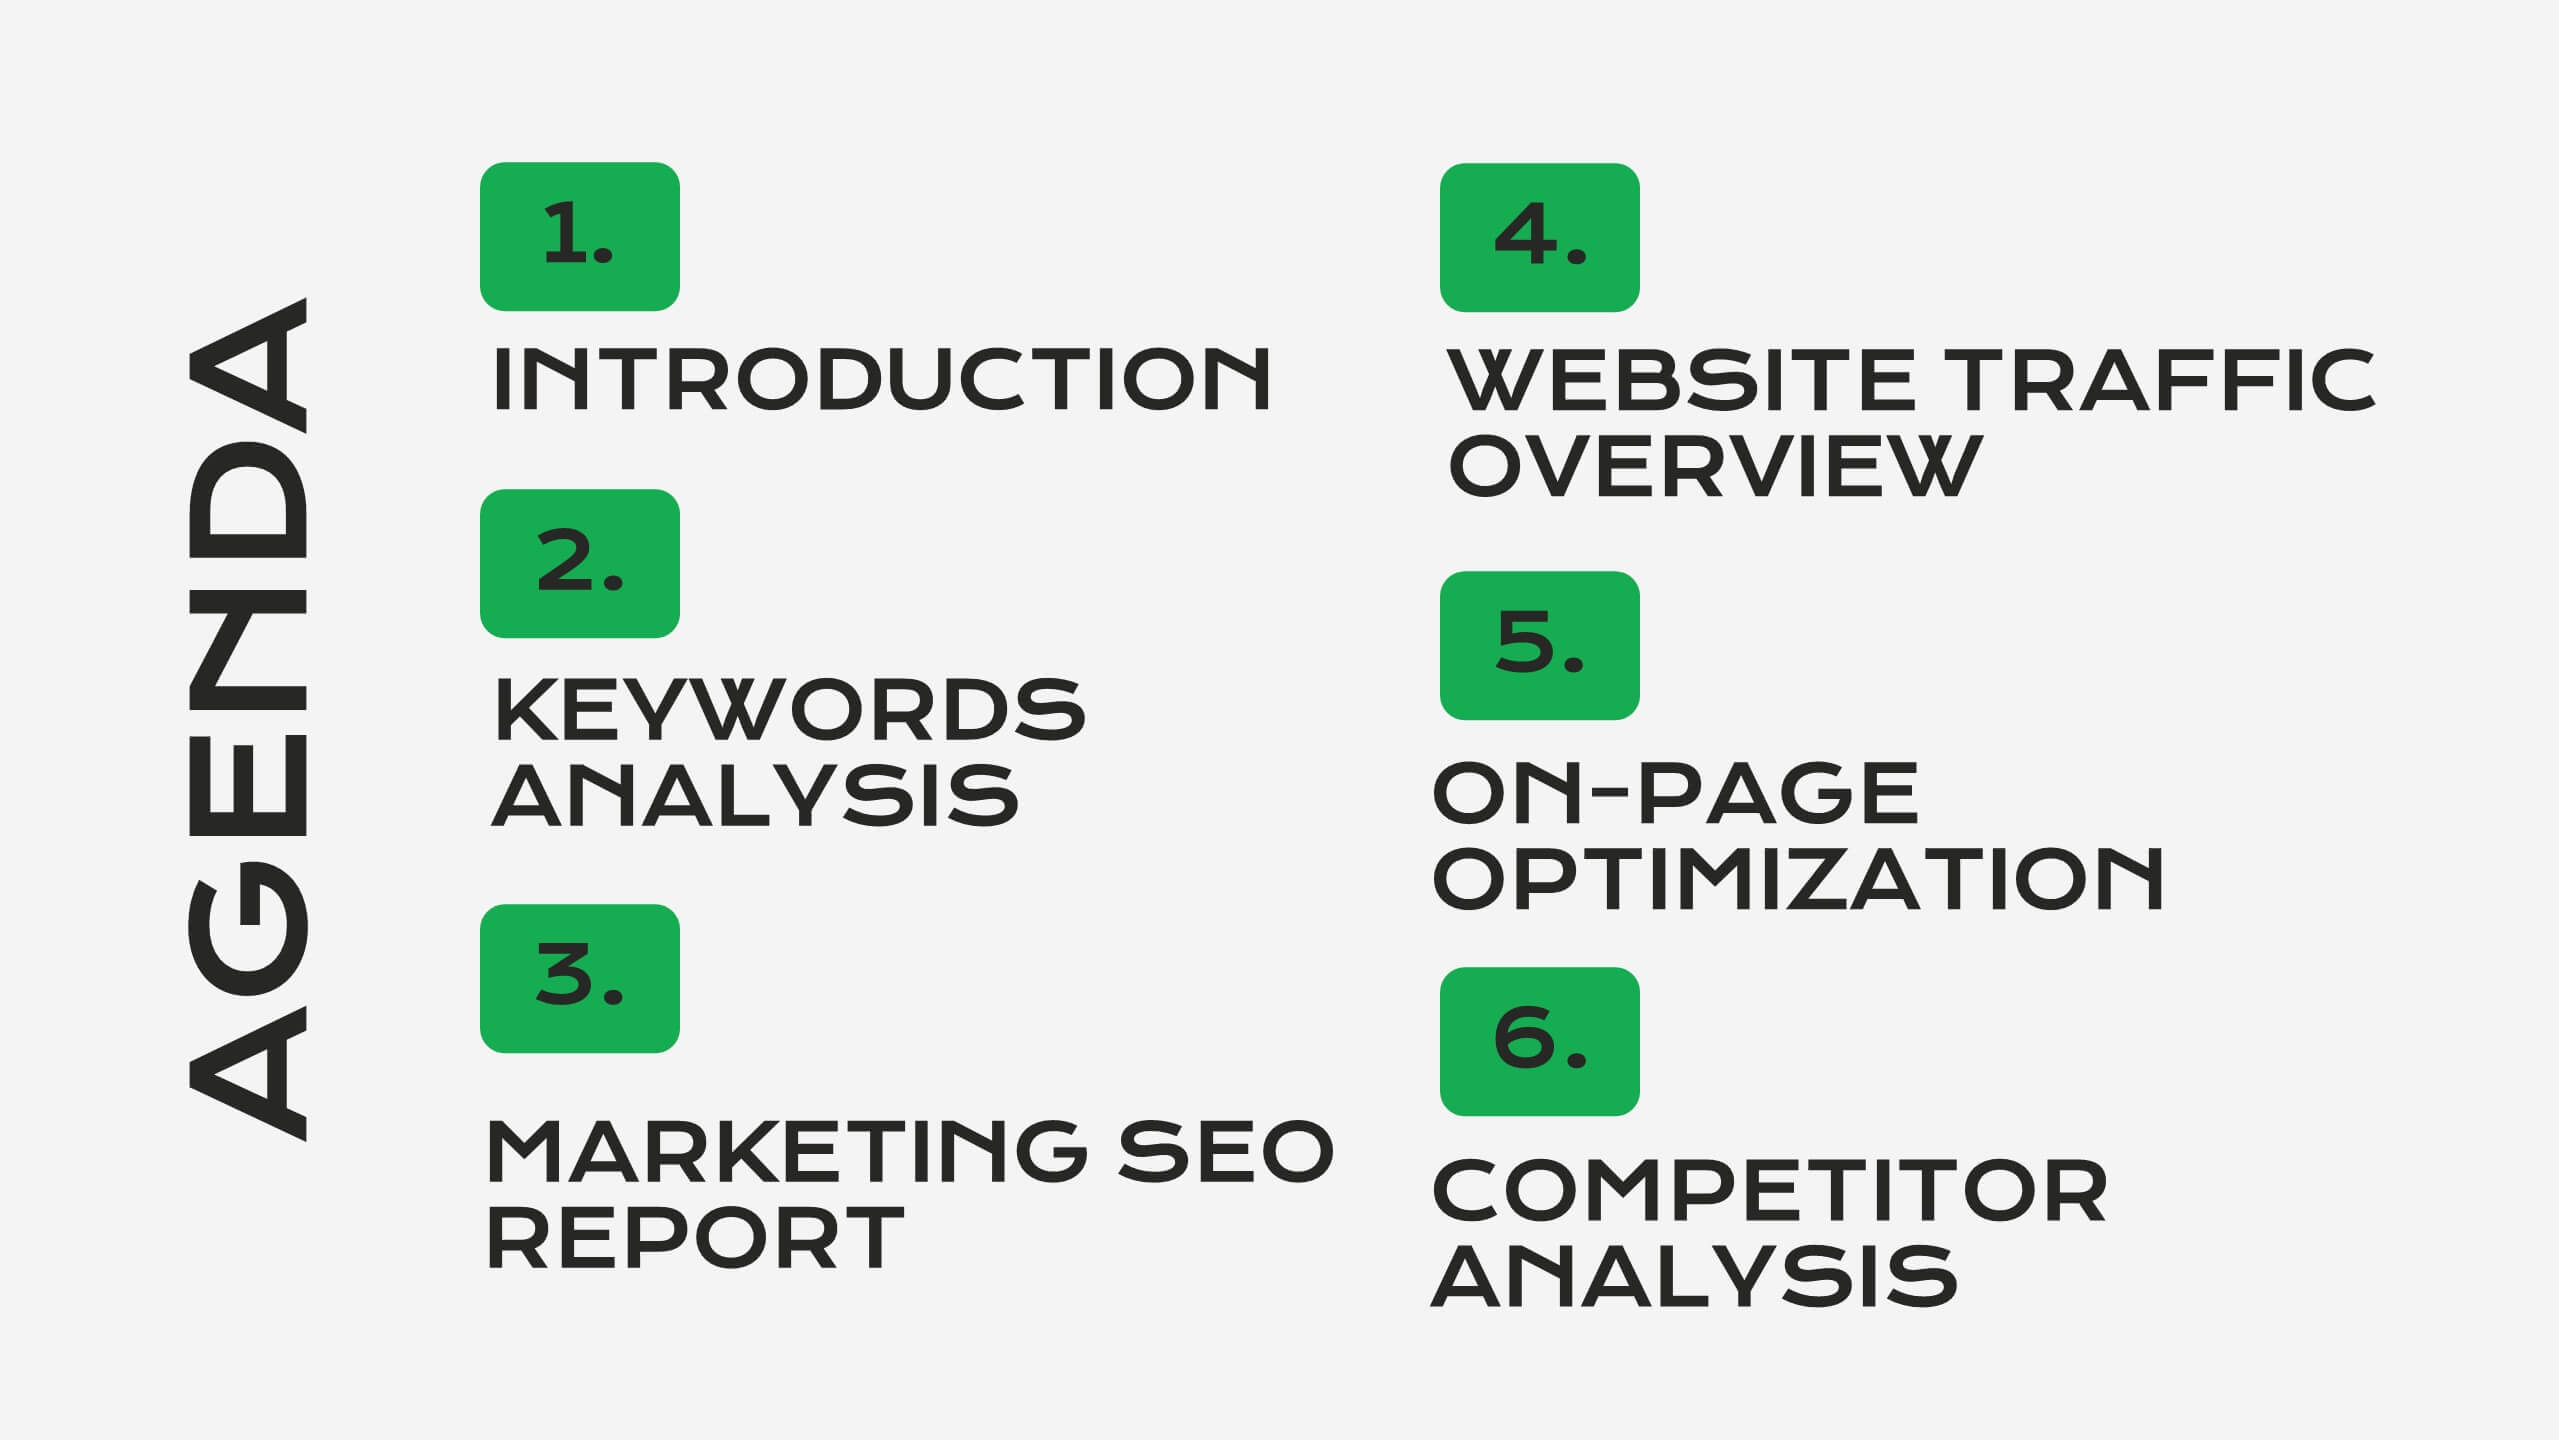
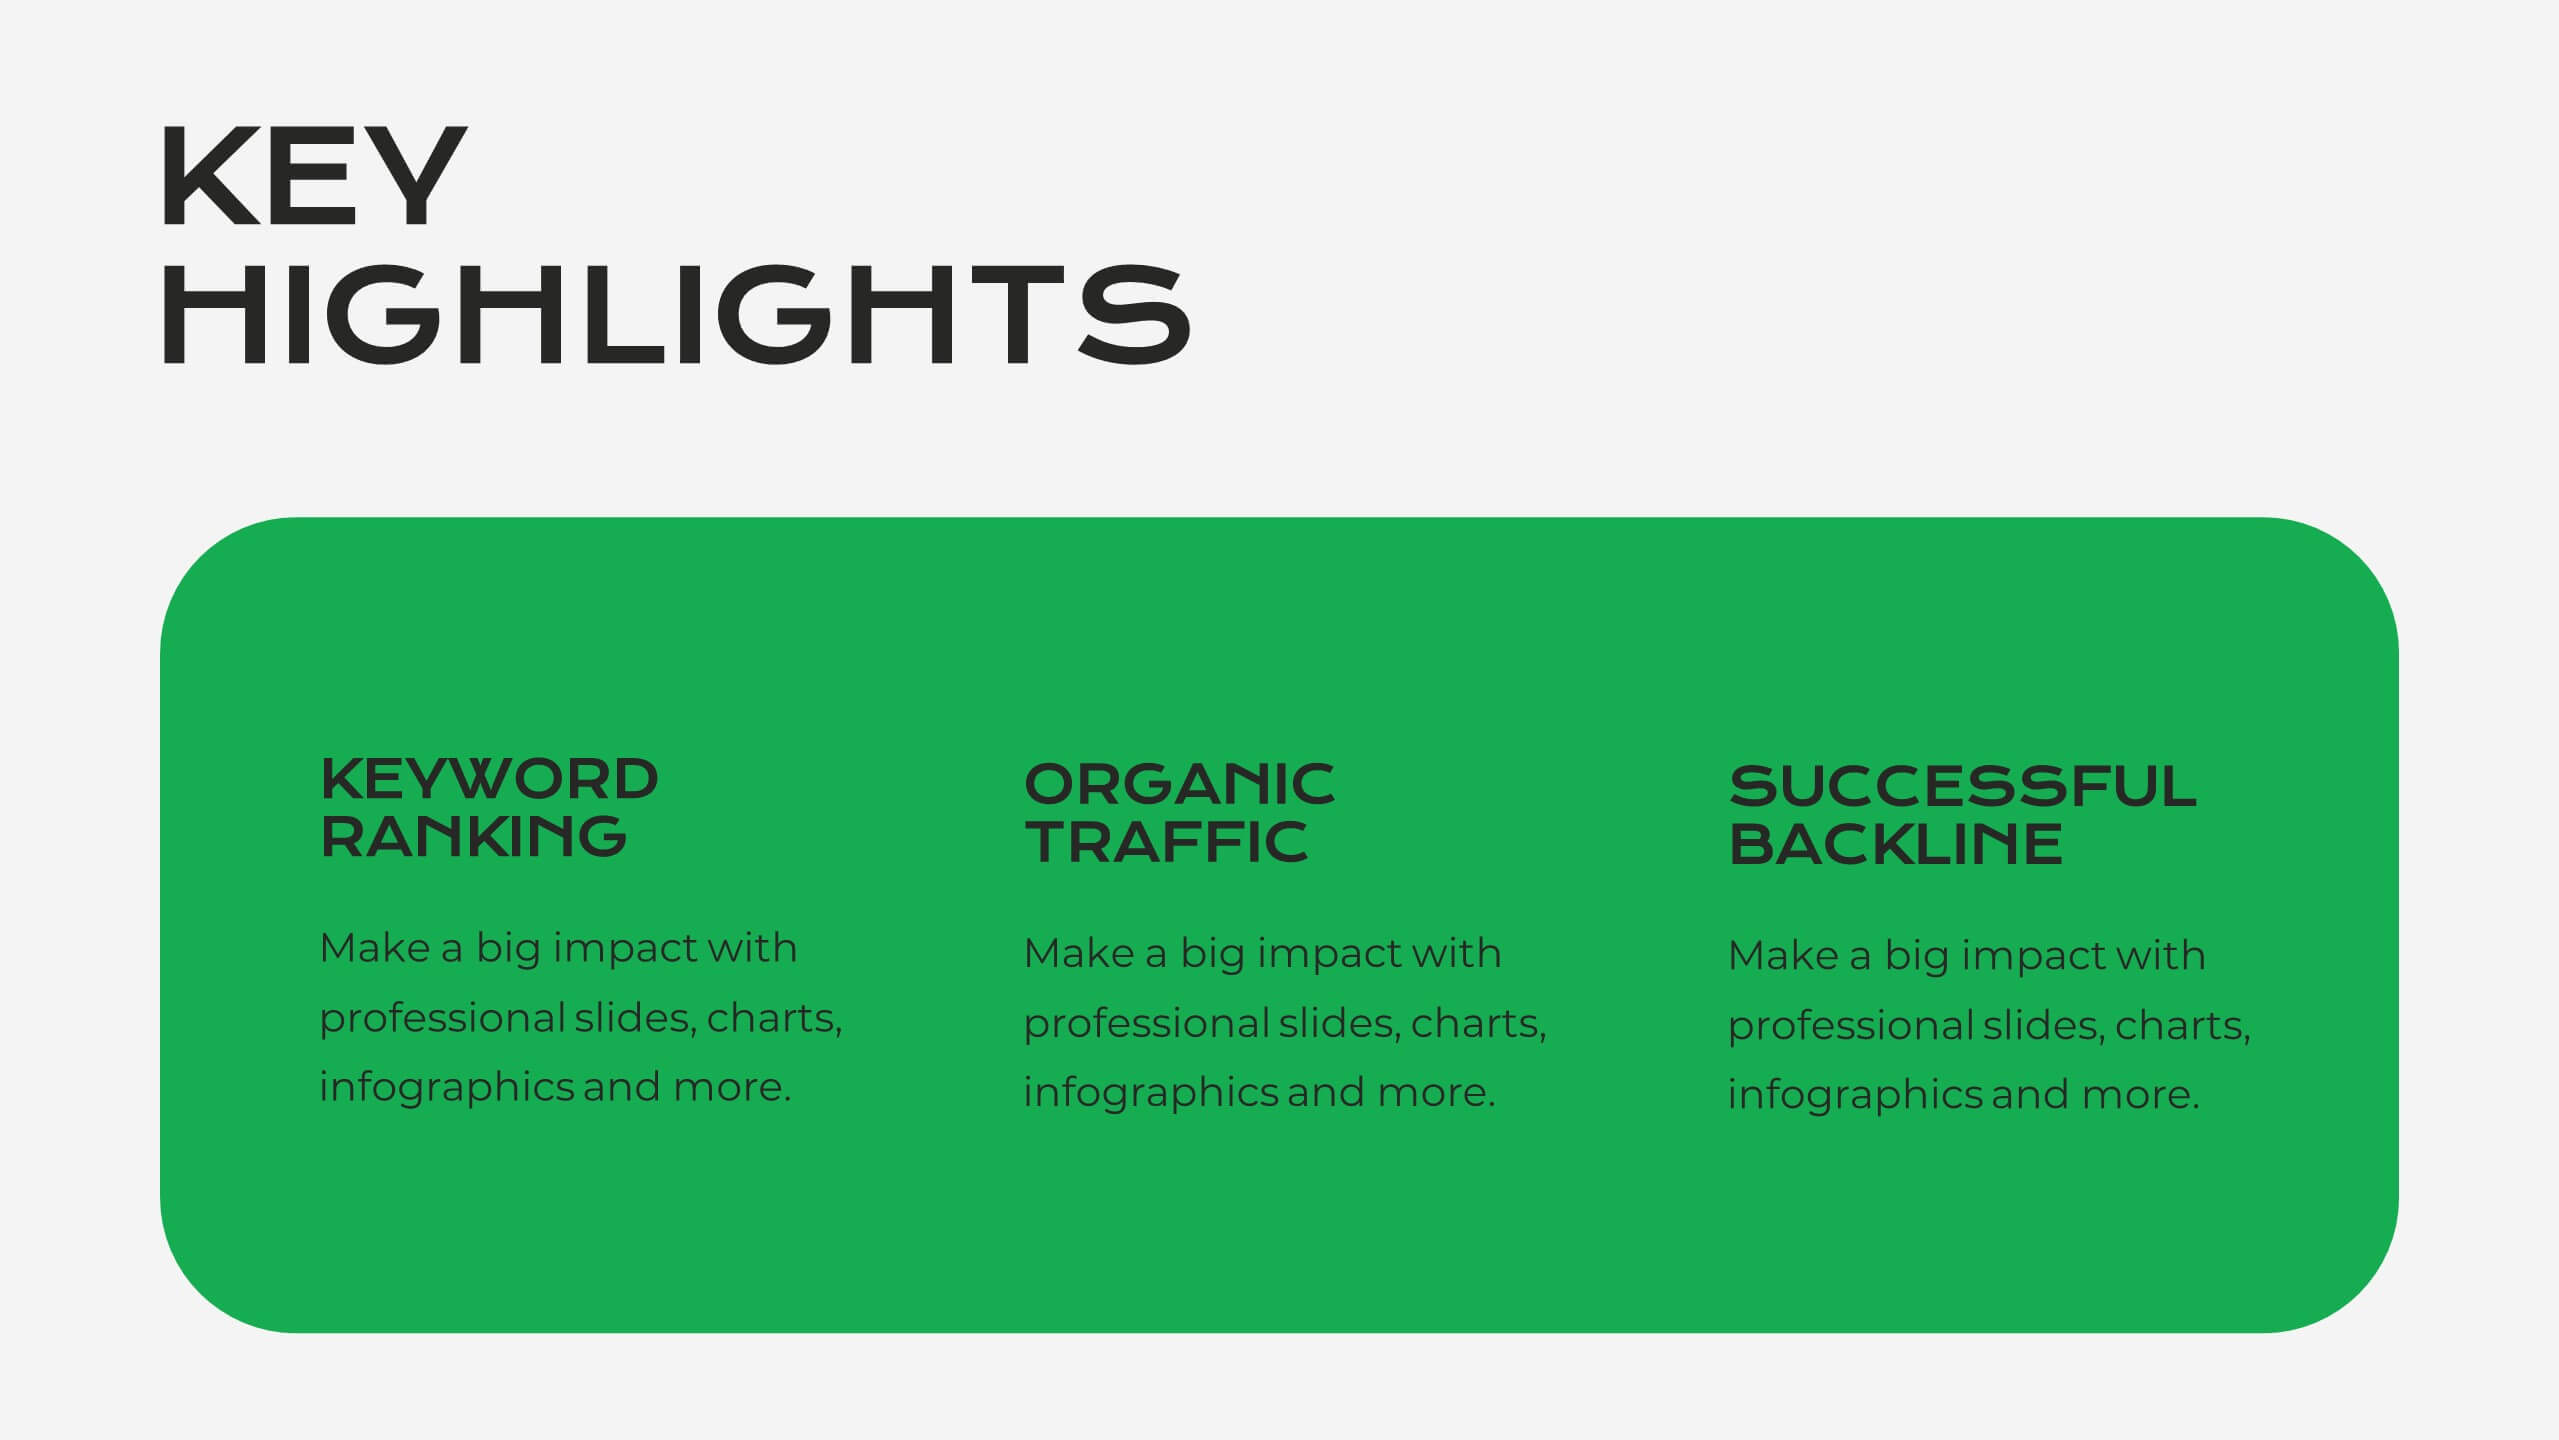
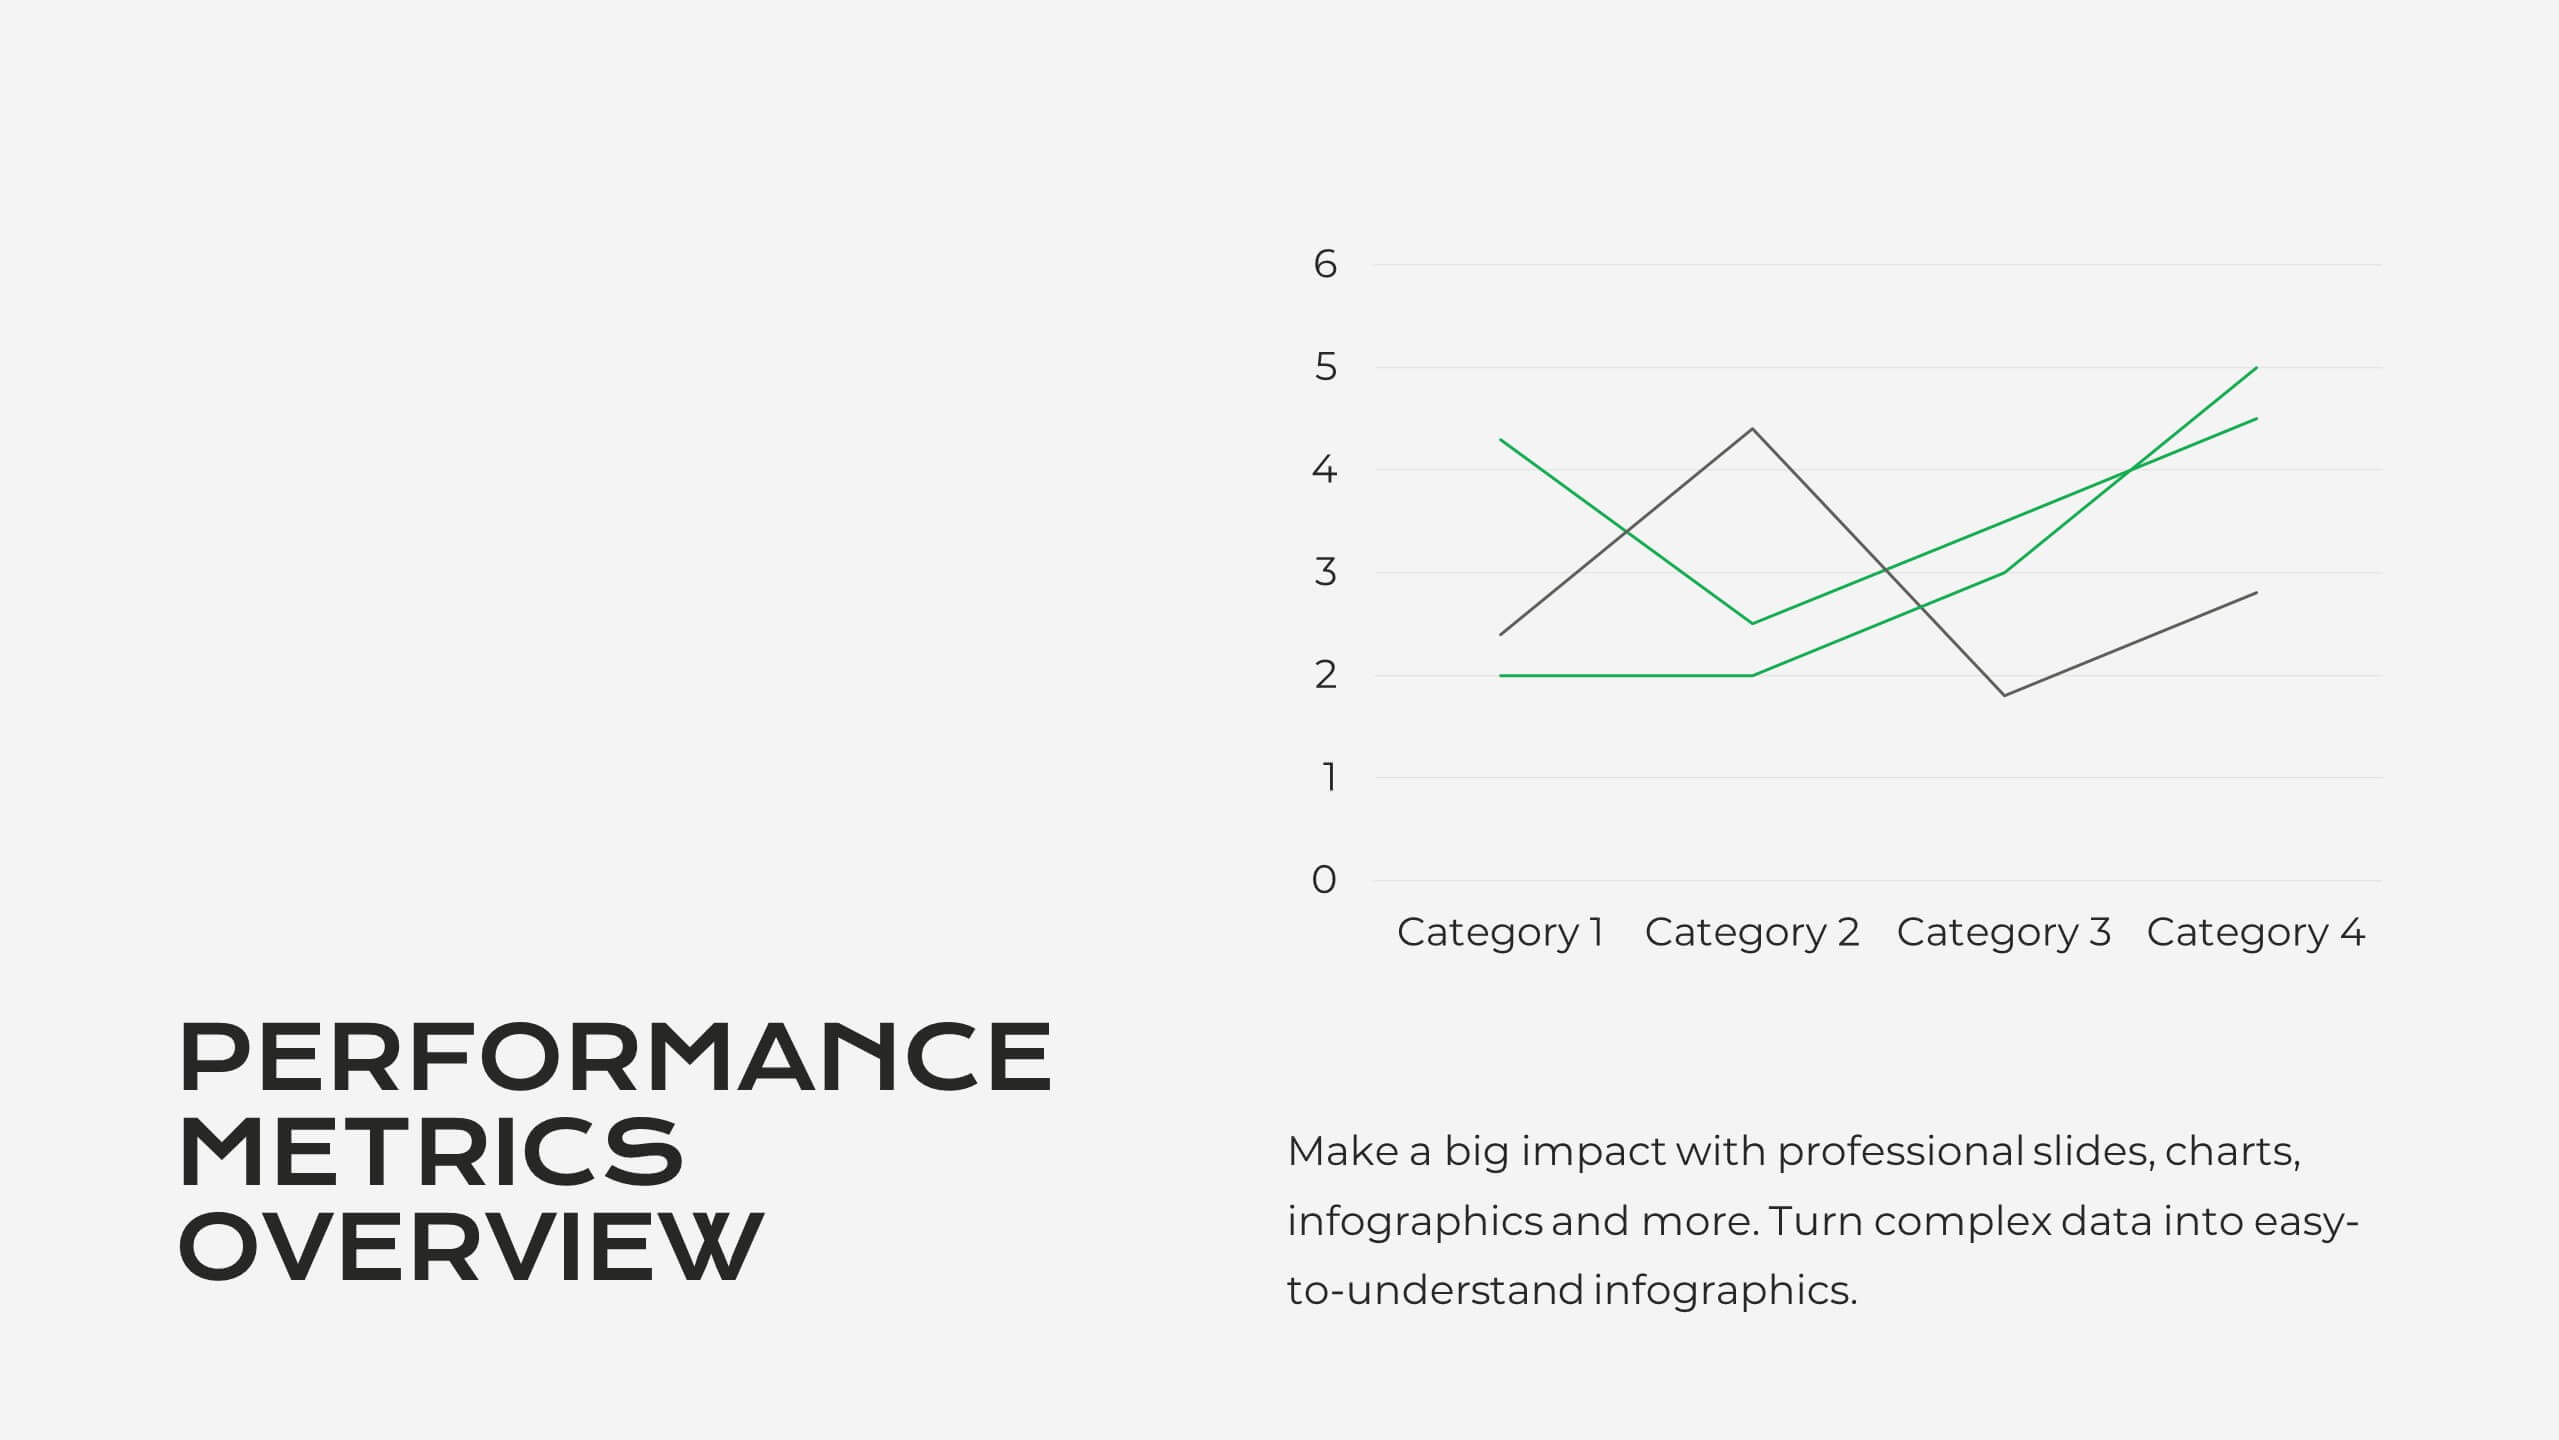
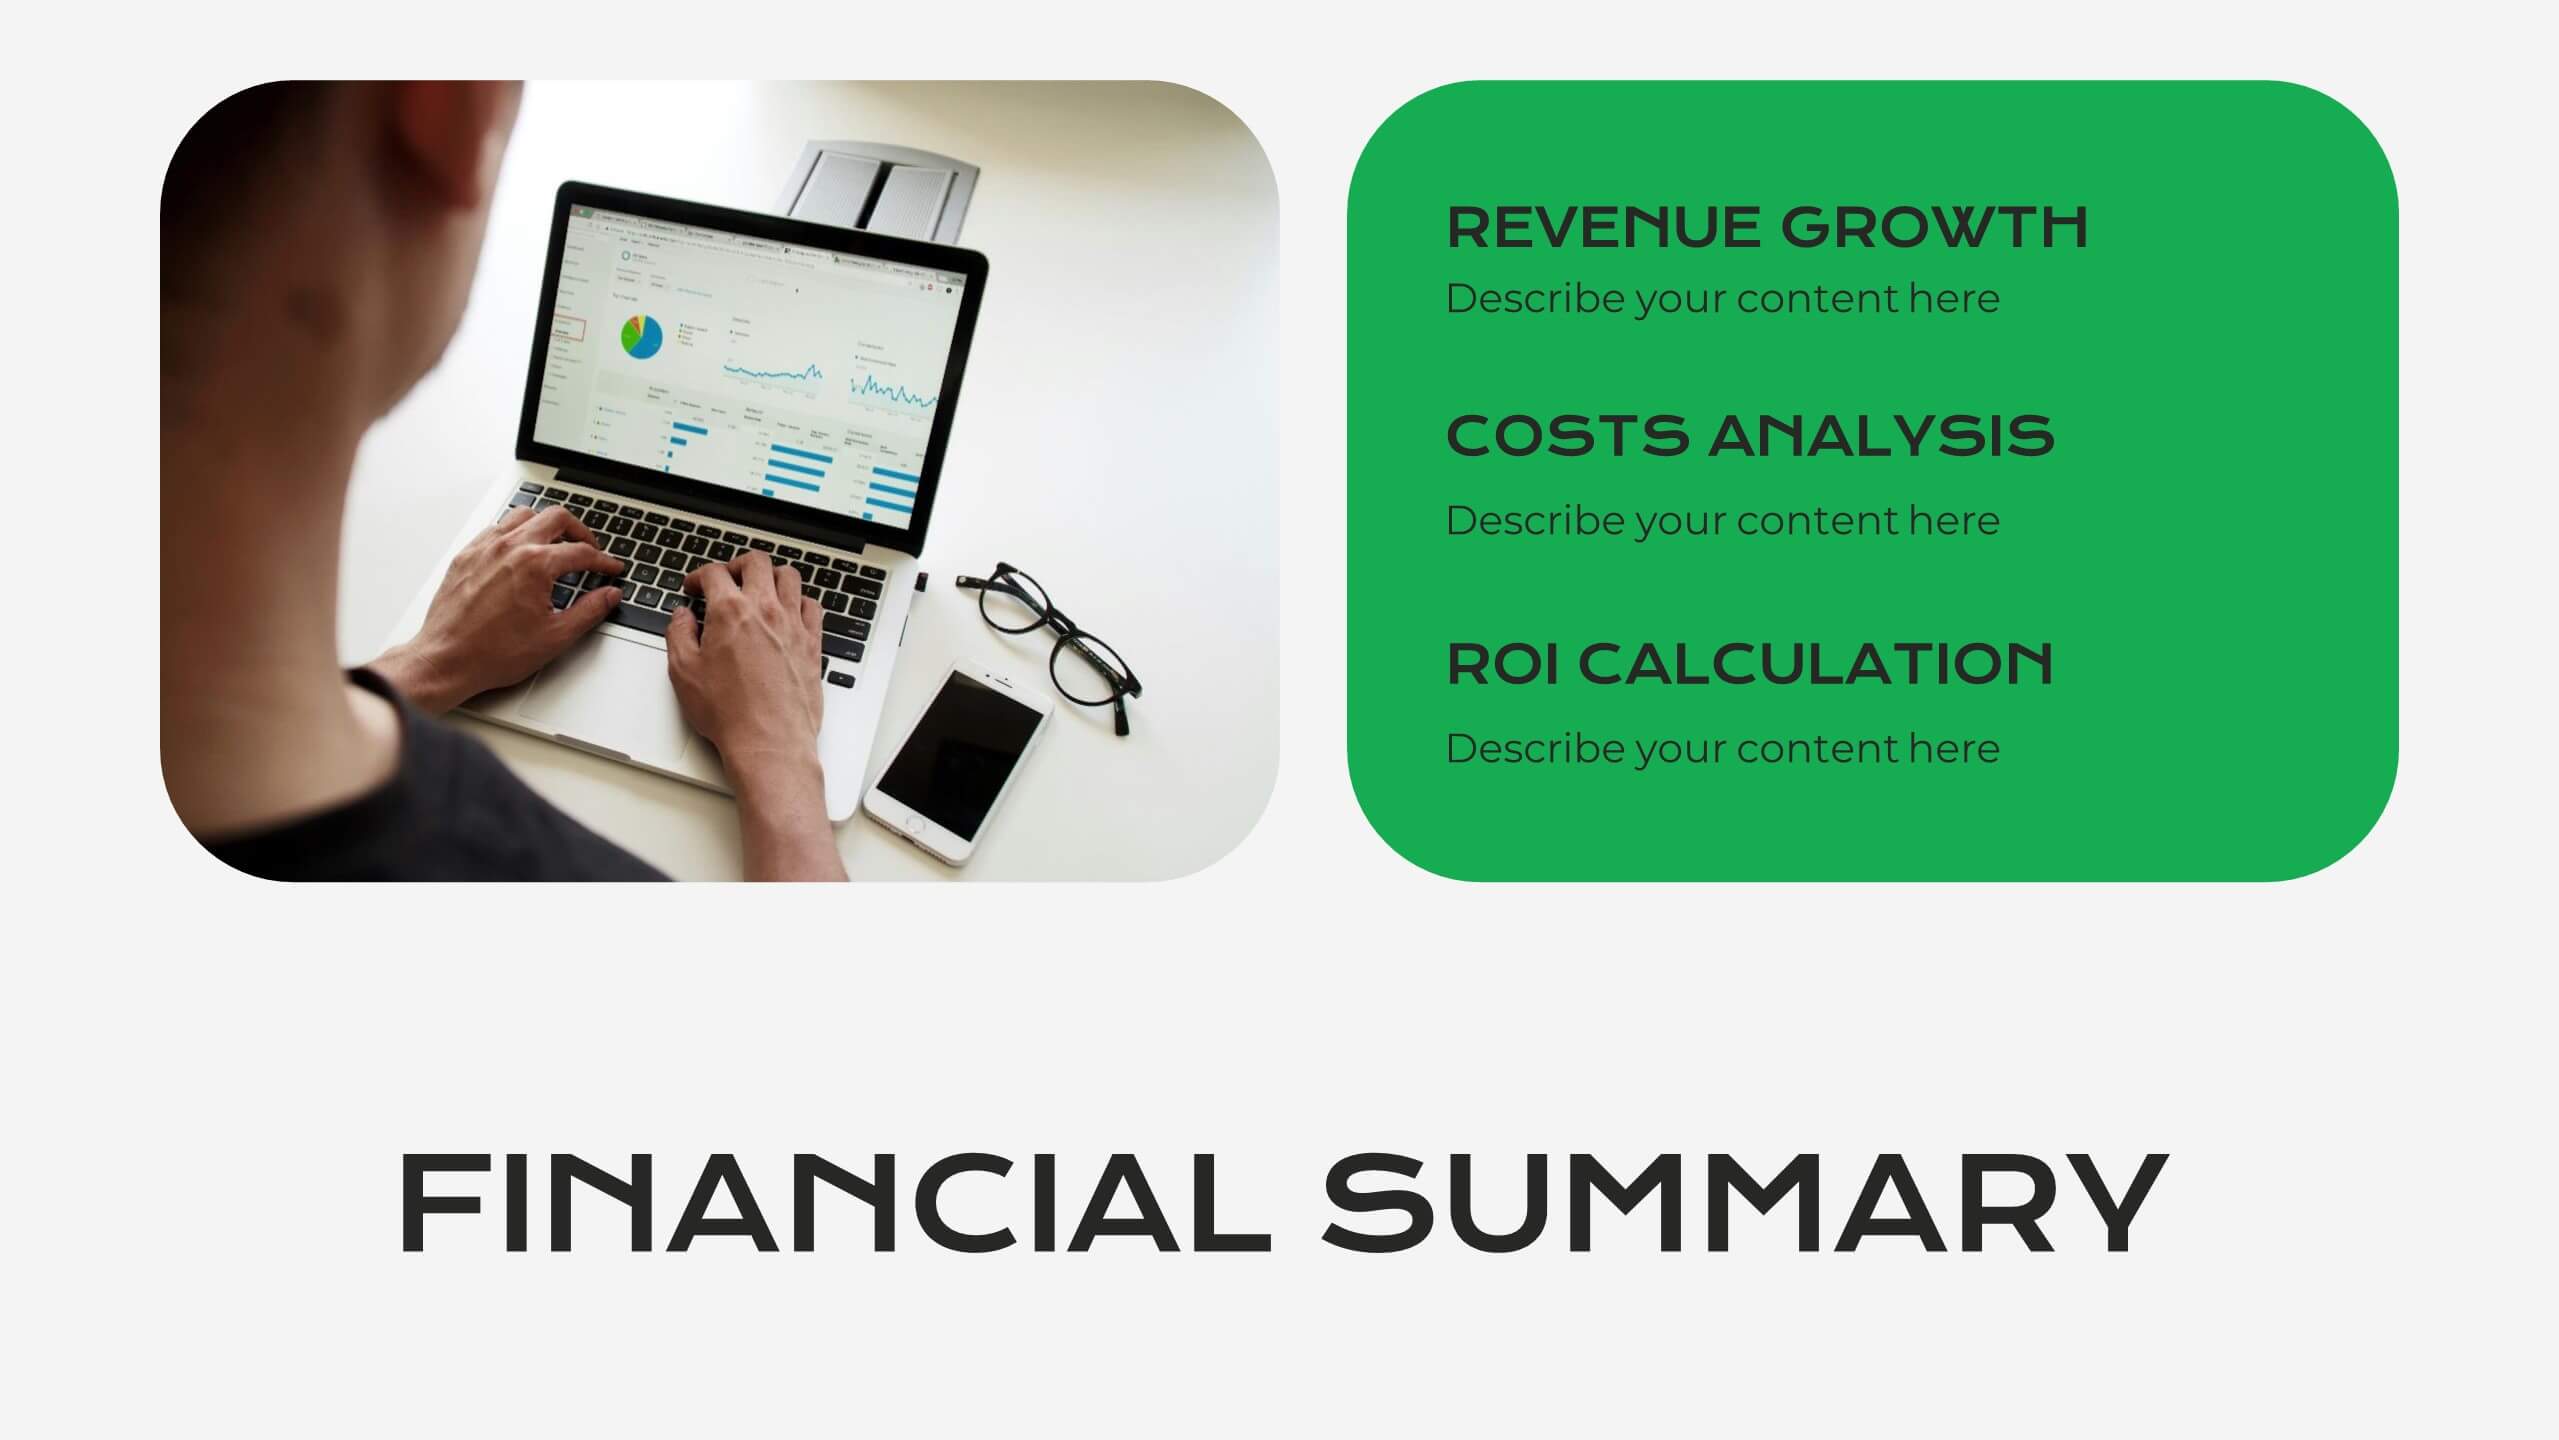
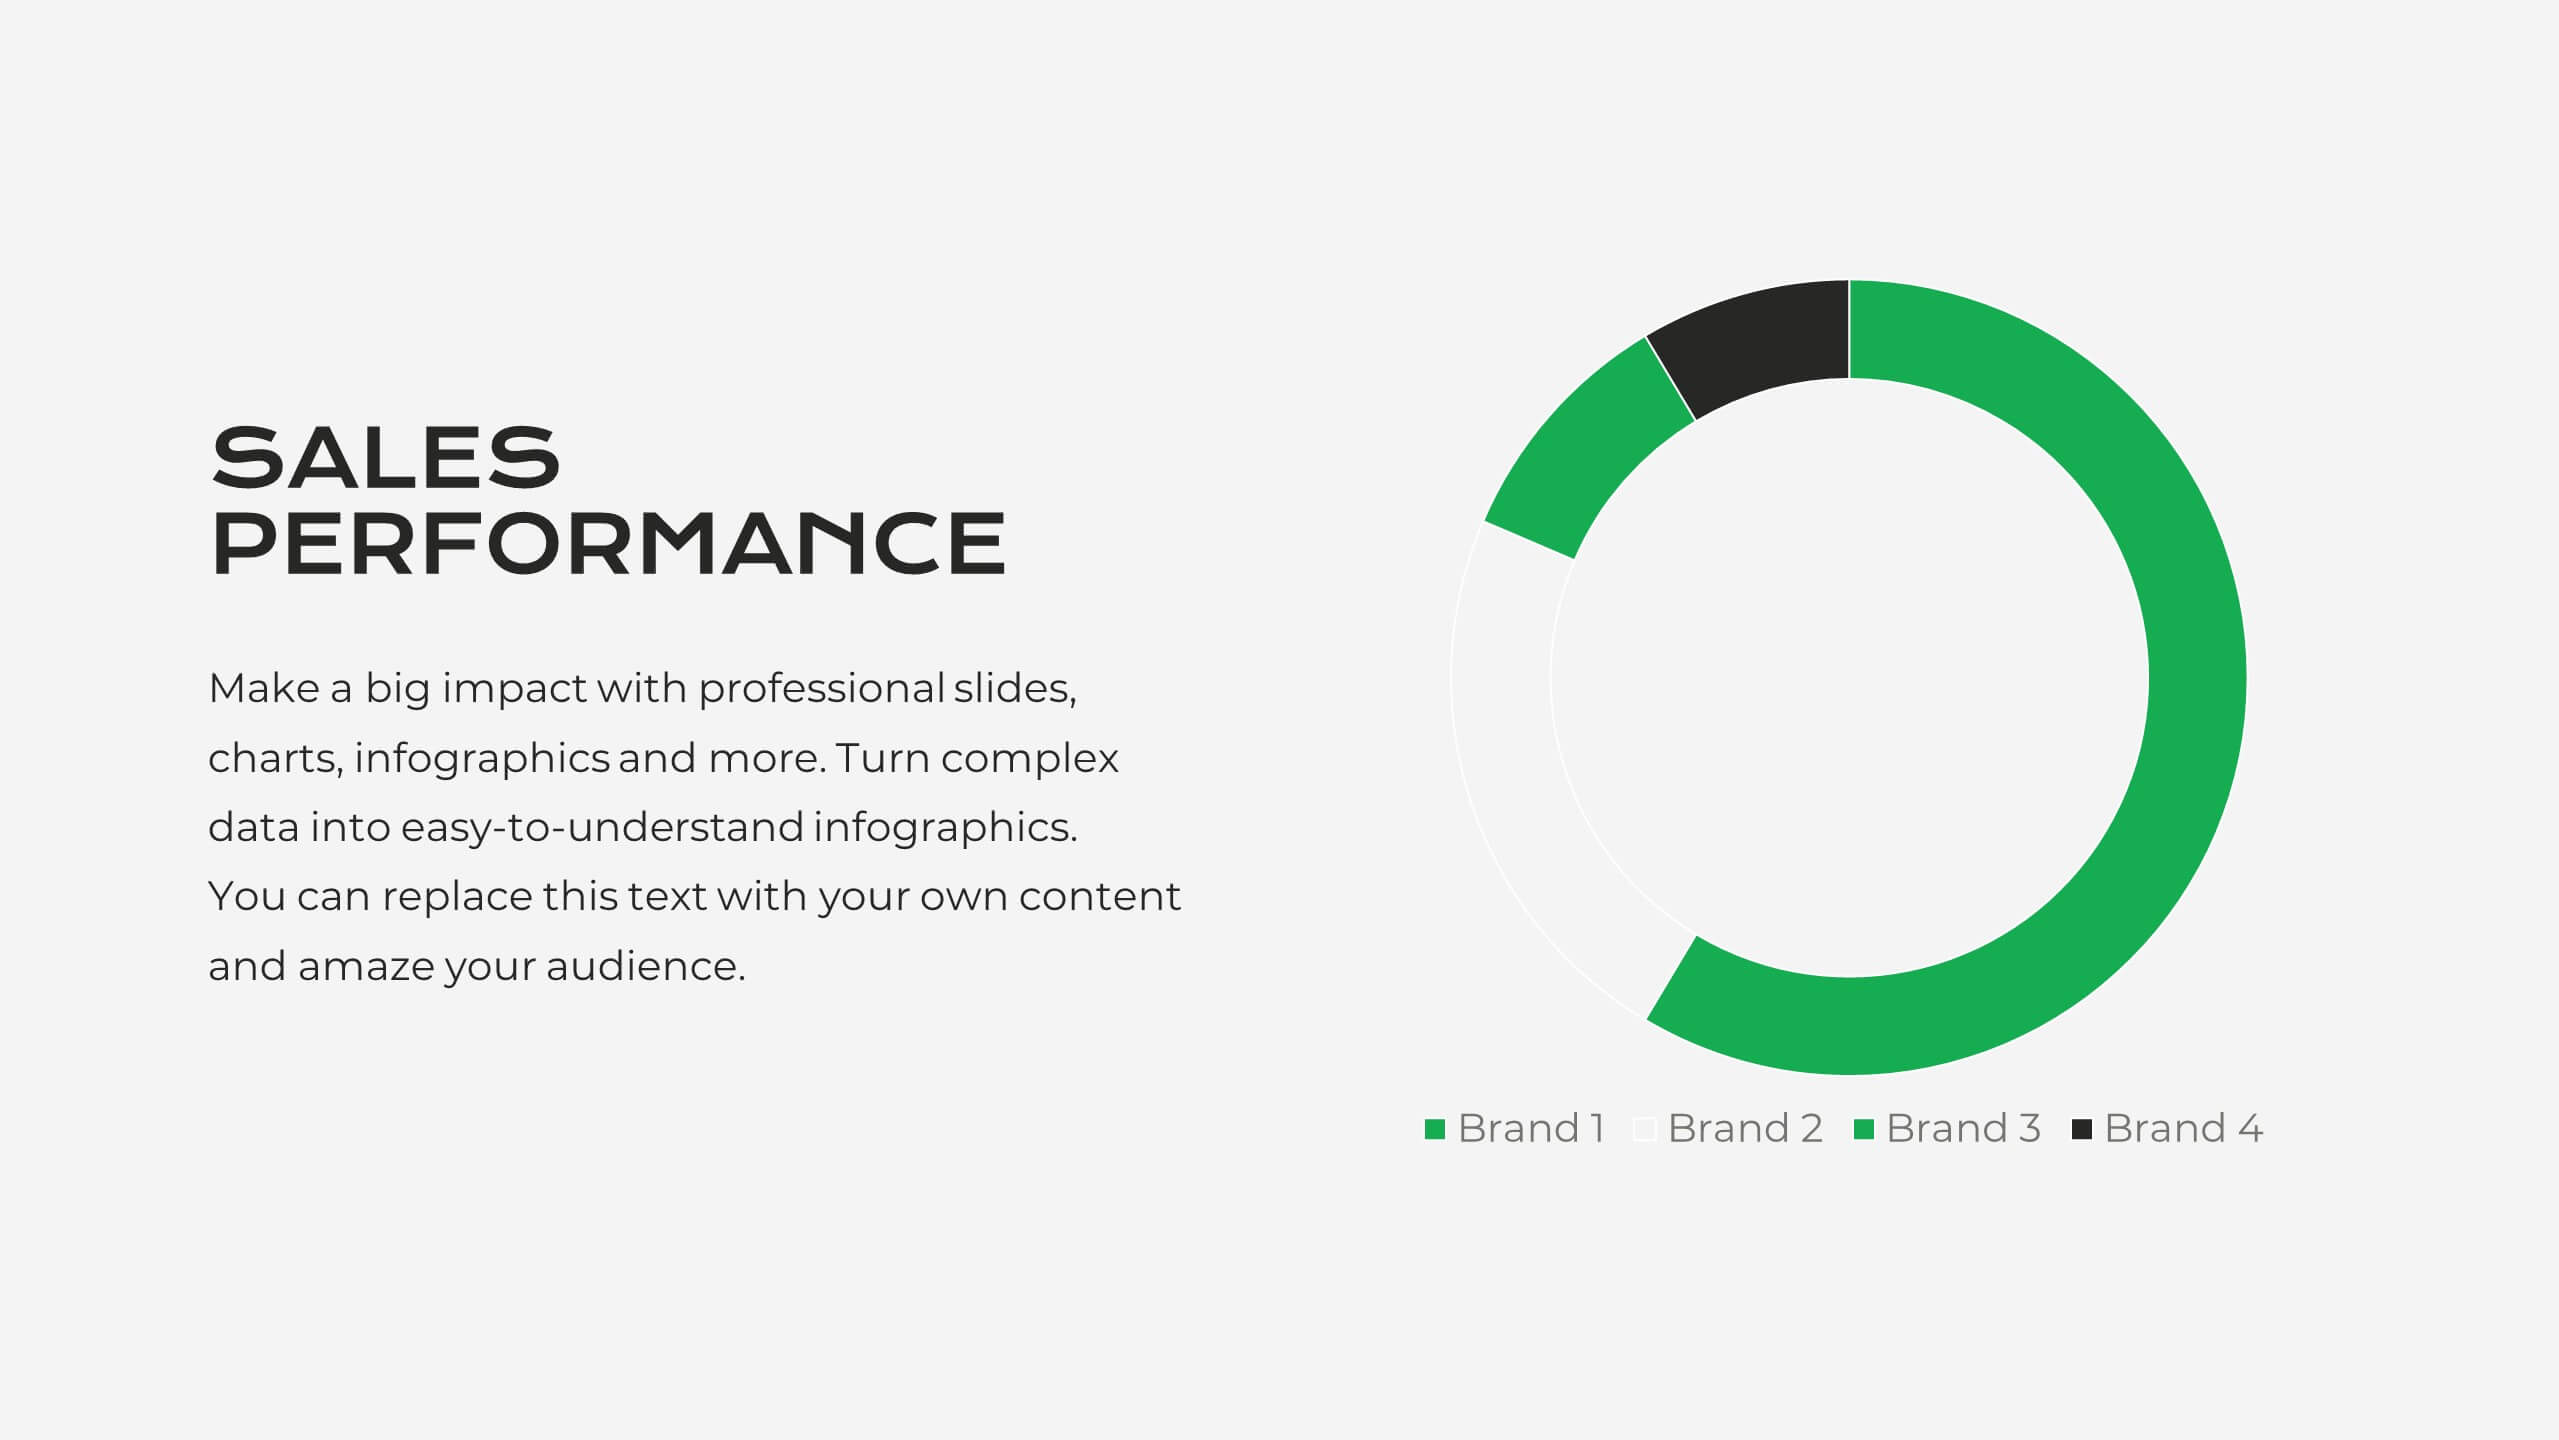
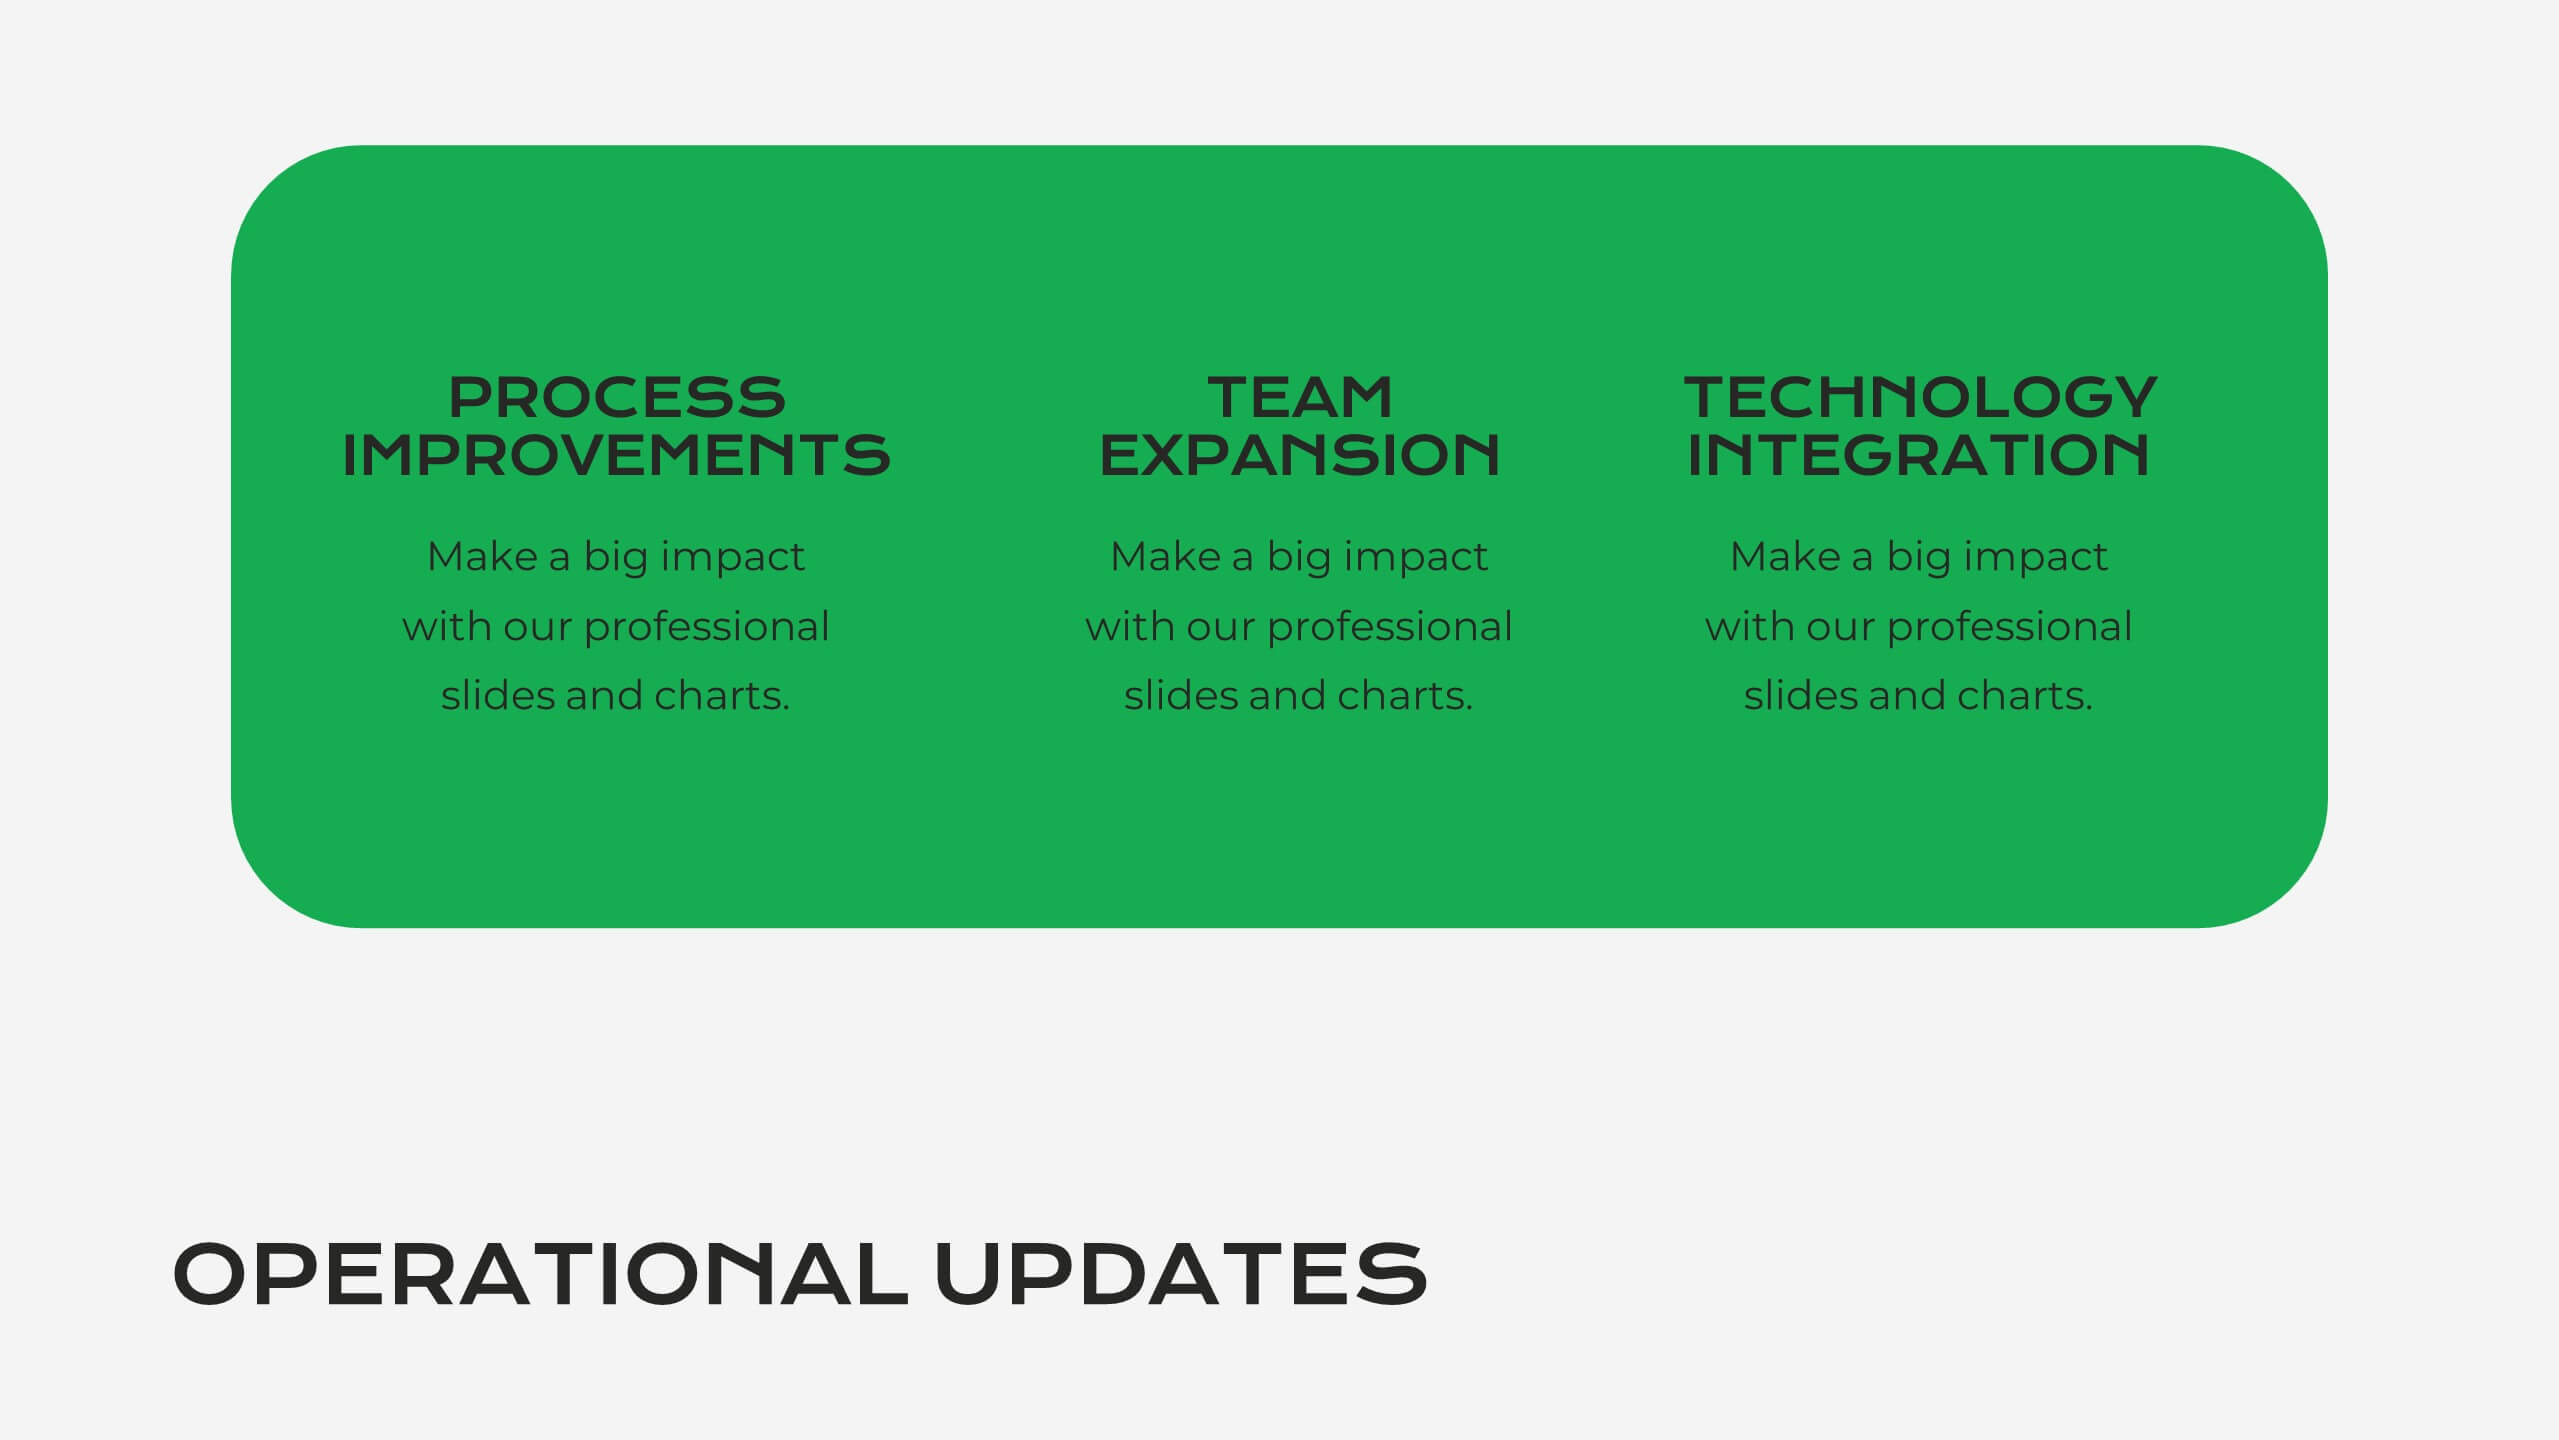
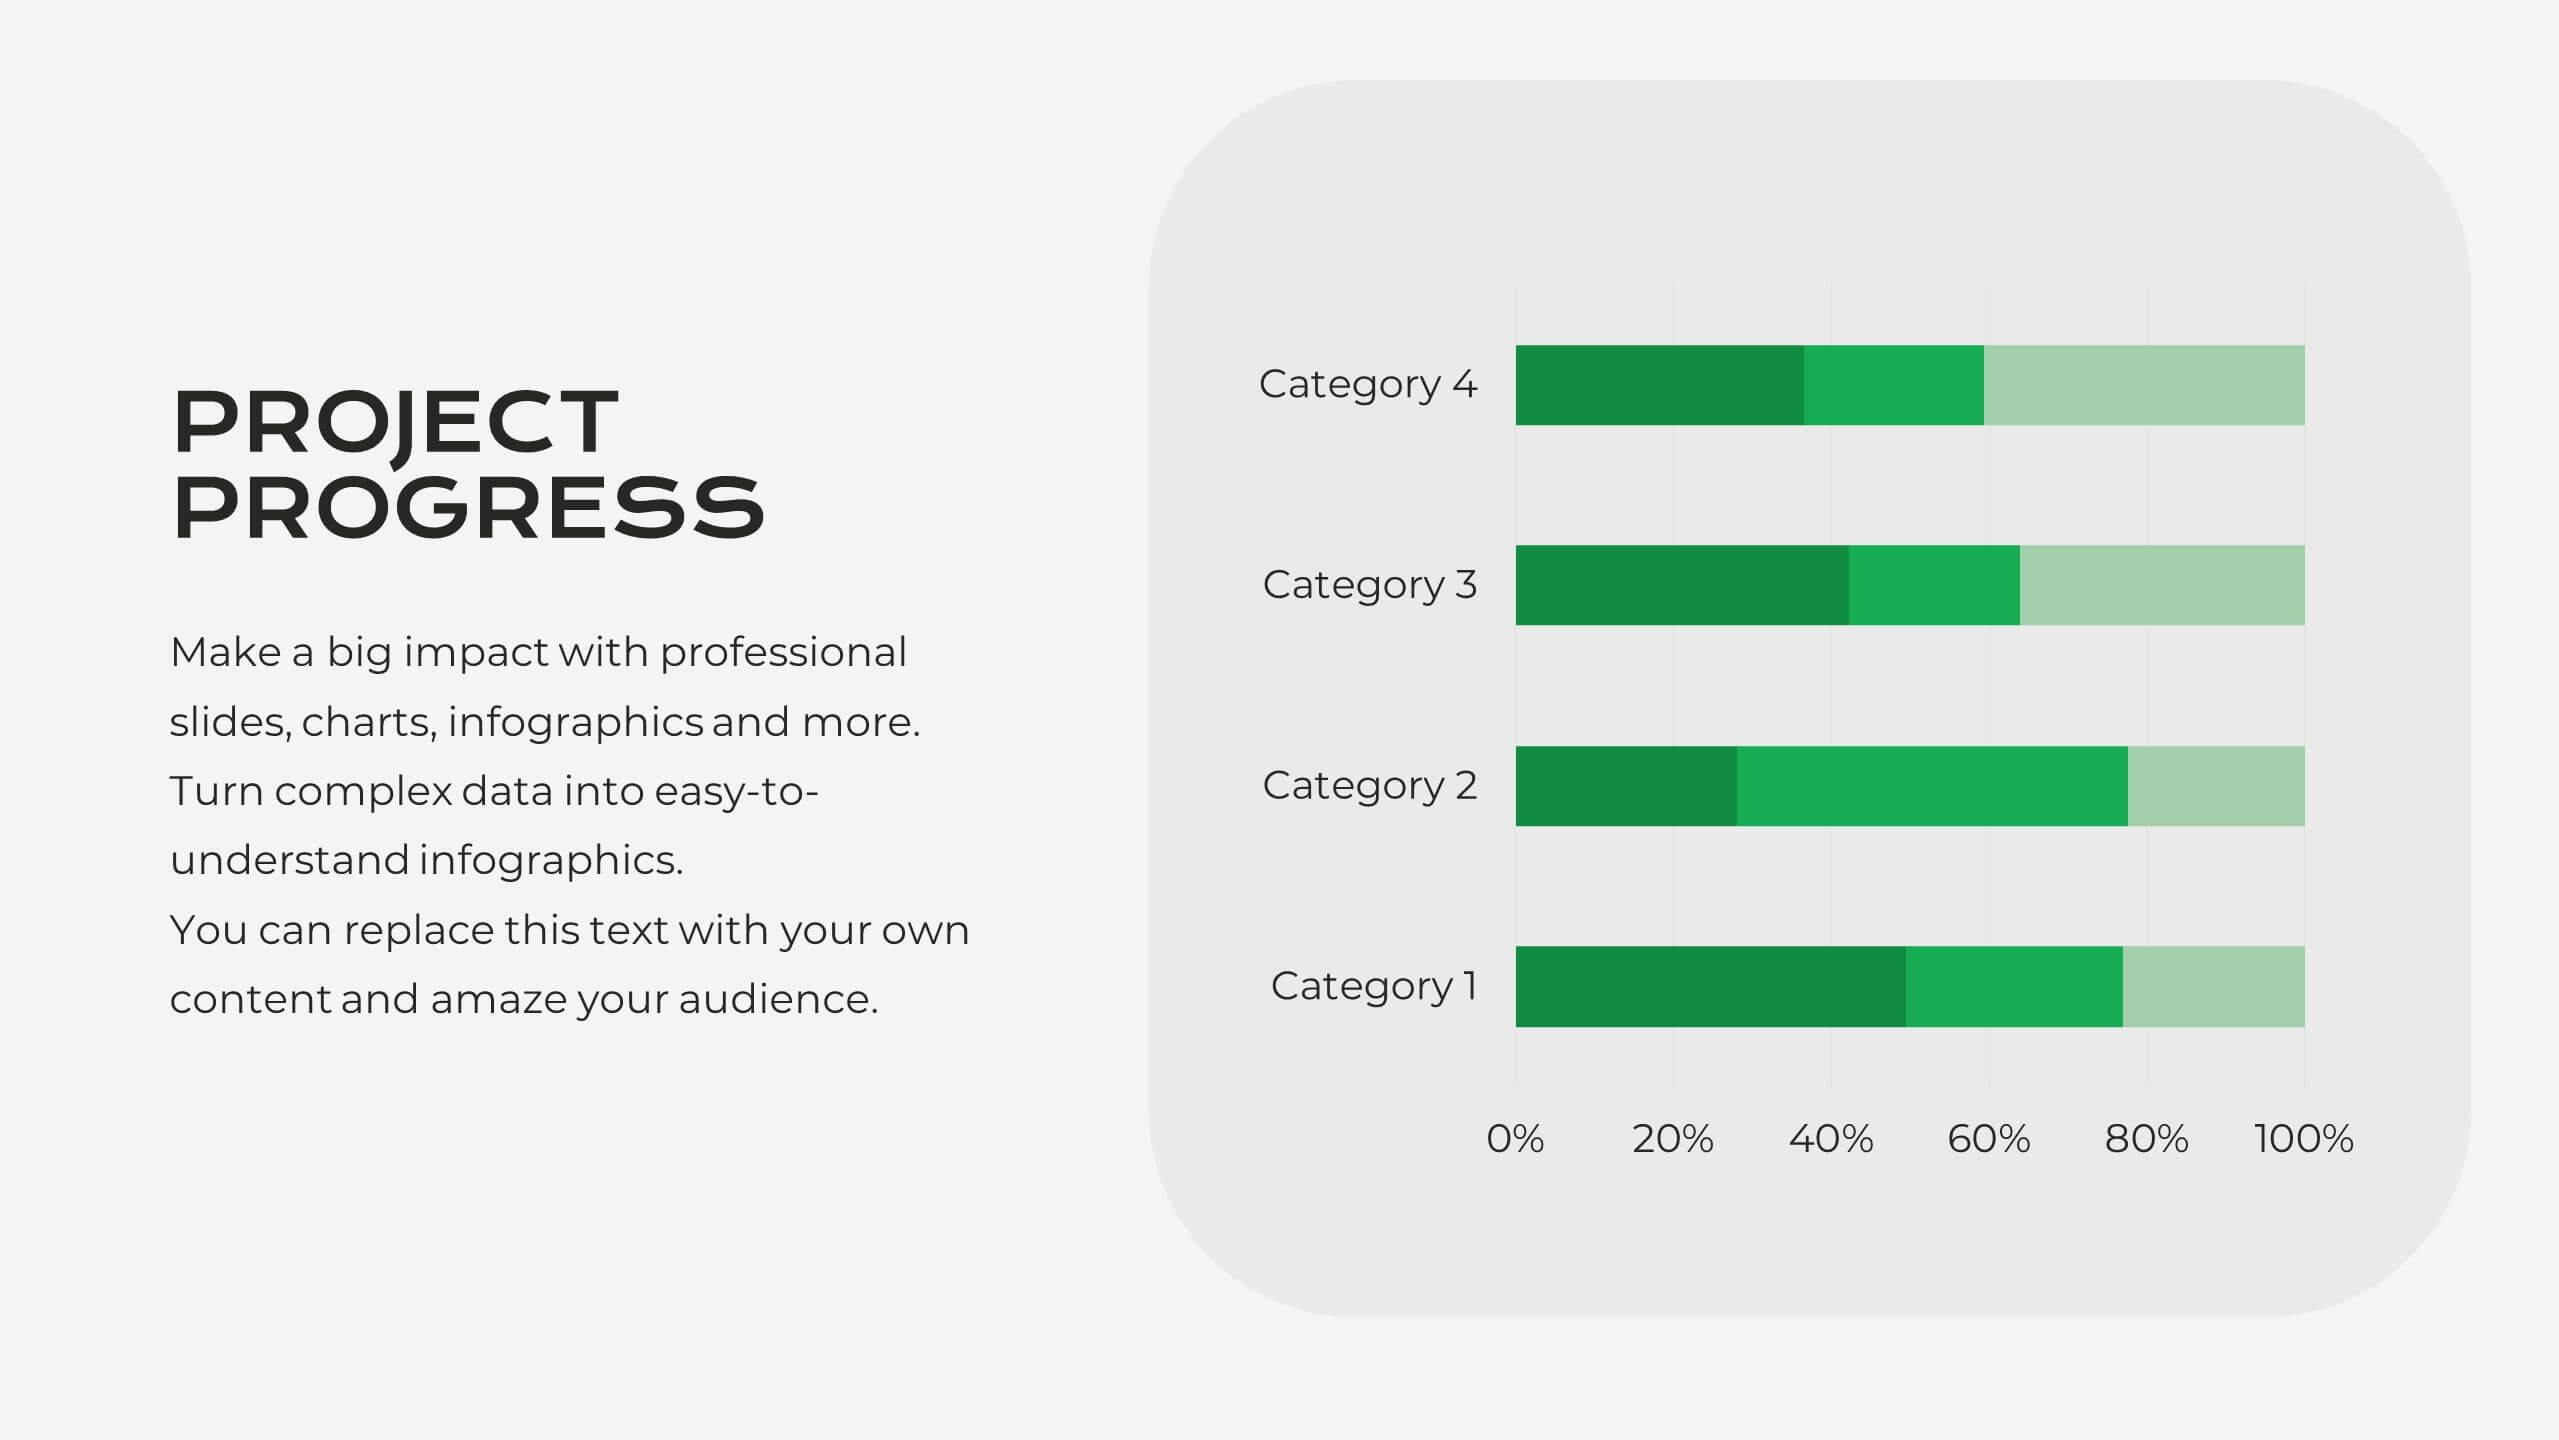
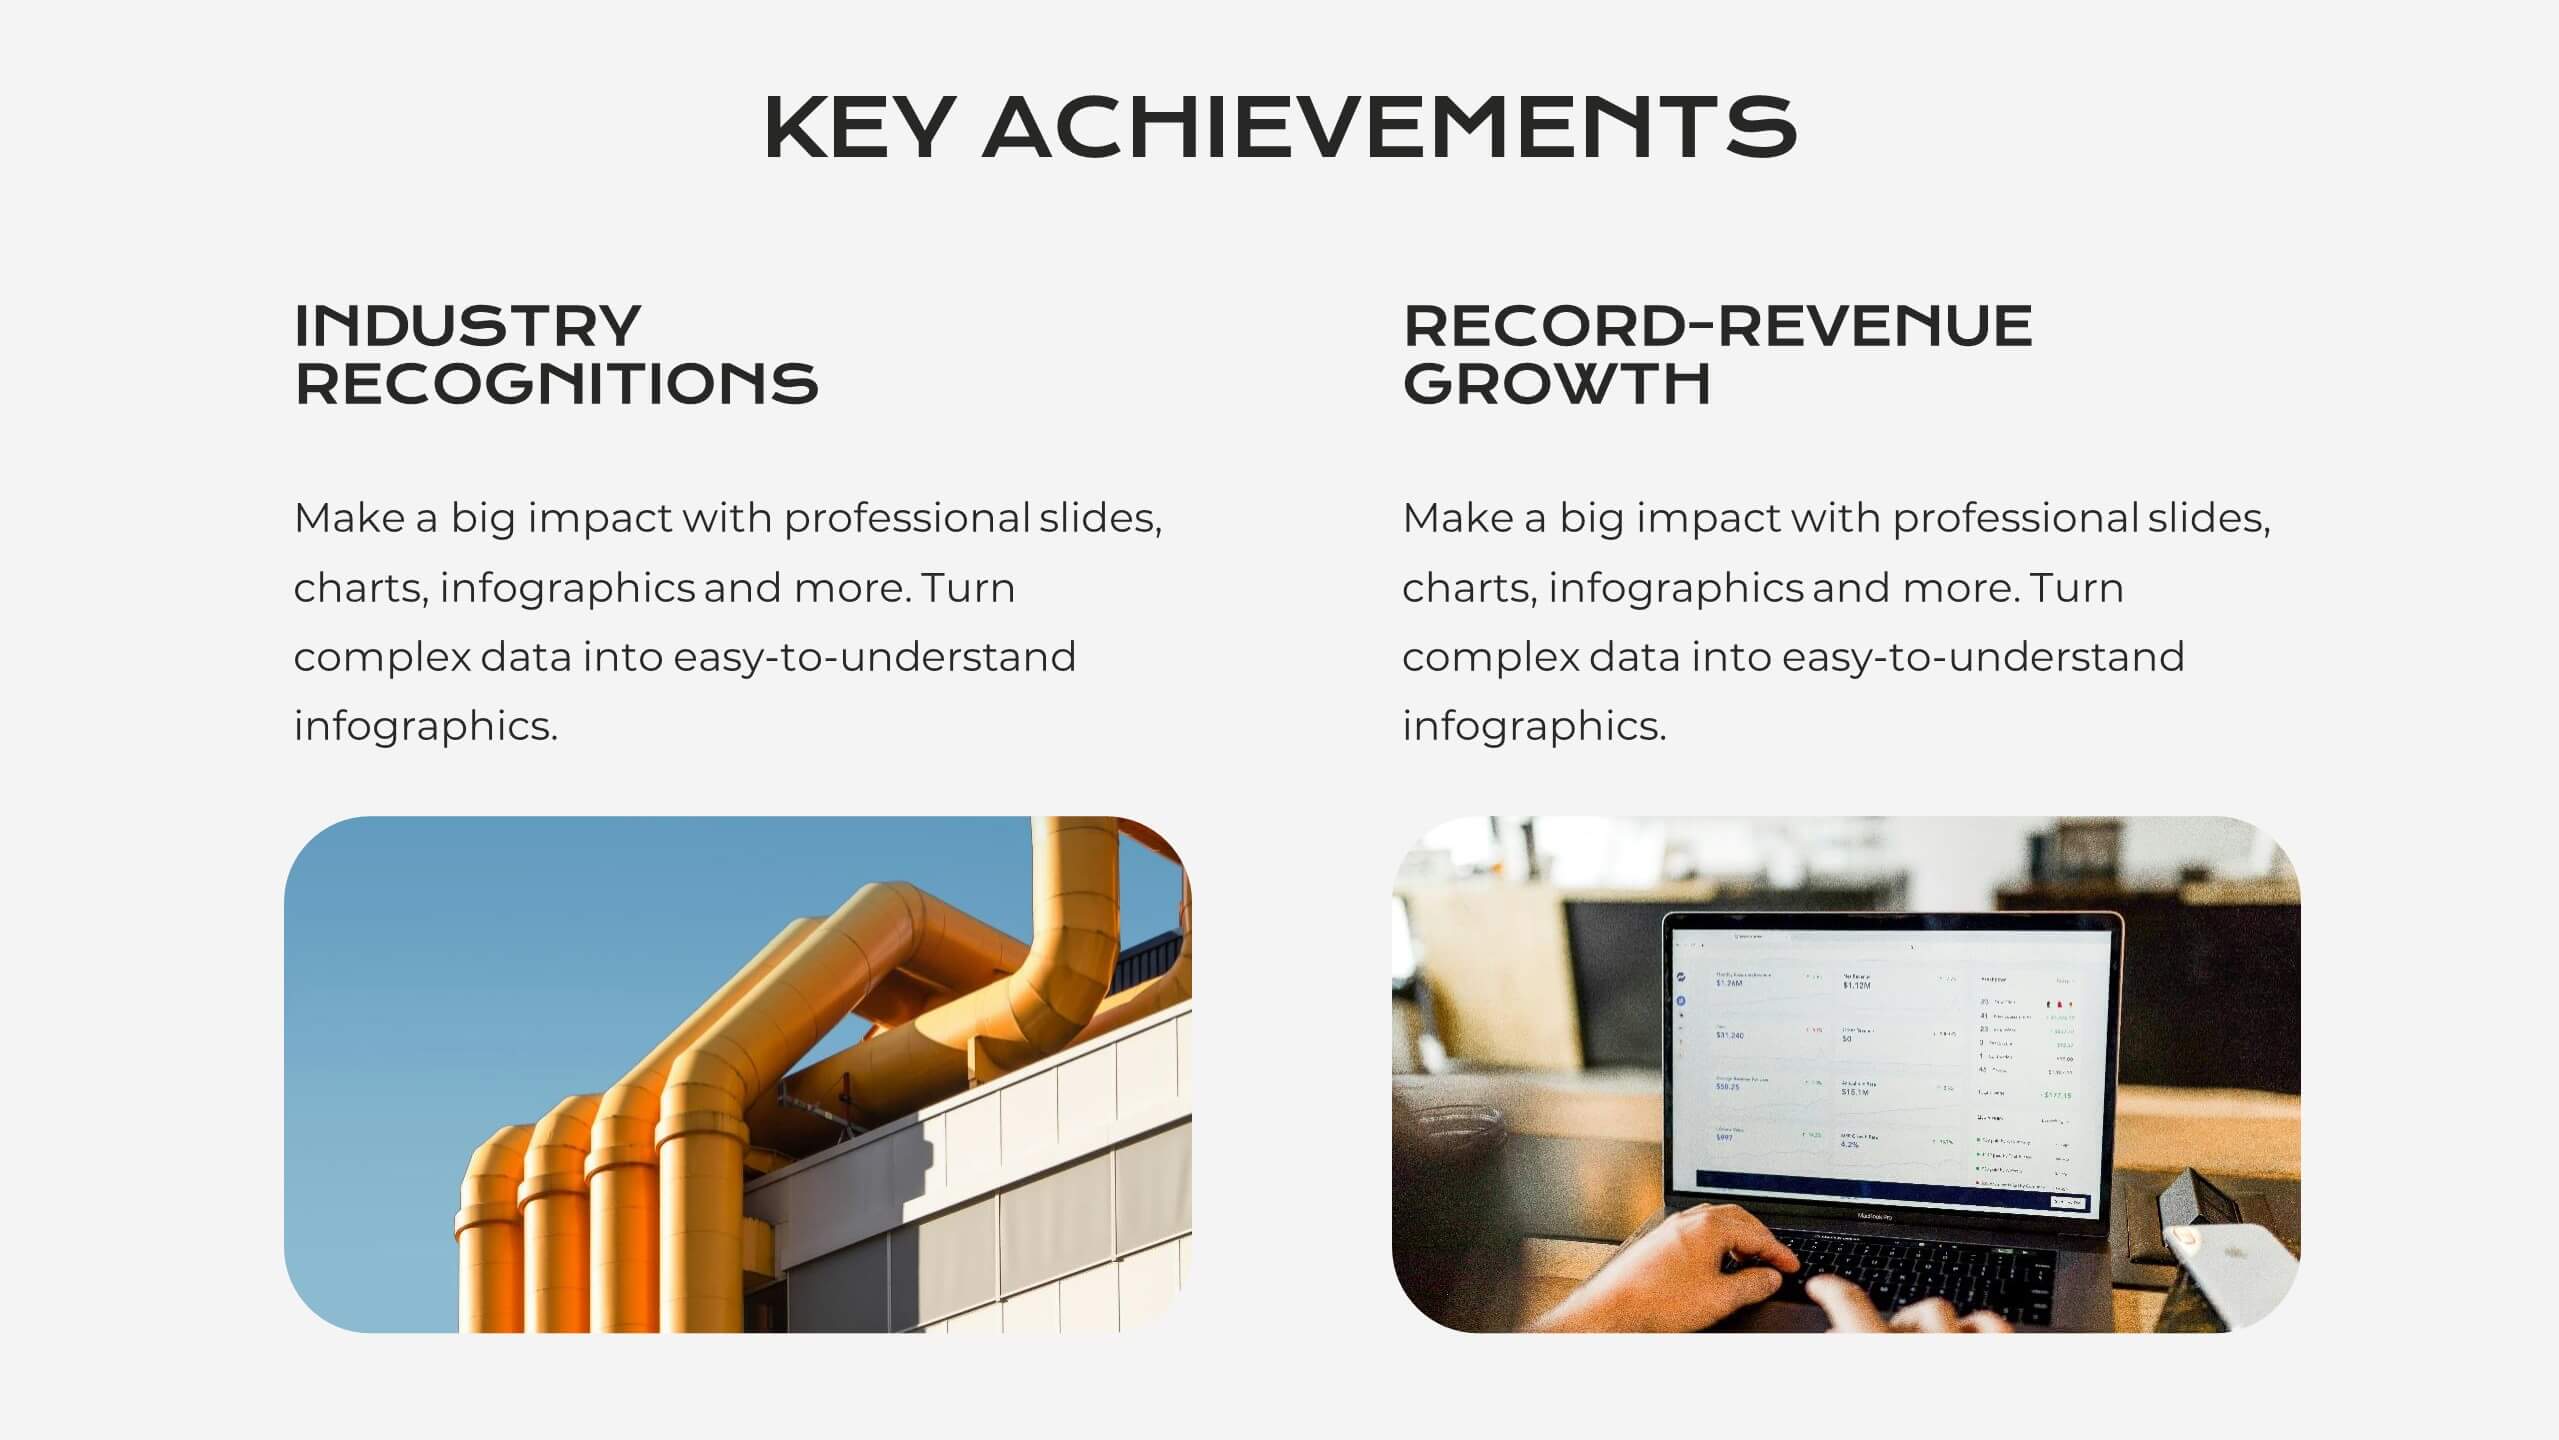
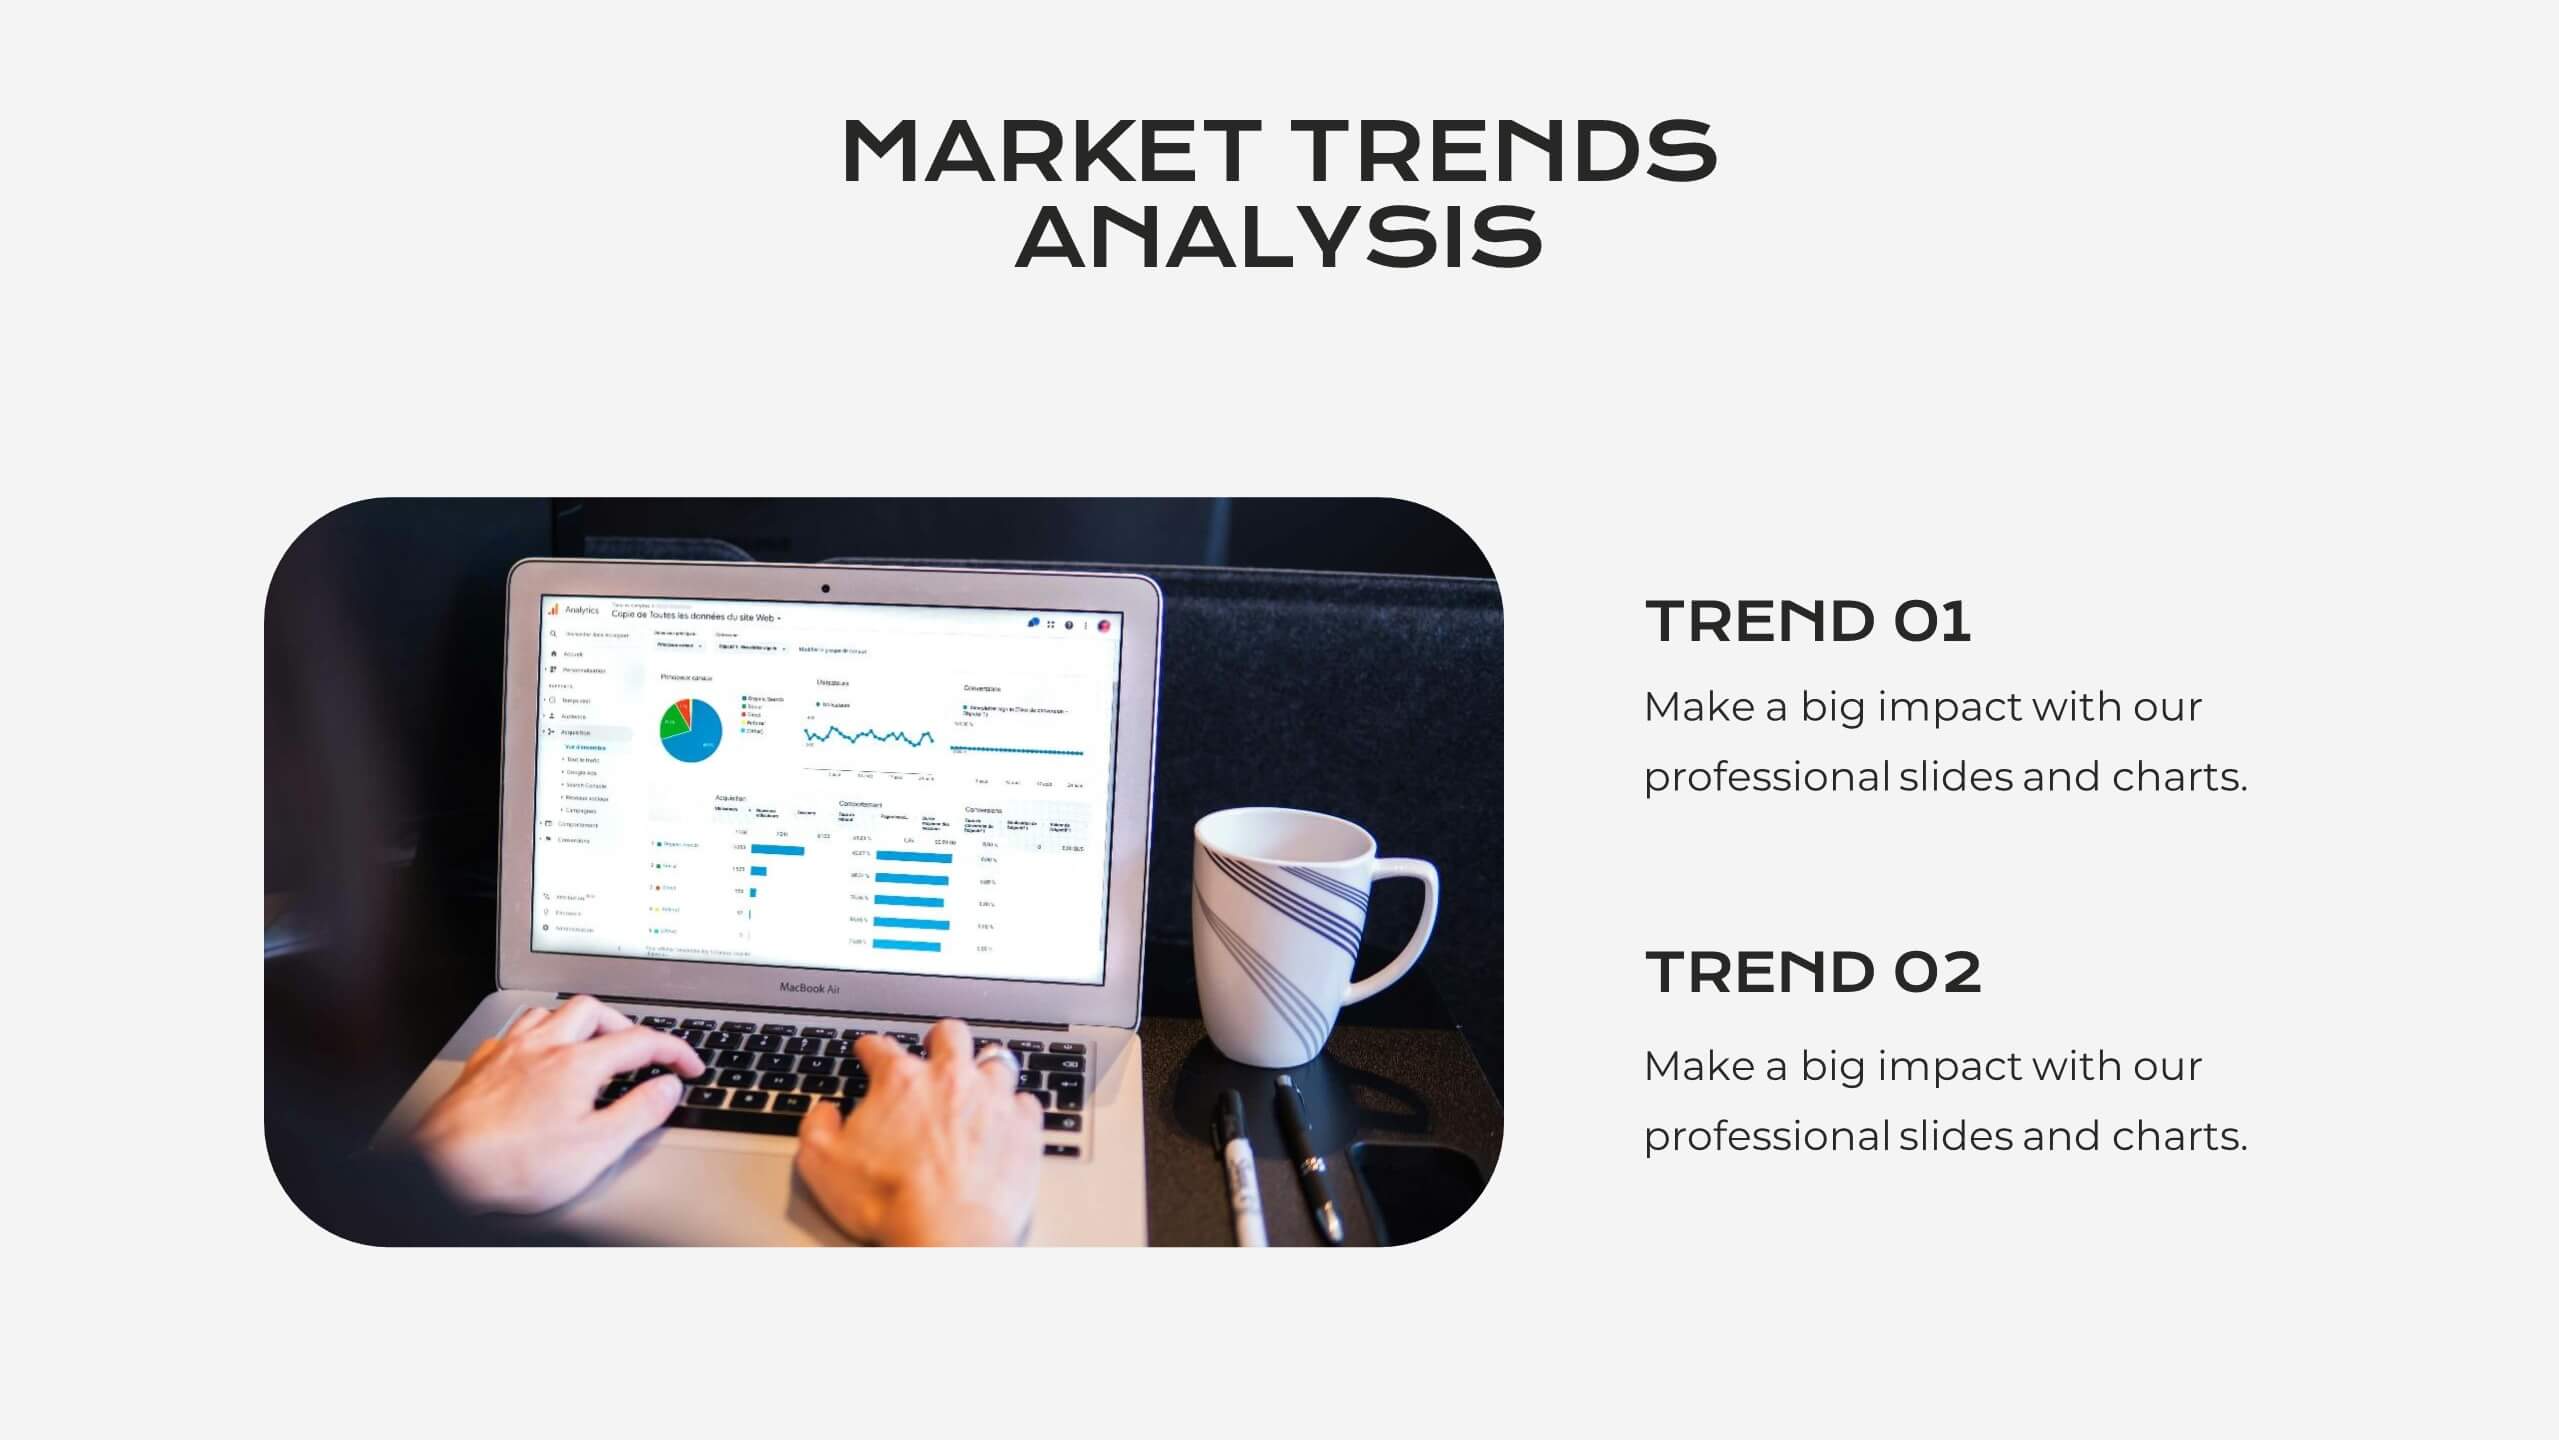
Serene Market Analysis Report Presentation
This modern and clean Market Analysis Report template is designed to help you present key data and insights with clarity and impact. Ideal for business professionals and analysts, it includes slides for key highlights, performance metrics, financial summaries, competitor insights, and strategic initiatives. The template's sleek layout ensures that your data is easy to understand and visually appealing, making it perfect for internal reports or client presentations. Customize it effortlessly in PowerPoint, Keynote, or Google Slides, and impress your audience with a polished and professional report.