


Características


¿Tienes alguna pregunta?
Recomendar


6 diapositivas
Key Points Overview Presentation
Bring your message to life with a slide that makes every key point feel clear, organized, and easy to follow. This presentation helps you highlight essential ideas, compare insights, and simplify complex information for any audience. Perfect for meetings, reports, or strategy updates. Fully compatible with PowerPoint, Keynote, and Google Slides.


6 diapositivas
World Map Biomes Infographics
The "World Map Biomes" infographic template is a visually stunning and educational tool, expertly designed for PowerPoint, Keynote, and Google Slides. This template is a treasure trove for educators, environmentalists, and geographers aiming to provide a captivating geographical overview of the planet's diverse biomes. This template beautifully illustrates the Earth's varied biomes, from lush rainforests and arid deserts to tundra and coral reefs. Each biome is vividly represented, complete with key characteristics, flora and fauna, and climate information. This makes it a powerful resource for educational programs, environmental awareness campaigns, and geographical studies. The design is as informative as it is visually appealing, with a color scheme that mirrors the richness and diversity of the Earth's ecosystems. This not only makes the presentation a feast for the eyes but also enhances the educational impact, engaging audiences of all ages in the wonders of our world's biomes. Whether used in a classroom, a seminar, or an environmental exhibit, this template ensures that the "World Map Biomes" are presented in an enthralling, informative, and visually spectacular manner.


7 diapositivas
Short Term Goals Infographic Presentation
Short-term Goals are important because they provide a clear focus and direction for individuals or organizations to achieve their long-term objectives. Get started on your goals in no time with this template. It is professional, clean and has everything you need to create a presentation. It's a good choice for career advancement and pitches. This template is designed to help your audience visualize the impact of your goals. Use this template as a base to brainstorm your vision and objectives with your team. The goal-oriented design will bring awareness and create excitement about your goals.


5 diapositivas
World History Infographic Presentation
Bring the past to life with this engaging World History Infographic presentation. Featuring a circular layout with 4 editable sections, this infographic allows you to highlight key events, historical milestones, or cultural movements. Ideal for educators, students, and history enthusiasts, it’s designed for clarity, storytelling, and visual appeal. Fully compatible with PowerPoint, Keynote, and Google Slides – and easy to customize for any topic or timeline.


4 diapositivas
Environmental Sustainability Best Practices Presentation
Promote eco-friendly initiatives with the Environmental Sustainability Best Practices Presentation template. This clean and modern slide deck is designed to highlight sustainable business strategies, green initiatives, and environmental impact assessments. Featuring an intuitive layout with clearly defined sections, this fully editable design is ideal for corporate sustainability leaders, educators, and environmental advocates. Compatible with PowerPoint, Keynote, and Google Slides for seamless customization and presentation.


7 diapositivas
Hierarchy Needs Infographic
The Hierarchy of Needs, is a framework that categorizes human needs into five levels, often depicted as a pyramid. This visually engaging infographic template lays out the psychological journey each individual undertakes, climbing the pyramid of needs towards a successful life. Compatible with Powerpoint, Keynote, and Google Slides. Utilize visual elements to guide your audience in understanding their unique journey through the hierarchy, highlighting the importance of each stage. This template will guide you through the layers of hierarchy within organizations, providing an understanding of leadership and organizational structure.


4 diapositivas
Step-by-Step Process Flowchart Presentation
Simplify complex workflows with this Step-by-Step Process Flowchart presentation. Designed for clarity and structure, this layout guides your audience through each phase of a process using visual arrows and color-coded stages. Ideal for operations, planning, or training. Fully editable in Canva, PowerPoint, and Google Slides.


7 diapositivas
Cloud Architecture Infographic
Cloud technology is reshaping the digital landscape, and understanding its architecture is paramount. Dive into the intricacies of cloud systems with our cloud architecture infographic, crafted in a crisp white and serene blue palette. This visual tool demystifies the layers and components that constitute cloud frameworks. IT professionals, enterprise architects, and business decision-makers will greatly benefit from this structured depiction. Fully tailored for a smooth experience on PowerPoint, Keynote, and Google Slides, this infographic serves as a cornerstone for all looking to harness the potentials of cloud infrastructure.


7 diapositivas
Scope Management and Planning Presentation
Ensure clear project scope definition with the Scope Management and Planning Presentation. This structured template highlights key elements of project scope, responsibilities, and deliverables using an intuitive layout. Ideal for project managers, business analysts, and teams aligning project goals. Fully editable and compatible with PowerPoint, Keynote, and Google Slides.


5 diapositivas
Business Annual Report Summary Presentation
Clear, Concise, and Impactful! The Business Annual Report Summary Presentation template helps you present key performance indicators, financial metrics, and company growth in a professional and visually engaging way. Fully customizable and compatible with PowerPoint, Keynote, and Google Slides, it’s ideal for executives and analysts aiming for a compelling data-driven presentation.


10 diapositivas
Project Budget Breakdown Presentation
The "Project Budget Breakdown Presentation" template offers a clear and efficient way to visualize budget allocations within a project. It uses a visually appealing color scheme that highlights four different budget segments, each represented by a different color to ensure quick readability and easy understanding. The template allows you to illustrate percentages and corresponding financial values, making it straightforward for stakeholders to grasp budget allocations at a glance. This template is highly beneficial for project managers, financial analysts, and business executives who need to present and discuss budgetary details clearly and concisely in project meetings or budget reviews. It is adaptable for use in various industries, including construction, IT, marketing, and research development, supporting effective budget management and transparency.


21 diapositivas
Ruby Startup Funding Proposal Presentation
Get ready to pitch your startup in style with this vibrant and engaging presentation template! Perfect for showcasing your startup’s founding story, business model, market analysis, and financial overview, this template ensures you’ll impress potential investors. Fully customizable and compatible with PowerPoint, Keynote, and Google Slides, it’s ideal for securing funding and support.


5 diapositivas
Water Industry Infographics
The Water Industry encompasses the management, treatment, distribution, and conservation of water resources. It plays a vital role in ensuring access to clean and safe water for various purposes. These infographic templates can serve as an effective educational tool for organizations, educational institutions, and environmental groups. This aims to inspire individuals and communities to make a positive impact by adopting sustainable water practices and contributing to the preservation of this vital resource. They are designed to inform about the importance of water conservation, sustainability, and efficient water management.


4 diapositivas
Interactive Data Dashboard Display Presentation
Present data with clarity using this Interactive Data Dashboard Display presentation. Designed to showcase multiple metrics at once, it includes pie charts, donut charts, bubble graphs, and bar comparisons. Ideal for business reports, marketing insights, or performance reviews. Fully editable in Canva, PowerPoint, and Google Slides for flexible customization.


10 diapositivas
Concept Mapping with Bubble Map
Break down complex ideas into visual clusters with this hexagon-style concept mapping template. Designed to organize information into thematic groups, it's ideal for brainstorming, mind mapping, or presenting strategies and workflows. Each section uses color-coded bubble maps for easy navigation. Fully editable in PowerPoint, Keynote, and Google Slides.

22 diapositivas
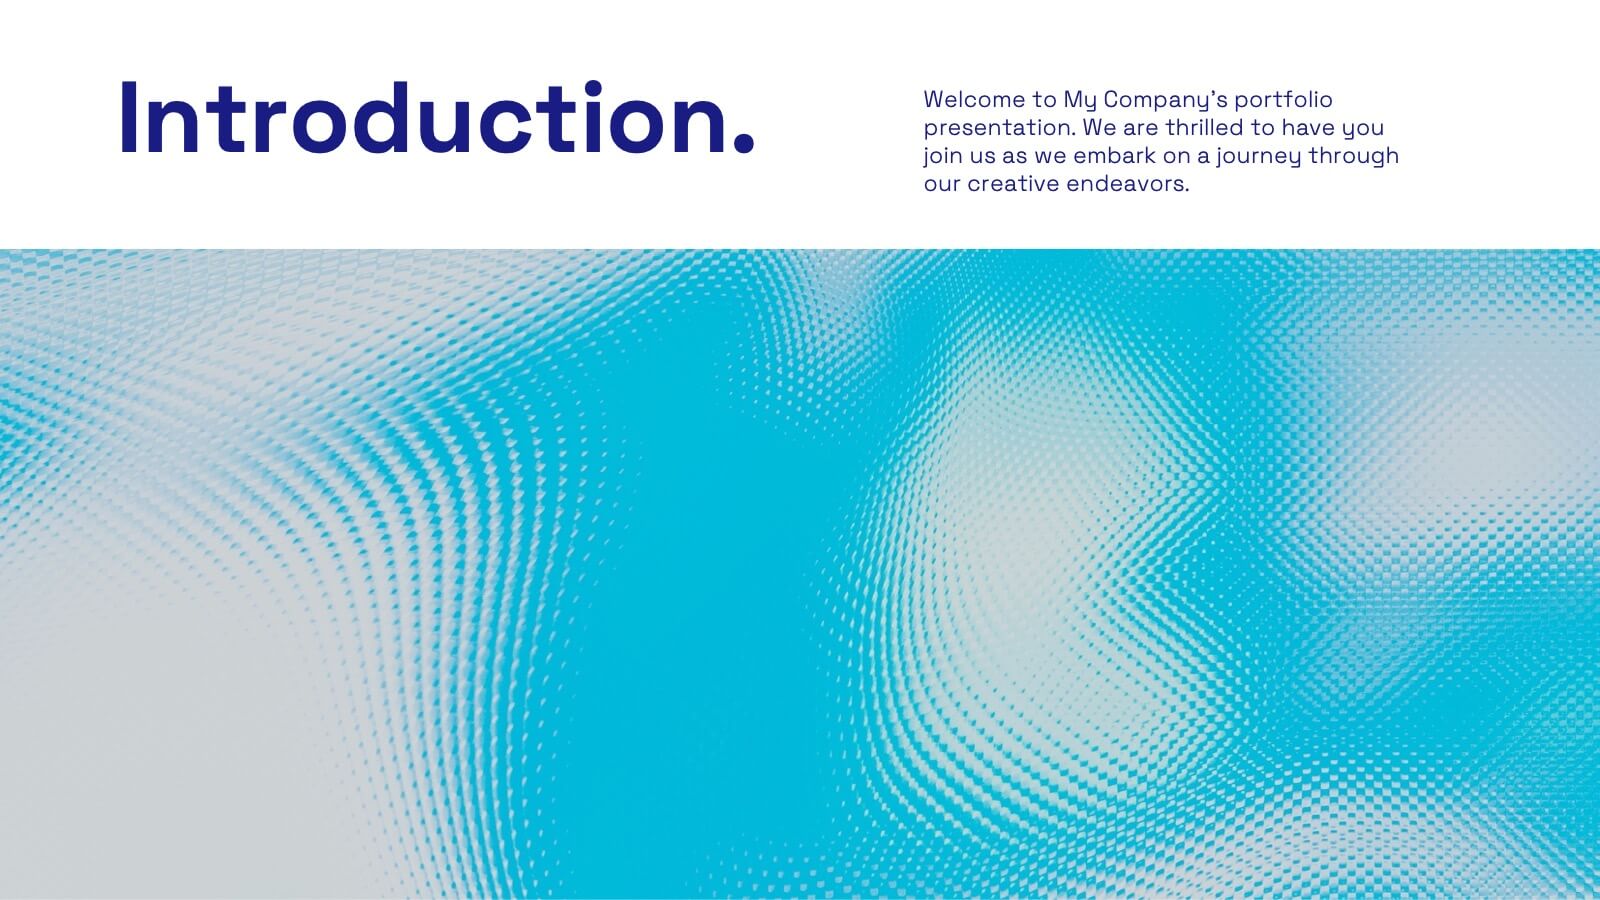
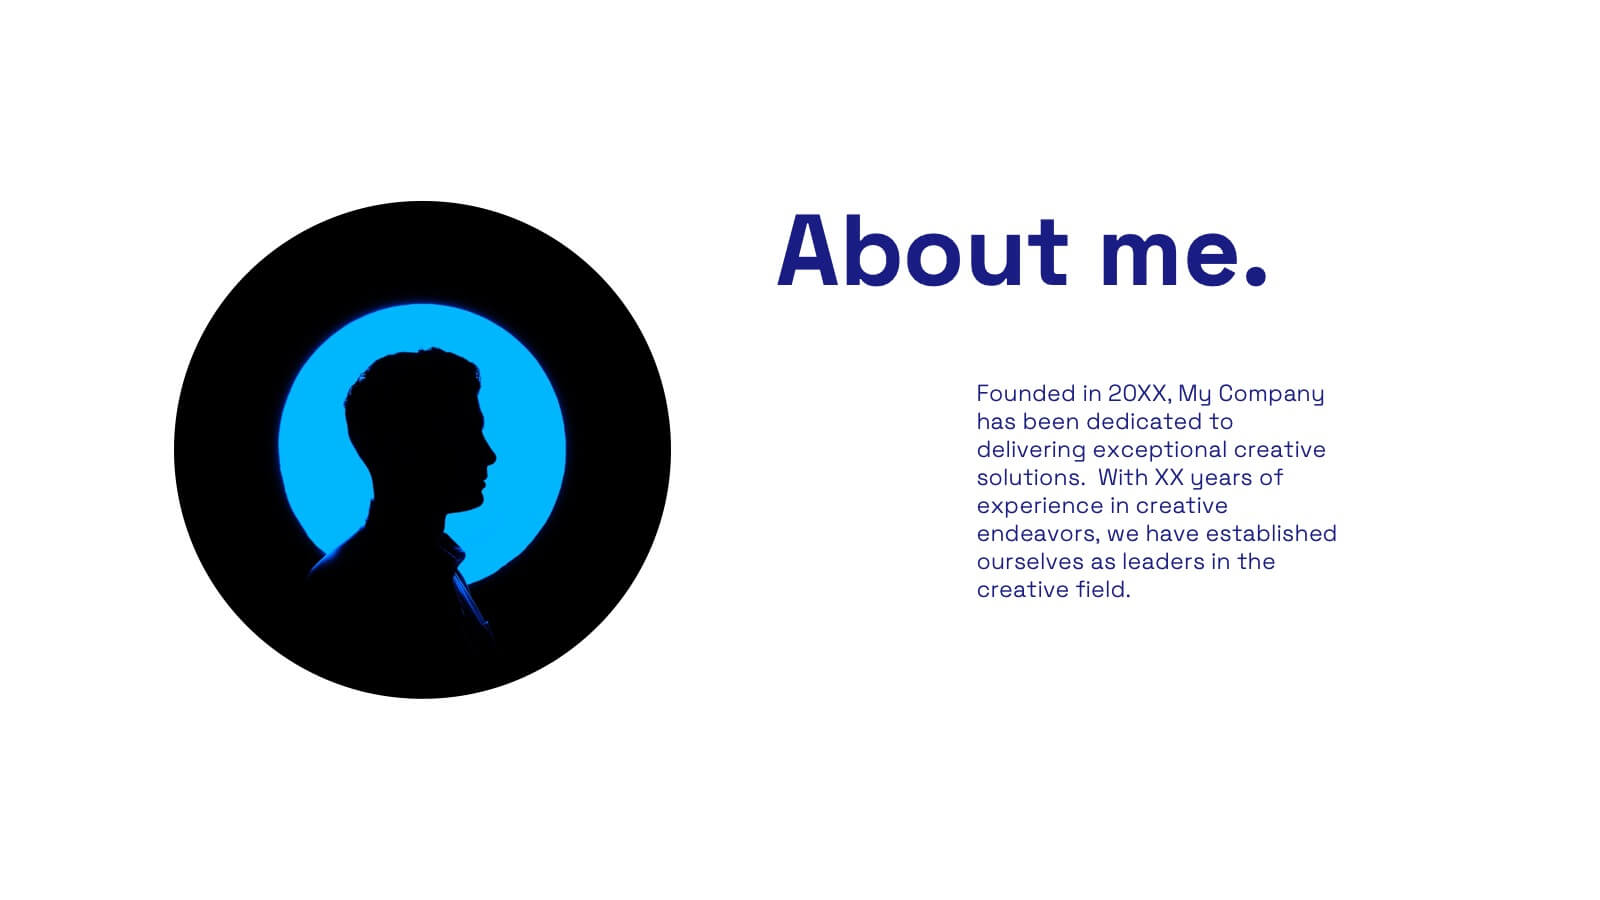
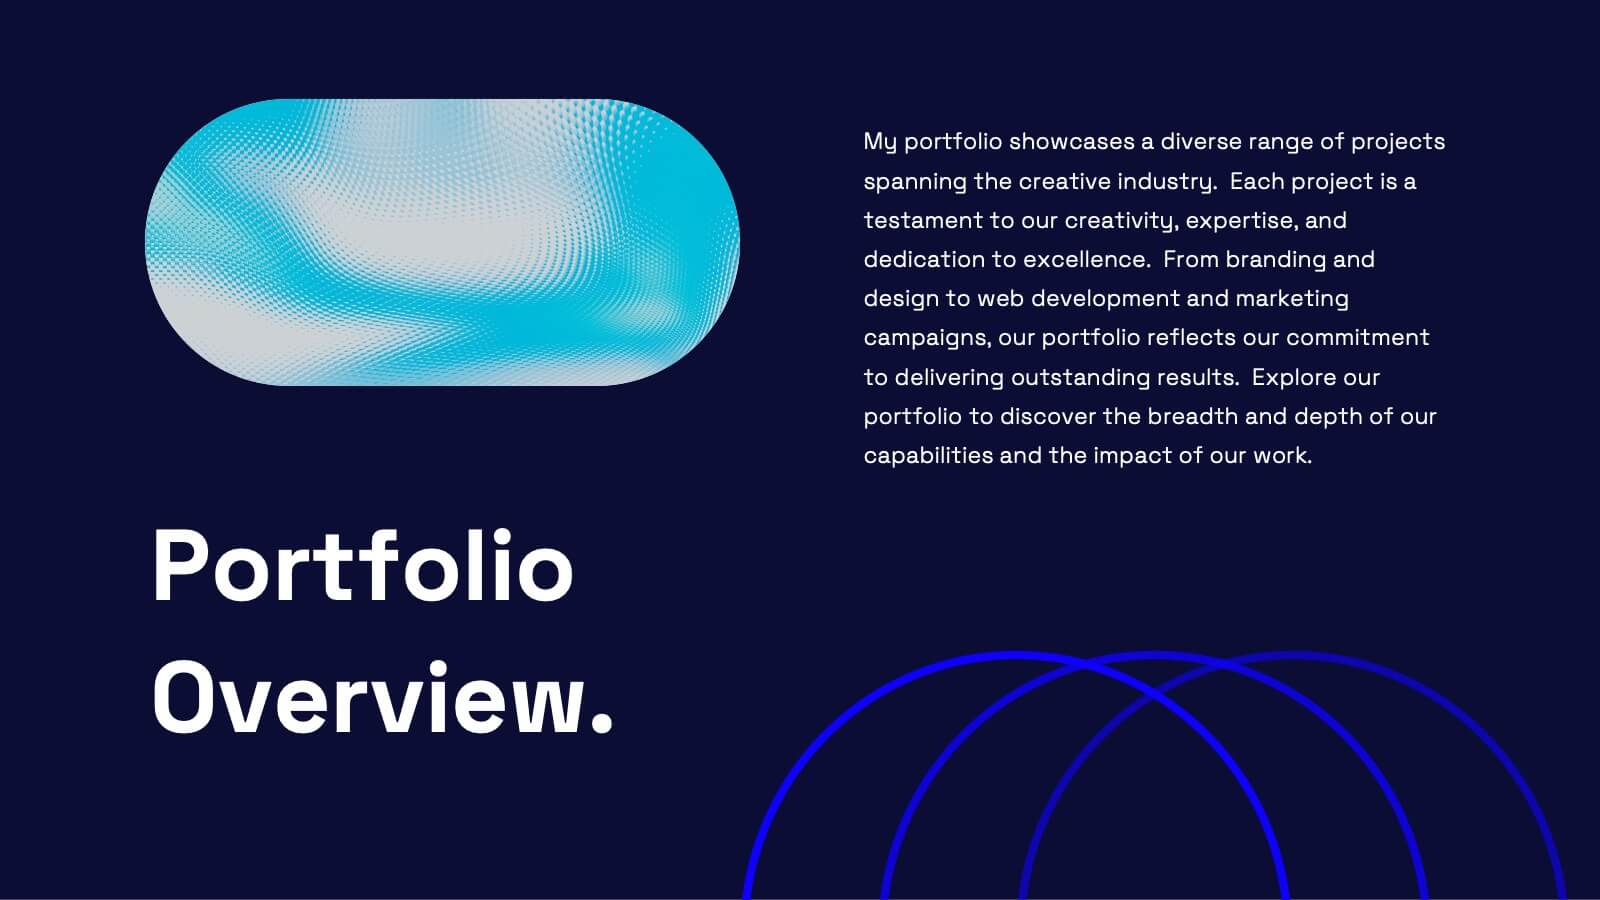
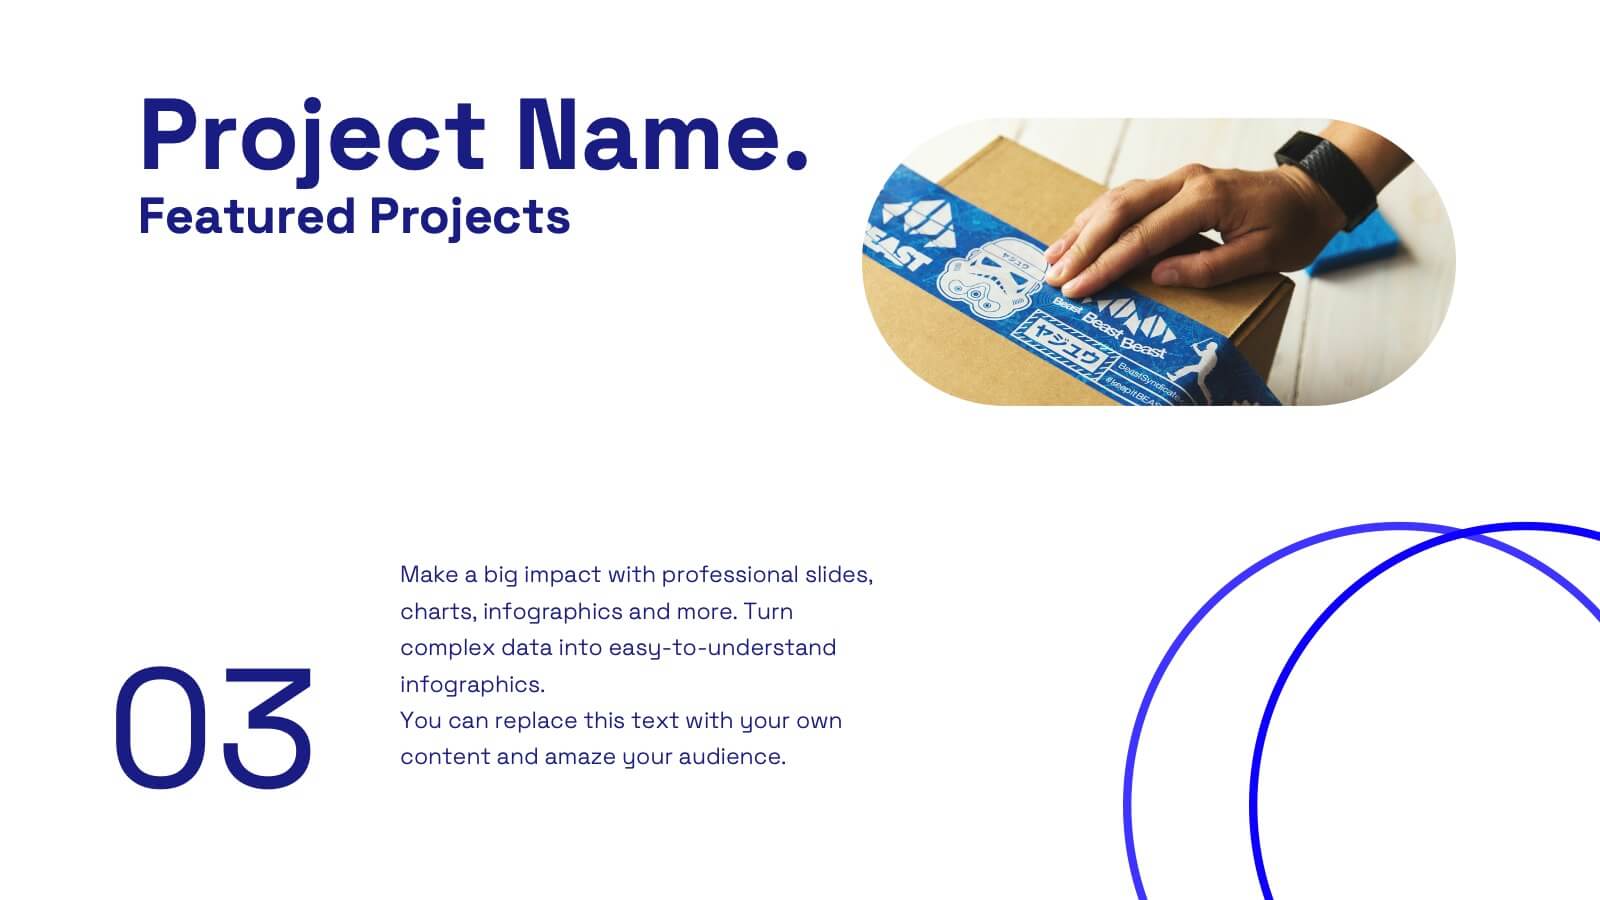
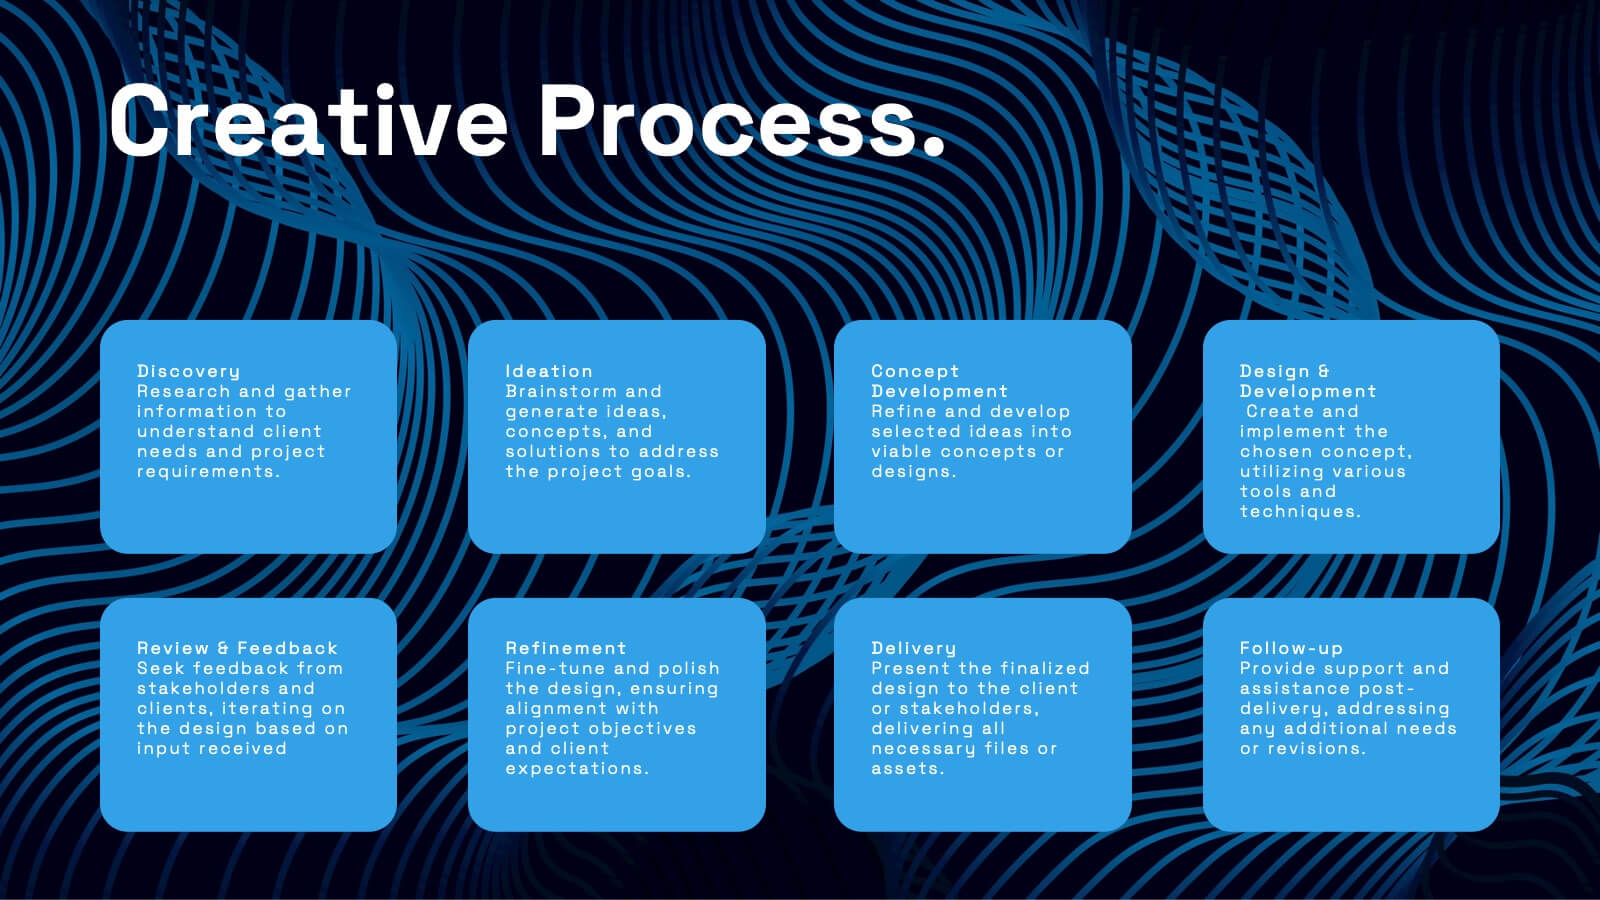
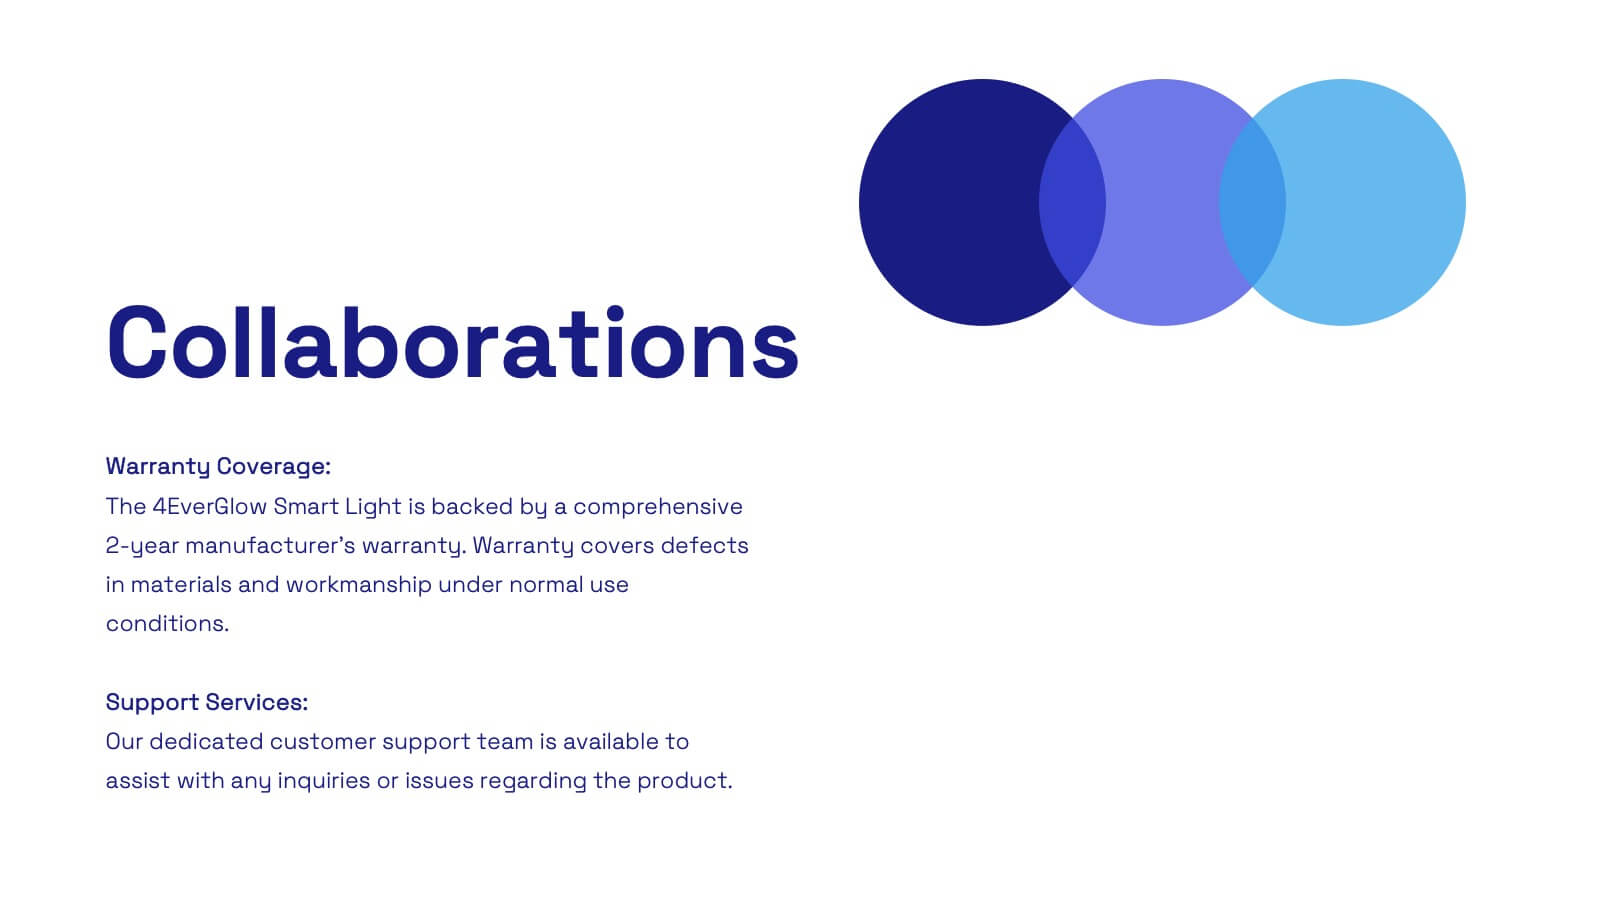
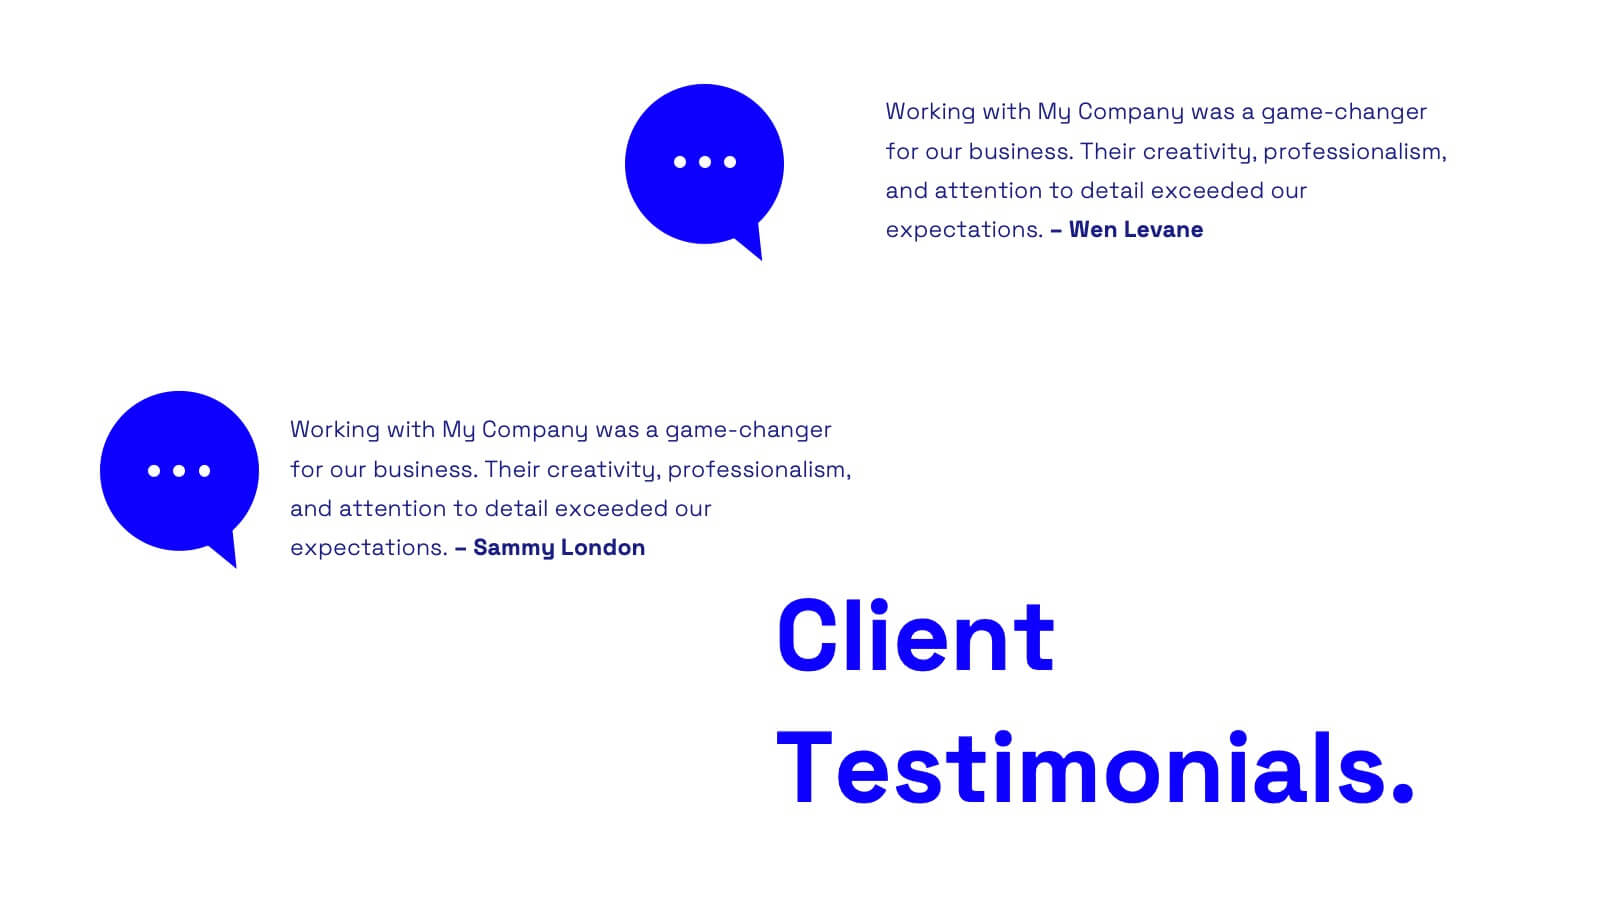
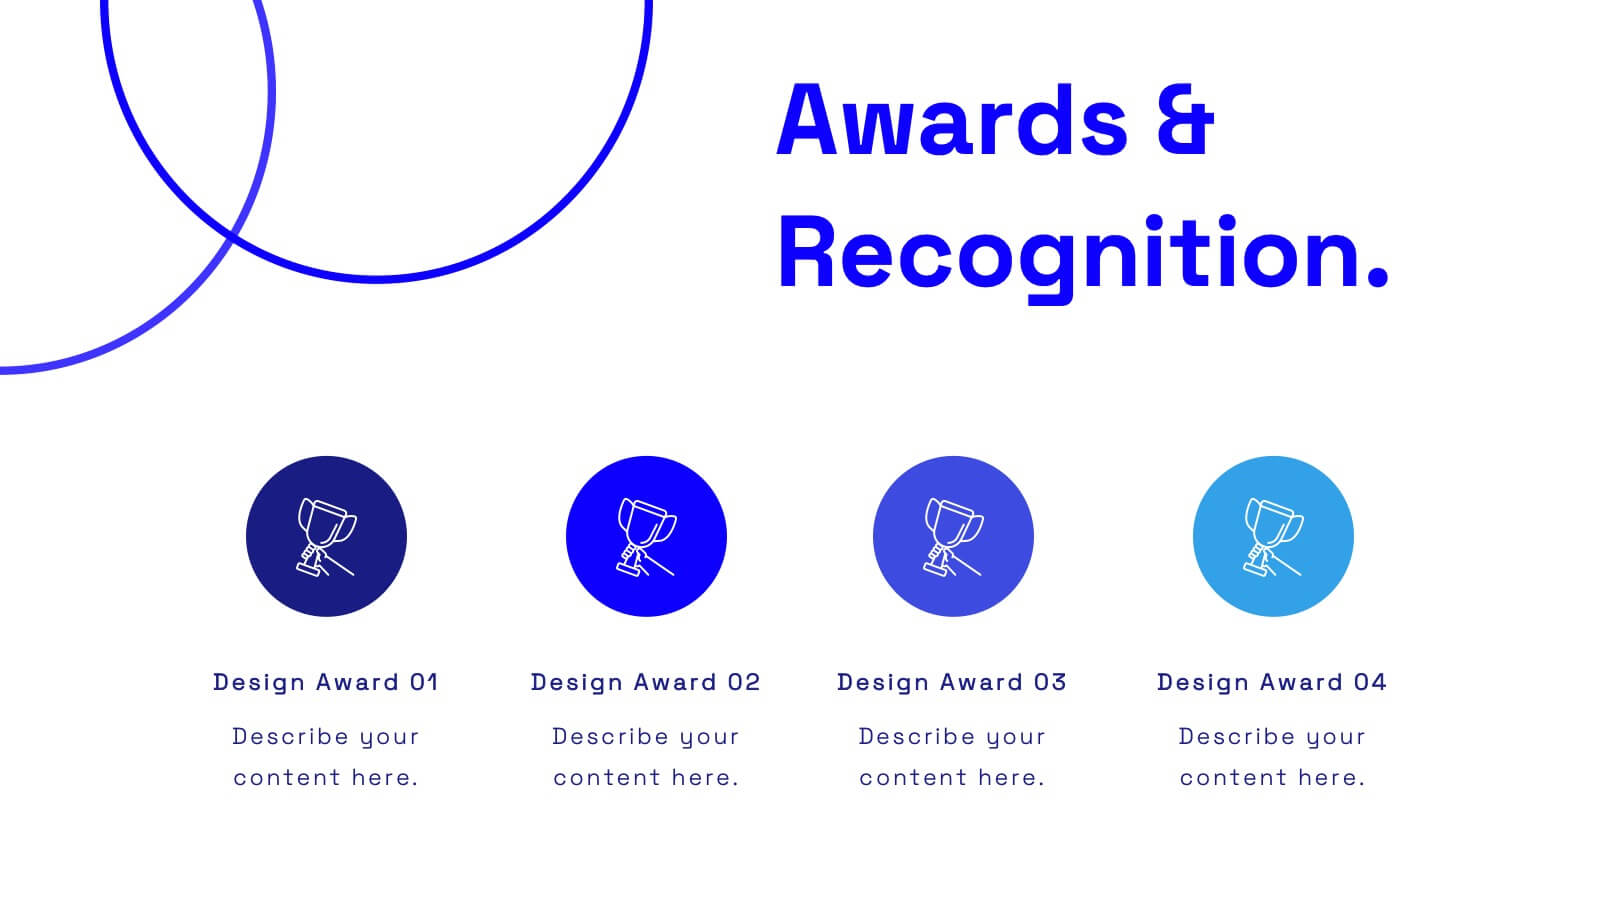
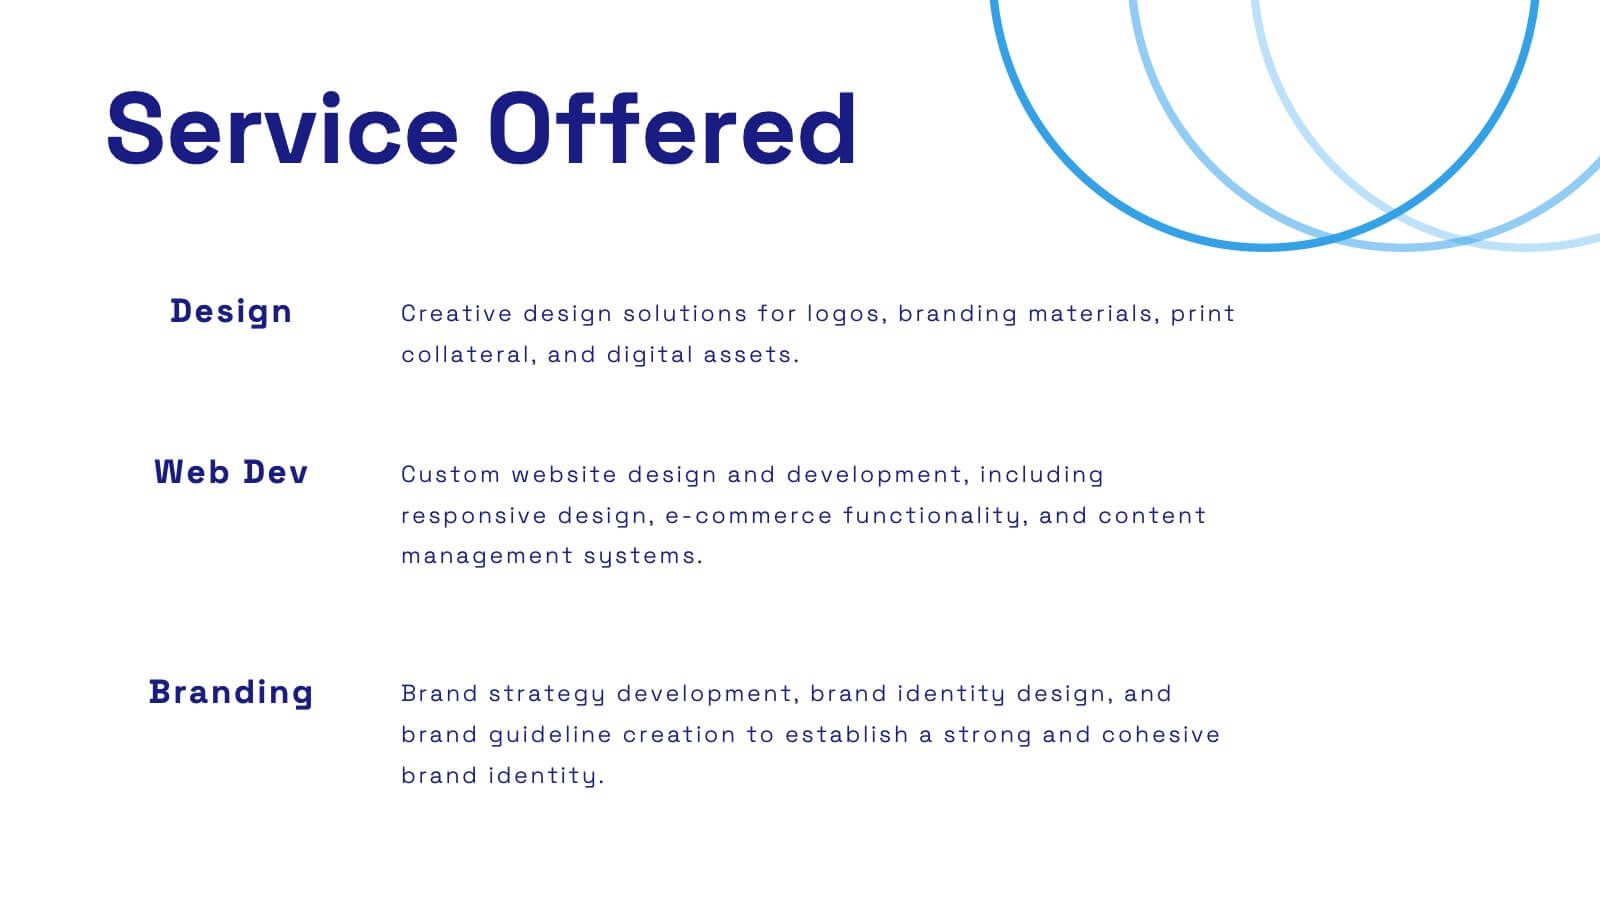
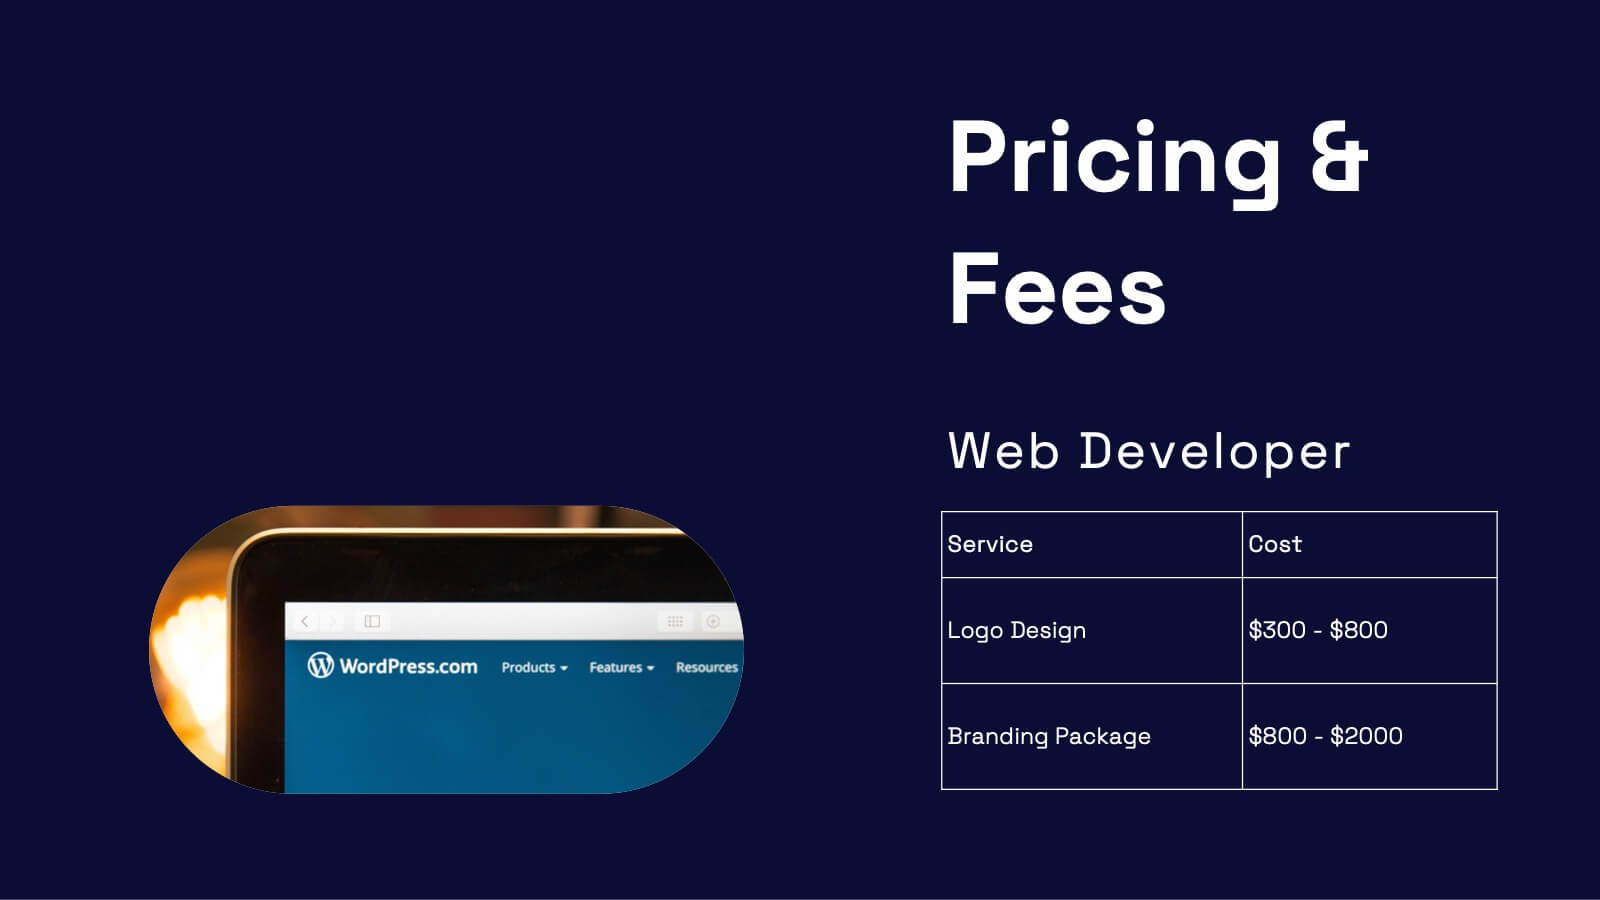
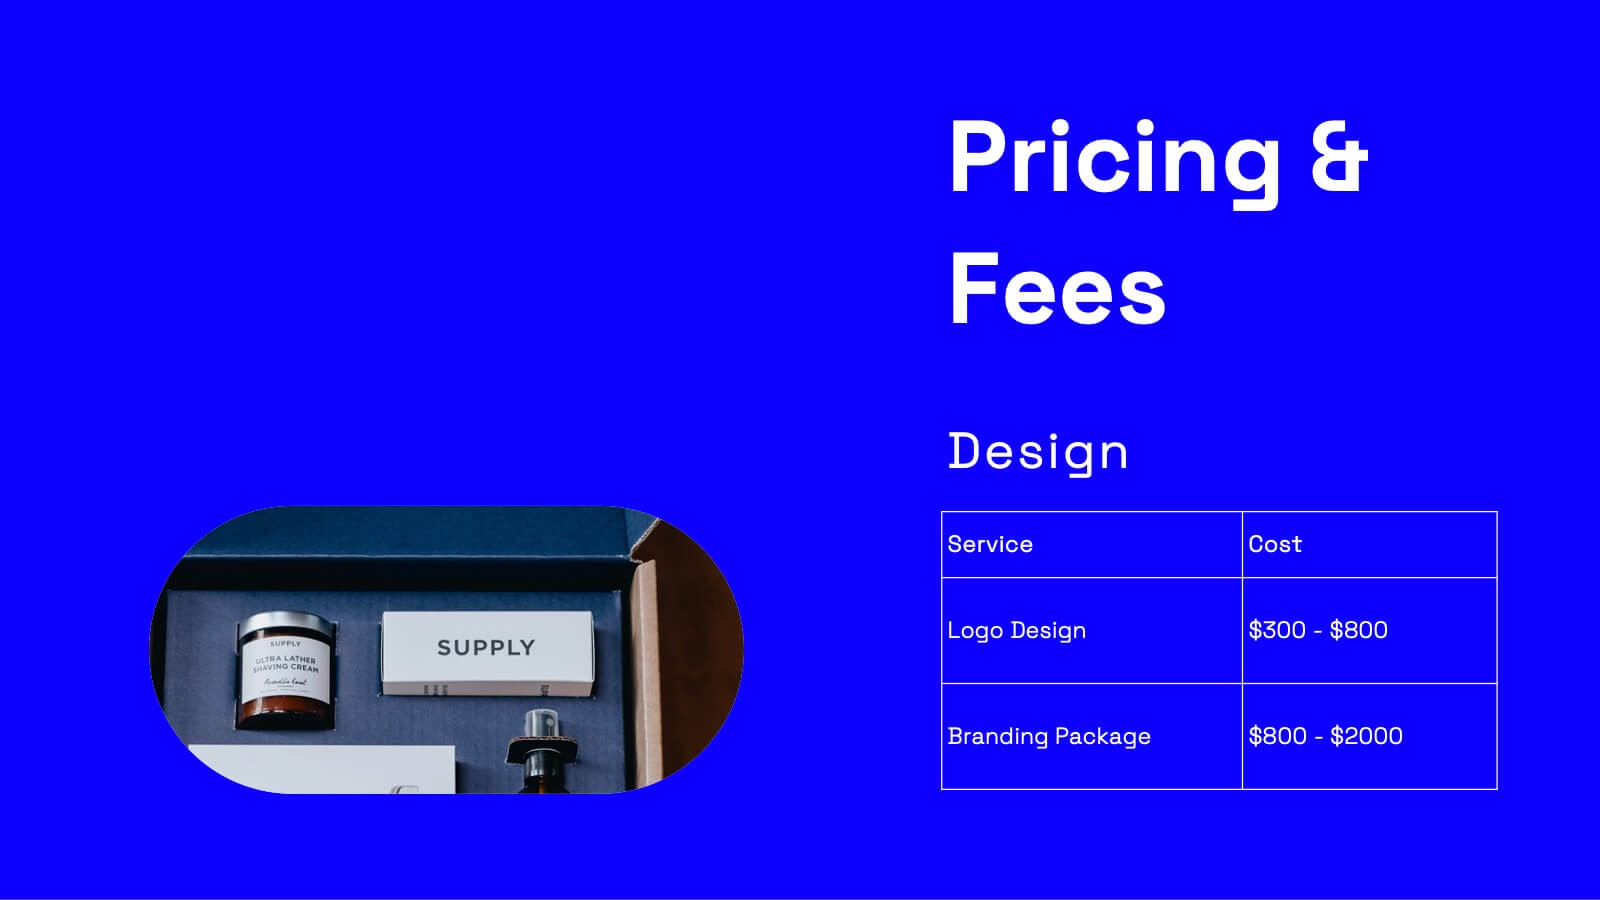
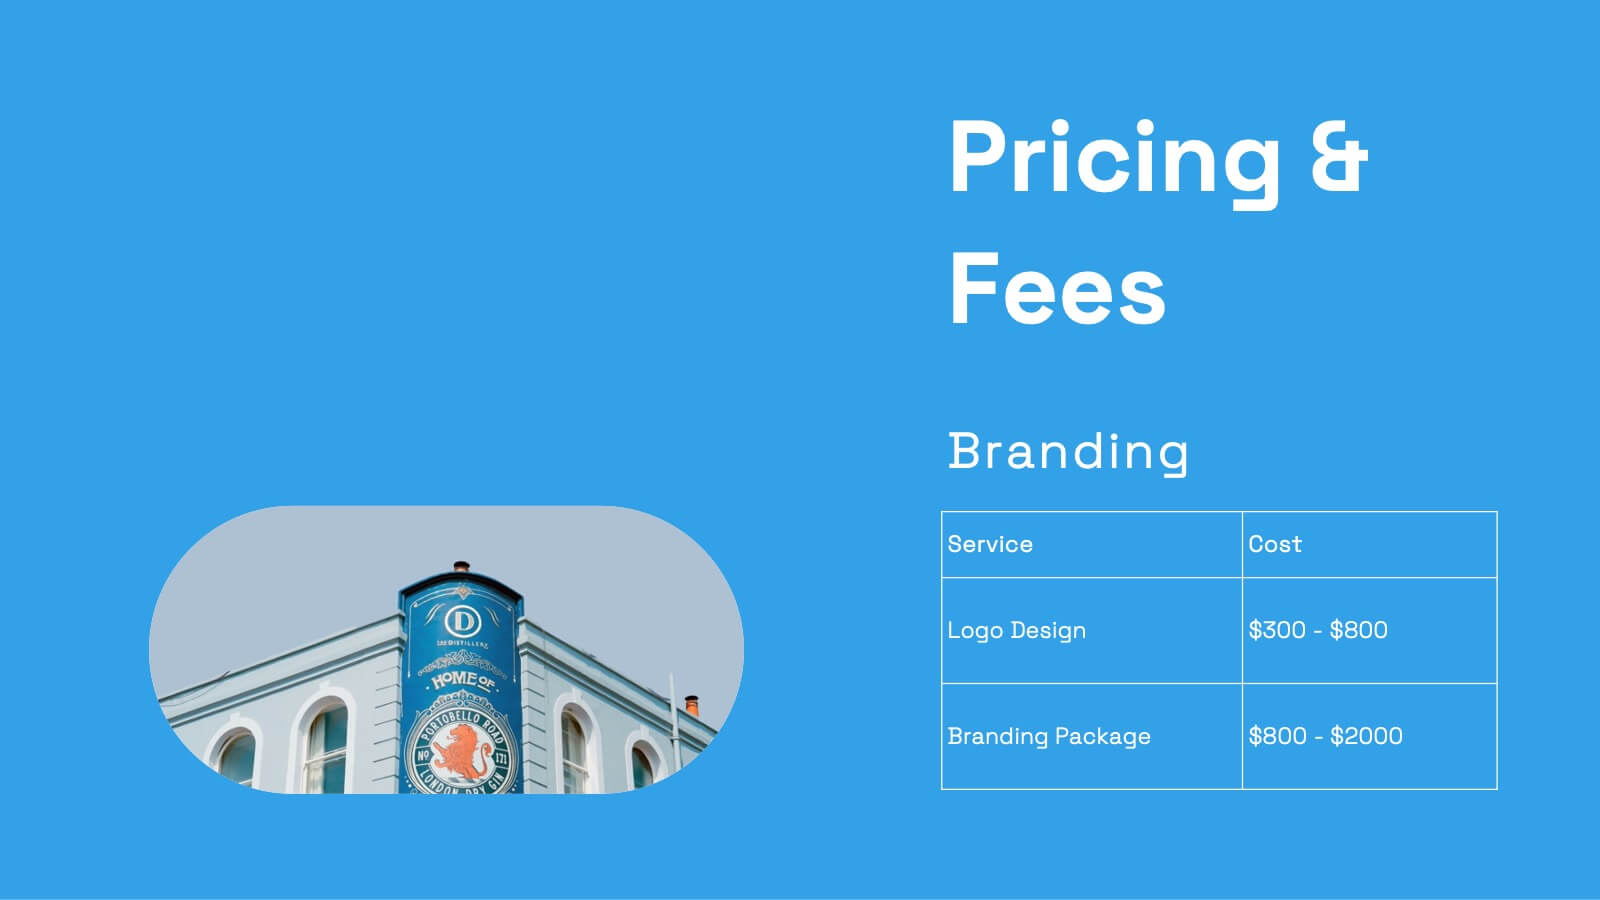
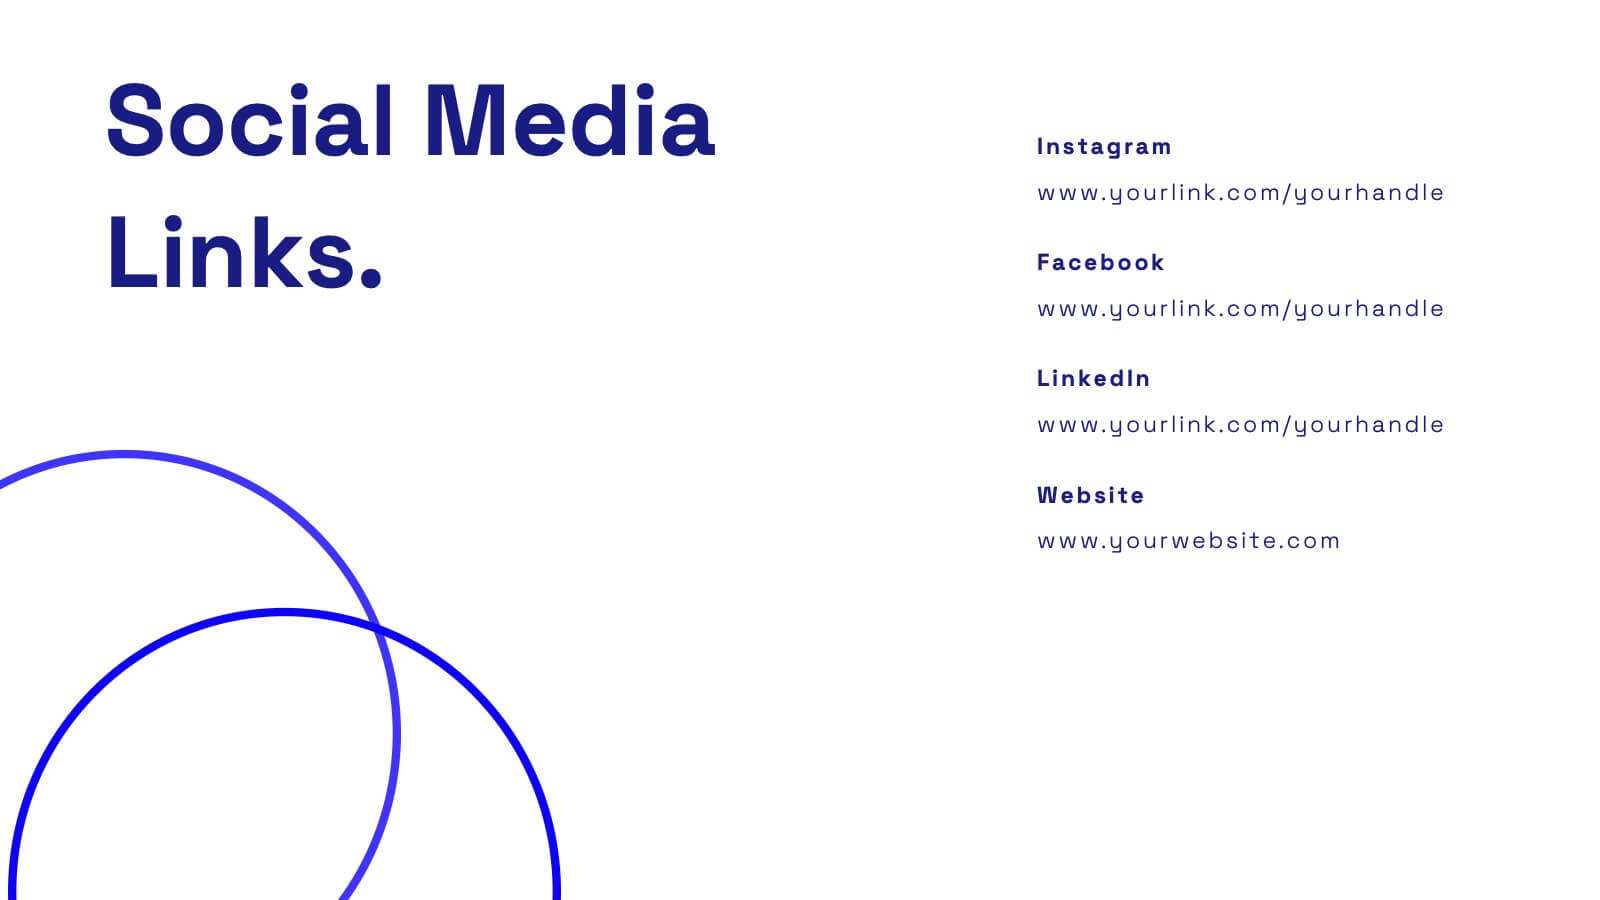
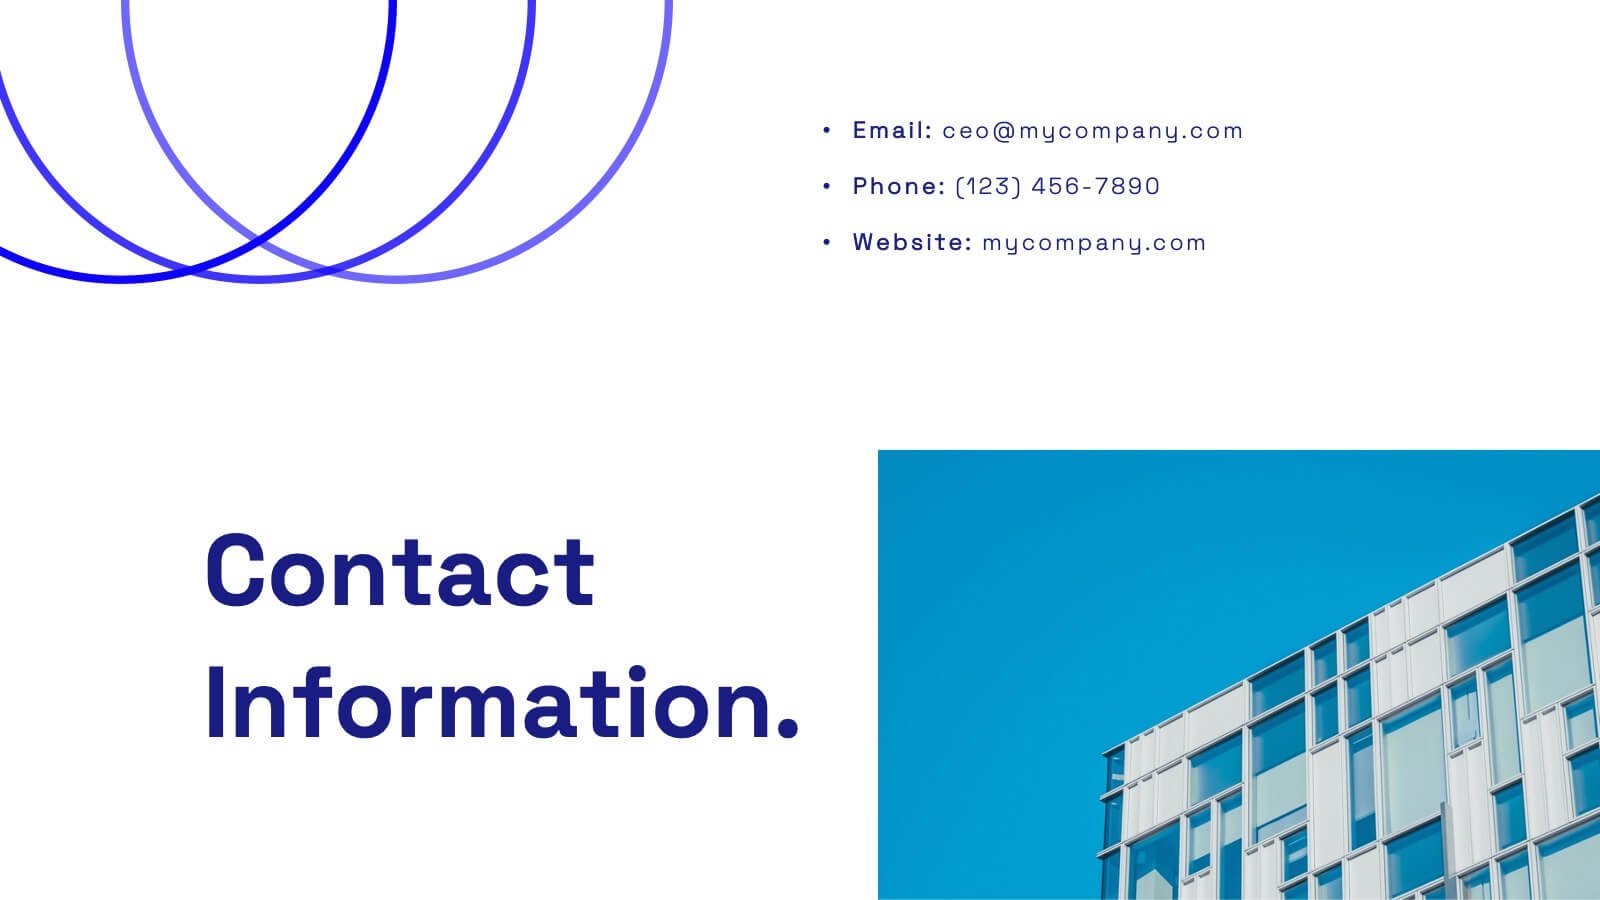
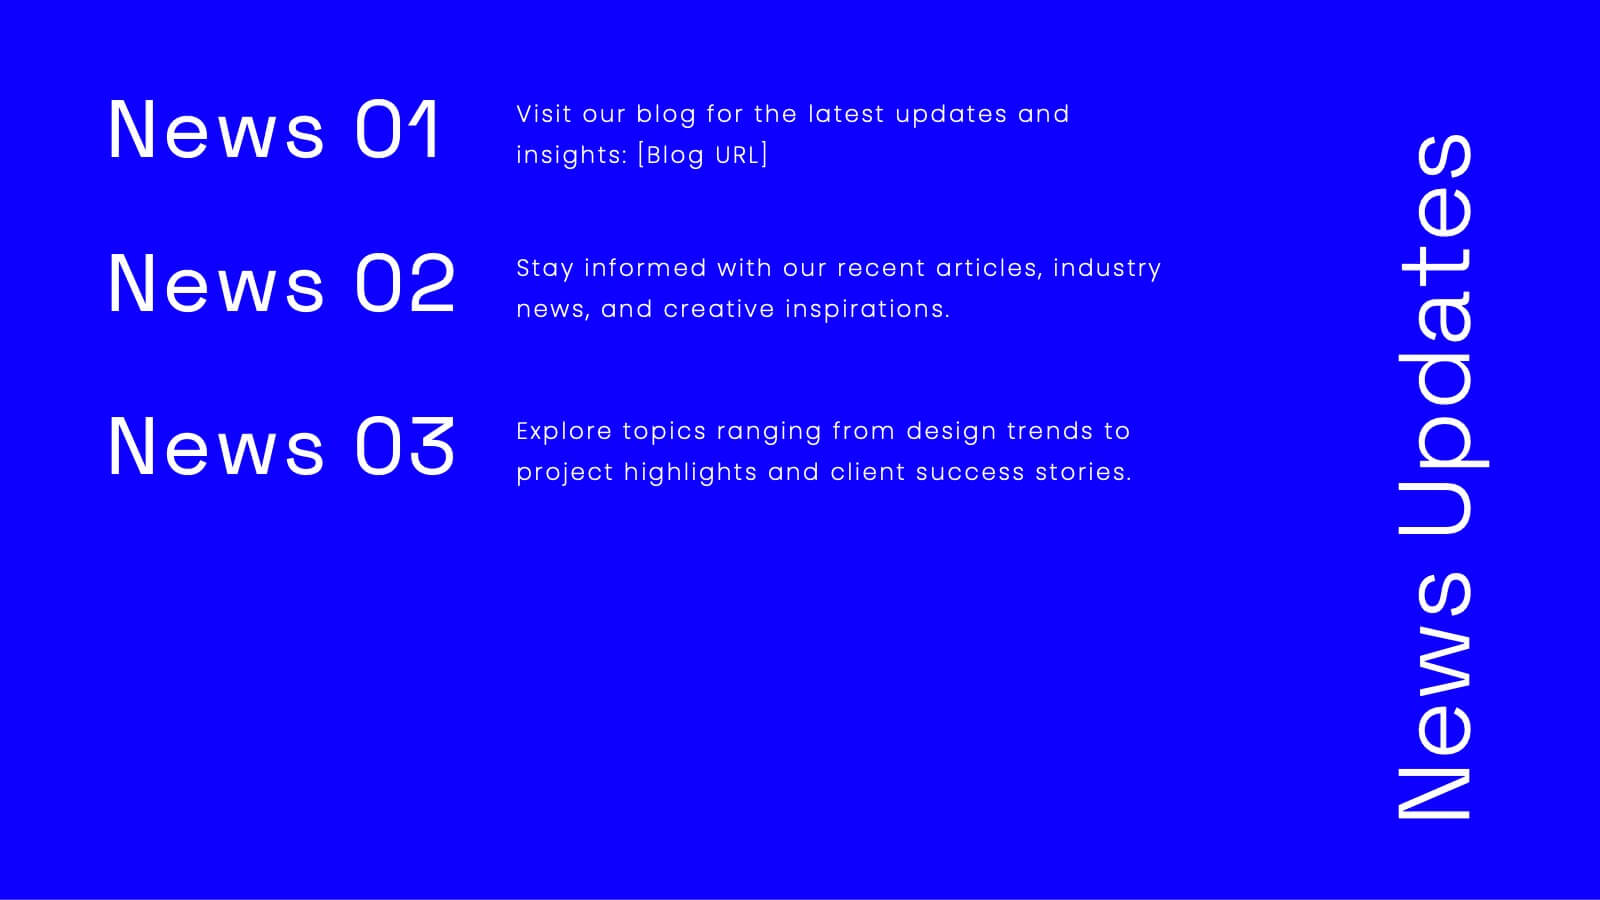
Wanderer Professional Portfolio Showcase Presentation
Showcase your creative work with this sleek, modern portfolio template. Perfect for highlighting your projects, philosophy, and client testimonials, it features a professional design with a dynamic layout. Display your awards, services offered, and pricing clearly to impress potential clients. Compatible with PowerPoint, Keynote, and Google Slides, it ensures seamless presentations on any platform.


5 diapositivas
Historical Event Timeline Overview Presentation
Bring history to life with the Historical Event Timeline Overview Presentation. This visually engaging slide is perfect for educators, researchers, or historians looking to showcase five key milestones in chronological order. Fully editable in Canva, PowerPoint, Keynote, and Google Slides—making it easy to adapt for any historical topic.