


Características


¿Tienes alguna pregunta?
Recomendar


7 diapositivas
Concentric Circles for Data Representation Infographic
Visualize the hierarchy and relationship of your data with our Concentric Circles Infographic, an invaluable tool for data analysts, strategic planners, and educators. This infographic is designed to represent complex data in an organized, easily interpretable format. Our Concentric Circles Infographic offers a multi-layered approach to data presentation, showcasing the interconnection between different levels of information. It's perfect for displaying structures such as organizational hierarchies, market segmentation, or product feature breakdowns. Customize this infographic to highlight core elements and their dependencies or to showcase the ripple effect of central policies on various organizational branches. This SEO-friendly infographic is crafted to make your data stand out and to facilitate a quick understanding of intricate systems. Employ our Concentric Circles Infographic to bring clarity to your data, making it an insightful resource for reports, presentations, and educational materials.


26 diapositivas
Navigating Freelance and Flexible Work Presentation
Take control of your career with this insightful presentation on navigating freelance and flexible work. Covering key topics like client management, productivity strategies, income stability, and remote work tools, this template helps you present a clear roadmap to success. Fully customizable and compatible with PowerPoint, Keynote, and Google Slides for a seamless experience.


5 diapositivas
Types of Photography Infographics
There are various types of photography that cater to different subjects, styles, and purposes. These vertical infographics are designed to serve as a comprehensive guide for individuals interested in exploring different genres and styles of photography. These will allow you to provide an overview of different genres and types of photography. They aim to inform viewers about the diverse fields of photography, allowing them to explore various styles and find their areas of interest. Whether used in photography workshops, educational materials, or creative presentations, this template provides valuable insights and inspiration for individuals passionate about the art of photography.


7 diapositivas
Europe Market Map Infographic
Journey through the intricate tapestry of the European market with our exquisitely crafted map infographic. Set against the refreshing backdrop of white, complemented by the depth of green and blue, our template encapsulates the multifaceted nature of Europe's vibrant market landscape. Augmented with precise infographics, symbolic icons, and country-specific image placeholders, it serves as an insightful guide to Europe's economic terrains. Flawlessly configured for Powerpoint, Keynote, or Google Slides. A priceless asset for business strategists, marketers, or any organization tapping into the European market. Navigate with insight; let every slide be a doorway to European market opportunities.


20 diapositivas
Oracle Startup Strategy Presentation
Launch your startup strategy with this sleek template! Perfect for detailing your mission, vision, business model, and market analysis. Ideal for entrepreneurs aiming to impress investors and stakeholders. Compatible with PowerPoint, Keynote, and Google Slides, this template ensures your startup strategy is professional, clear, and compelling. Secure your path to success!


20 diapositivas
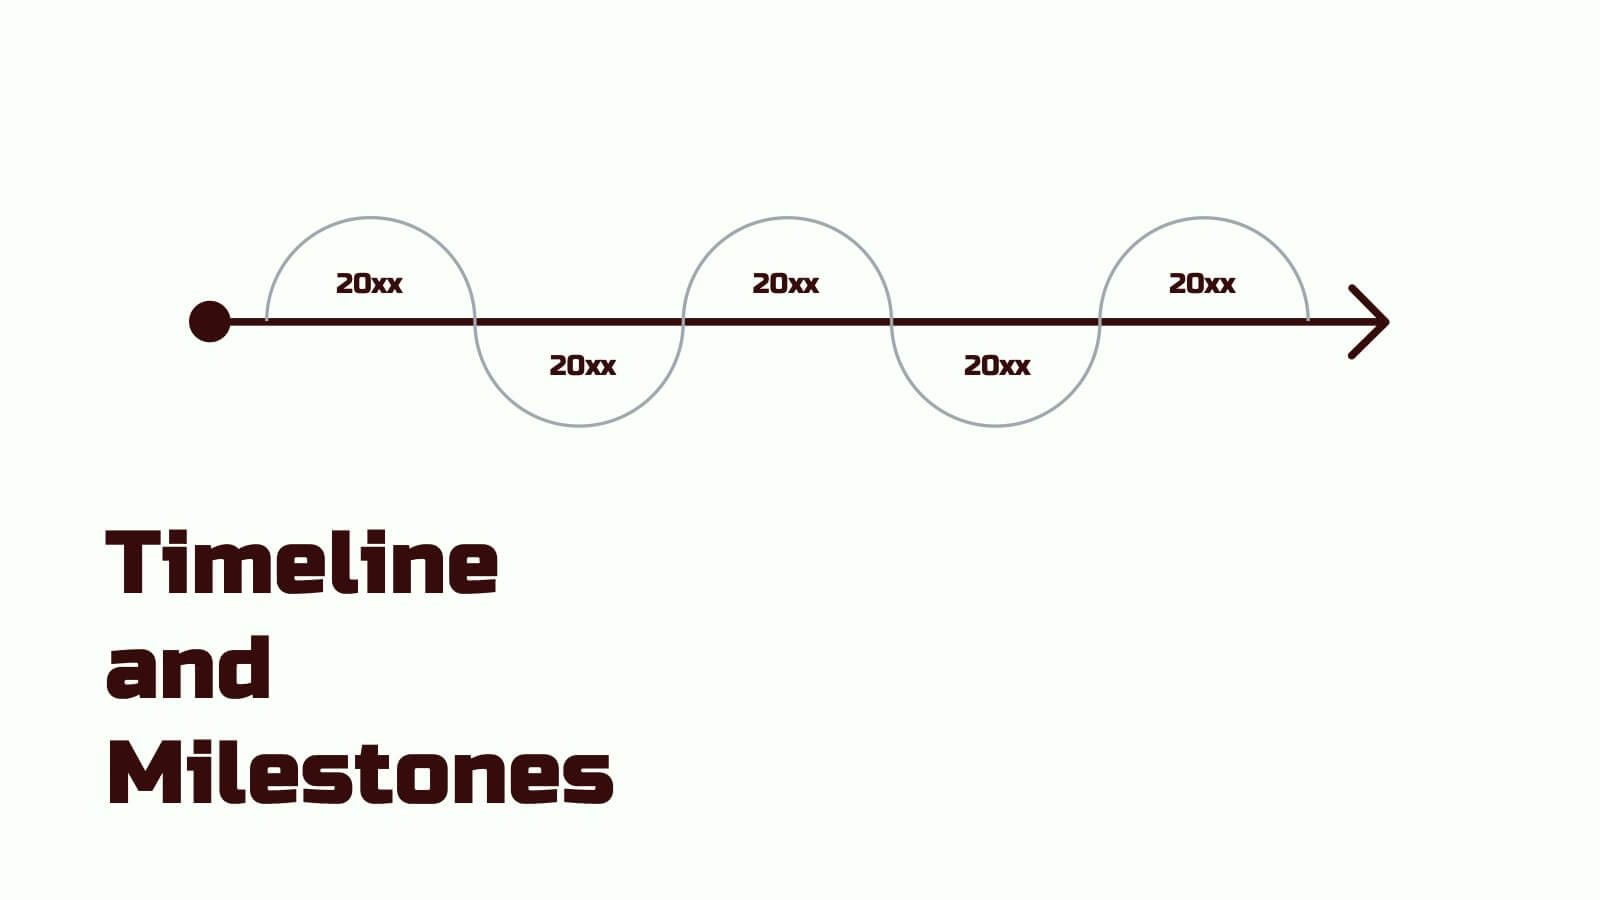
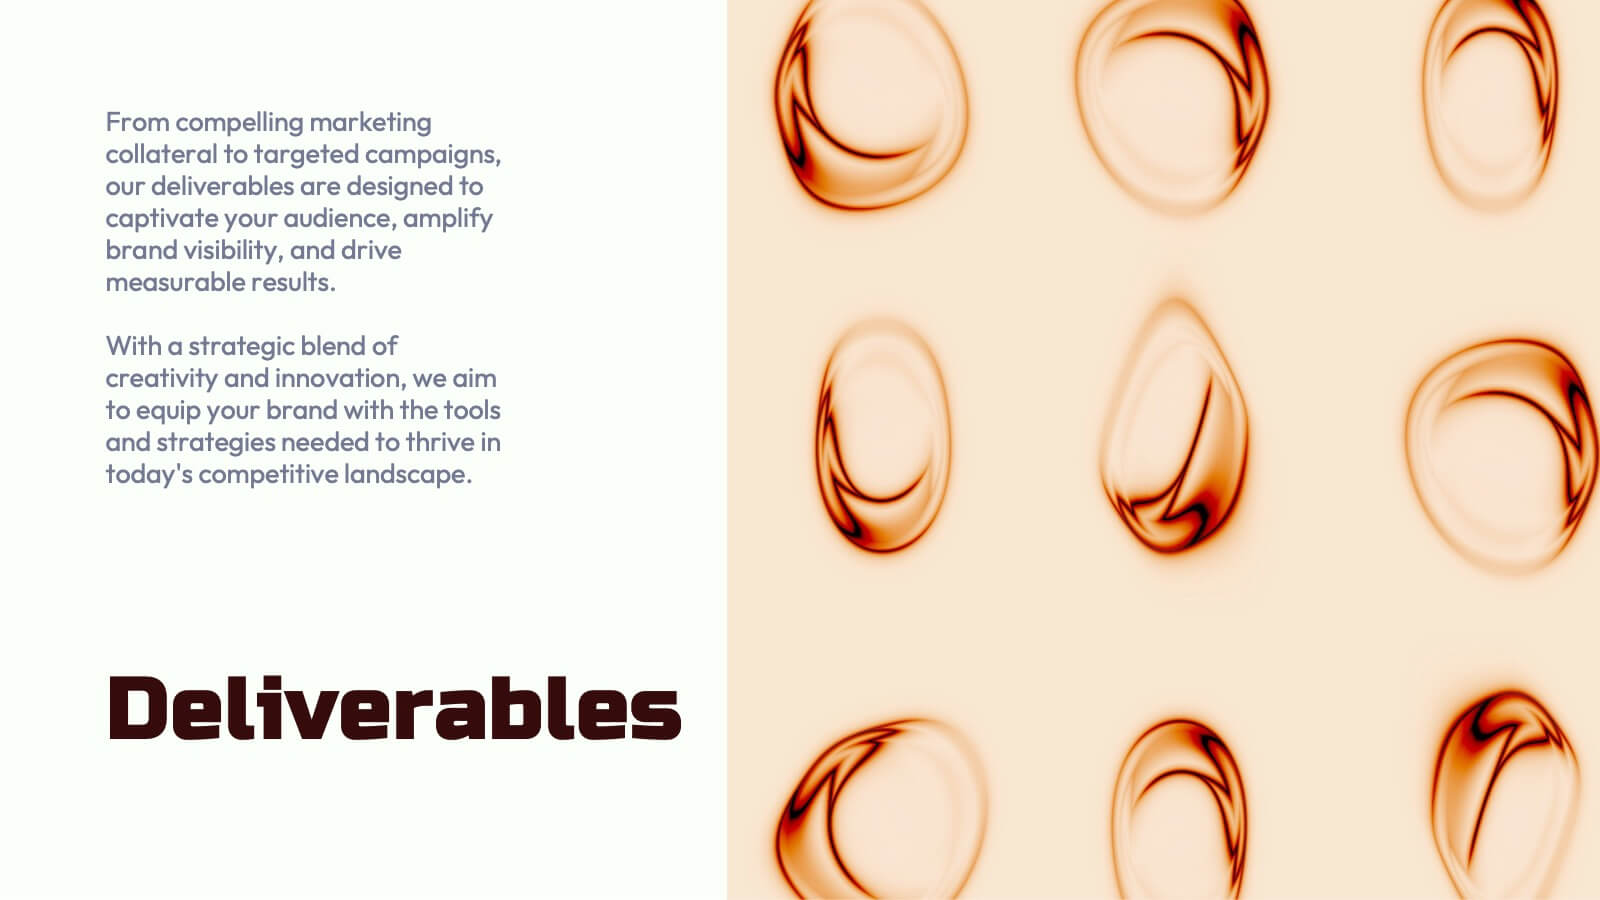
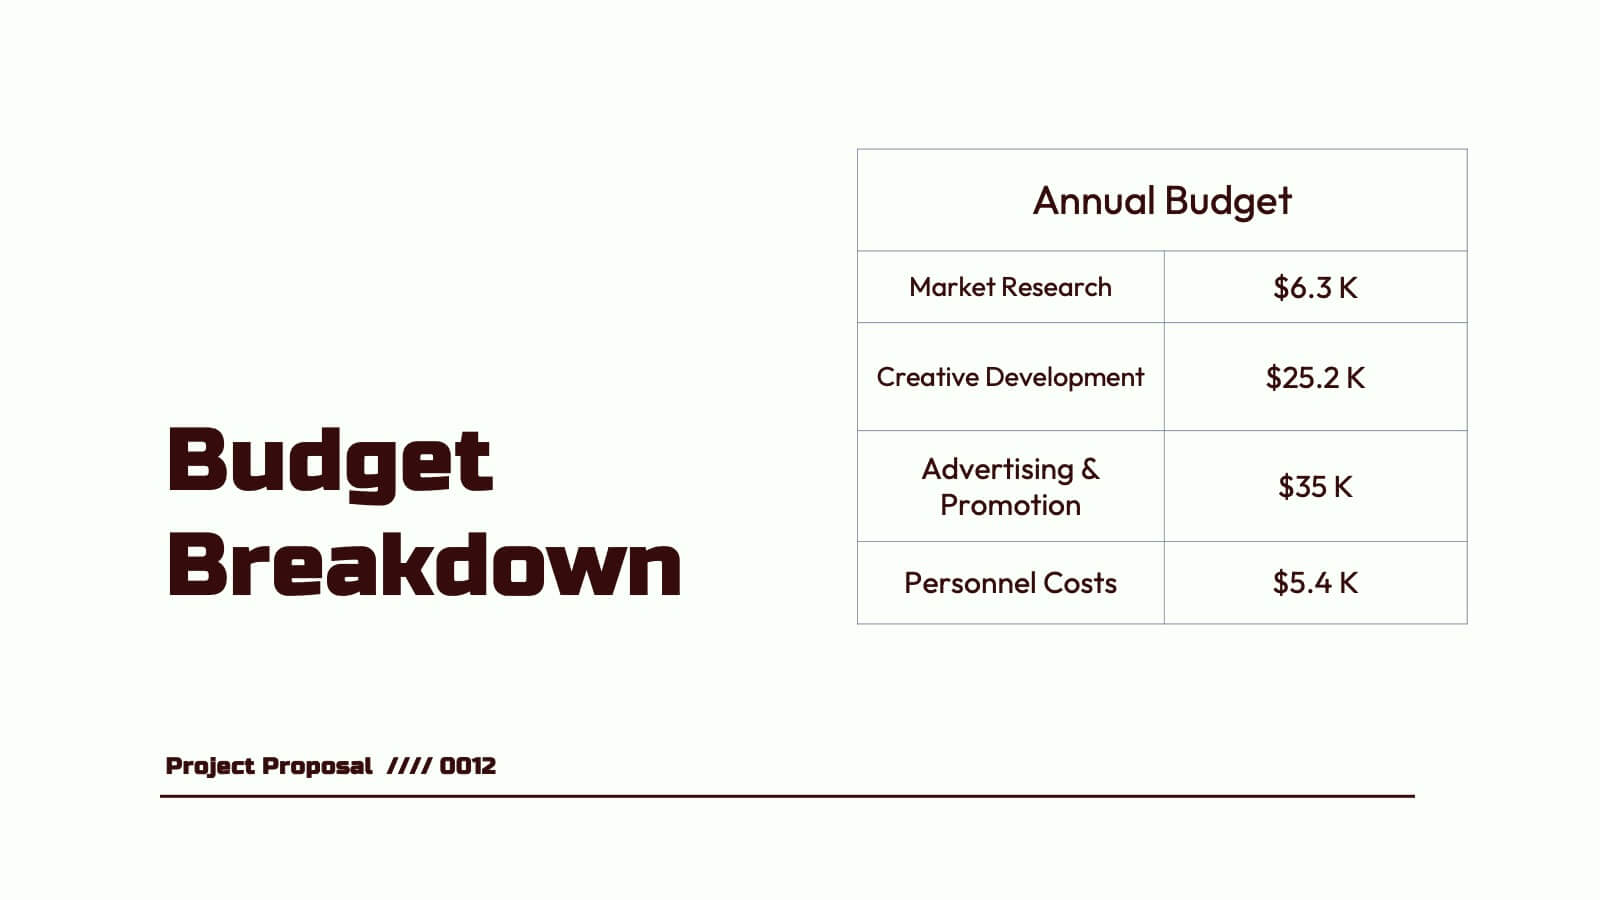
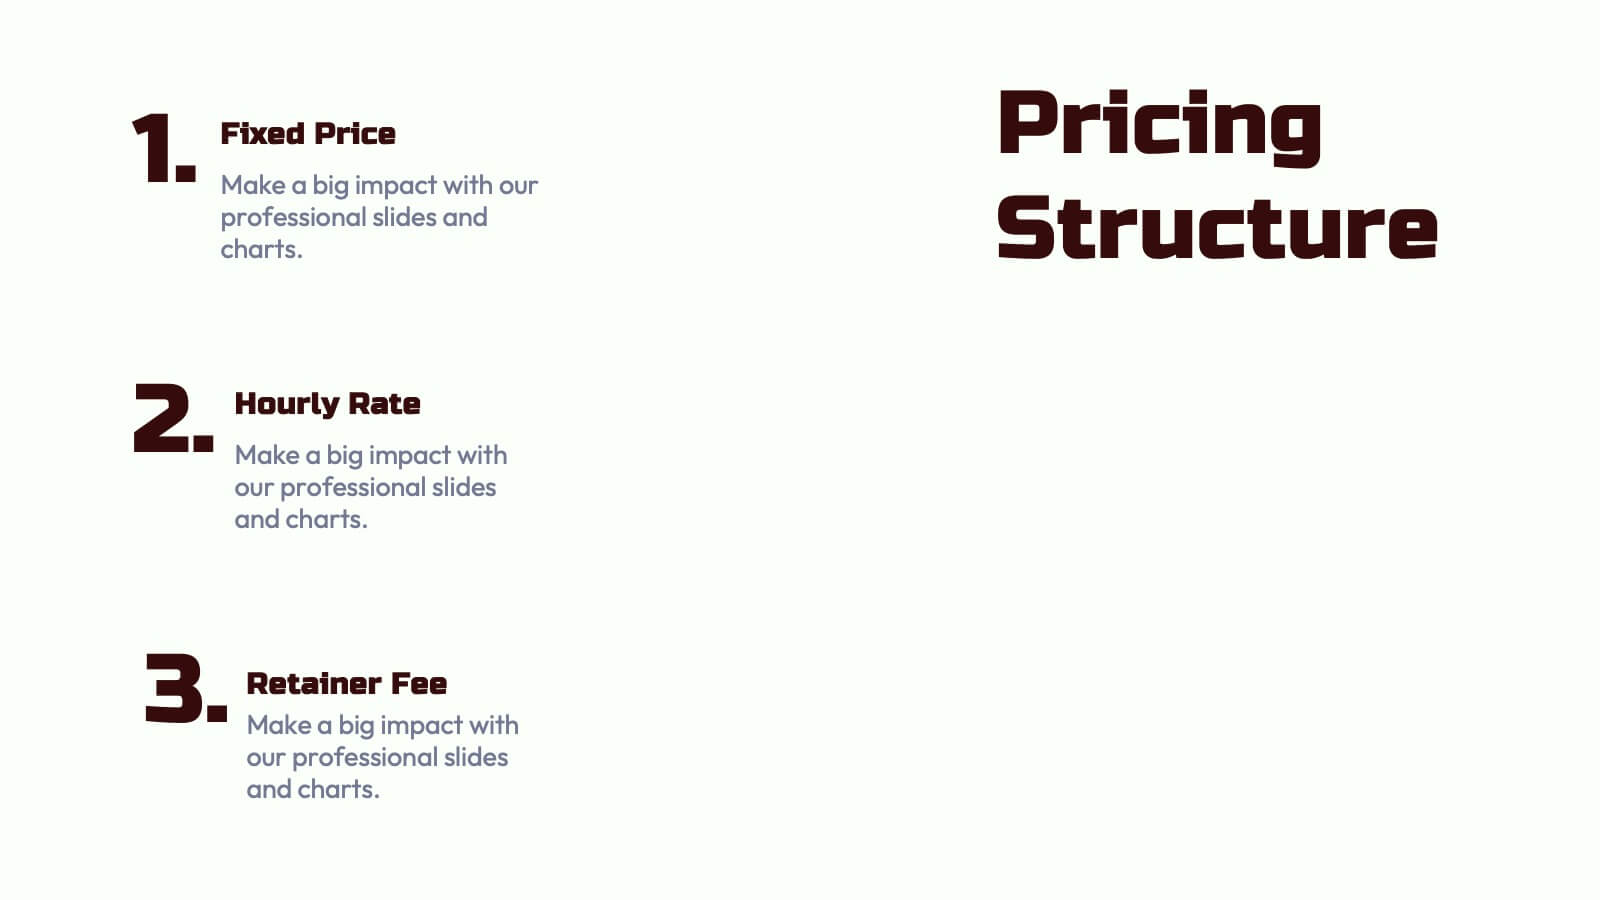
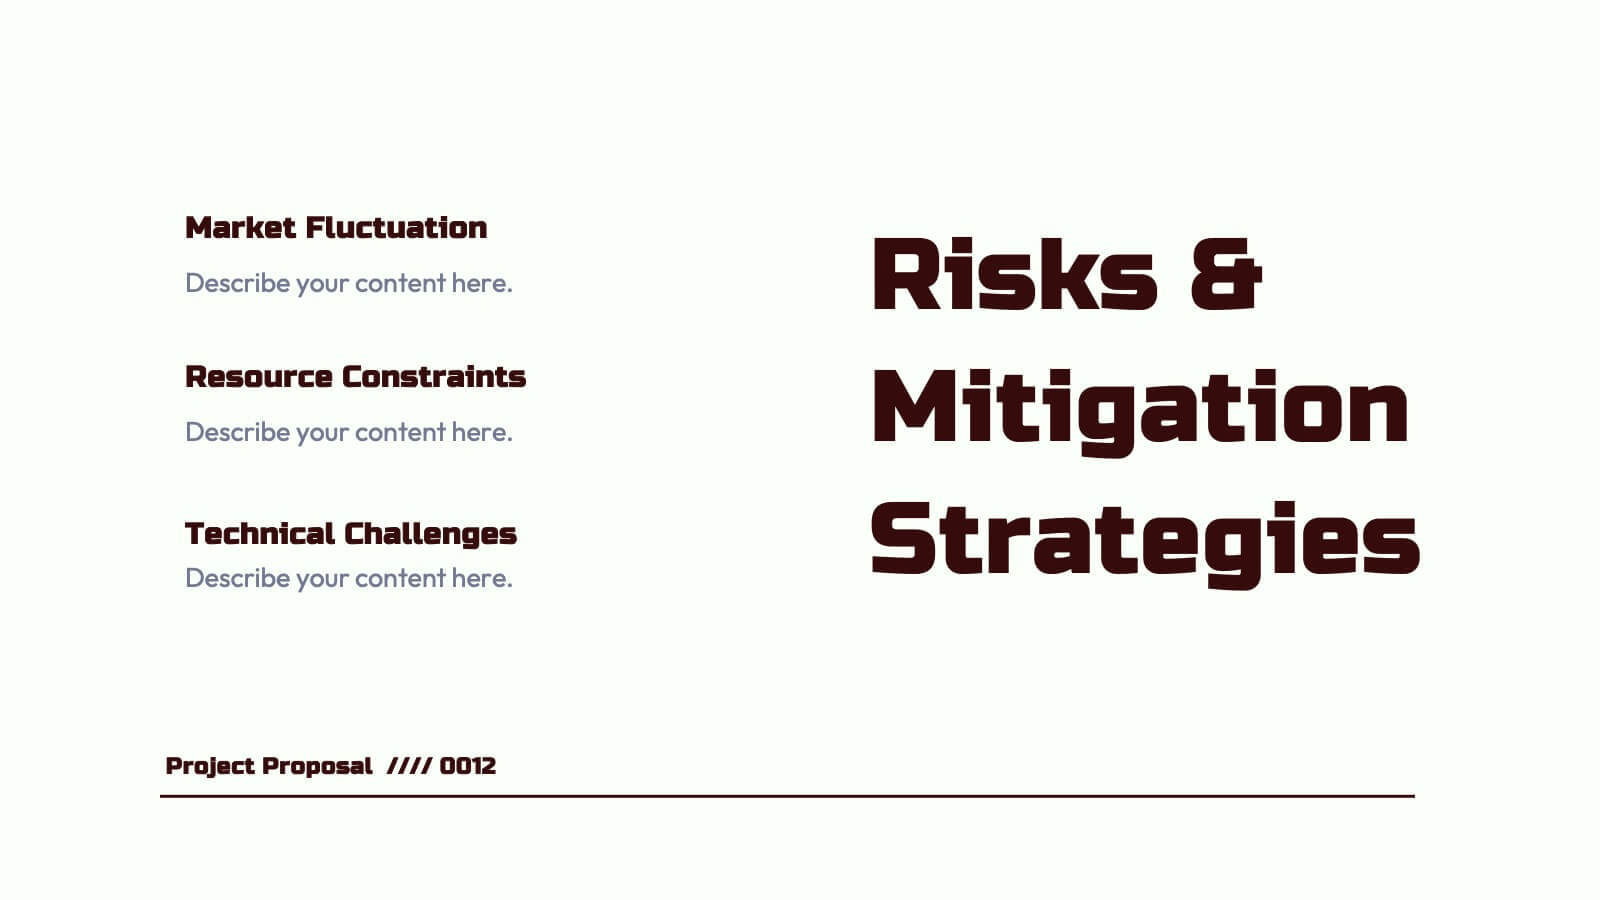
Nebula Project Proposal Presentation
Create a compelling project proposal with this structured, professional template! It includes sections for problem statements, proposed solutions, goals, timelines, and pricing. Perfect for organizing your ideas clearly and professionally, it's fully customizable and compatible with PowerPoint, Keynote, and Google Slides. This template makes it easy to present your proposals effectively and win clients.


10 diapositivas
Simplified Workflow in Four Clear Steps Presentation
Guide your audience through structured execution with the Simplified Workflow in Four Clear Steps Presentation. This vertical step diagram visually organizes key stages for task progression, planning, or implementation workflows. Each block is labeled, color-coded, and easy to customize—making your message direct and engaging. Fully editable in PowerPoint, Keynote, Google Slides, and Canva.


4 diapositivas
Healthcare Procedure and Diagnosis Presentation
Simplify medical communication with the Healthcare Procedure and Diagnosis Presentation. Featuring clean visuals like syringes, hearts, and med kits, this layout is ideal for outlining treatment stages, clinical processes, or patient care steps. Perfect for hospitals, clinics, or healthcare startups. Fully editable in PowerPoint, Keynote, Google Slides, and Canva.


8 diapositivas
Achievements and Goals Milestone
Illustrate your team's journey with this visually engaging milestone roadmap. Featuring a step-by-step block design with space for five key accomplishments, it's perfect for goal tracking, progress reviews, or roadmap presentations. Fully editable in PowerPoint, Keynote, and Google Slides.


6 diapositivas
Mental Health Infographics
The "Mental Health" infographic template, suitable for PowerPoint, Keynote, and Google Slides, is an essential resource for healthcare professionals, educators, and mental health advocates. This sensitive and informative template is designed to communicate important aspects of mental health in a compassionate and accessible manner. This template covers critical topics such as mental health awareness, coping strategies, and support resources. It is structured to facilitate discussions on mental well-being, making it an invaluable tool for educational presentations, awareness campaigns, and support group discussions. Featuring a calming and empathetic design, the template uses a soothing color scheme with pastel shades of light blue, green, and lavender. This creates a serene and understanding atmosphere that is supportive of mental health topics. Whether used in a clinical setting, classroom, or community workshop, this template ensures that information about mental health is presented in a sensitive, informative, and visually appealing way.


5 diapositivas
Business Choices and Outcomes Analysis Presentation
Visually connect key business options with their potential results using the Business Choices and Outcomes Analysis slide. Featuring a clean puzzle-style layout, this template is perfect for illustrating decision pathways, pros and cons, or strategy alternatives. Ideal for consultants, managers, and analysts. Easily customizable in PowerPoint, Keynote, and Google Slides.


28 diapositivas
Pitch Deck Entrepreneur's Canvas Presentation
Sharpen your business presentation with this Pitch Deck template. It covers essential areas such as market opportunity, business model, and competitive analysis, designed for startups and entrepreneurs. Fully customizable and compatible with PowerPoint, Keynote, and Google Slides, it's ideal for impressing investors and partners with your business vision.


6 diapositivas
Workflow and Operations Flow Presentation
Optimize your operations with the Workflow and Operations Flow presentation. This structured and visually appealing template helps you map out workflows, streamline processes, and enhance team coordination. Perfect for project managers, business analysts, and operational leaders, these fully editable slides allow you to visualize key steps and dependencies with ease. Compatible with PowerPoint, Keynote, and Google Slides.


5 diapositivas
Movies & Film Market Infographics
Step into the spotlight with our movies & film market infographics, designed to orchestrate your data into a cinematic experience. In the enchanting hues of blue and purple, this template captures the essence of the big screen, offering a vertical layout that resonates with the the film industry. It's a tool for film marketers, and cinema analysts, providing a platform to depict trends, and reviews with a touch of Hollywood style. The set includes captivating graphics, themed icons, and adaptable image placeholders, all curated to help you direct your audience's attention to key insights in the ever-evolving realm of movies and entertainment.


5 diapositivas
Education Department Infographics
The Education Department, also known as the department of education or ministry of education, is a government or administrative body responsible for overseeing and regulating education within a particular jurisdiction. This infographic template is designed to showcase the key aspects and functions of an education department within an organization or institution. It provides an informative overview of the department's goals, initiatives, programs, and achievements. This is the perfect template for educational institutions, government departments, or organizations with an education-focused division. Compatible with Powerpoint, Keynote, and Google Slides.


5 diapositivas
Nonprofit Organizations Infographics
Nonprofit Organizations are organizations that are established to pursue a particular social cause or provide a service that benefits the public, rather than generate a profit. These infographic templates are designed to visually present information about nonprofit organizations. They feature bright, colorful and engaging designs with icons and illustrations that represent different aspects of nonprofit organizations, such as fundraising, volunteers, and social impact. The template includes customizable graphs and text boxes to allow users to easily present data about nonprofits, including their structure, goals, impact, and funding sources.


7 diapositivas
Timeline Logistics Infographic
A timeline infographic is a visual representation of the history of your company, product or service. This infographic template is the perfect way to show off your knowledge of a subject while also making it easy for your audience to digest all the information you've presented on hand. This infographic can be used to show the growth of your business. It’s also a great way to show the growth of your career. This template is simple and easy to use, but it’s also very powerful. You can add any icons you want and customize any text on the infographic. Compatible with Powerpoint, Keynote, and Google Slides. This is perfect for any occasion!