


Características


¿Tienes alguna pregunta?
Recomendar


4 diapositivas
Stakeholder Analysis Mapping Strategy Presentation
Turn complex stakeholder relationships into clear, actionable insights with this dynamic and modern quadrant design. Ideal for visualizing influence, communication strategies, and engagement priorities, it helps teams build stronger collaboration frameworks. Fully editable and compatible with PowerPoint, Keynote, and Google Slides for effortless professional use.


5 diapositivas
5G Wireless Technology Infographics
5G technology refers to the fifth generation of wireless communication technology. These infographic templates are designed to showcase the key features, benefits, and impact of 5G technology. These are perfect for technology enthusiasts, professionals, educators, or anyone looking to explain the concept and advancements of 5G. Educate and inform your audiences about the concept, benefits, and applications of 5G technology with these infographics. It is fully customizable and has attention-grabbing design elements making it easy to create a compelling presentation about the advancements and potential of 5G technology.


20 diapositivas
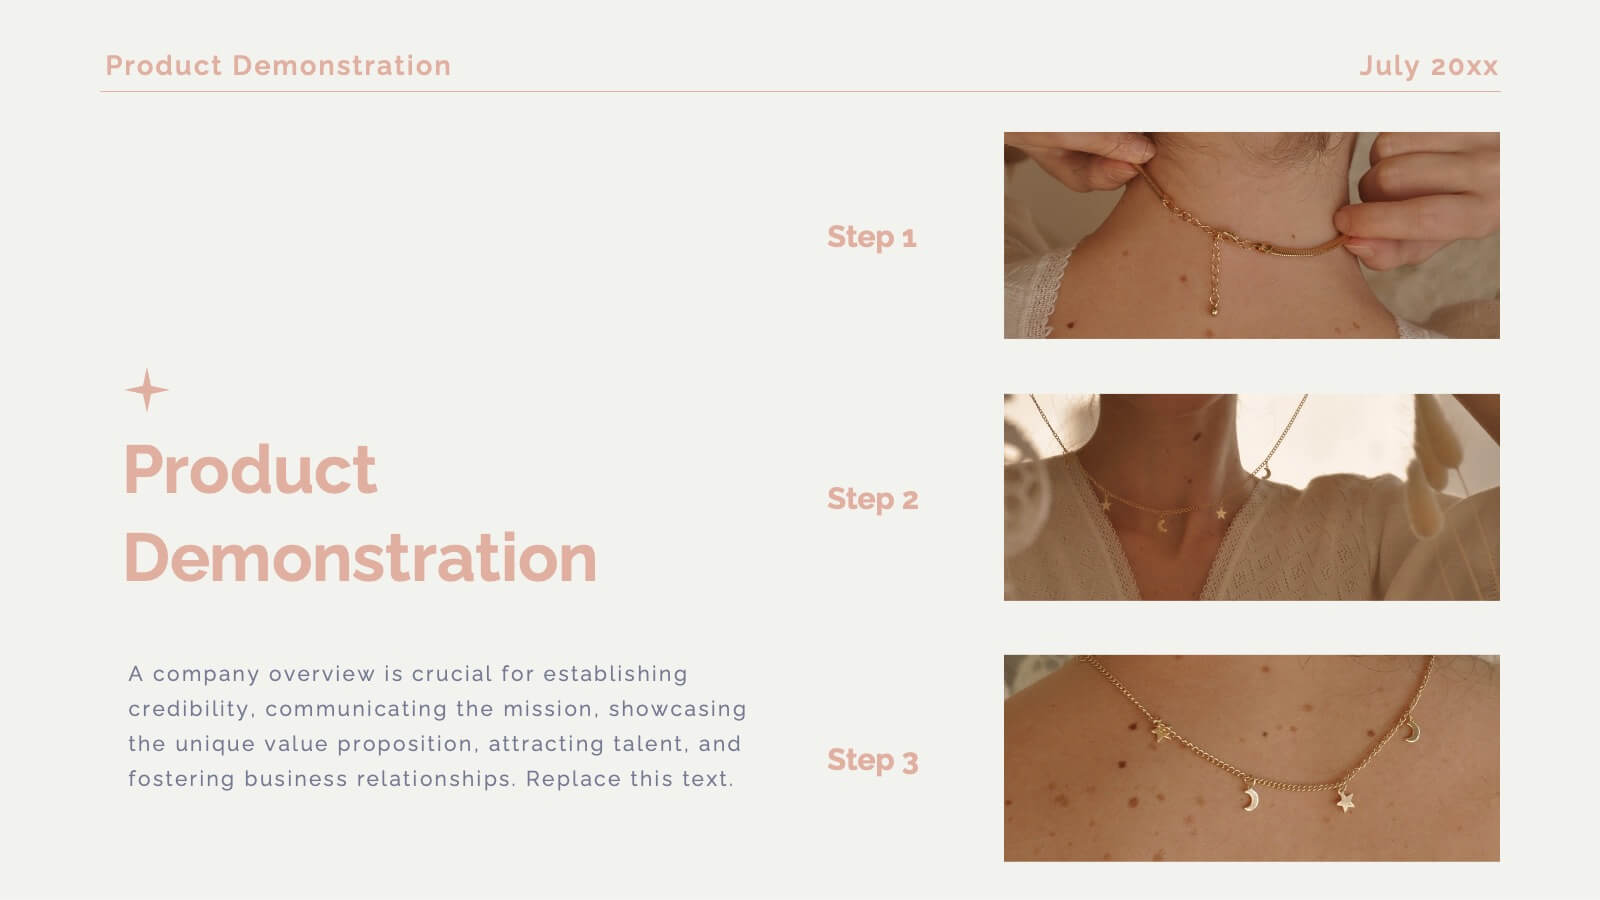
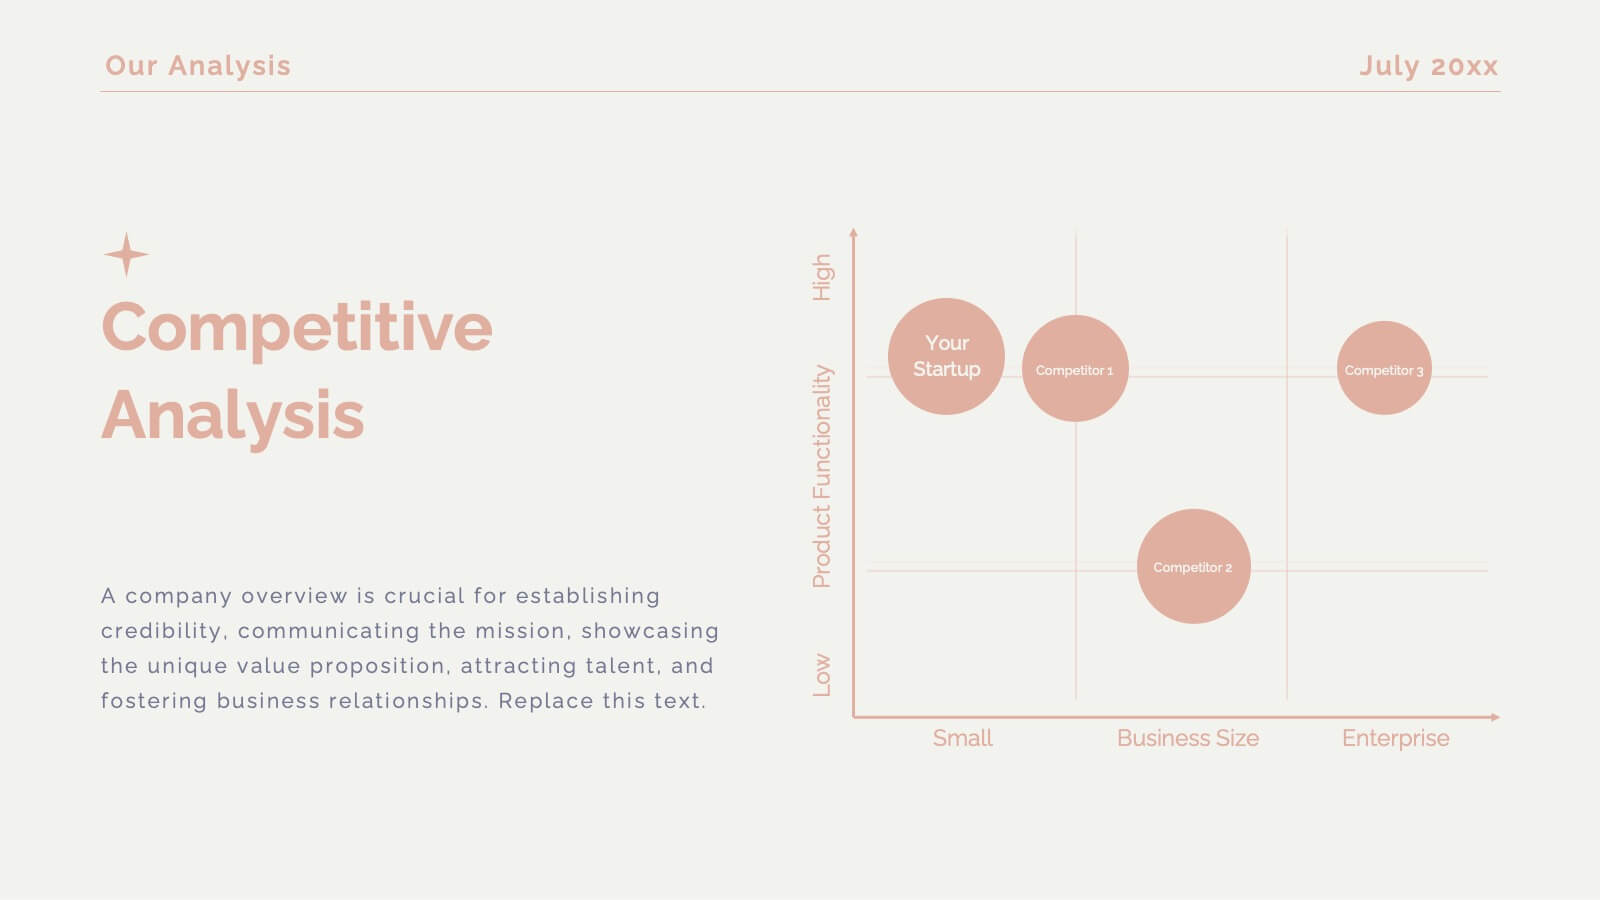
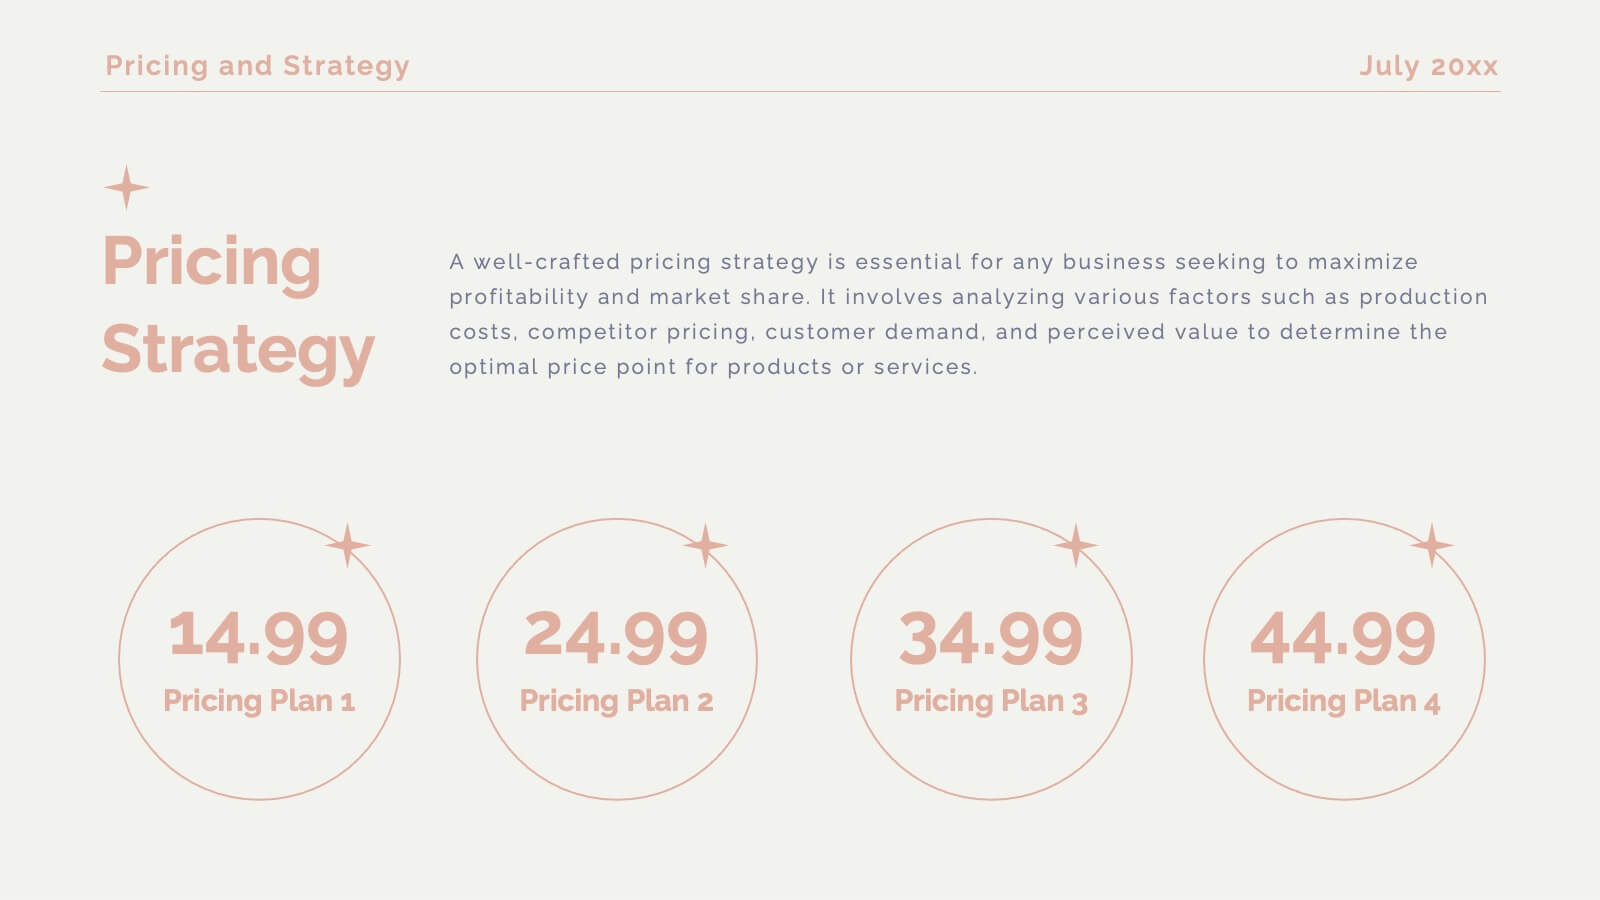
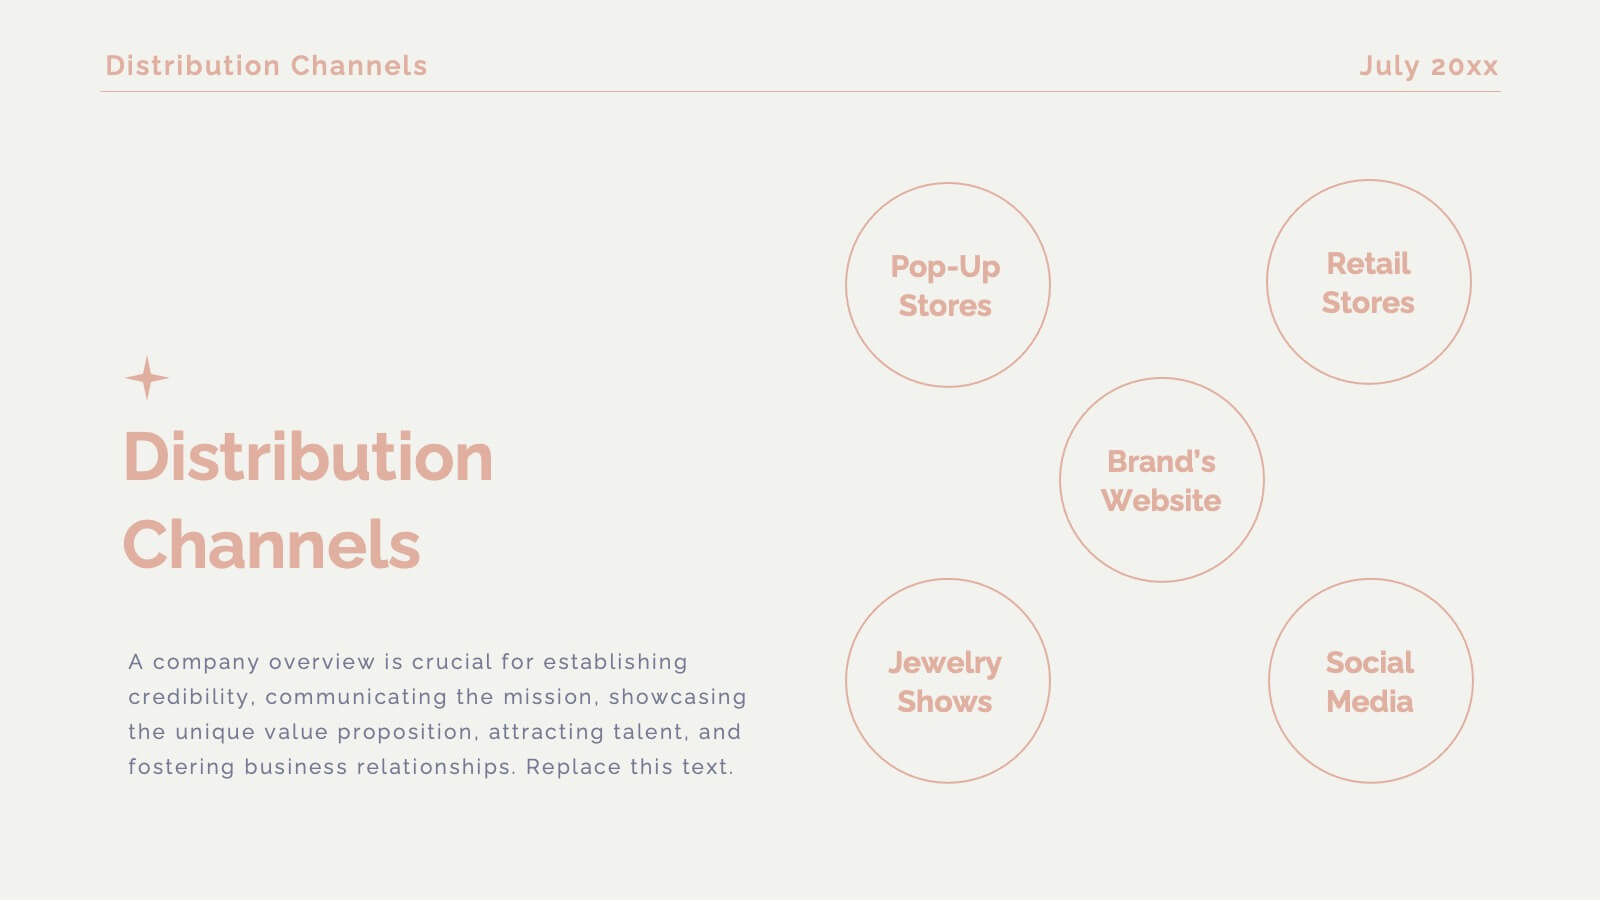
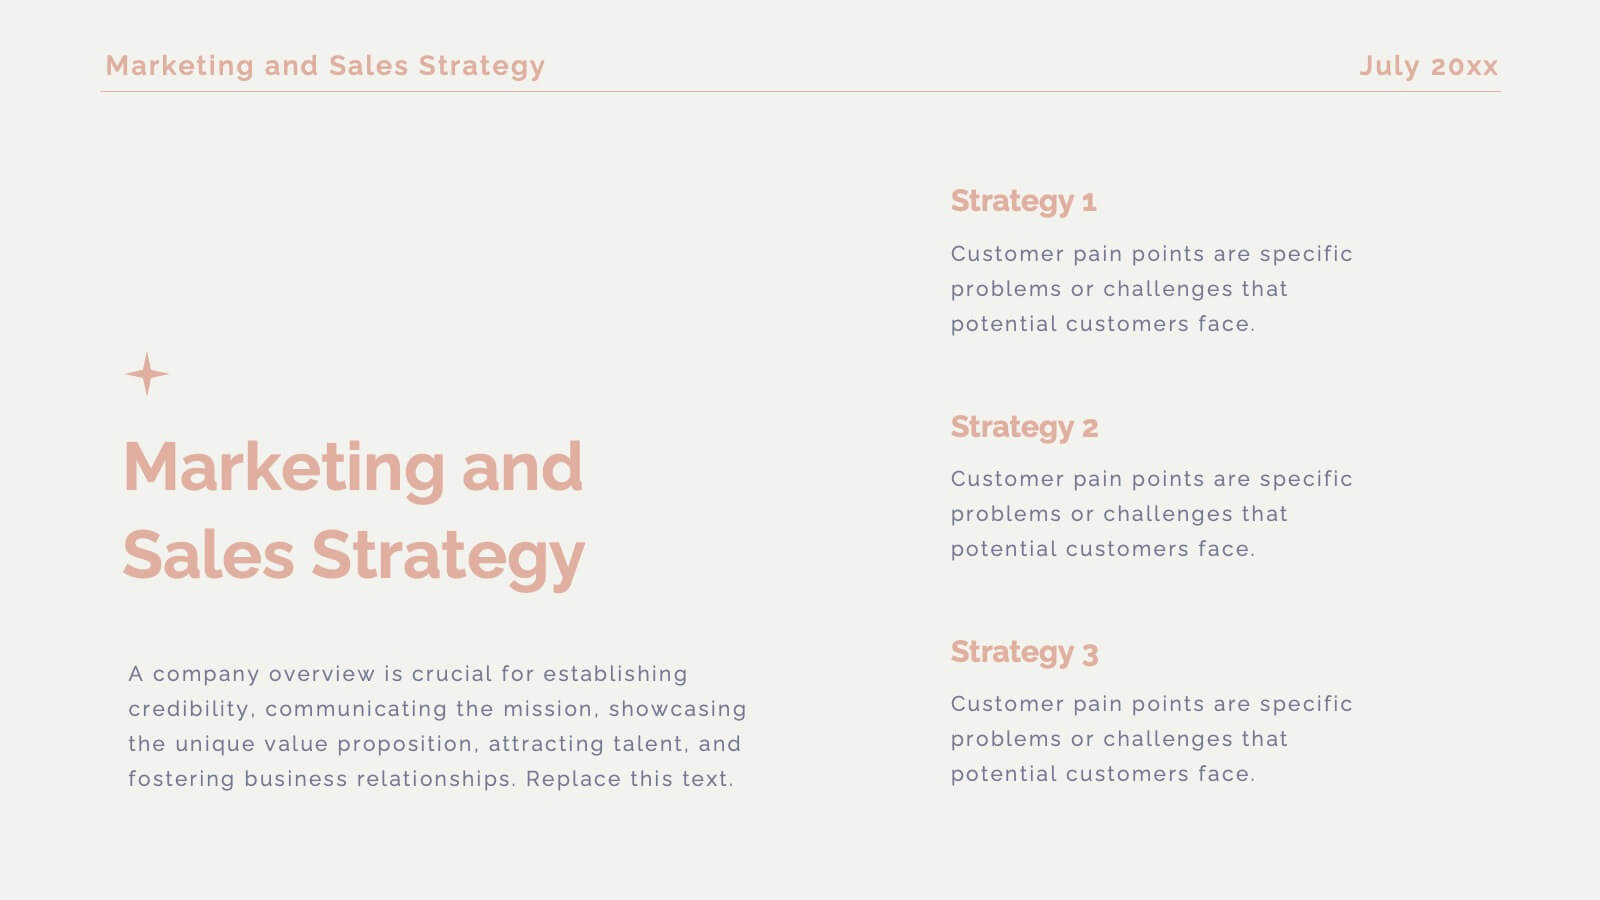
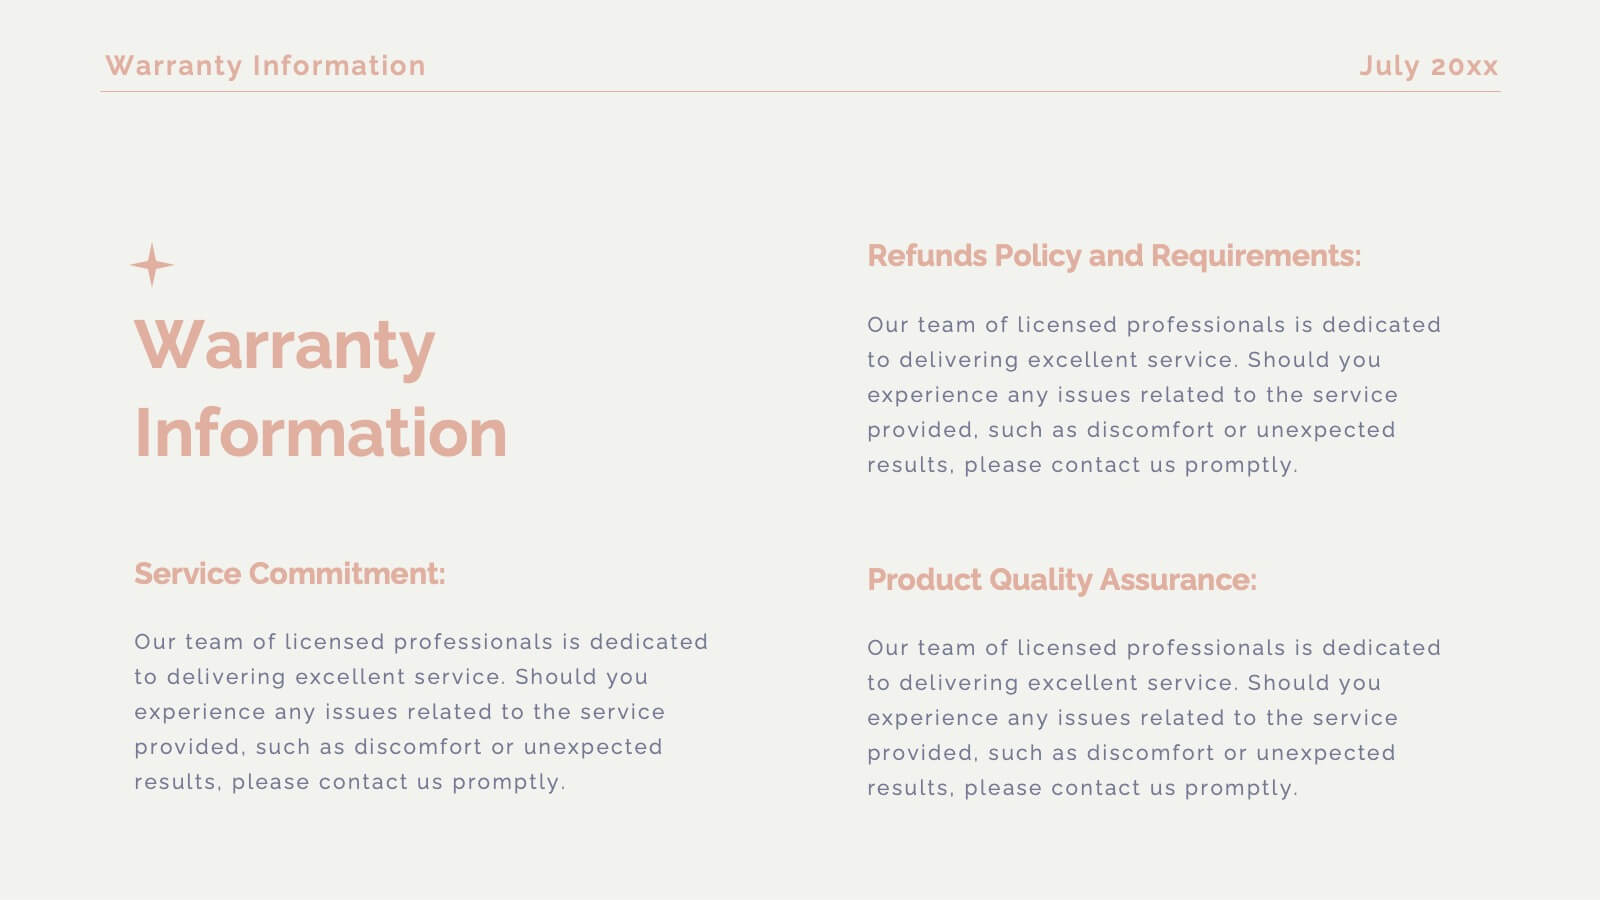
Legacy Product Launch Presentation
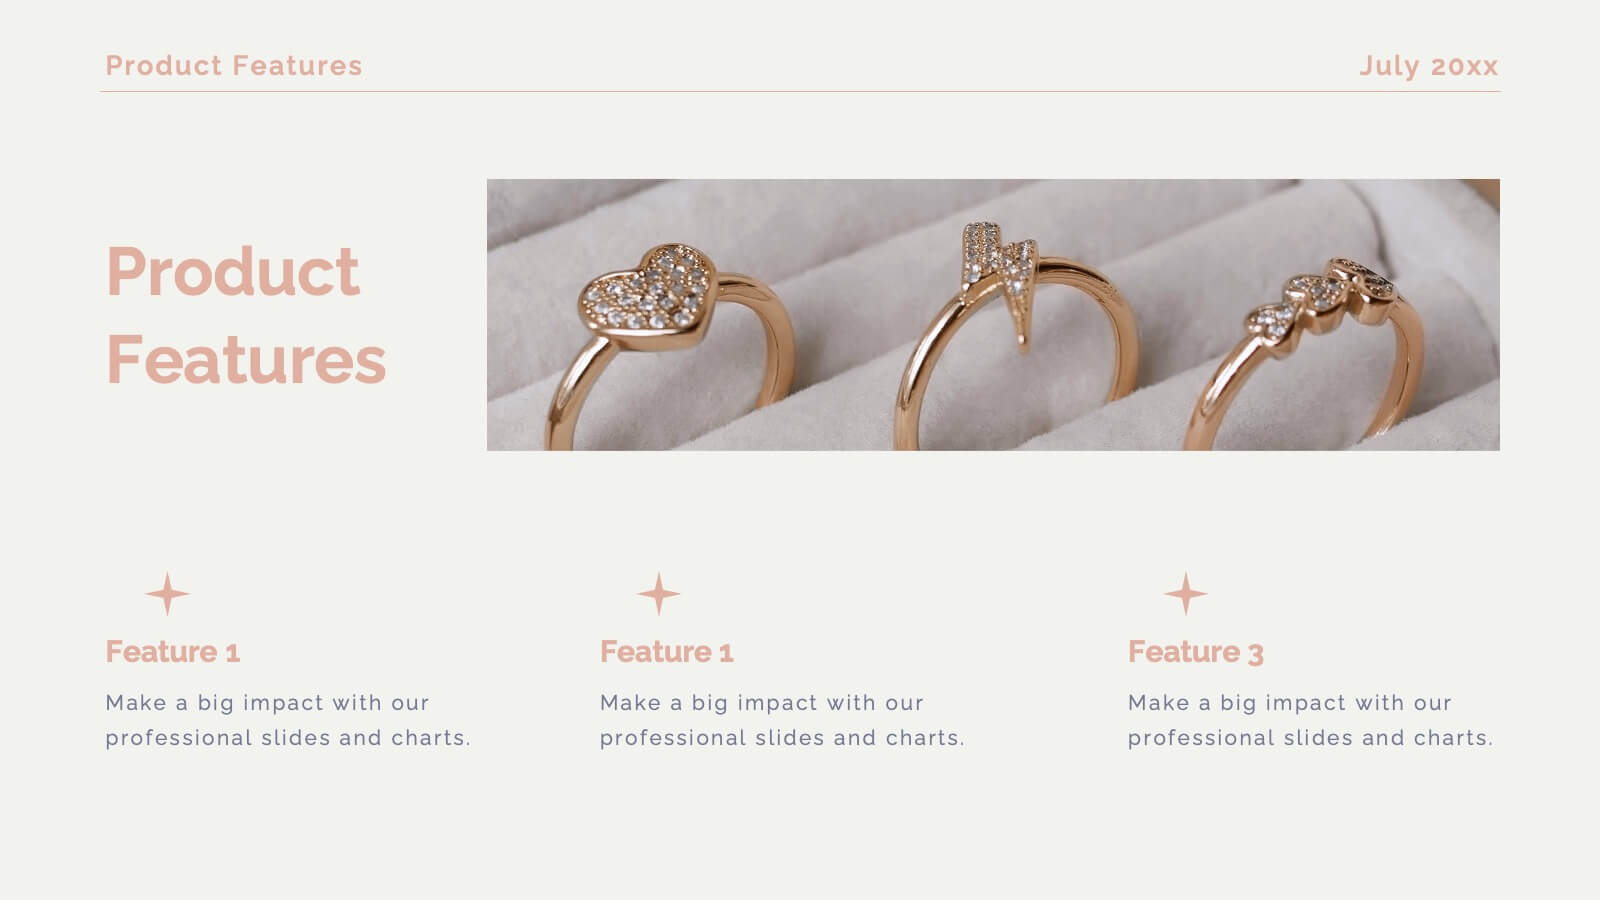
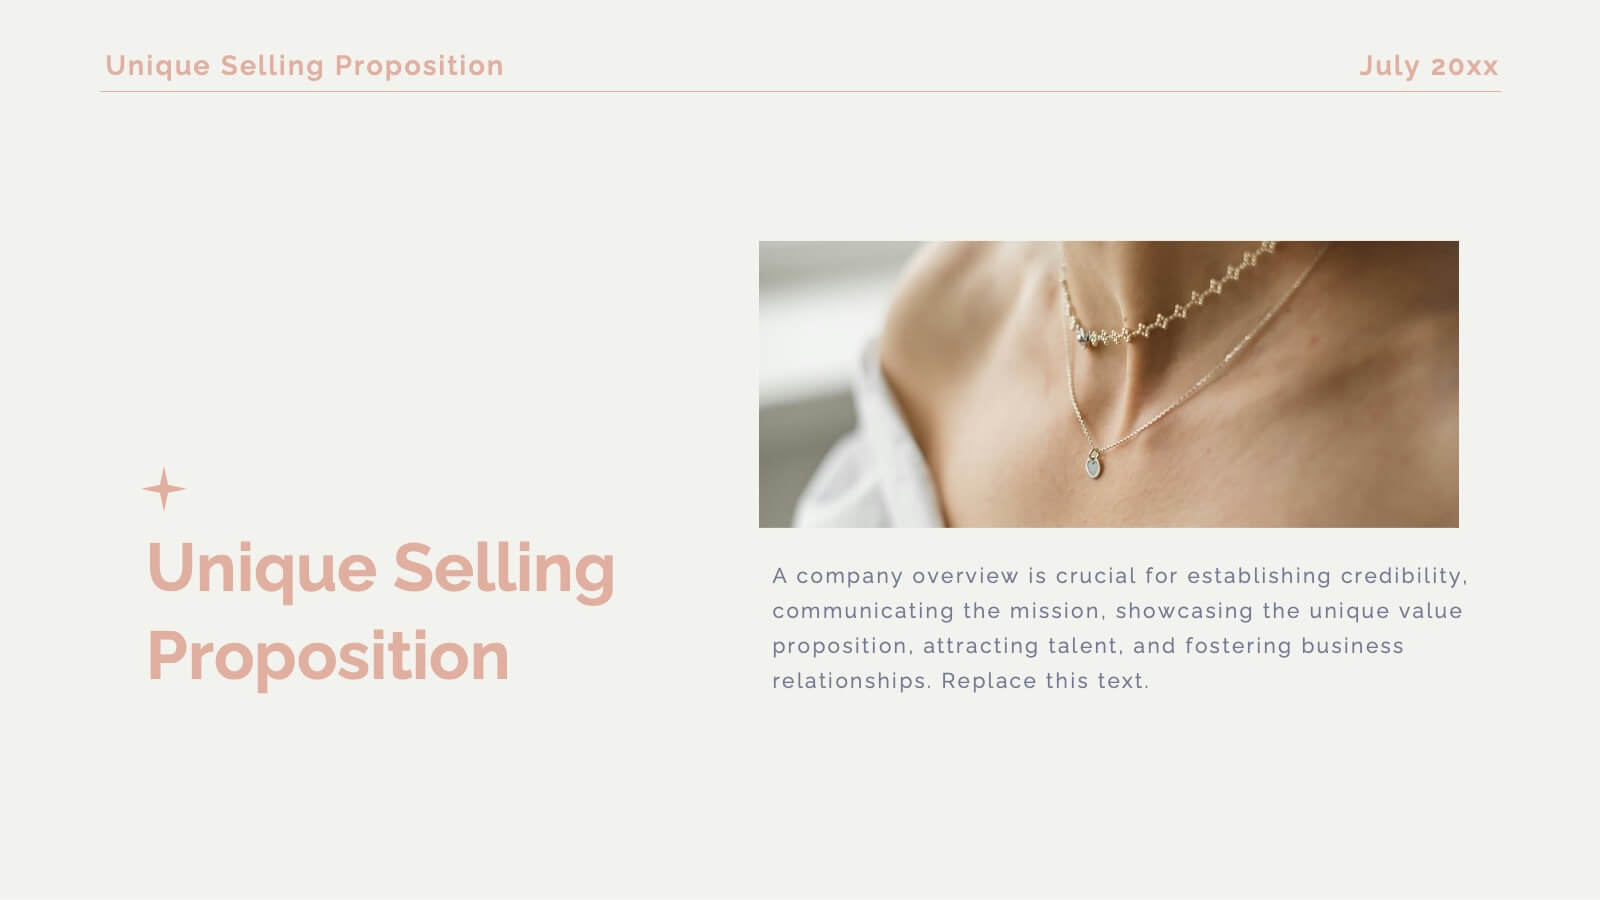
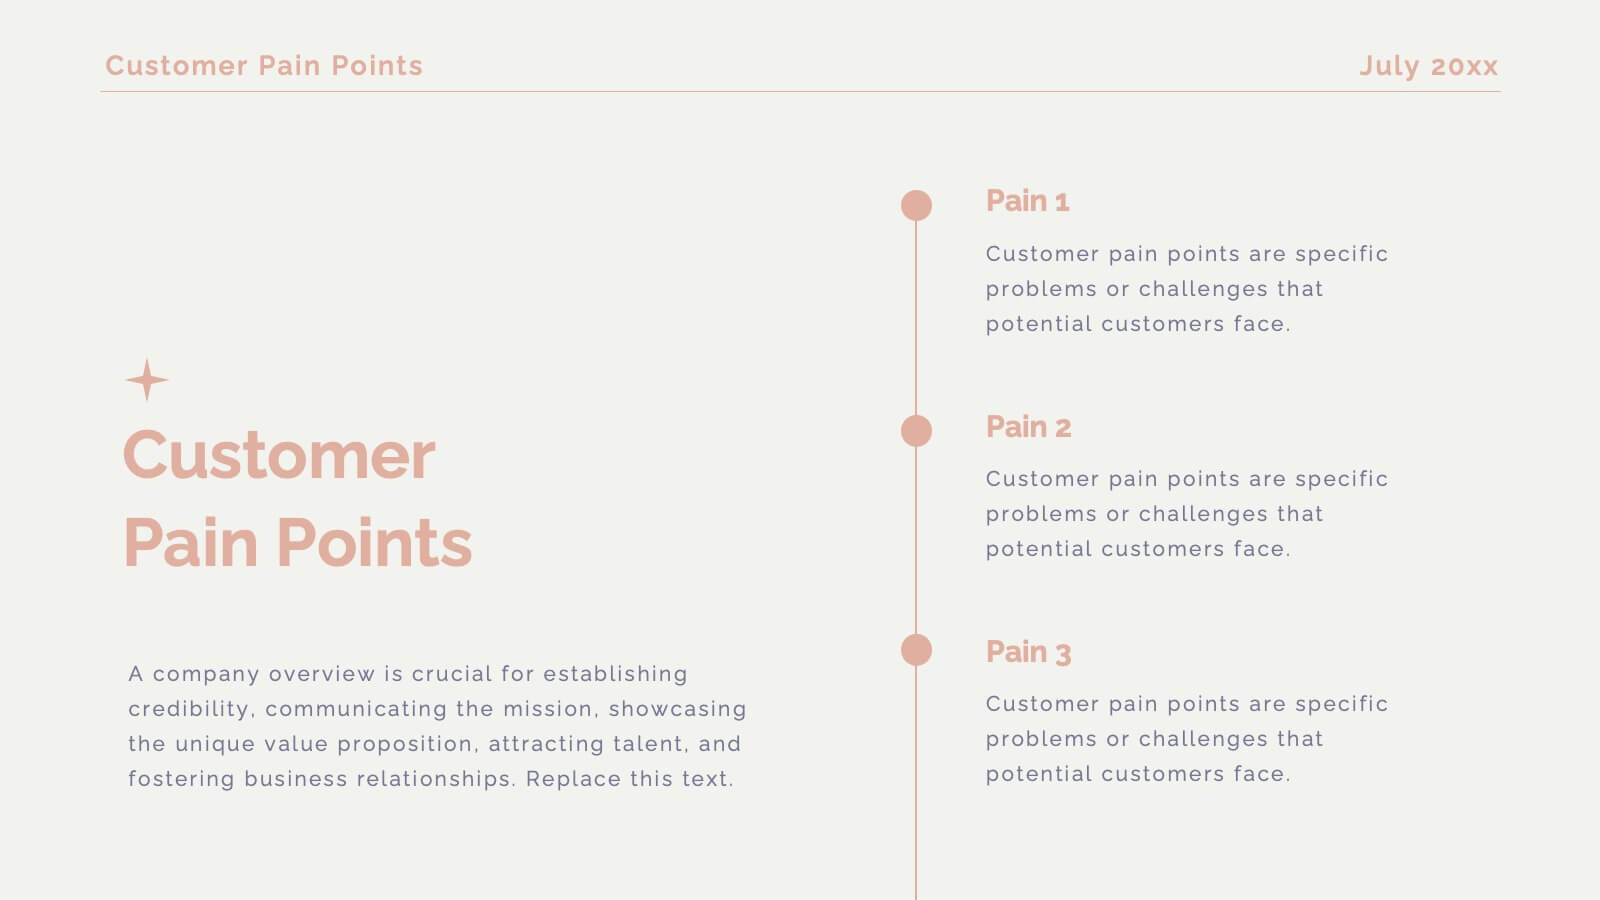
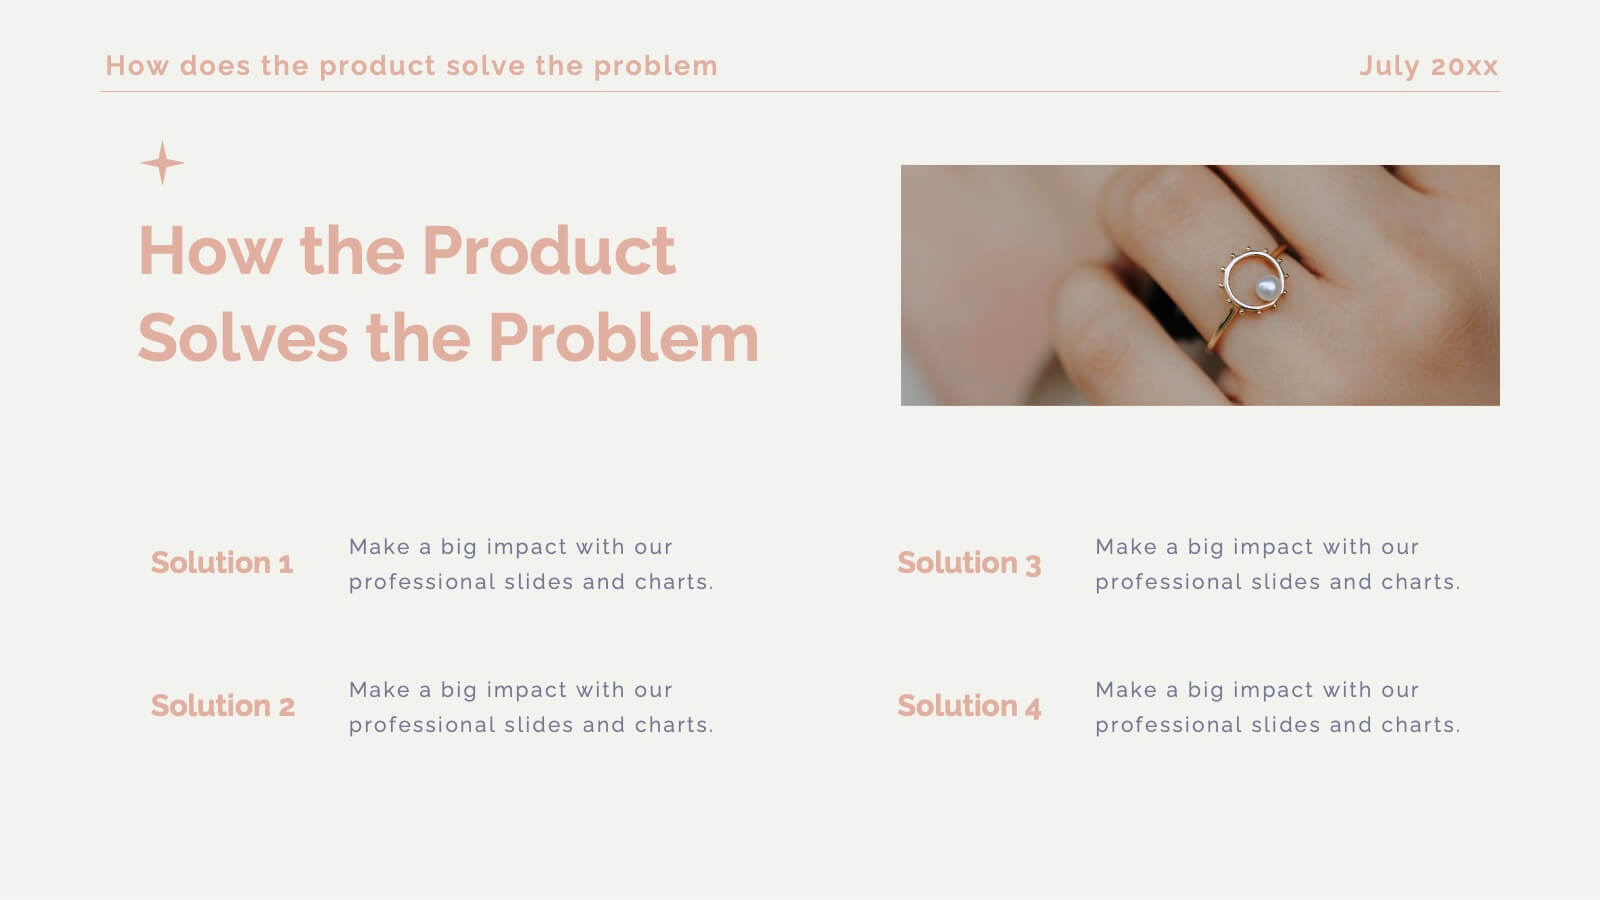
Get ready to unveil your product with a stunning and sophisticated launch template designed to captivate and convert! This template offers everything you need to present your product in the most compelling way possible, from an inviting welcome slide to an in-depth company overview that sets the stage for your brand’s story. The sleek design highlights key product features, unique selling propositions, and a thorough competitive analysis that positions your product as the market leader. With sections dedicated to customer pain points, solutions, and a powerful product demonstration, this template ensures your audience understands the value and impact of your offering. It also includes critical details like pricing strategy, distribution channels, and manufacturing processes, giving a full picture of your product’s journey from concept to market. Compatible with PowerPoint, Keynote, and Google Slides, this template is your ultimate tool for a successful product launch that leaves a lasting impression!


5 diapositivas
Cybersecurity Threat Analysis Presentation
Stay one step ahead with this bold, eye-catching slide design that makes complex cyber risk insights clear and easy to present. This layout helps you break down key threats, vulnerabilities, and security actions in a clean visual structure. Fully compatible with PowerPoint, Keynote, and Google Slides.


4 diapositivas
Workflow Phases and Team Coordination Presentation
Clarify responsibilities and sequence with the Workflow Phases and Team Coordination Presentation. This structured diagram template helps visualize how tasks move through different phases and how teams interact at each step. Perfect for project managers, team leads, and operations specialists looking to streamline collaboration. Compatible with PowerPoint, Keynote, and Google Slides.


6 diapositivas
Market Challenges and Competitive Solutions Presentation
Visually map out business hurdles and strategic responses with this sleek 6-step infographic layout. Perfect for showcasing pain points on one side and proposed solutions on the other, it's ideal for sales decks, strategy reports, or competitor analysis. Customize each icon, title, and section easily in PowerPoint, Keynote, or Google Slides.


4 diapositivas
Goal Breakdown and Success Metrics Presentation
Visualize achievement metrics with the Goal Breakdown and Success Metrics Presentation. This dynamic template features global maps, KPIs, and segment analysis to track progress and highlight results. Ideal for executives, project leads, or analysts. Fully customizable in PowerPoint, Keynote, and Google Slides for polished and insightful business presentations.


5 diapositivas
New Hire Employee Onboarding Flow Presentation
Make a lasting first impression with a clear, engaging flow that guides new hires through every step of their onboarding journey. Perfect for HR teams and managers, this presentation simplifies complex processes with visual structure and clarity. Fully compatible with PowerPoint, Keynote, and Google Slides for easy customization and use.


5 diapositivas
Corporate Office Life Illustration Scene Presentation
Bring your workplace concepts to life with this modern office scene illustration. Featuring a top-down view of diverse team members in a meeting, this slide is perfect for showcasing collaboration, brainstorming, or teamwork insights. Fully customizable and compatible with PowerPoint, Keynote, and Google Slides for seamless editing.


7 diapositivas
Team Meeting Infographic Presentation
Are you looking for a fun and engaging way to present your next business meeting? Look no further than our new team meeting infographics template! With our template, you can add a touch of creativity to your presentation with a colorful illustration infographics. Whether you're student making a business presentation or a manager looking to engage your workers in your next meeting. With these simple easy to use infographics, you'll be able to create a top-quality presentation in no time with great engaging visuals. So why wait? Take your team meetings to the next level with our amazing template today!


10 diapositivas
Professional Table of Content Slide Presentation
Give your presentation a polished and organized introduction with this Professional Table of Content slide. Designed for clarity and navigation, it features four sleek, color-coded content banners—perfect for outlining major sections or chapters. Each icon and title can be customized to reflect your topic structure. Ideal for business plans, proposals, or reports. Fully editable in PowerPoint, Keynote, and Google Slides.


7 diapositivas
Communication Styles Infographic
Dive into the diverse world of communication with our communication styles infographic. Set against a palette of blue, yellow, and white, this template offers a visual exploration of different communication methods and their nuances. Whether it's assertive, passive, aggressive, or passive-aggressive, understanding these styles is vital in both personal and professional settings. Ideal for corporate trainers, educators, students, or anyone aiming to improve their interpersonal skills. Crafted for clarity and compatibility, this infographic is an excellent addition to PowerPoint, Keynote, and Google Slides, ensuring your presentations resonate with both substance and style.


5 diapositivas
Product Roadmap Presentation
The "Product Roadmap Infographic" template is ideal for presenting the strategic vision and progressive steps for product development. This template outlines the roadmap through a creative and visually engaging route-style layout, designed to highlight key milestones and stages in the product lifecycle, from conception to launch. Each point on the roadmap is clearly marked for specific goals or achievements, encouraging clarity and understanding among stakeholders about the direction and progress of the product. This layout is perfect for product managers and teams to communicate timelines, prioritize tasks, and align goals during presentations in corporate settings.


7 diapositivas
Chart Comparison Infographic Presentation
Chart Comparison is the process of comparing different charts or graphs to identify similarities. It involves analyzing multiple sets of data by visually presenting them in charts. Use this template to show the comparison of various charts and how things look when they are compared. This template will help you create a professional Infographic presentation that highlights the key differences between data sets. Each chart can have it's own color, so you can use any color you want. You can also add text in the chart with your own content, and edit in Powerpoint, Keynote, or Google Slides.


5 diapositivas
Project Management Plan Presentation
Bring structure and clarity to every phase of your workflow with this clean, arrow-based layout designed to outline tasks, milestones, and key deliverables. This presentation makes planning feel organized, engaging, and easy to follow for any audience. Fully editable and ready to use in PowerPoint, Keynote, and Google Slides.


5 diapositivas
SWOT Analysis Business Presentation
Identify key business factors with the SWOT Analysis Business Infographic. This structured template visually highlights strengths, weaknesses, opportunities, and threats, making it ideal for strategy planning, competitive analysis, and decision-making. Fully customizable with editable colors, text, and icons. Compatible with PowerPoint, Keynote, and Google Slides for effortless presentation use.


7 diapositivas
Growth Infographics Presentation Template
Our Growth Infographic template is a minimal modern design that combines data analysis and professional presentation. The presentation contains a set of slides with various information texts for your topic. This template is compatible with powerpoint and allows you to customize the color schemes, which makes it suitable for any theme and image style. Showcase your company’s growth by using this infographic template. This template can be used as a promotional tool for your business or to show growth results in order to attract investors. This template is a high quality, dynamic presentation!