


Características


¿Tienes alguna pregunta?
Recomendar


5 diapositivas
Bar, Line, and Pie Chart Combo Layout Presentation
Present multiple data points in one sleek slide with the Bar, Line, and Pie Chart Combo Layout Presentation. This template merges three essential chart types—bar, line, and pie—into a cohesive, easy-to-read format, ideal for reports, comparisons, or trends. Fully editable in PowerPoint, Keynote, Canva, or Google Slides.


5 diapositivas
Process Improvement Infographics
Introducing our Process Improvement Infographics, these are visual representations of the steps involved in enhancing the efficiency of a process. This template is designed to help businesses identify bottlenecks and areas of improvement in their operations. These infographics consist of vertically arranged sections or columns that outline the different stages of the process improvement journey. Each section provides a brief explanation of the stage along with relevant icons, illustrations, or diagrams to enhance understanding. The layout is designed to showcase the sequential flow of activities involved in the improvement process.


23 diapositivas
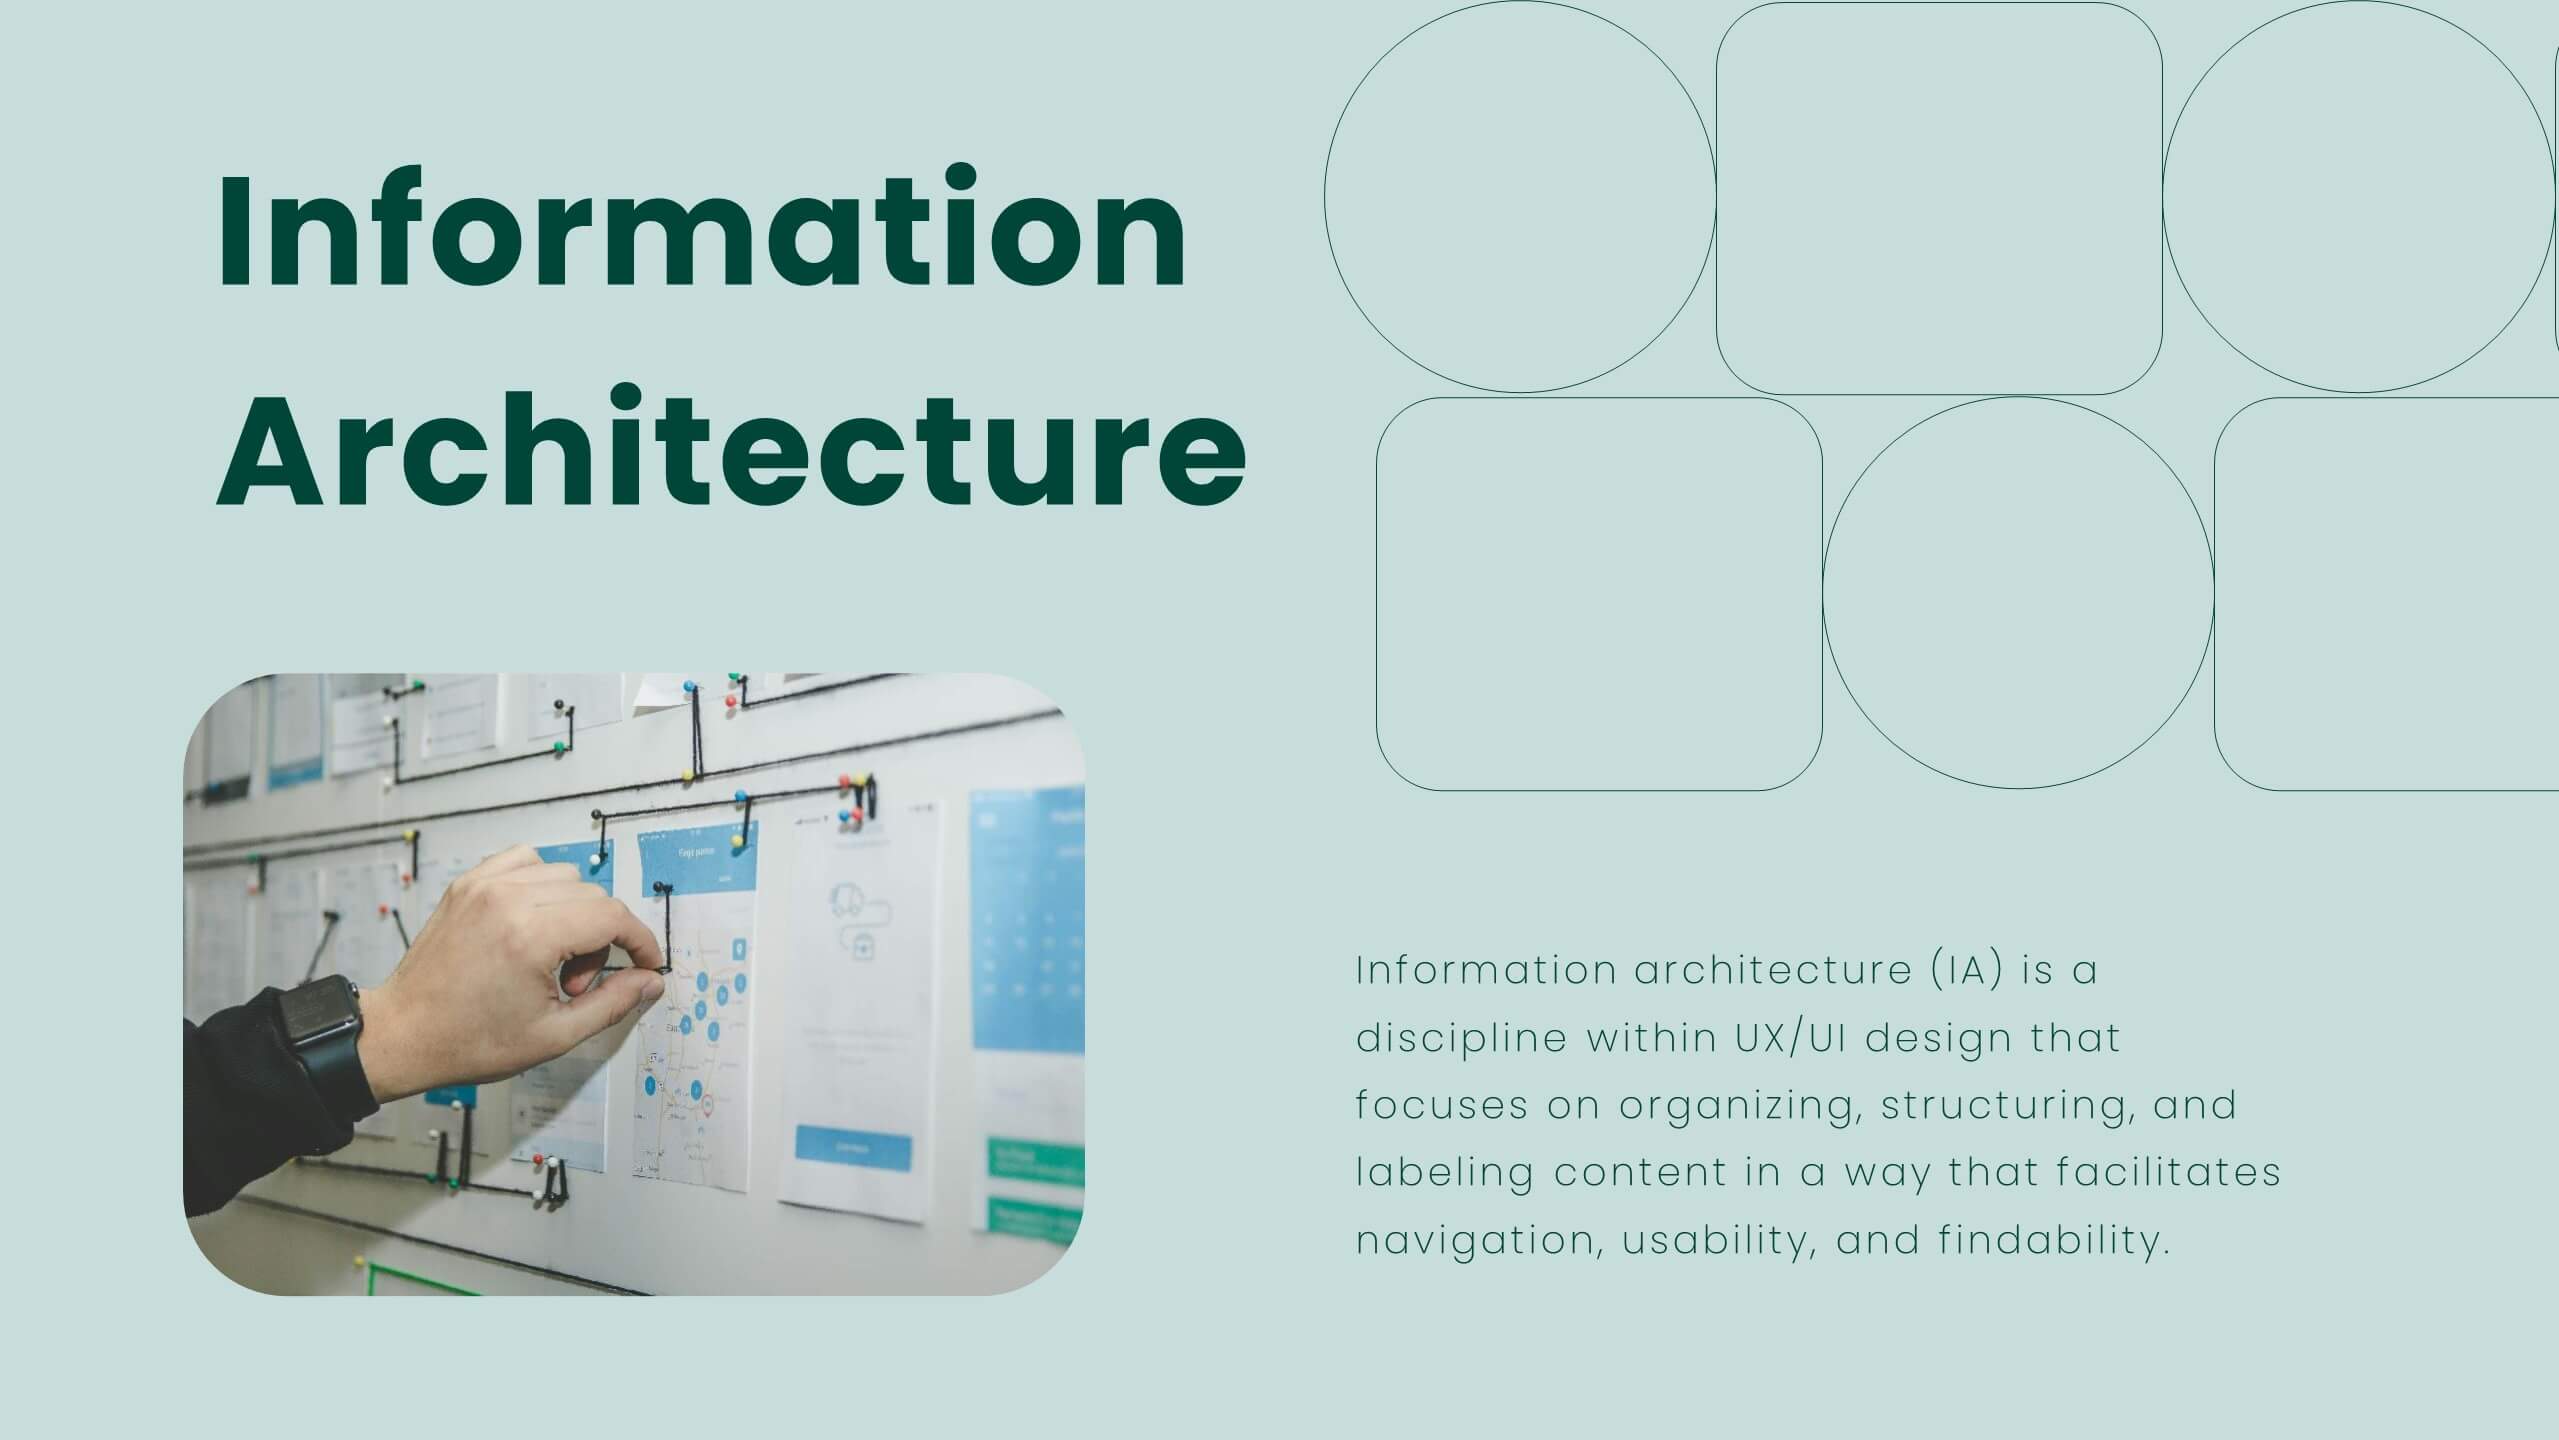
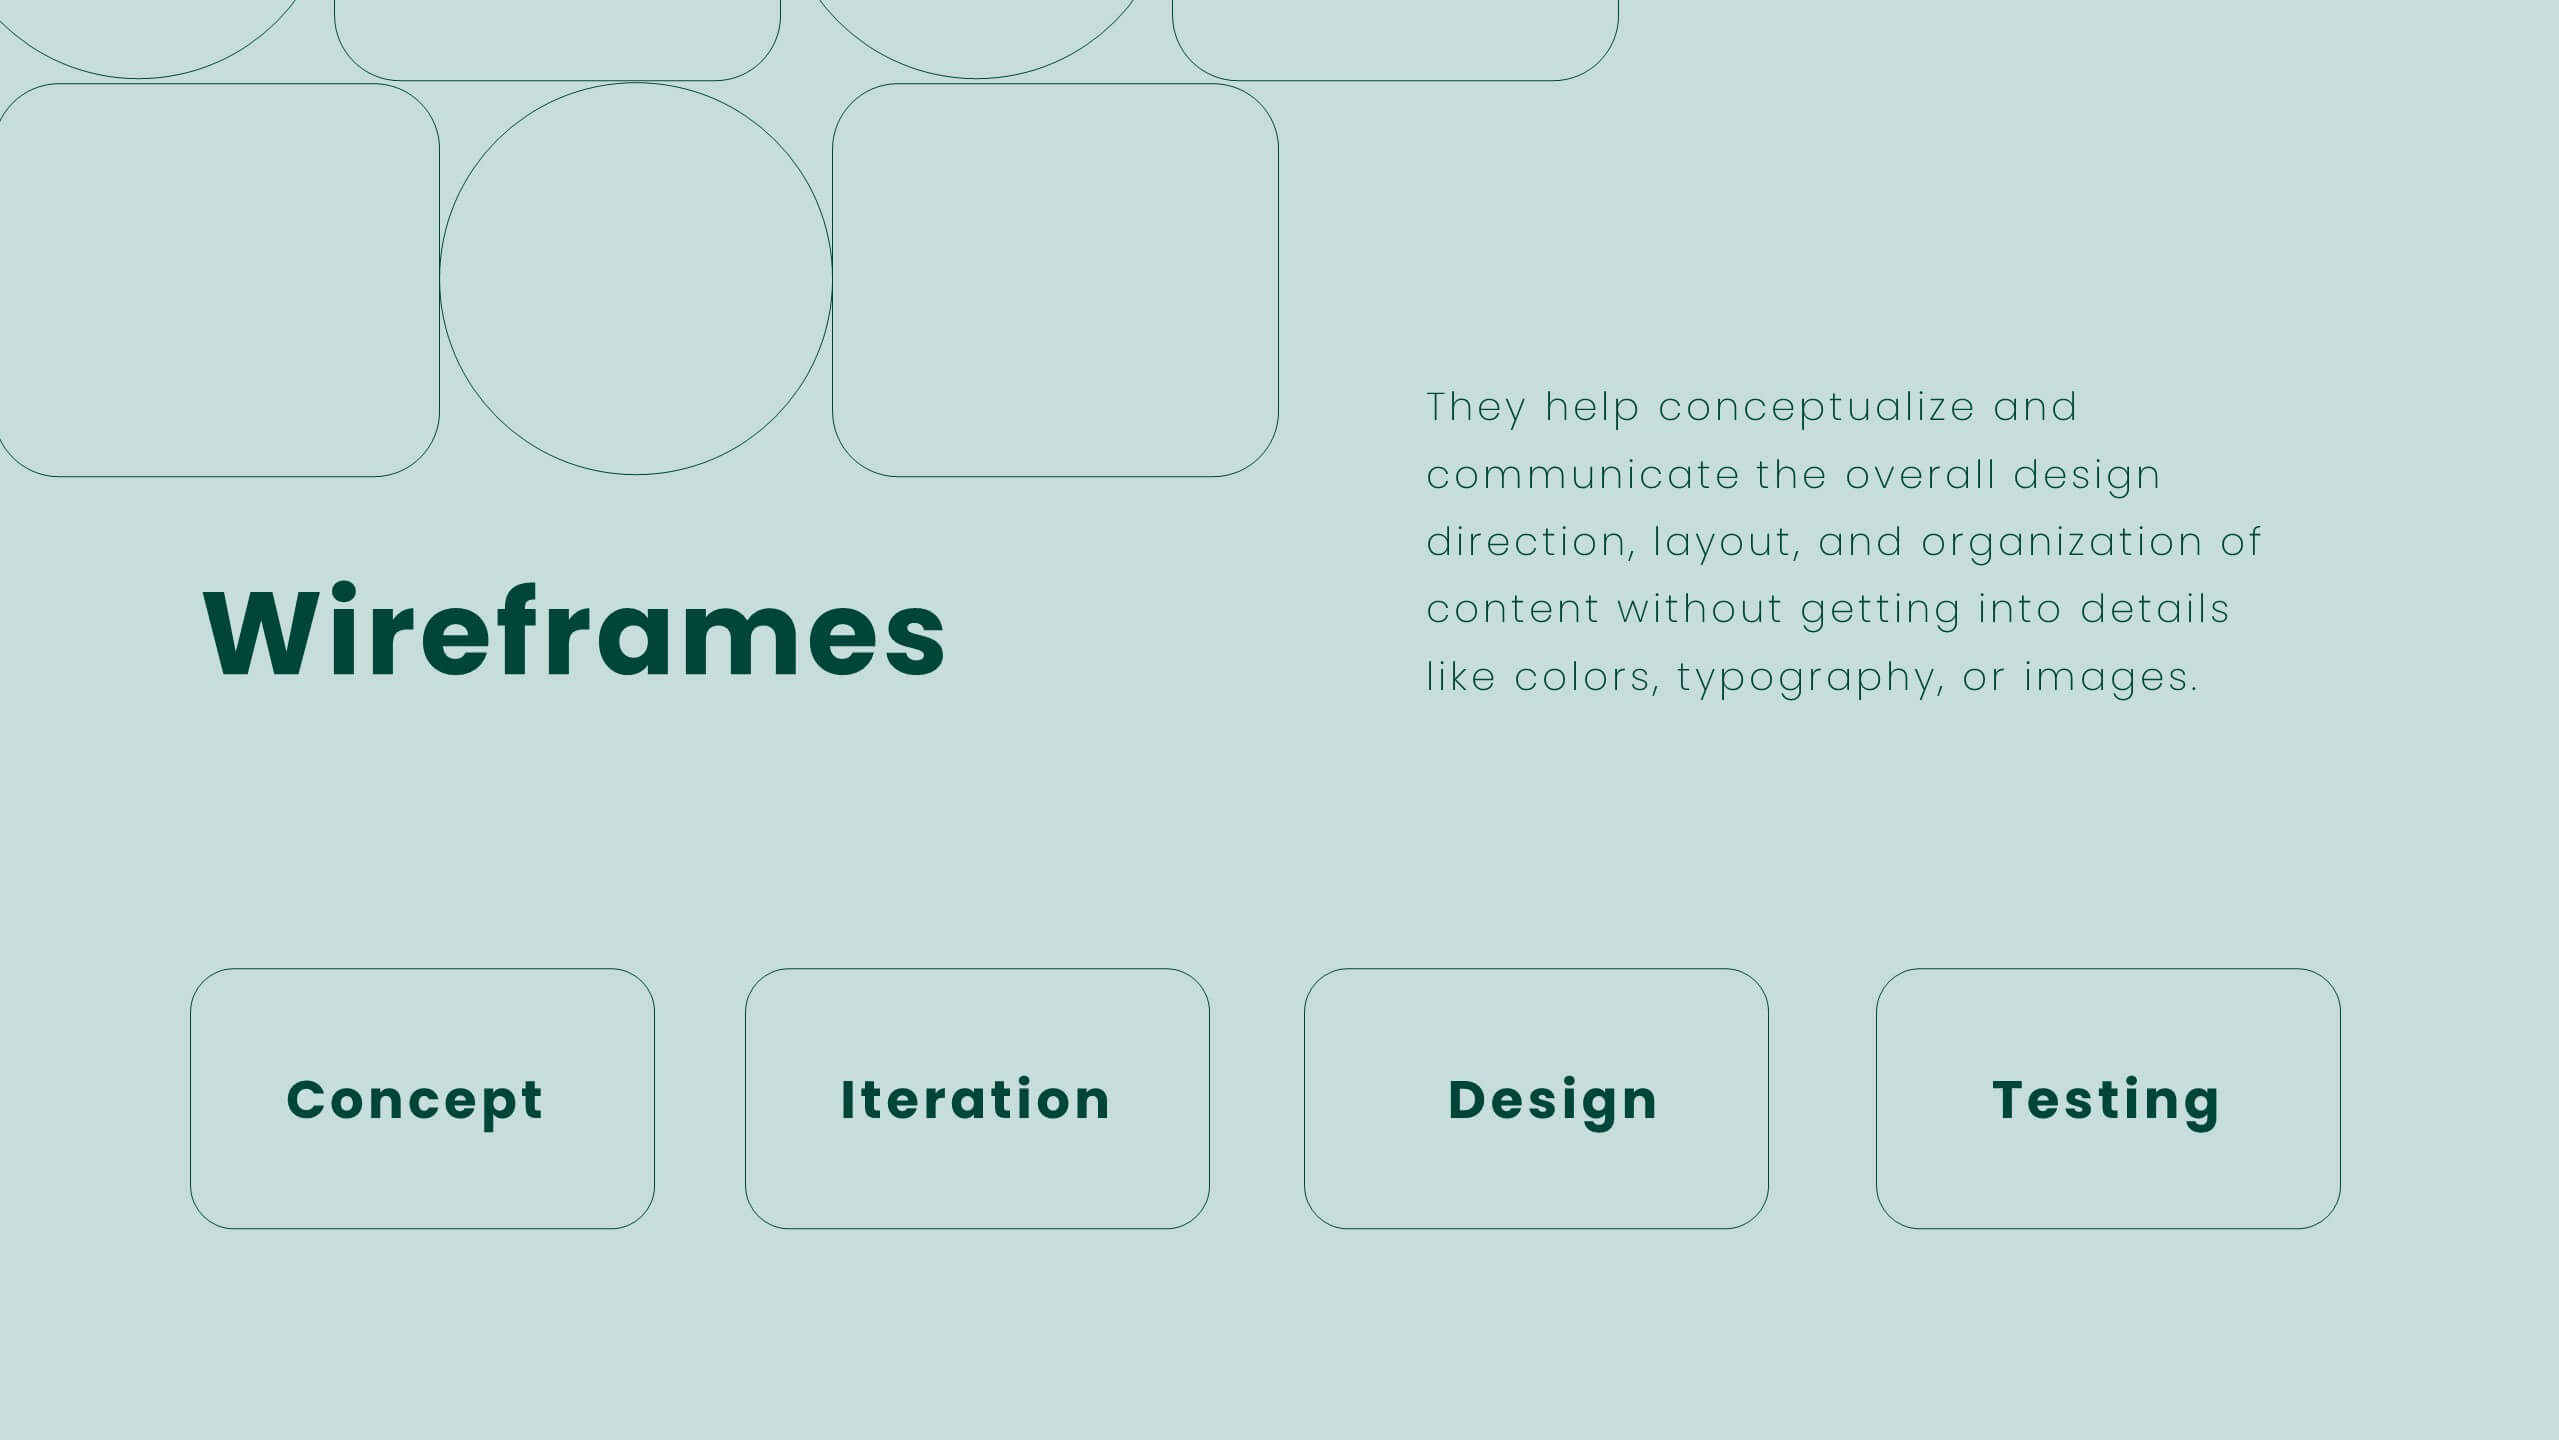
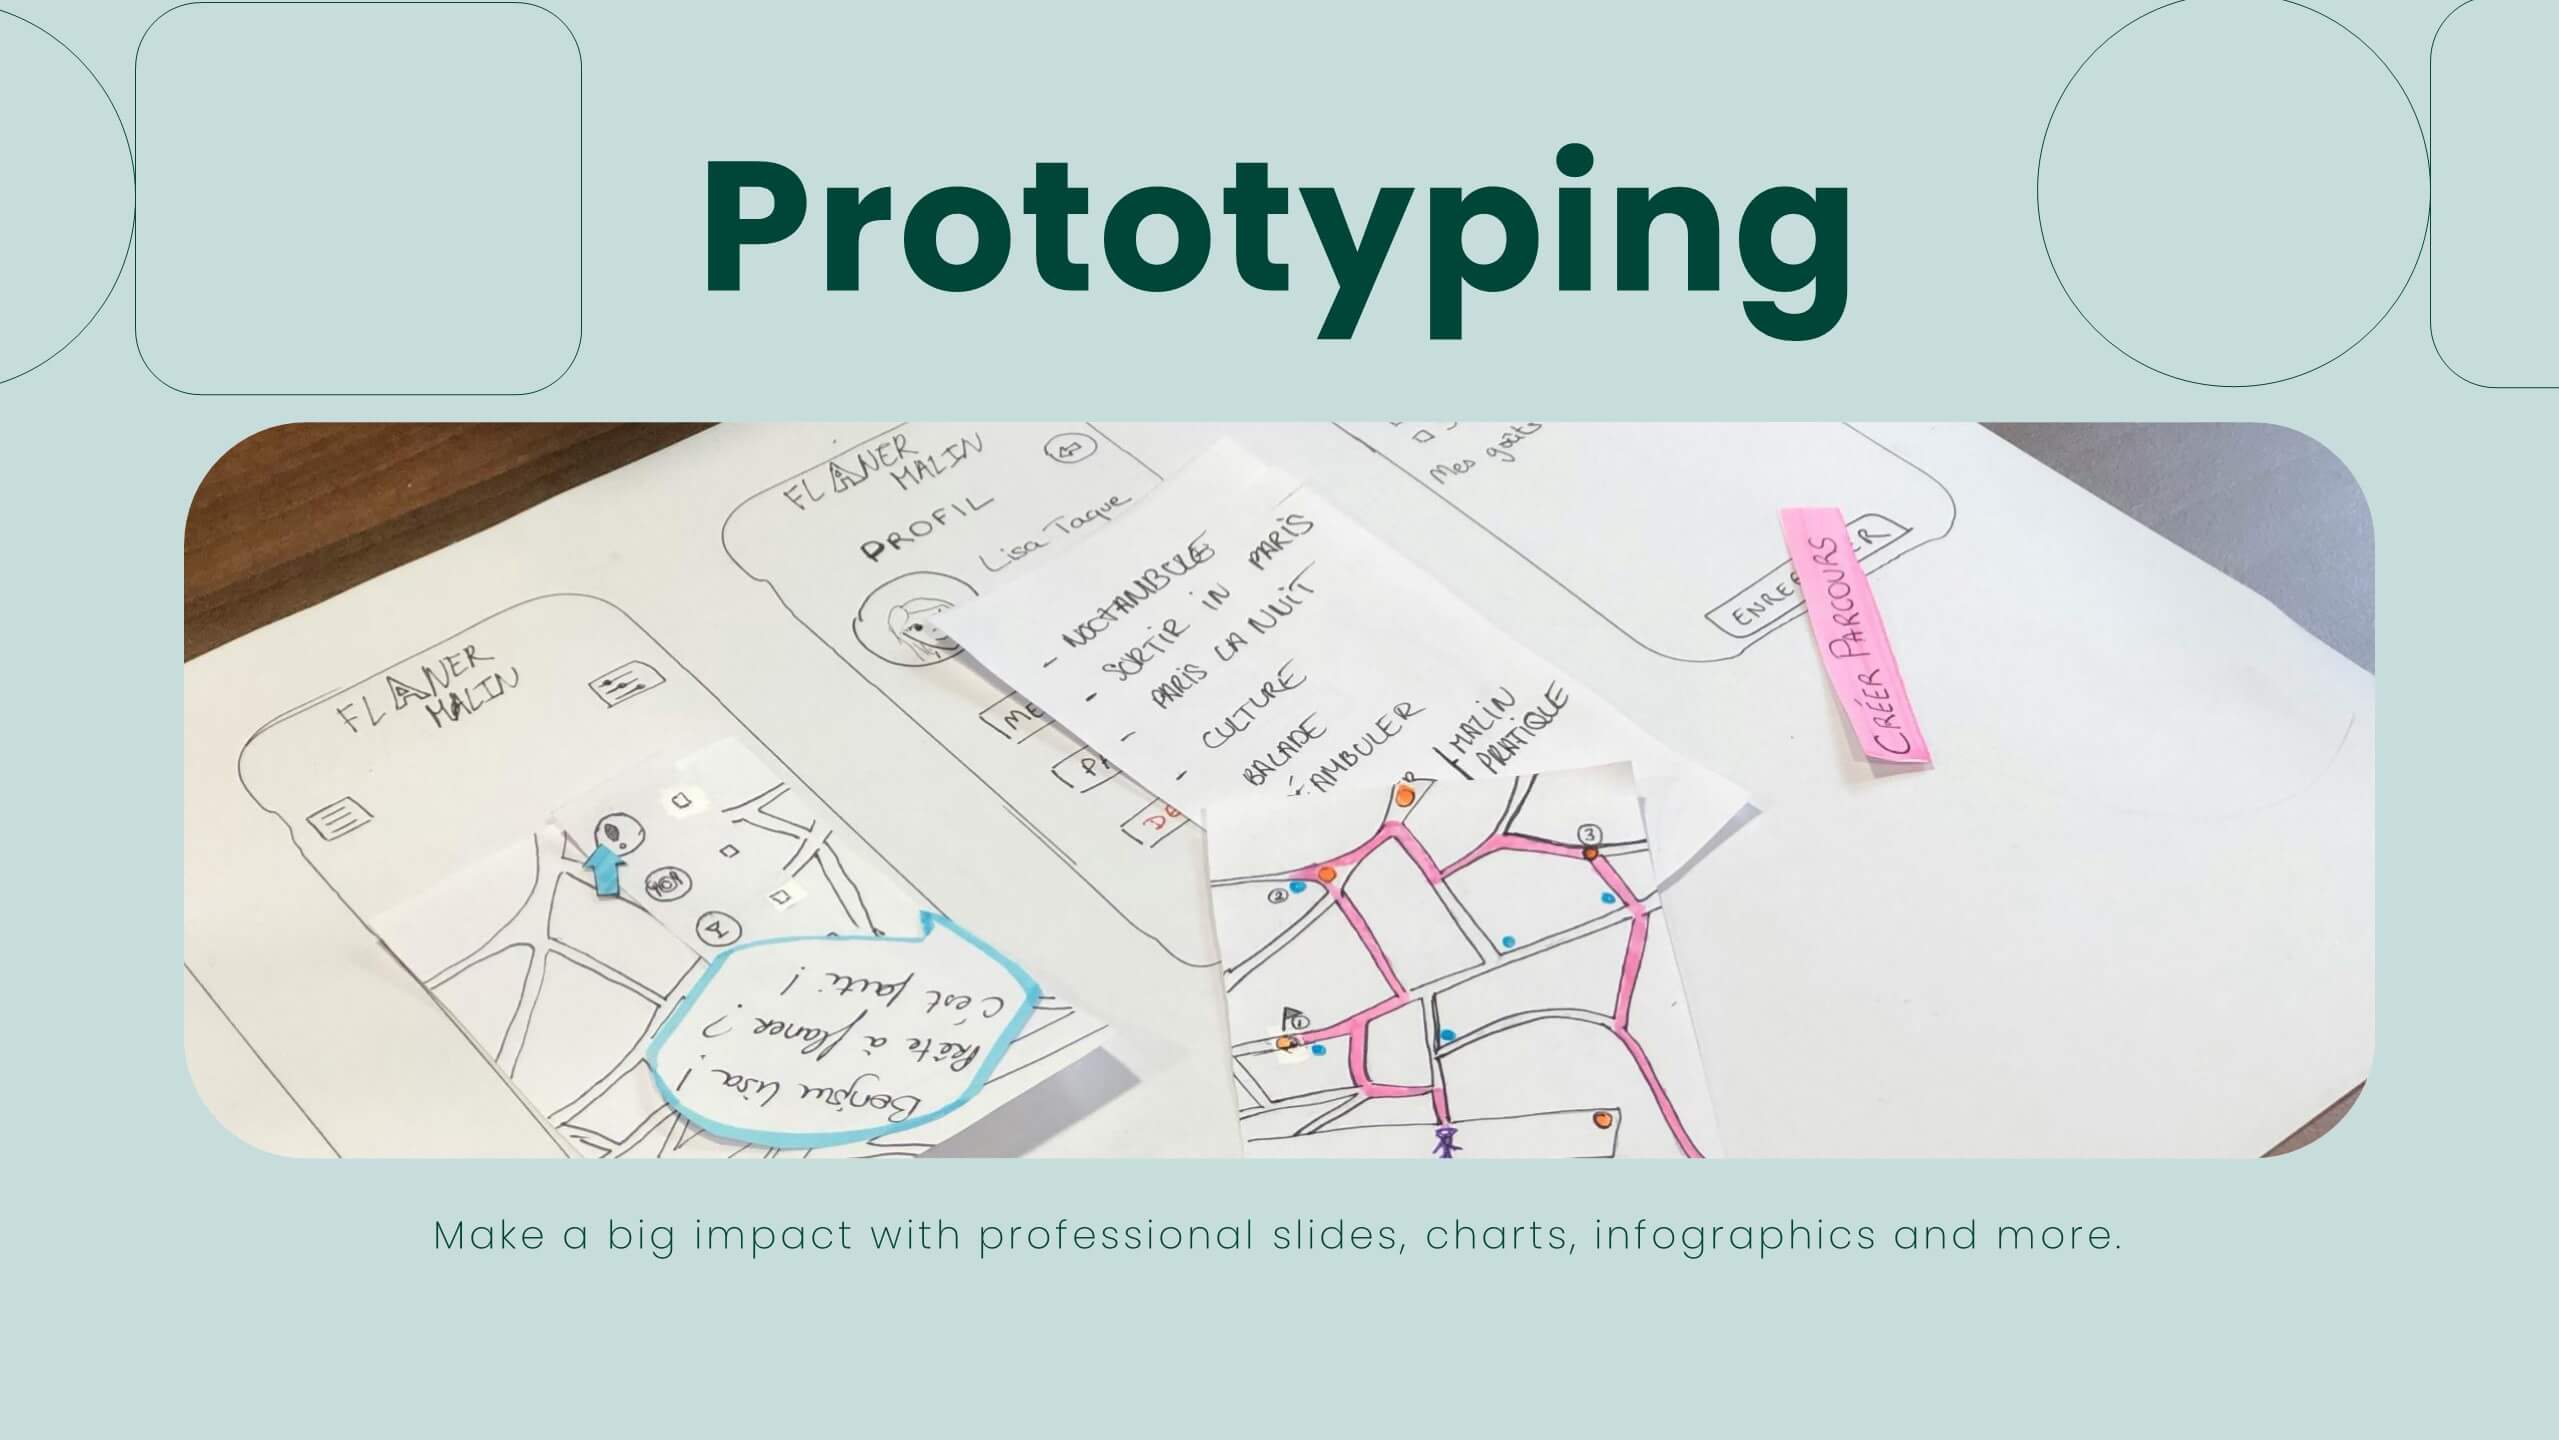
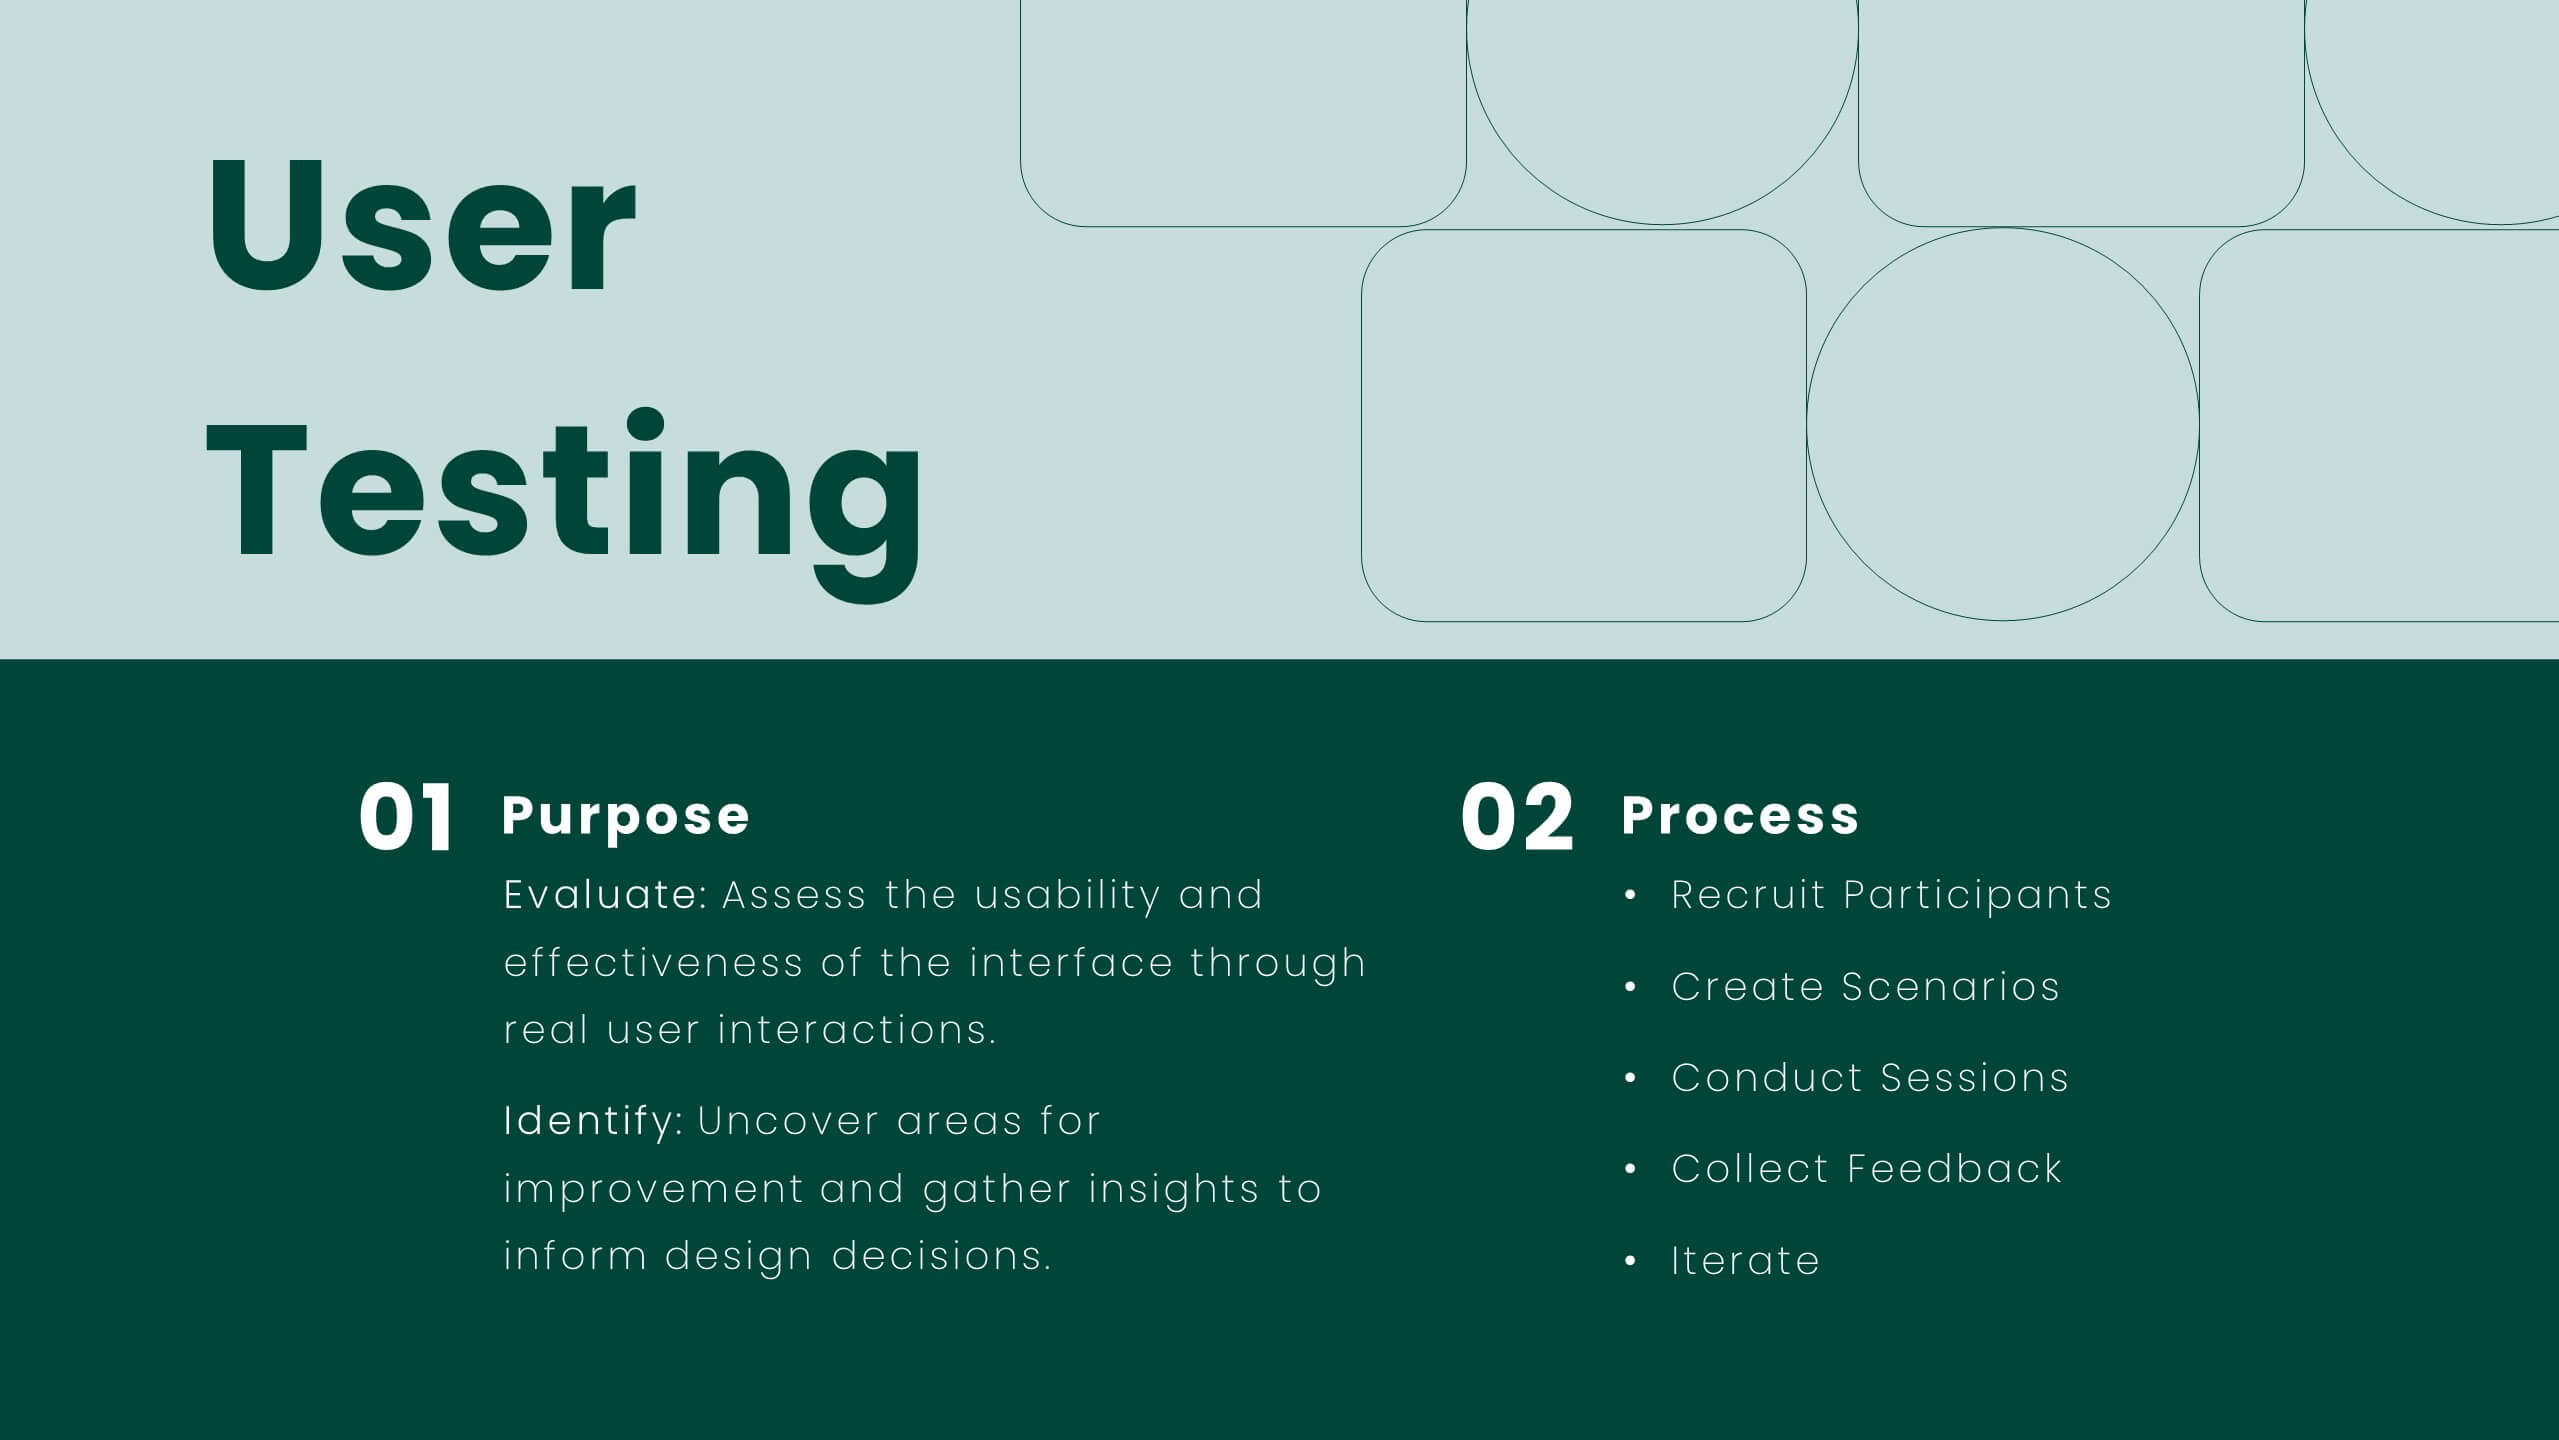
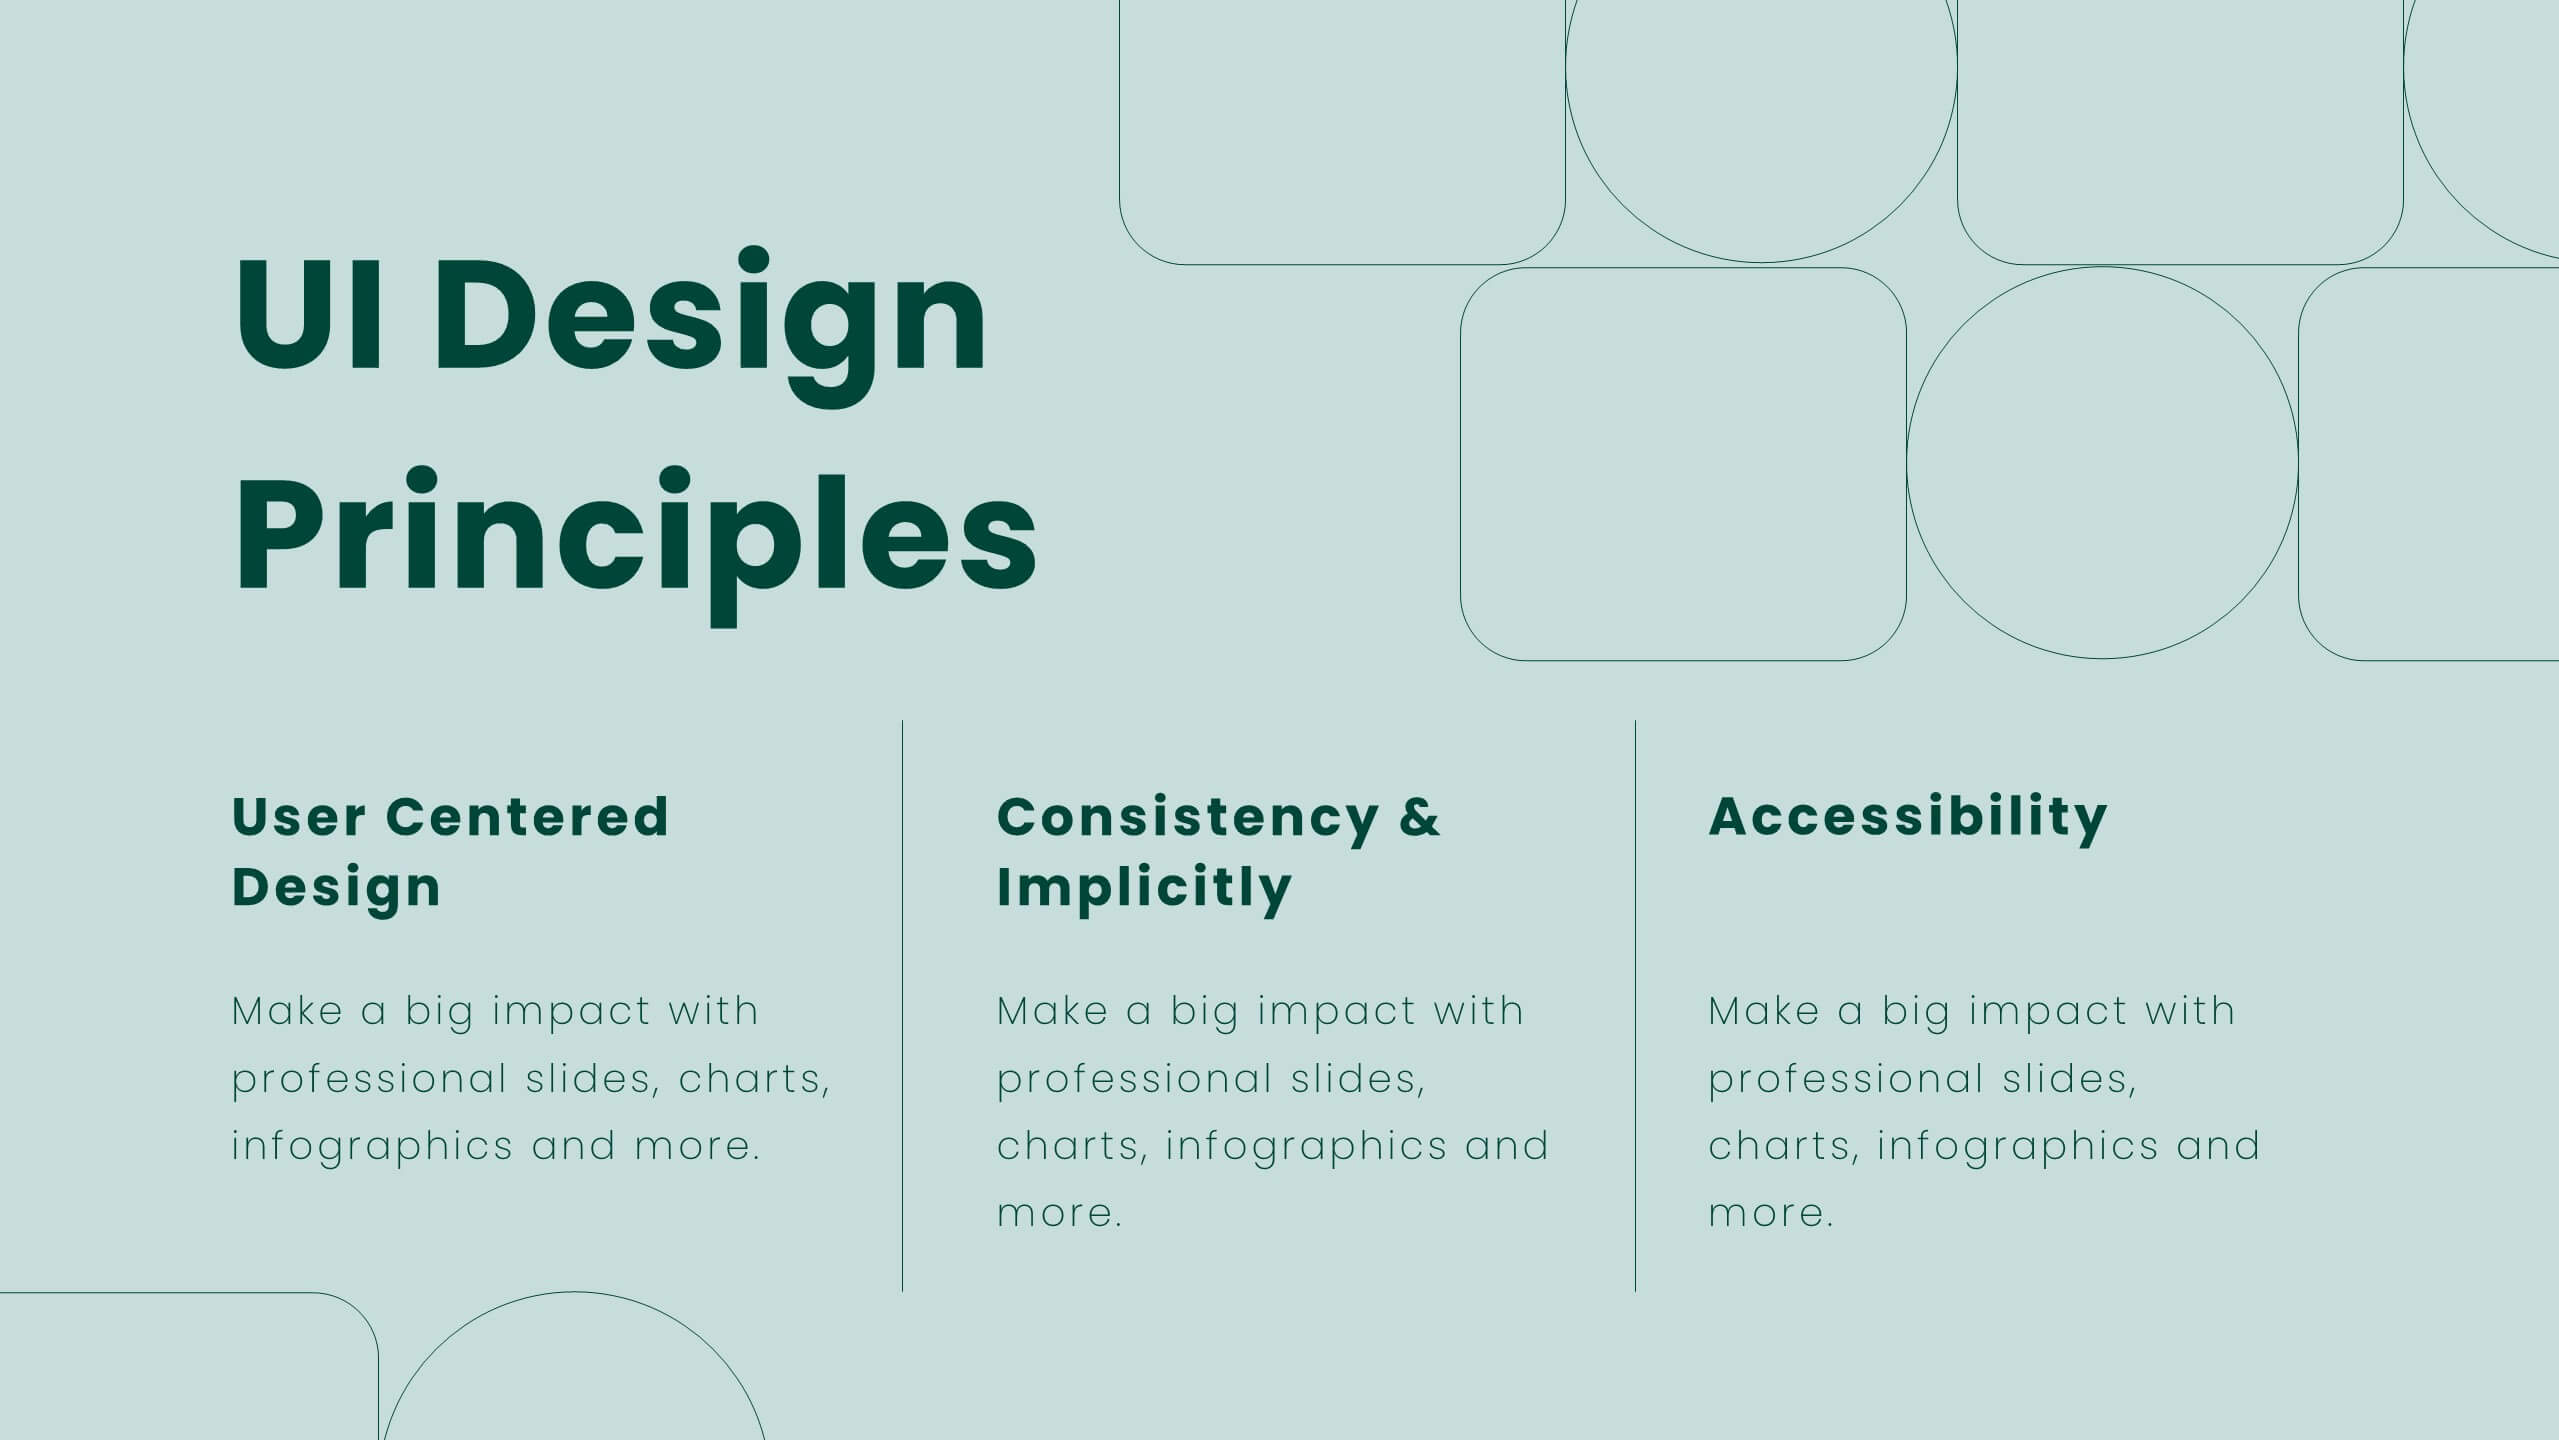
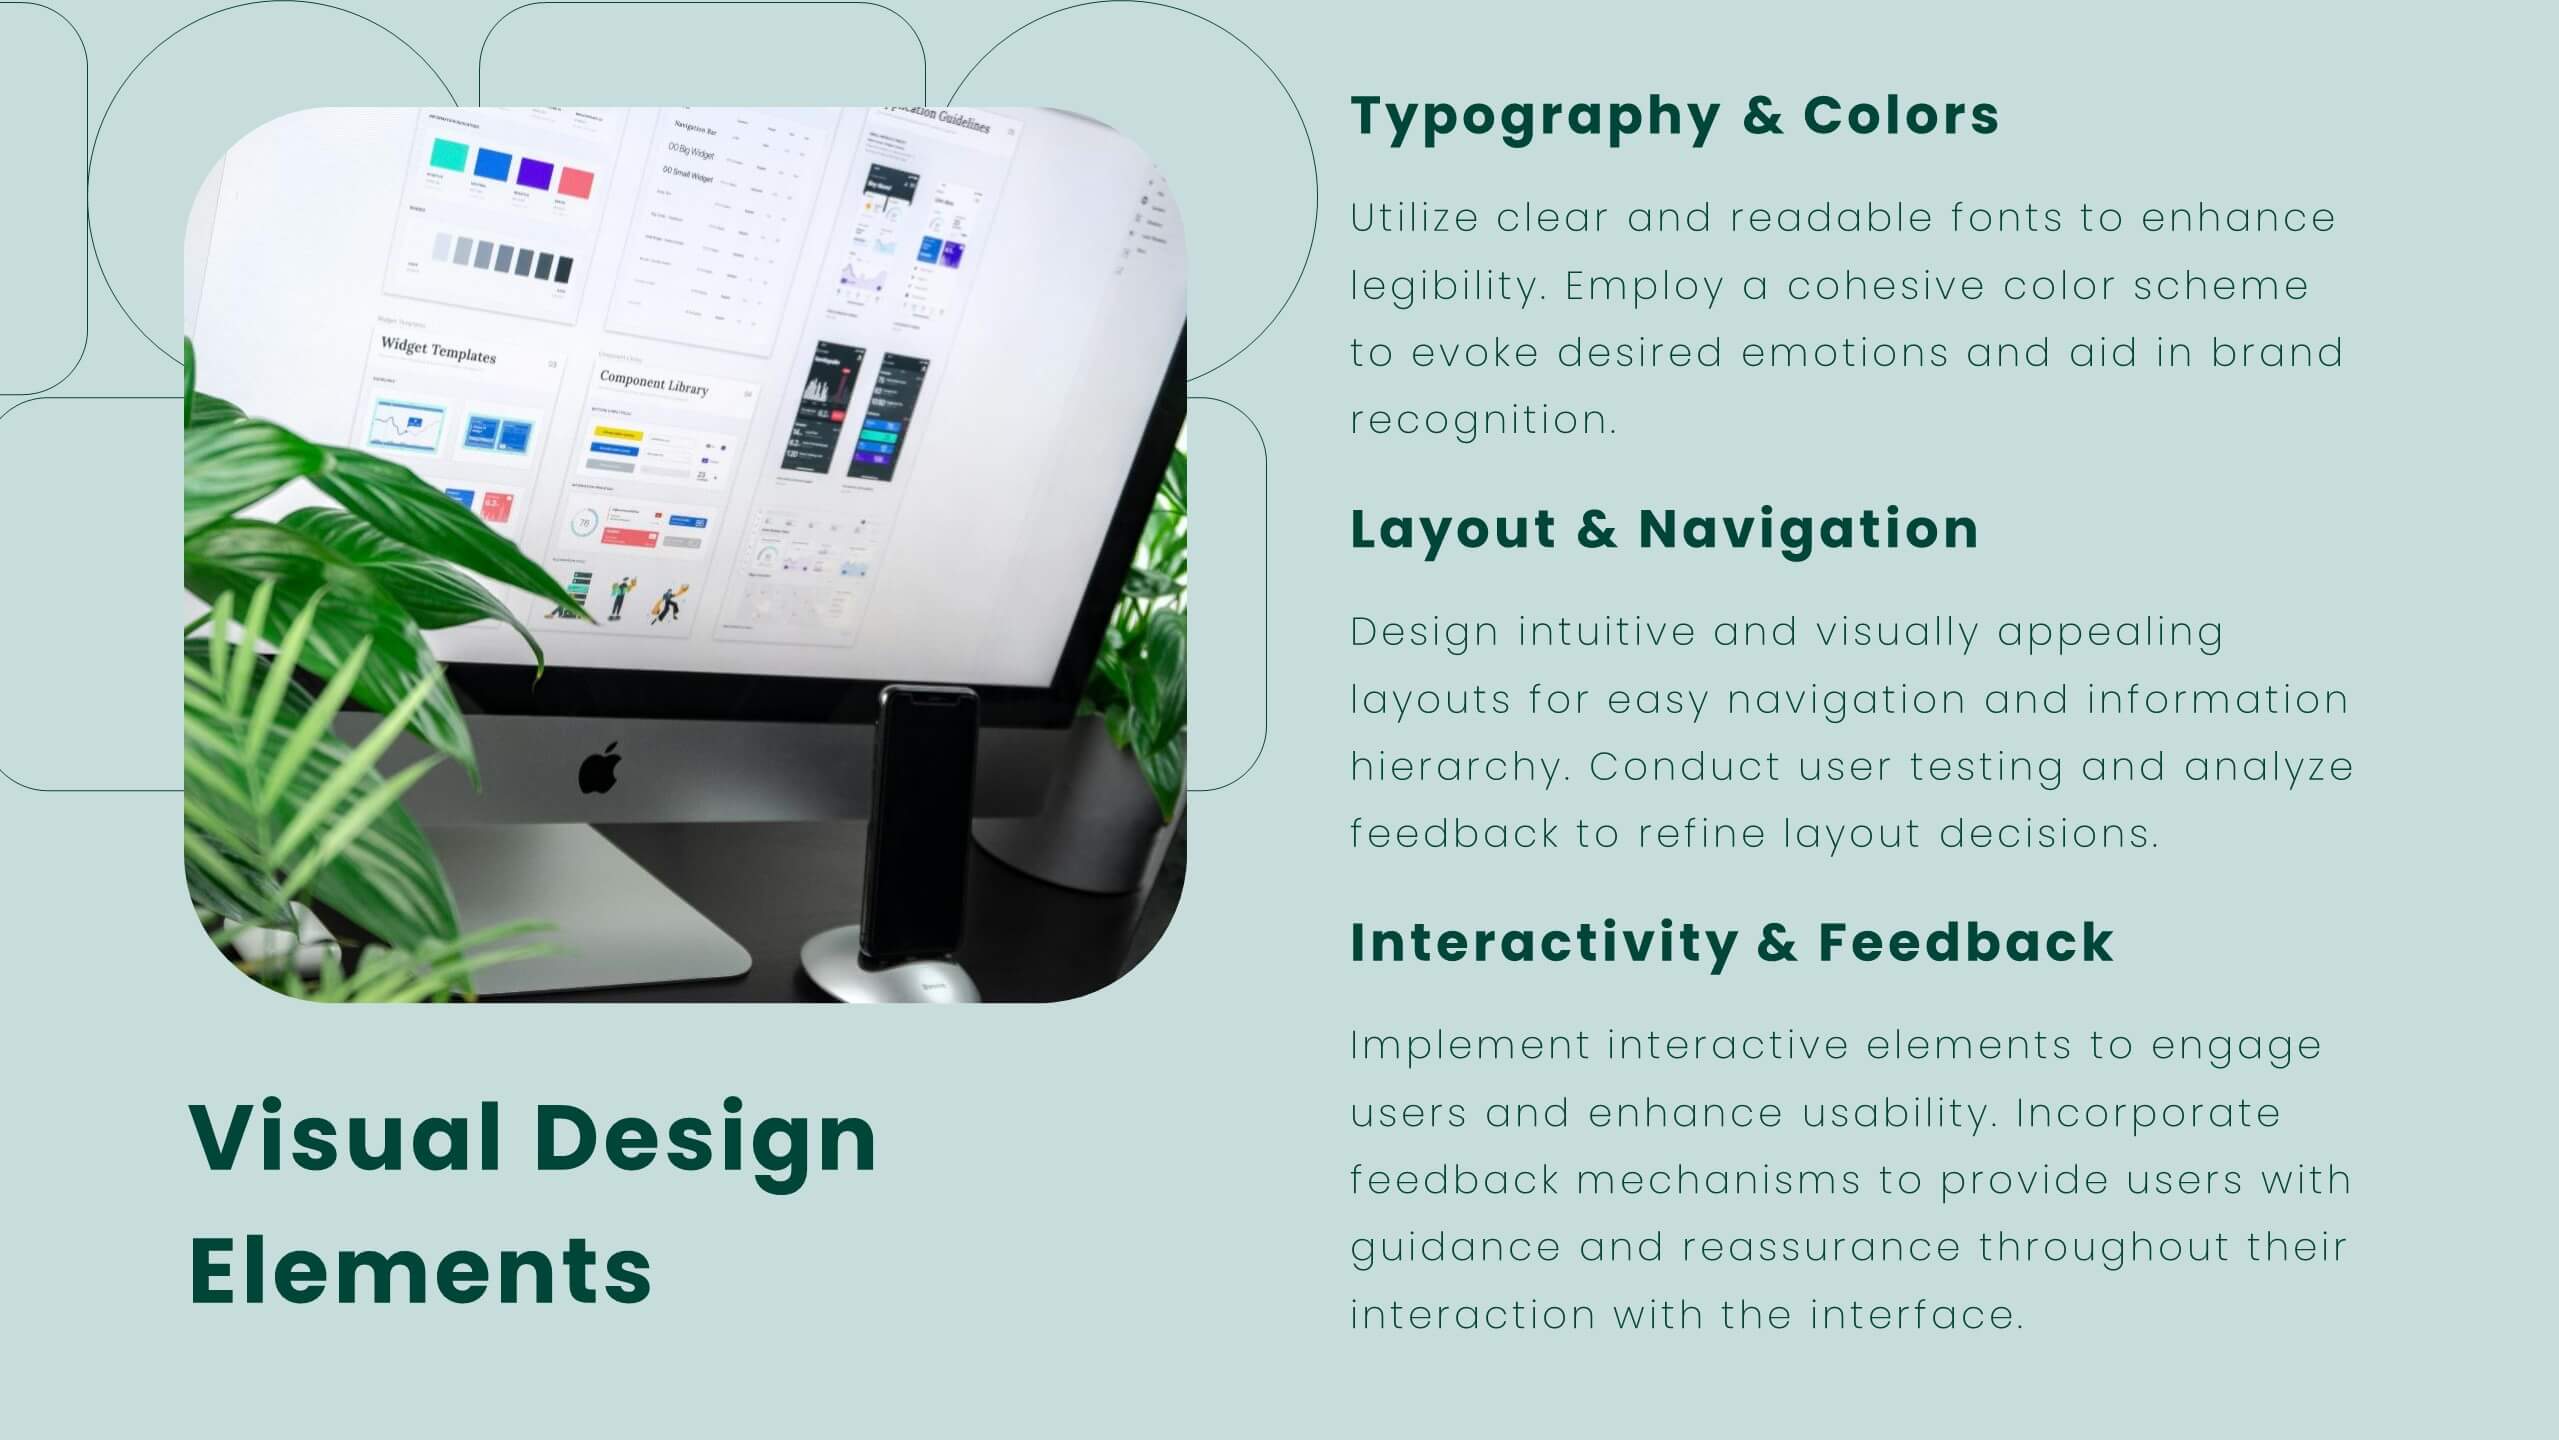
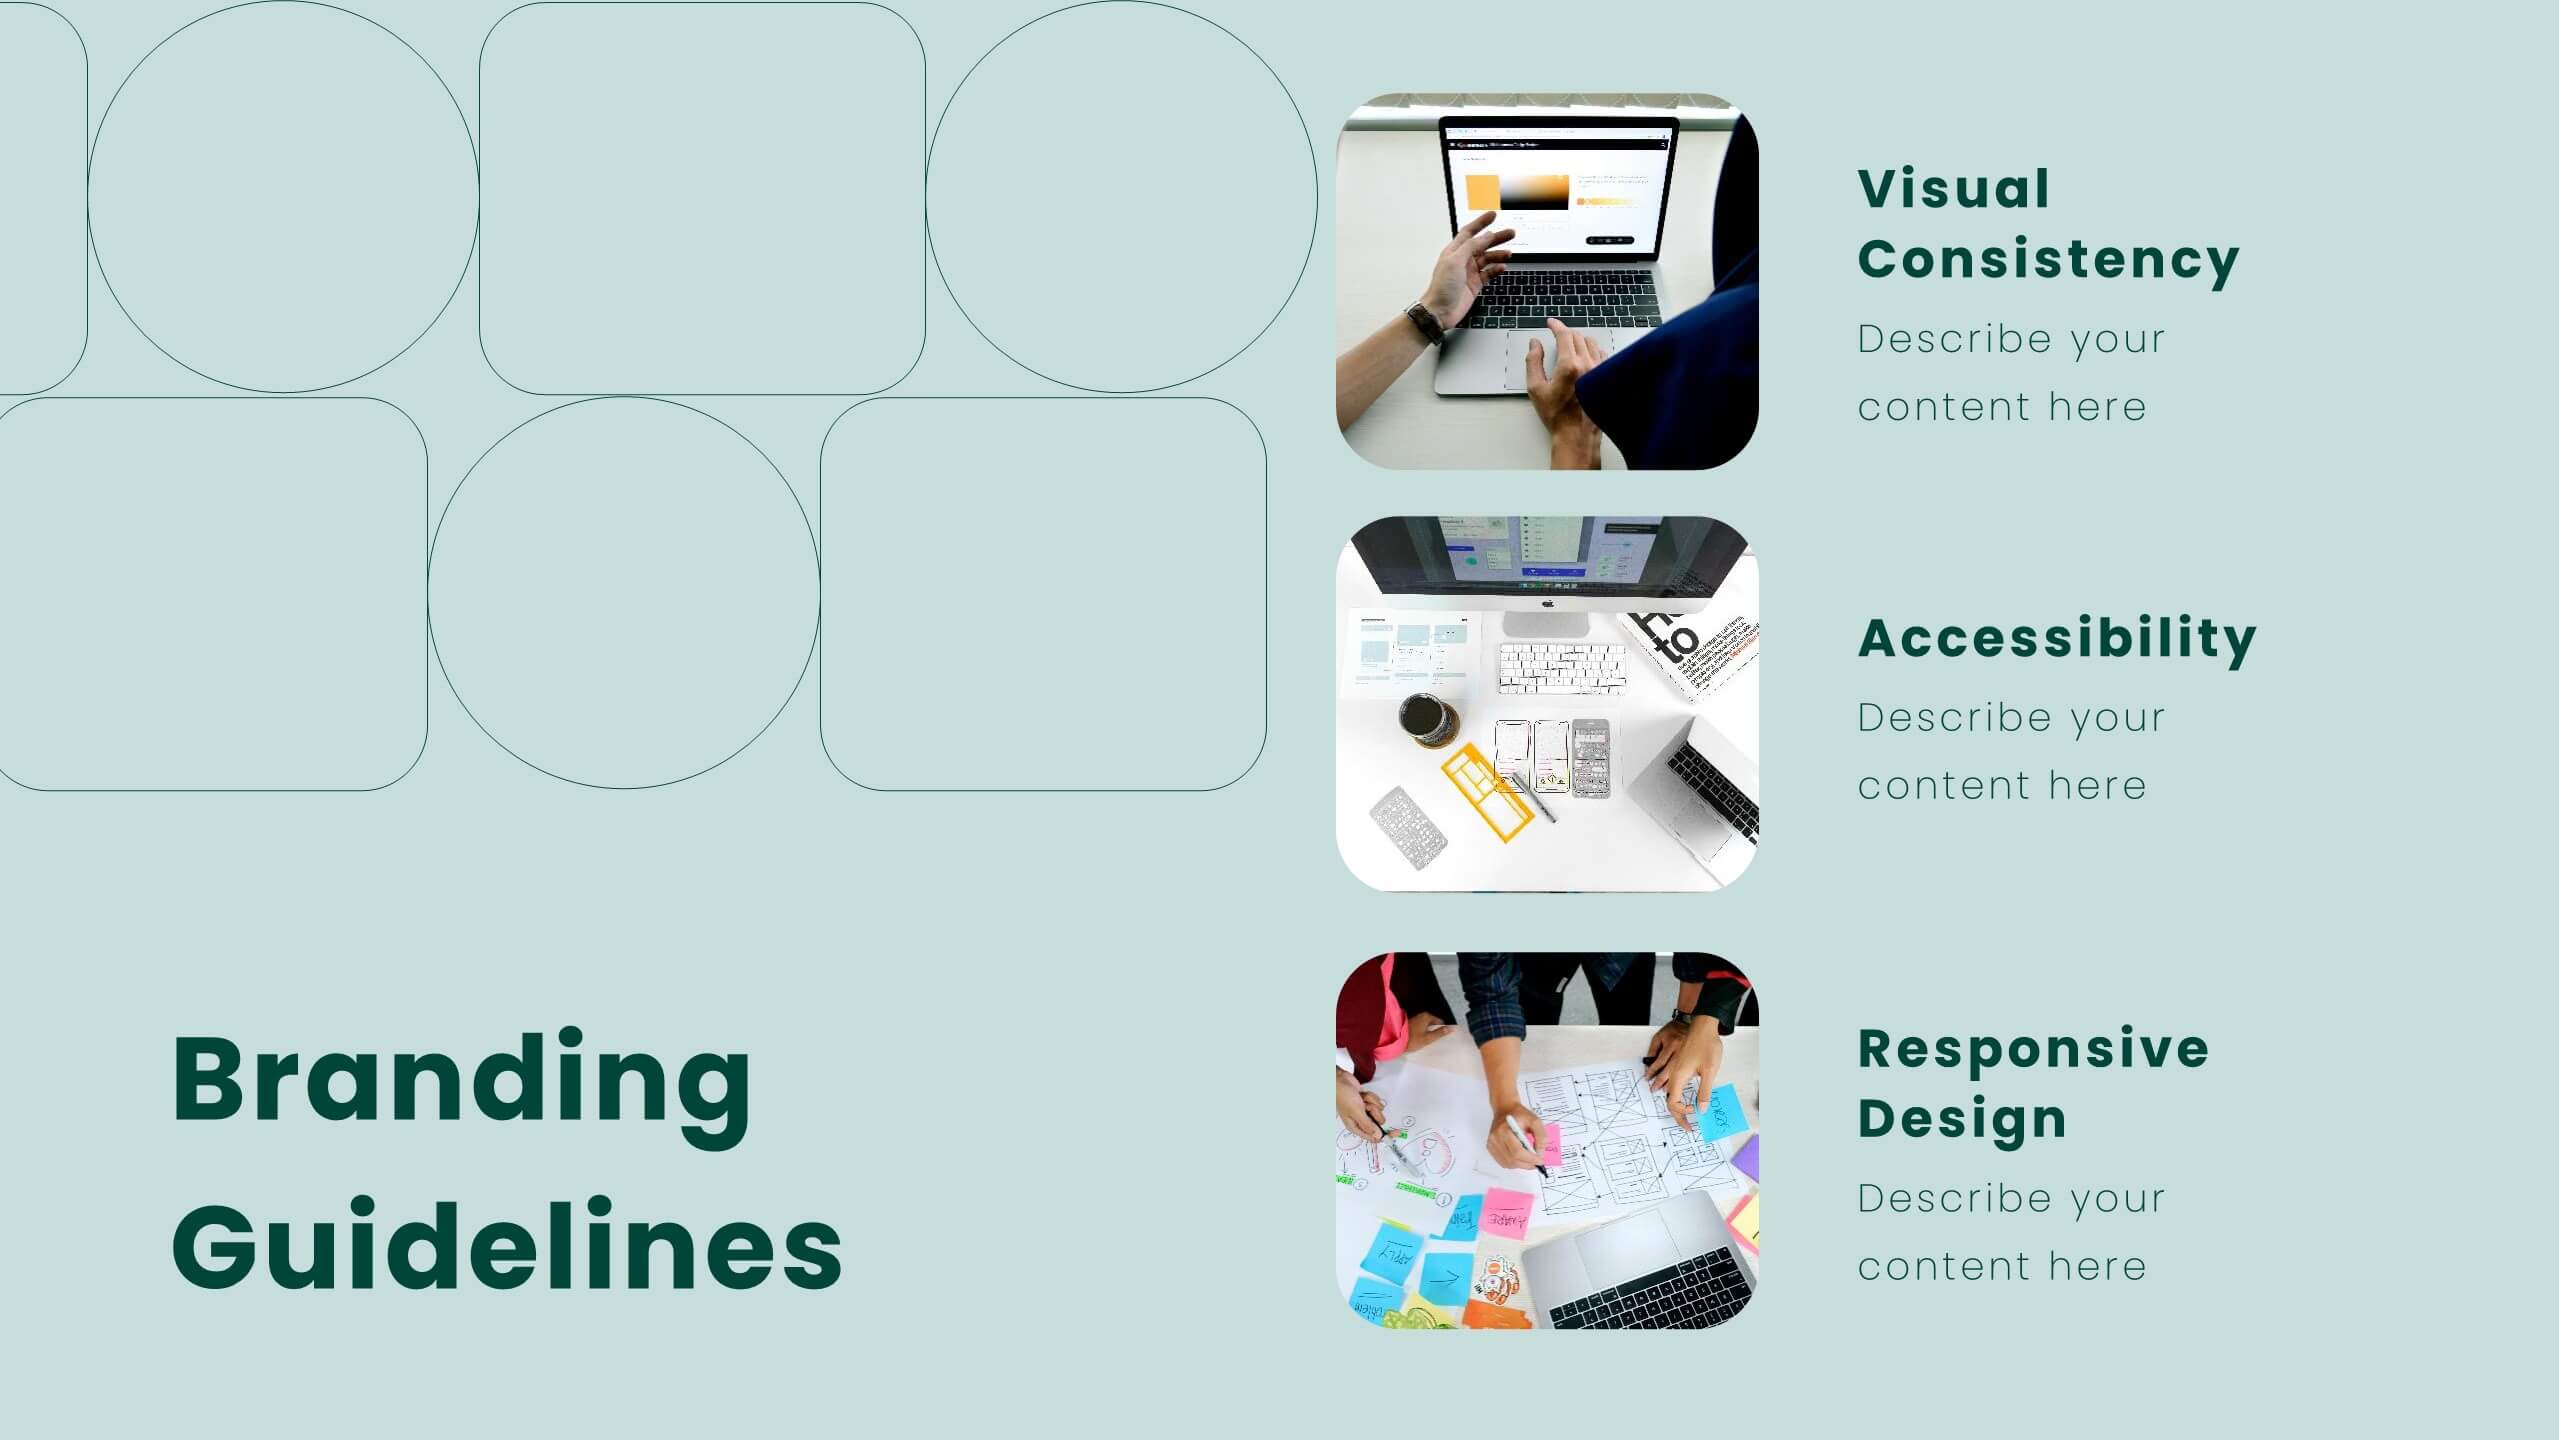
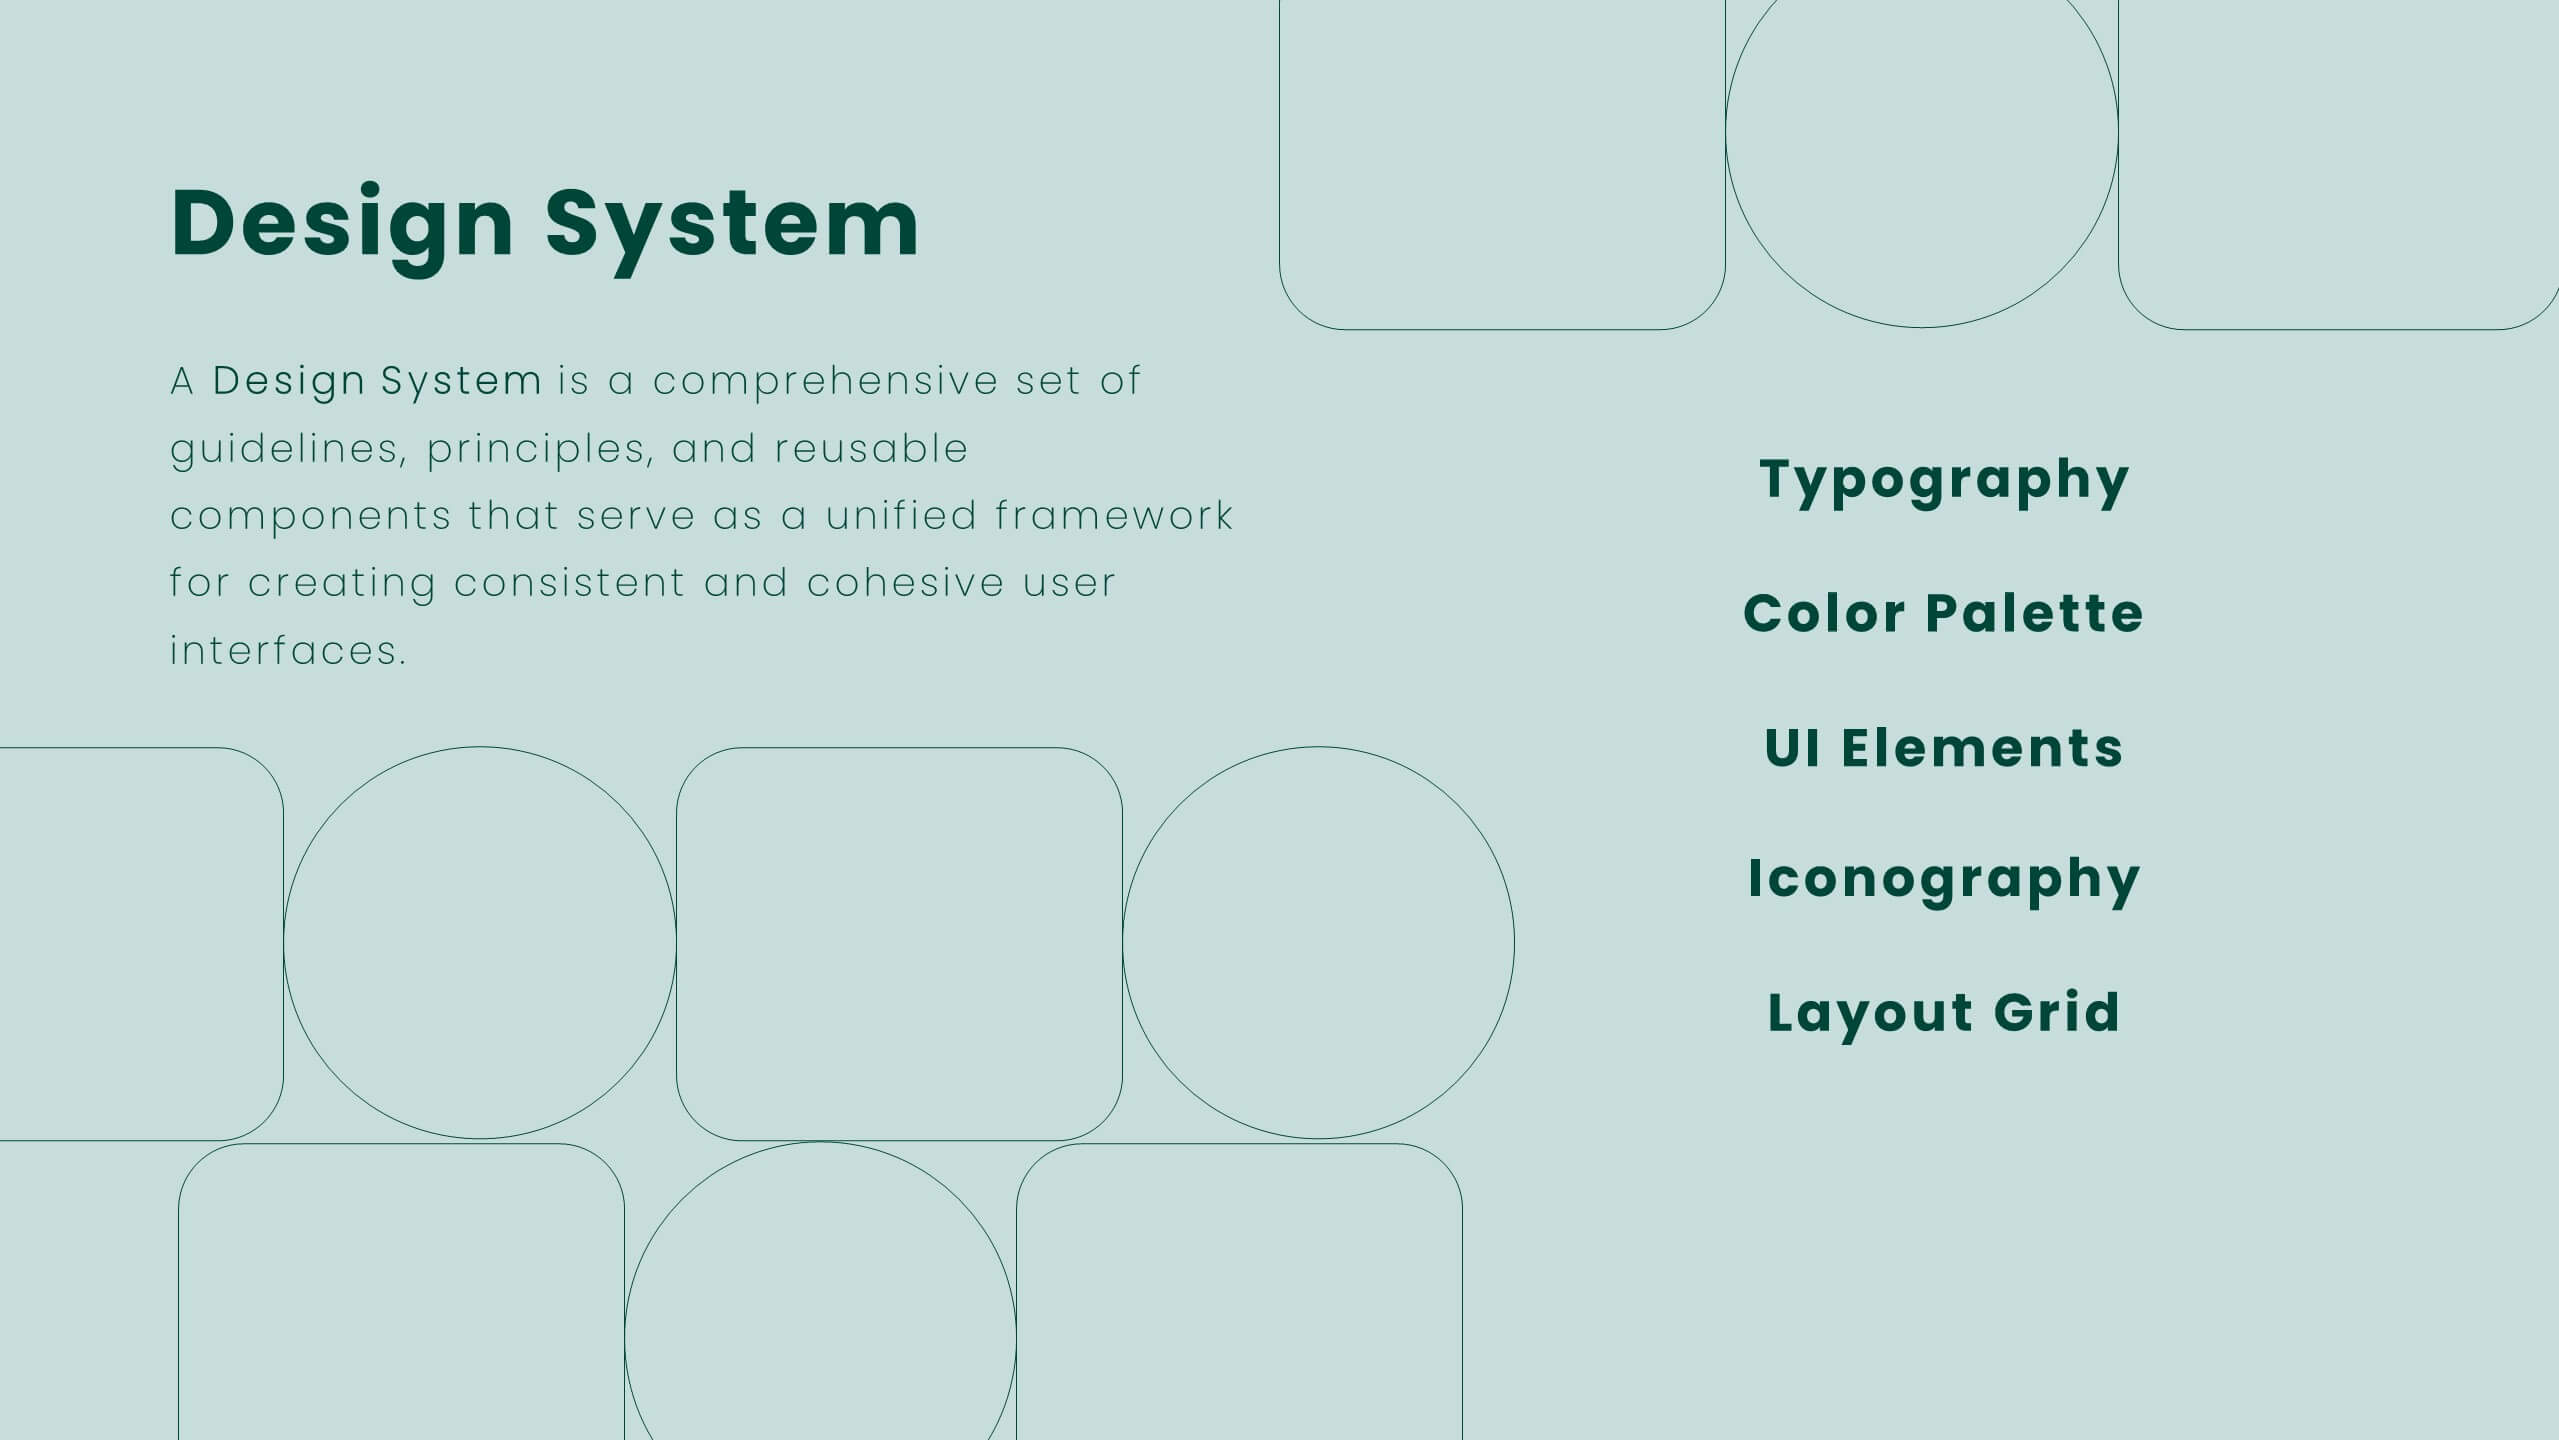
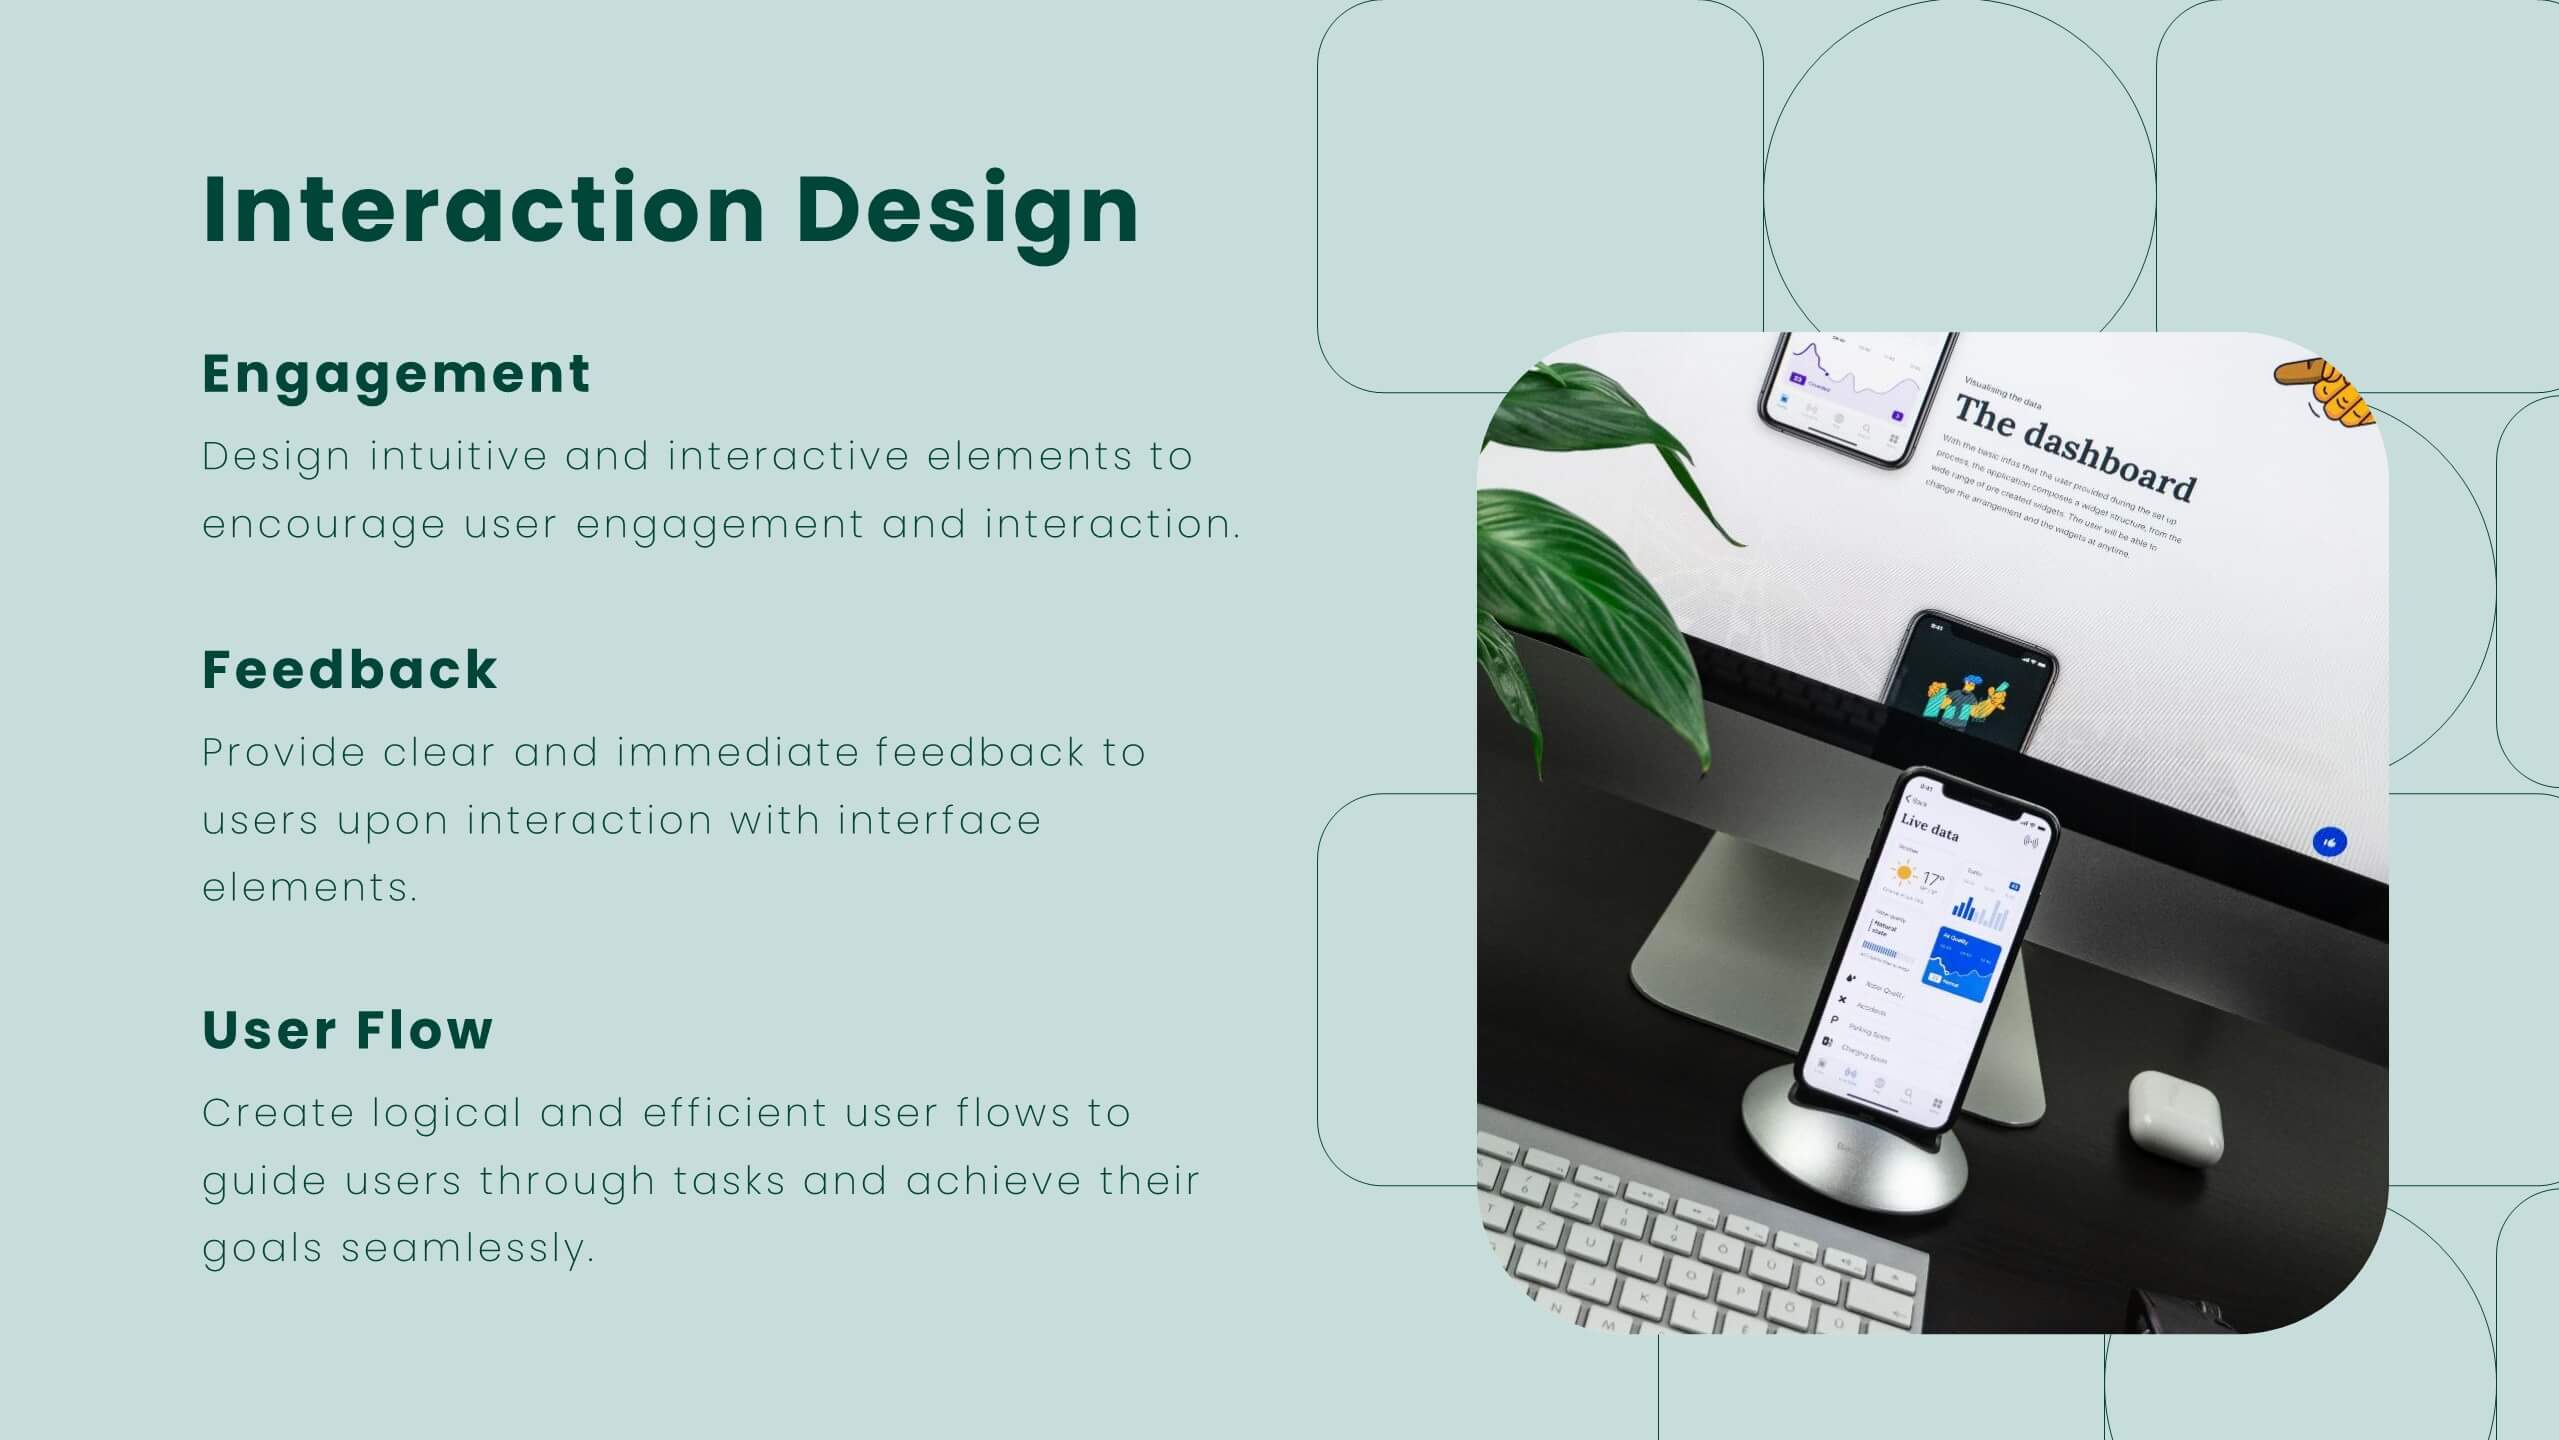
Lumina UX Case Study Presentation
Create compelling UX case studies with this modern template. Cover user research, personas, wireframes, and prototyping. Perfect for showcasing UI design principles, responsive design, and usability guidelines. Highlight feedback, iteration, and project showcase. Compatible with PowerPoint, Keynote, and Google Slides. Elevate your UX presentations and impress stakeholders with clear, detailed insights.


23 diapositivas
Fama Business Idea Pitch Deck Presentation
Present your business idea with this impactful pitch deck, covering key areas like problem statement, solutions, competitive landscape, financials, and growth projections. With a bold design, it effectively showcases your startup’s value proposition. Compatible with PowerPoint, Keynote, and Google Slides for dynamic and professional investor presentations.


7 diapositivas
Project Status Report Infographic Presentation
The importance of project status is related to the ability to monitor and control a project effectively. Project status is essential for effective project management. This template has been designed to help professionals gain more control over their projects. Use this template to enable project stakeholders to communicate, monitor progress, manage risks, make informed decisions, and promote accountability and continuous improvement. You can use this to manage all your projects, tasks and team members effortlessly. This template is available in PowerPoint, Keynote and Google Slides.


5 diapositivas
Scrum Methodology for Project Management Presentation
Visualize your team’s process with this Scrum Methodology for Project Management Template. Featuring dynamic arrow and gear illustrations, this slide helps convey product development cycles, sprint planning, reviews, and retrospectives in a clean, engaging format. Fully editable and ready for PowerPoint, Keynote, and Google Slides.


6 diapositivas
Corporate Foundation and Pillars Presentation
Highlight your company's core principles with this visually impactful pillar-style slide. Designed to illustrate business frameworks, strategies, or guiding values, this layout helps communicate stability and growth. Fully customizable in PowerPoint, Keynote, and Google Slides for seamless brand alignment.


8 diapositivas
Medical Anatomy Study
Deliver engaging medical insights with this professionally designed anatomy slide. Perfect for health education, biology lessons, or healthcare proposals, this layout highlights key internal systems with clean visuals. Editable in PowerPoint, Keynote, and Google Slides—customize the organs, labels, and notes with ease.


6 diapositivas
Financial Summary Infographic
The series presented showcases various slide templates tailored for enhancing sales team strategies and communication. Each slide is crafted to assist sales professionals in detailing team structures, sales goals, performance metrics, and strategic initiatives effectively. Utilizing vibrant color blocks and streamlined design elements, these templates make complex sales data approachable and engaging, facilitating clear and impactful presentations. The collection is designed with adaptability in mind, incorporating elements that can be easily customized to fit different team needs and company branding. These include comparative layouts for benchmarking, timeline formats for showcasing sales cycles, and diagrammatic representations for visualizing sales processes and results. Perfect for internal meetings, sales training sessions, and stakeholder presentations, these templates serve as essential tools for sales leaders to convey their team’s progress, celebrate wins, and strategize for future sales endeavors.


6 diapositivas
Machine Learning and Data Science Presentation
Deliver insights with precision using this data-driven presentation template tailored for machine learning, AI, and analytics topics. Featuring a central hub-and-spoke design, this layout allows you to showcase key components like algorithms, tools, processes, or data sources. Each segment includes clean icons and customizable titles for seamless editing. Ideal for data scientists, tech professionals, and academic presentations. Fully editable in PowerPoint, Keynote, and Google Slides.


10 diapositivas
Corporate Briefing Schedule Agenda
Present your briefing points clearly with the Corporate Briefing Schedule Agenda Presentation. This linear layout uses bold icons, color-coded sections, and connecting lines to outline four key discussion items—ideal for company meetings, timelines, or project updates. Fully editable in PowerPoint, Keynote, and Google Slides.


5 diapositivas
Medical Supplies Infographics
Medical supplies refer to the various equipment, instruments, tools, and consumables that are used in healthcare settings to diagnose, treat, and manage medical conditions. These vertical infographics provide an overview of essential medical supplies used in healthcare settings. They aims to educate and raise awareness about the importance of medical supplies in delivering quality patient care and maintaining a safe healthcare environment. The infographics utilize visually appealing graphics, icons, and color schemes that are relevant to the medical field. These visuals help viewers easily recognize and understand the different types of supplies.


26 diapositivas
Corporate Culture Development Presentation
Embark on a journey to forge a vibrant corporate culture with this expertly designed presentation template, where every slide is a brushstroke in the larger picture of your company’s ethos. Orange and blue hues leap off the screen, infusing each slide with the energy and innovation that are the hallmarks of a thriving workplace. Use this template to paint a vivid narrative of your company’s values, mission, and people. Chart the growth of your organizational climate with data-driven graphics, celebrate the uniqueness of your team with personalized profiles, and map out the future with strategic infographics. This template is not just a collection of slides; it's a canvas for storytelling, perfect for HR visionaries and leaders dedicated to nurturing a workspace that breathes collaboration and creativity. Ready for action in your preferred software, it's the gateway to transforming the abstract concept of company culture into a tangible, inspiring reality.


20 diapositivas
Windsong Sales Proposal Presentation
Craft a persuasive sales proposal with this sleek and professional template. Perfectly suited for communicating your value proposition, this design includes slides for introductions, company overviews, and a detailed service summary. Address critical business factors with sections for target markets, competitive analysis, and clearly defined sales objectives. Highlight your sales process, showcase the team's expertise, and build trust through customer testimonials. Dedicated slides for pricing strategies, promotions, and discounts allow you to present a compelling financial offer. Wrap up with an actionable next steps plan and a feedback section to reinforce client engagement. Fully customizable and compatible with PowerPoint, Google Slides, and Keynote, this template combines modern design with functional layouts to ensure your proposal stands out. Ideal for creating a lasting impression.


7 diapositivas
Daily Puzzle Infographics
Engage and entertain your audience with our daily puzzle infographic. This template is a dynamic and interactive way to present puzzles diagrams to captivate your audience. This template is designed to add an element of fun and engagement to your presentations. The design immediately grabs attention and sparks curiosity. Compatible with Powerpoint, Keynote, and Google Slides. The well-organized layout enables smooth navigation through the infographic. This is perfect for educators, game designers, content creators, or anyone seeking to add an interactive and entertaining element to their presentations.


7 diapositivas
Break Even Sales Infographic
Break-even analysis is a financial tool used by businesses to determine the point at which total revenue equals total costs, resulting in neither profit nor loss. This infographic template breaks down the intricacies of break-even analysis, providing a powerful visual aid to understand when your venture turns profitable. Compatible with Powerpoint, Keynote, and Google Slides. Designed to illuminate the journey from cost recovery to profitability with clarity and boldness. This template showcases the break-even point graphically, representing the stage where total revenue equals total costs, and the venture moves from loss to gain.


5 diapositivas
Business Report Summary Slide Presentation
Deliver key metrics and insights with confidence using this Business Report Summary Slide. Featuring segmented graphs, percentage indicators, and a 6-part breakdown, this layout helps you highlight performance trends and action items clearly. Ideal for reporting, monthly reviews, or executive briefings. Fully editable in PowerPoint, Keynote, and Google Slides.