


Características


¿Tienes alguna pregunta?
Recomendar


6 diapositivas
Strategic Project Proposal Overview
Present your project priorities with clarity using this bold and colorful Strategic Project Proposal slide. With five stacked segments, it’s ideal for outlining phases, features, or deliverables in a structured format. Fully editable in PowerPoint, Keynote, and Google Slides to suit any industry or workflow.
6 diapositivas
Sales Activity Tracking Presentation
Stay on top of performance metrics with the Sales Activity Tracking Presentation. This structured table layout helps you display key figures like sales numbers, targets, percentages, and totals with ease. Perfect for performance reviews, sales updates, and executive reports. Fully editable in Canva, PowerPoint, Google Slides, and Keynote.


6 diapositivas
5 Forces Model Business Analysis Presentation
Showcase your business insights with a bold, flowing design that makes each competitive force easy to compare and understand. This presentation helps you break down market pressures, highlight strategic opportunities, and communicate analysis with clarity and confidence. Fully editable and compatible with PowerPoint, Keynote, and Google Slides.


5 diapositivas
Marketing Strategies Infographics
Marketing Strategies refer to the plans and tactics implemented by businesses and organizations to promote their products, services, or brand to their target audience and achieve their marketing objectives. These infographics focuses on various marketing strategies used by businesses to promote their products or services. This provides a comprehensive overview of key marketing strategies, their benefits, and how they can be implemented effectively. These will help you convey the key concepts and benefits of various marketing strategies. Fully compatible with Powerpoint, Keynote, and Google Slides.


5 diapositivas
Digital Strategy and Online Campaigns Presentation
Aim for success with the Digital Strategy and Online Campaigns Presentation. This template uses a dynamic target and arrow graphic to represent strategic goals, campaign directions, and marketing focus. Ideal for showcasing KPIs, digital initiatives, and performance insights. Fully customizable in PowerPoint, Keynote, and Google Slides.


4 diapositivas
Executive Summary Business Presentation
Summarize key business insights effectively with this executive summary template! Designed to present an overview of your strategy, problem statement, solutions, and conclusions in a structured format, this layout ensures clarity and impact. Ideal for reports, proposals, and business plans. Fully customizable and compatible with PowerPoint, Keynote, and Google Slides.


6 diapositivas
Alphabet Infographic and Typography Layout Presentation
Showcase key information with visual flair using this Alphabet Infographic and Typography Layout. The bold letter "A" is constructed from geometric shapes, each linked to editable text areas—ideal for presenting 6 grouped ideas or segmented data. Fully compatible with PowerPoint, Canva, and Google Slides. Perfect for modern, clean presentations.


5 diapositivas
Business Process Checklist Presentation
Ensure smooth workflows with the Business Process Checklist template. This visually structured layout simplifies process tracking, highlighting key steps and completion percentages. Perfect for project managers and teams looking to optimize efficiency. Fully editable and compatible with PowerPoint, Keynote, and Google Slides for easy customization and seamless presentation.


6 diapositivas
Digital Marketing Campaign Strategy Presentation
Present your marketing flow with clarity using the Digital Marketing Campaign Strategy Presentation. This dynamic arrow-style layout is ideal for outlining five key phases of a digital campaign—from planning and promotion to tracking results. Fully customizable in Canva, PowerPoint, Keynote, and Google Slides to fit your campaign strategy.


23 diapositivas
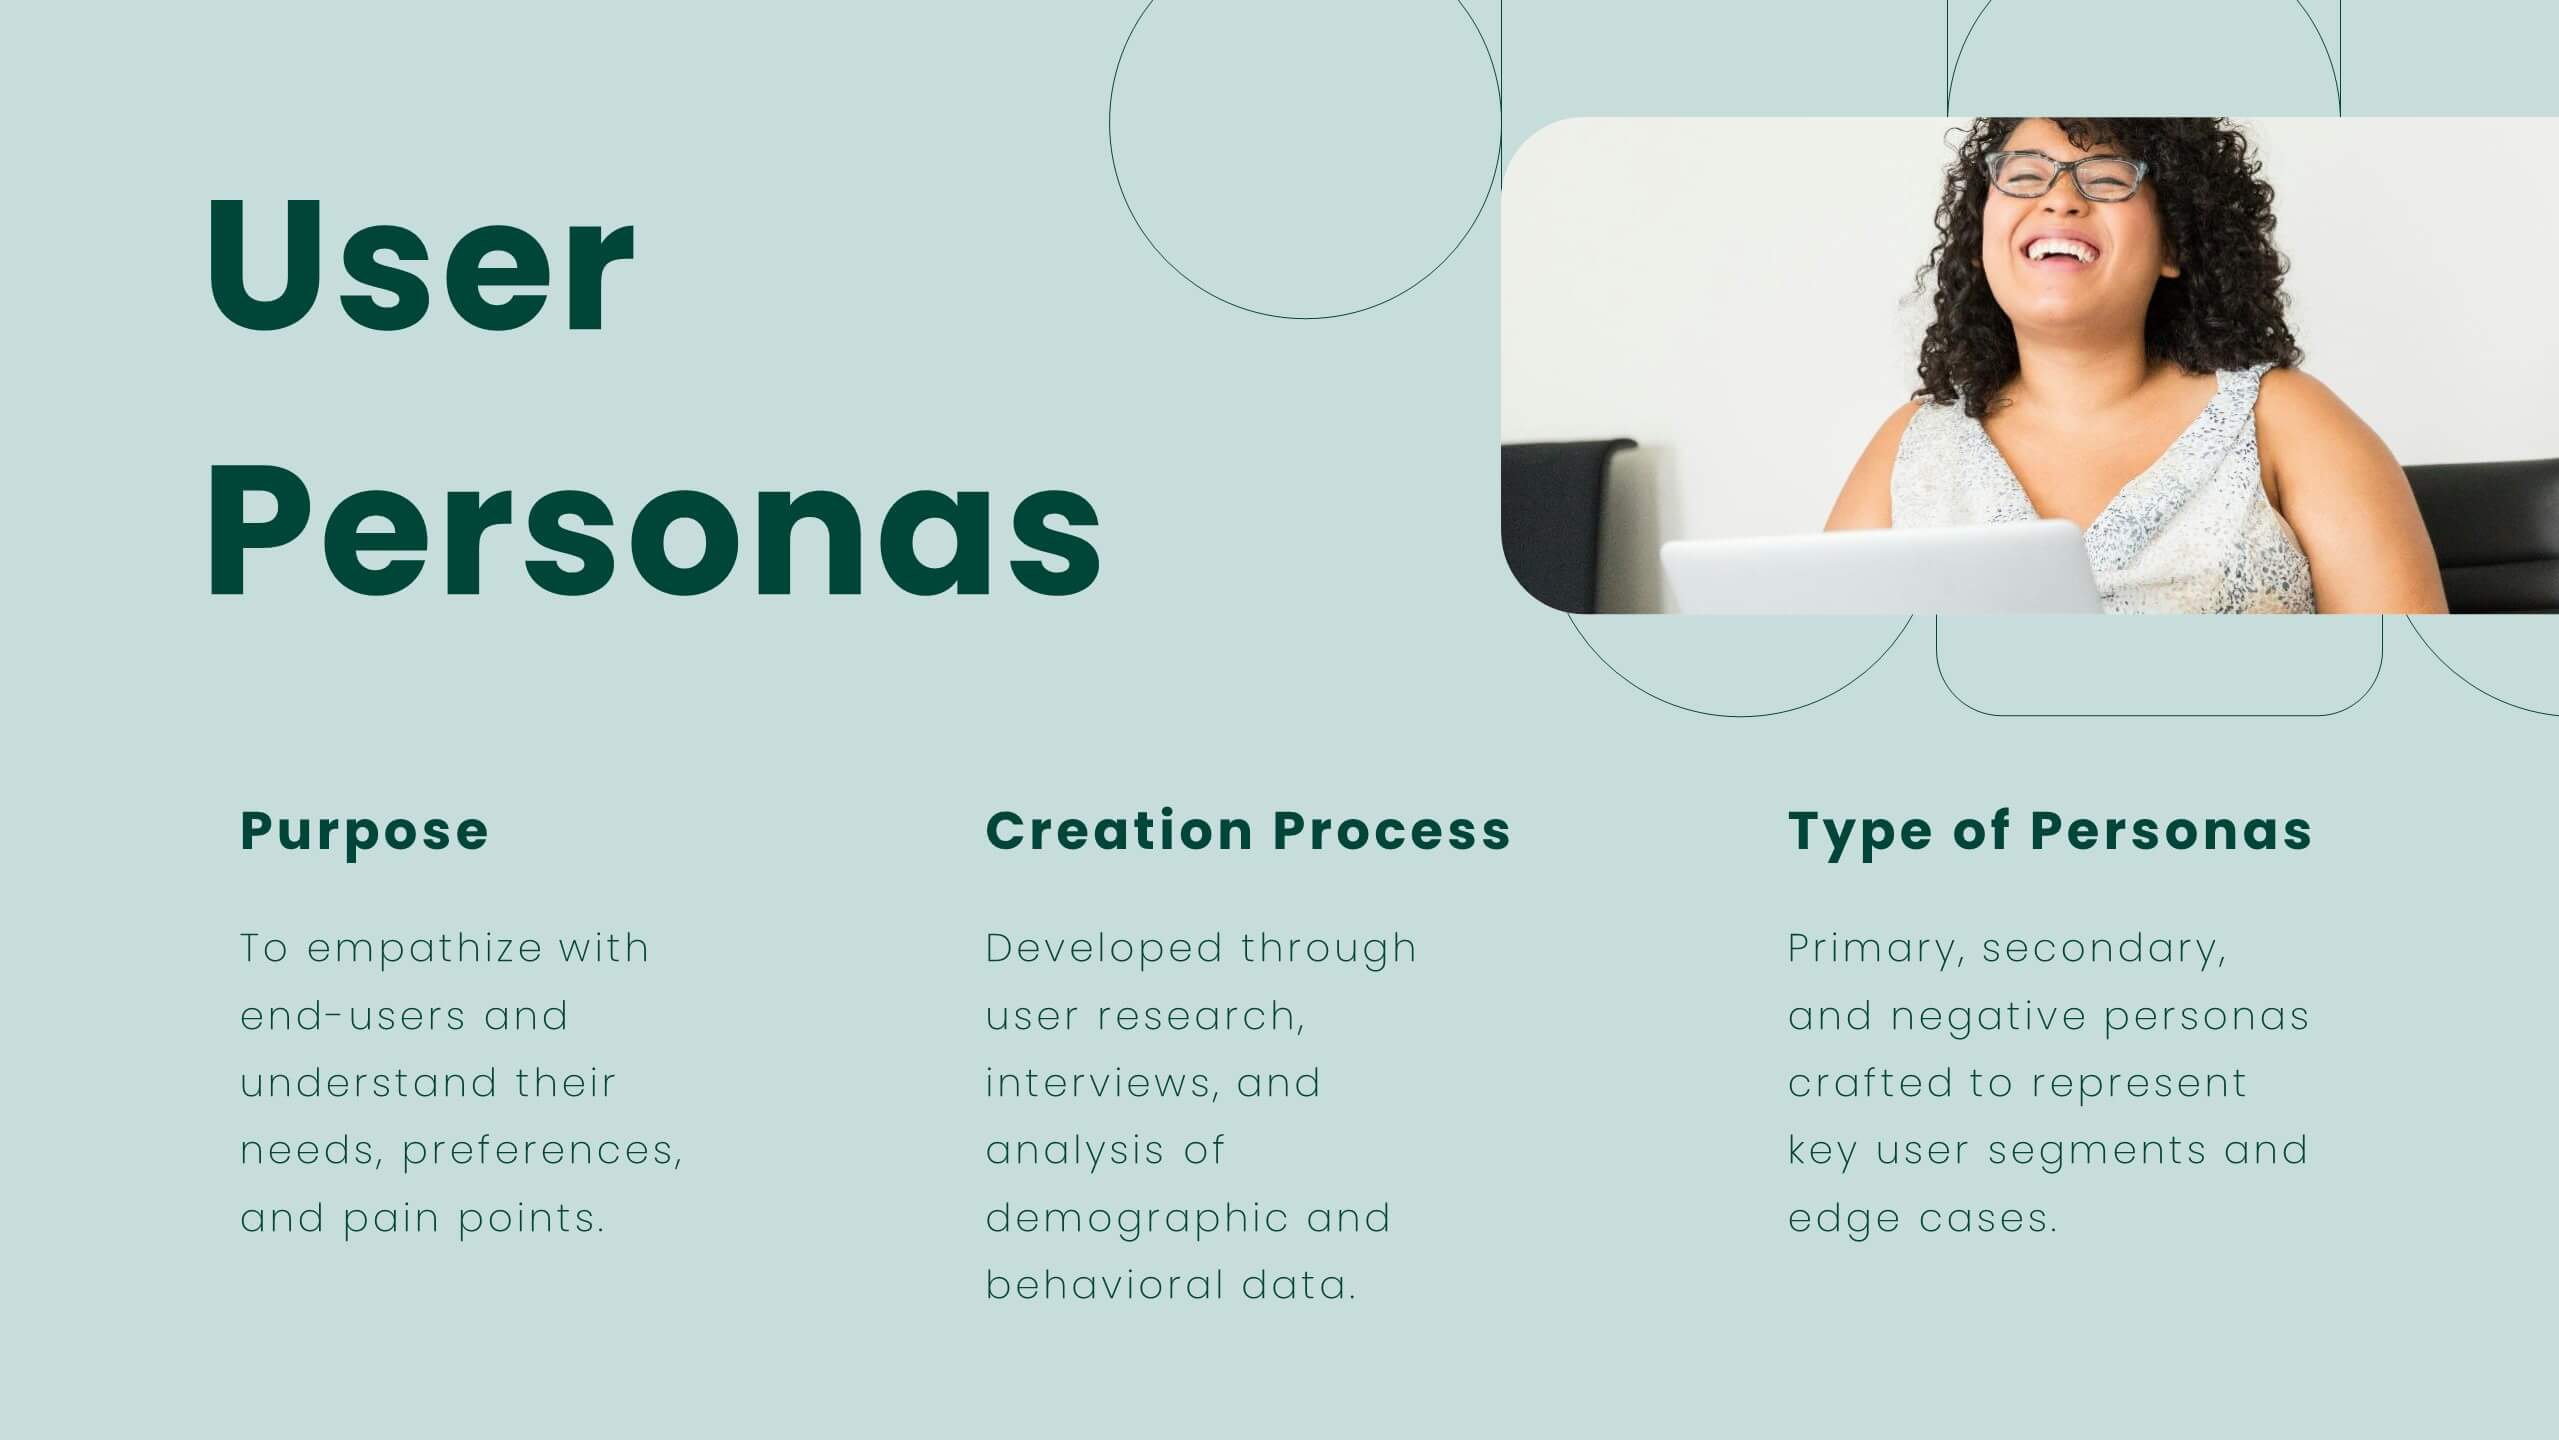
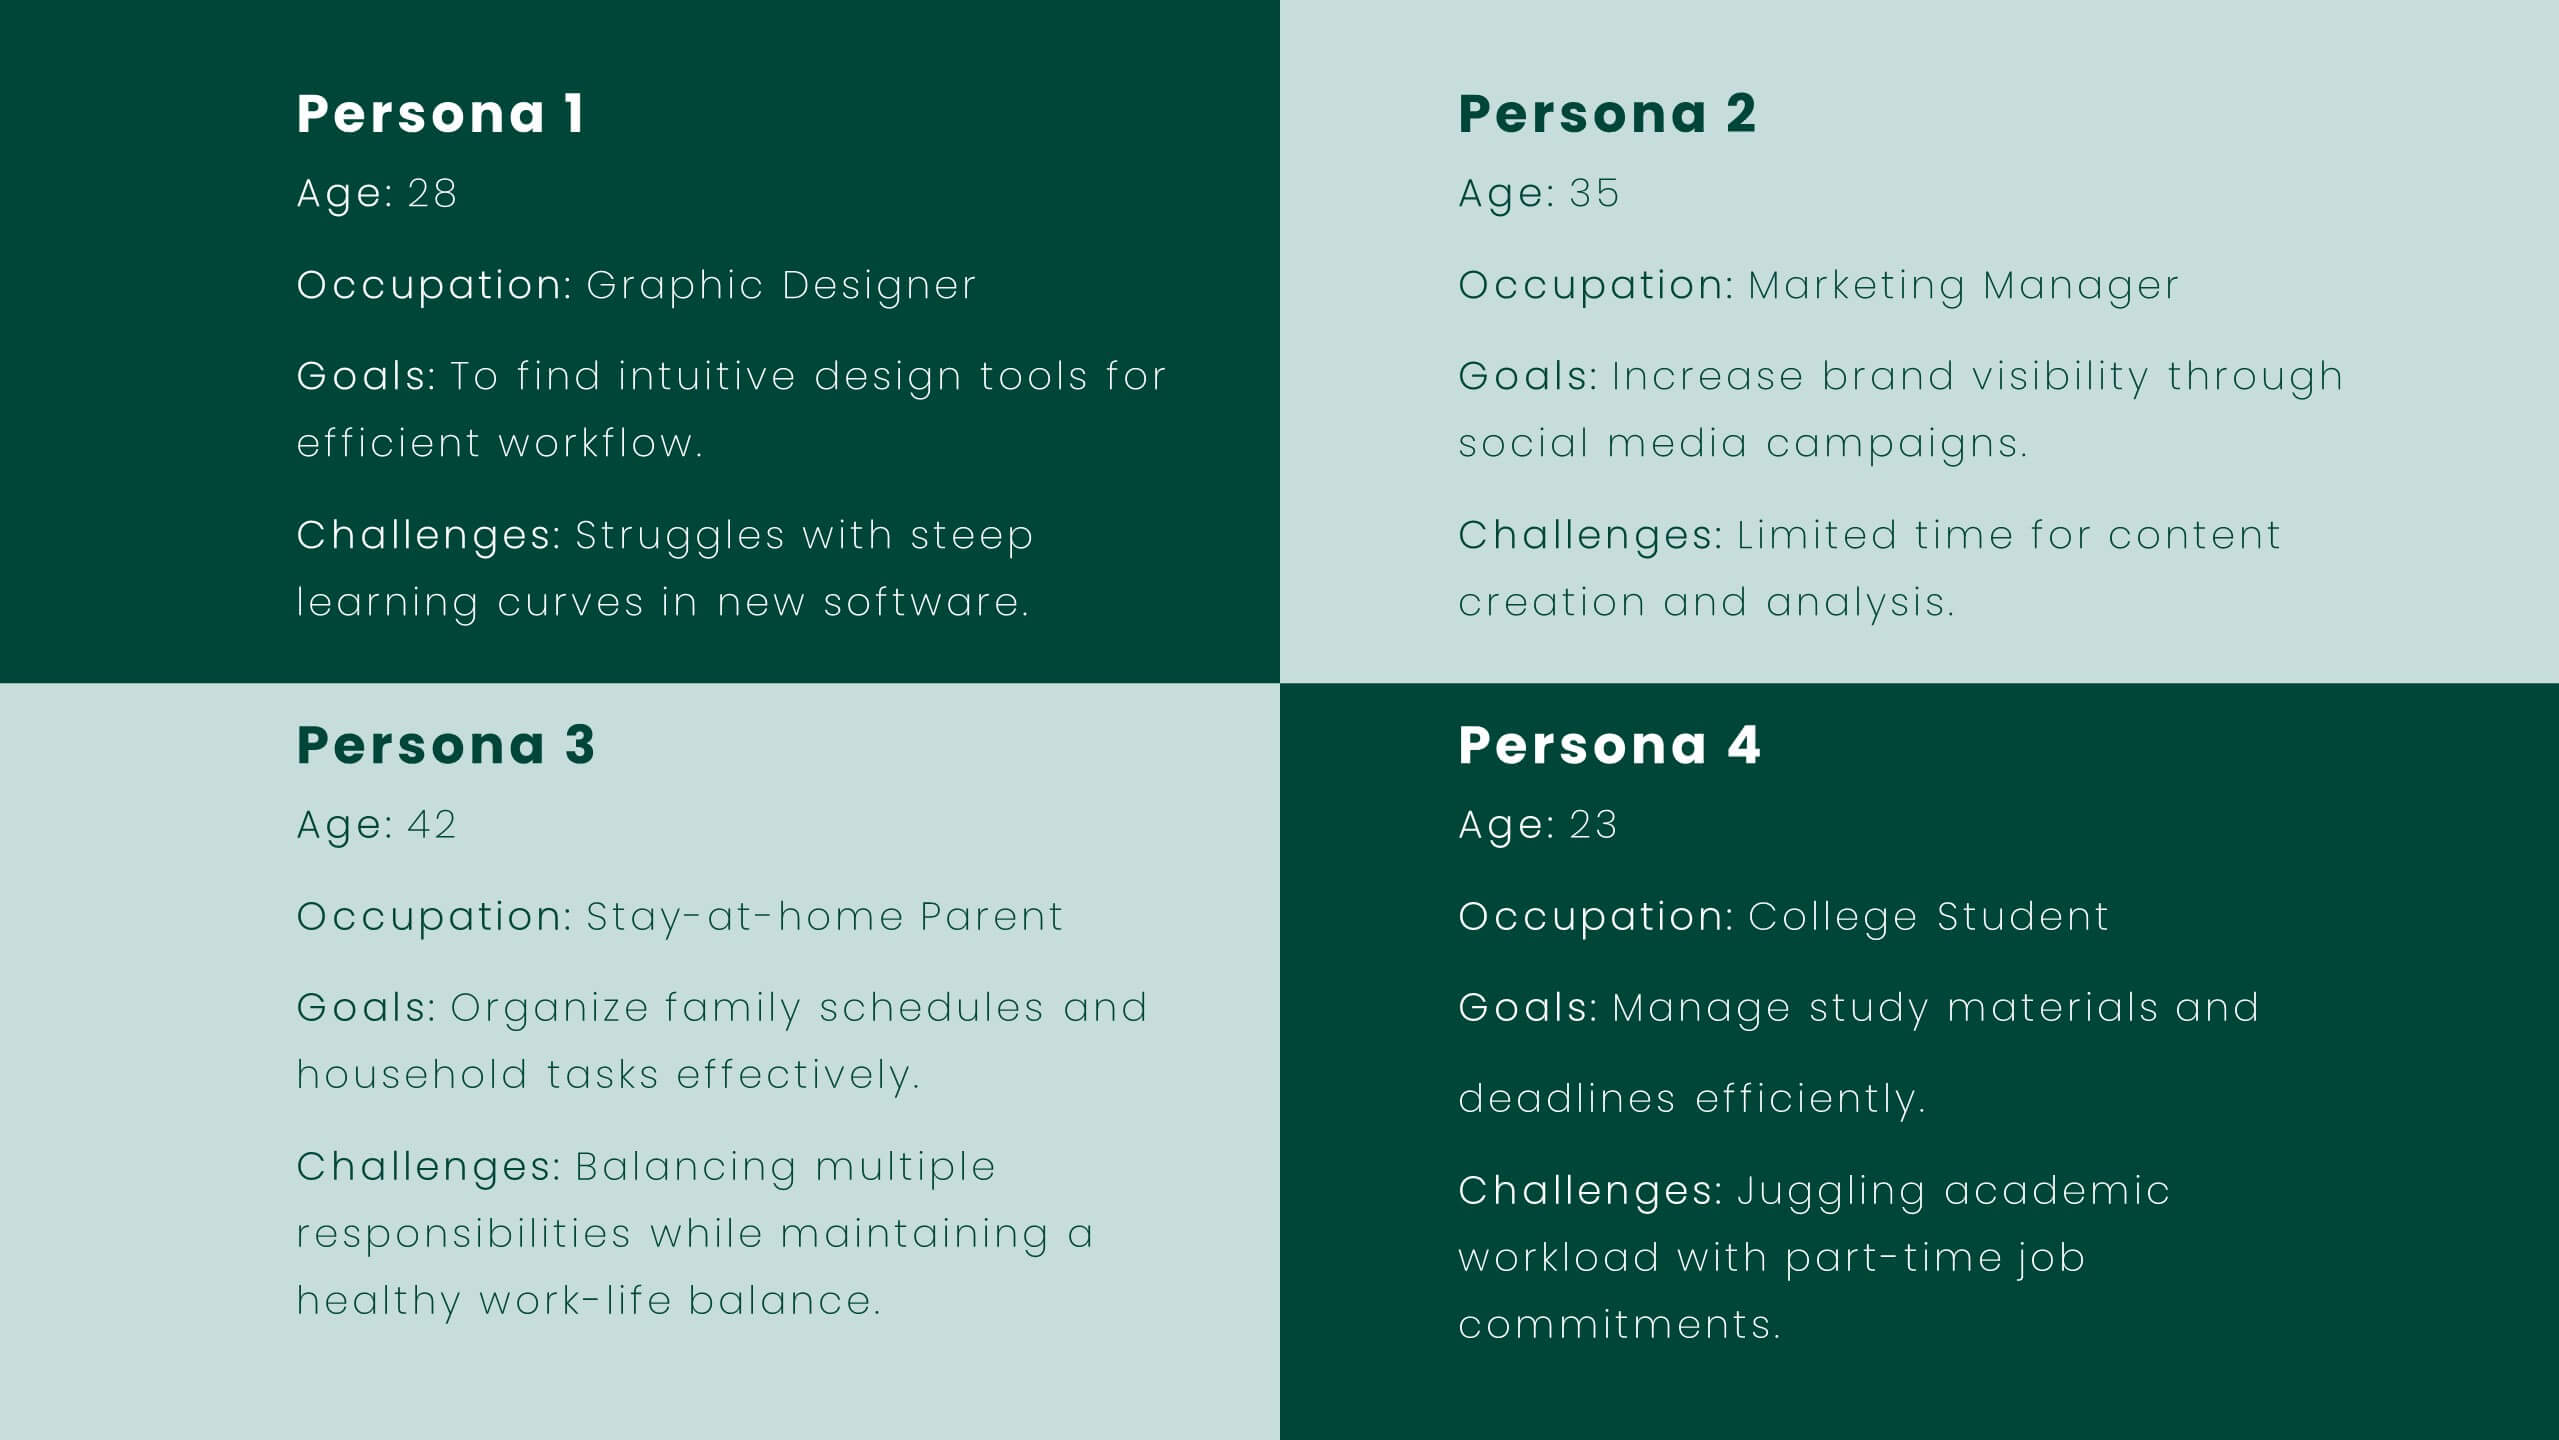
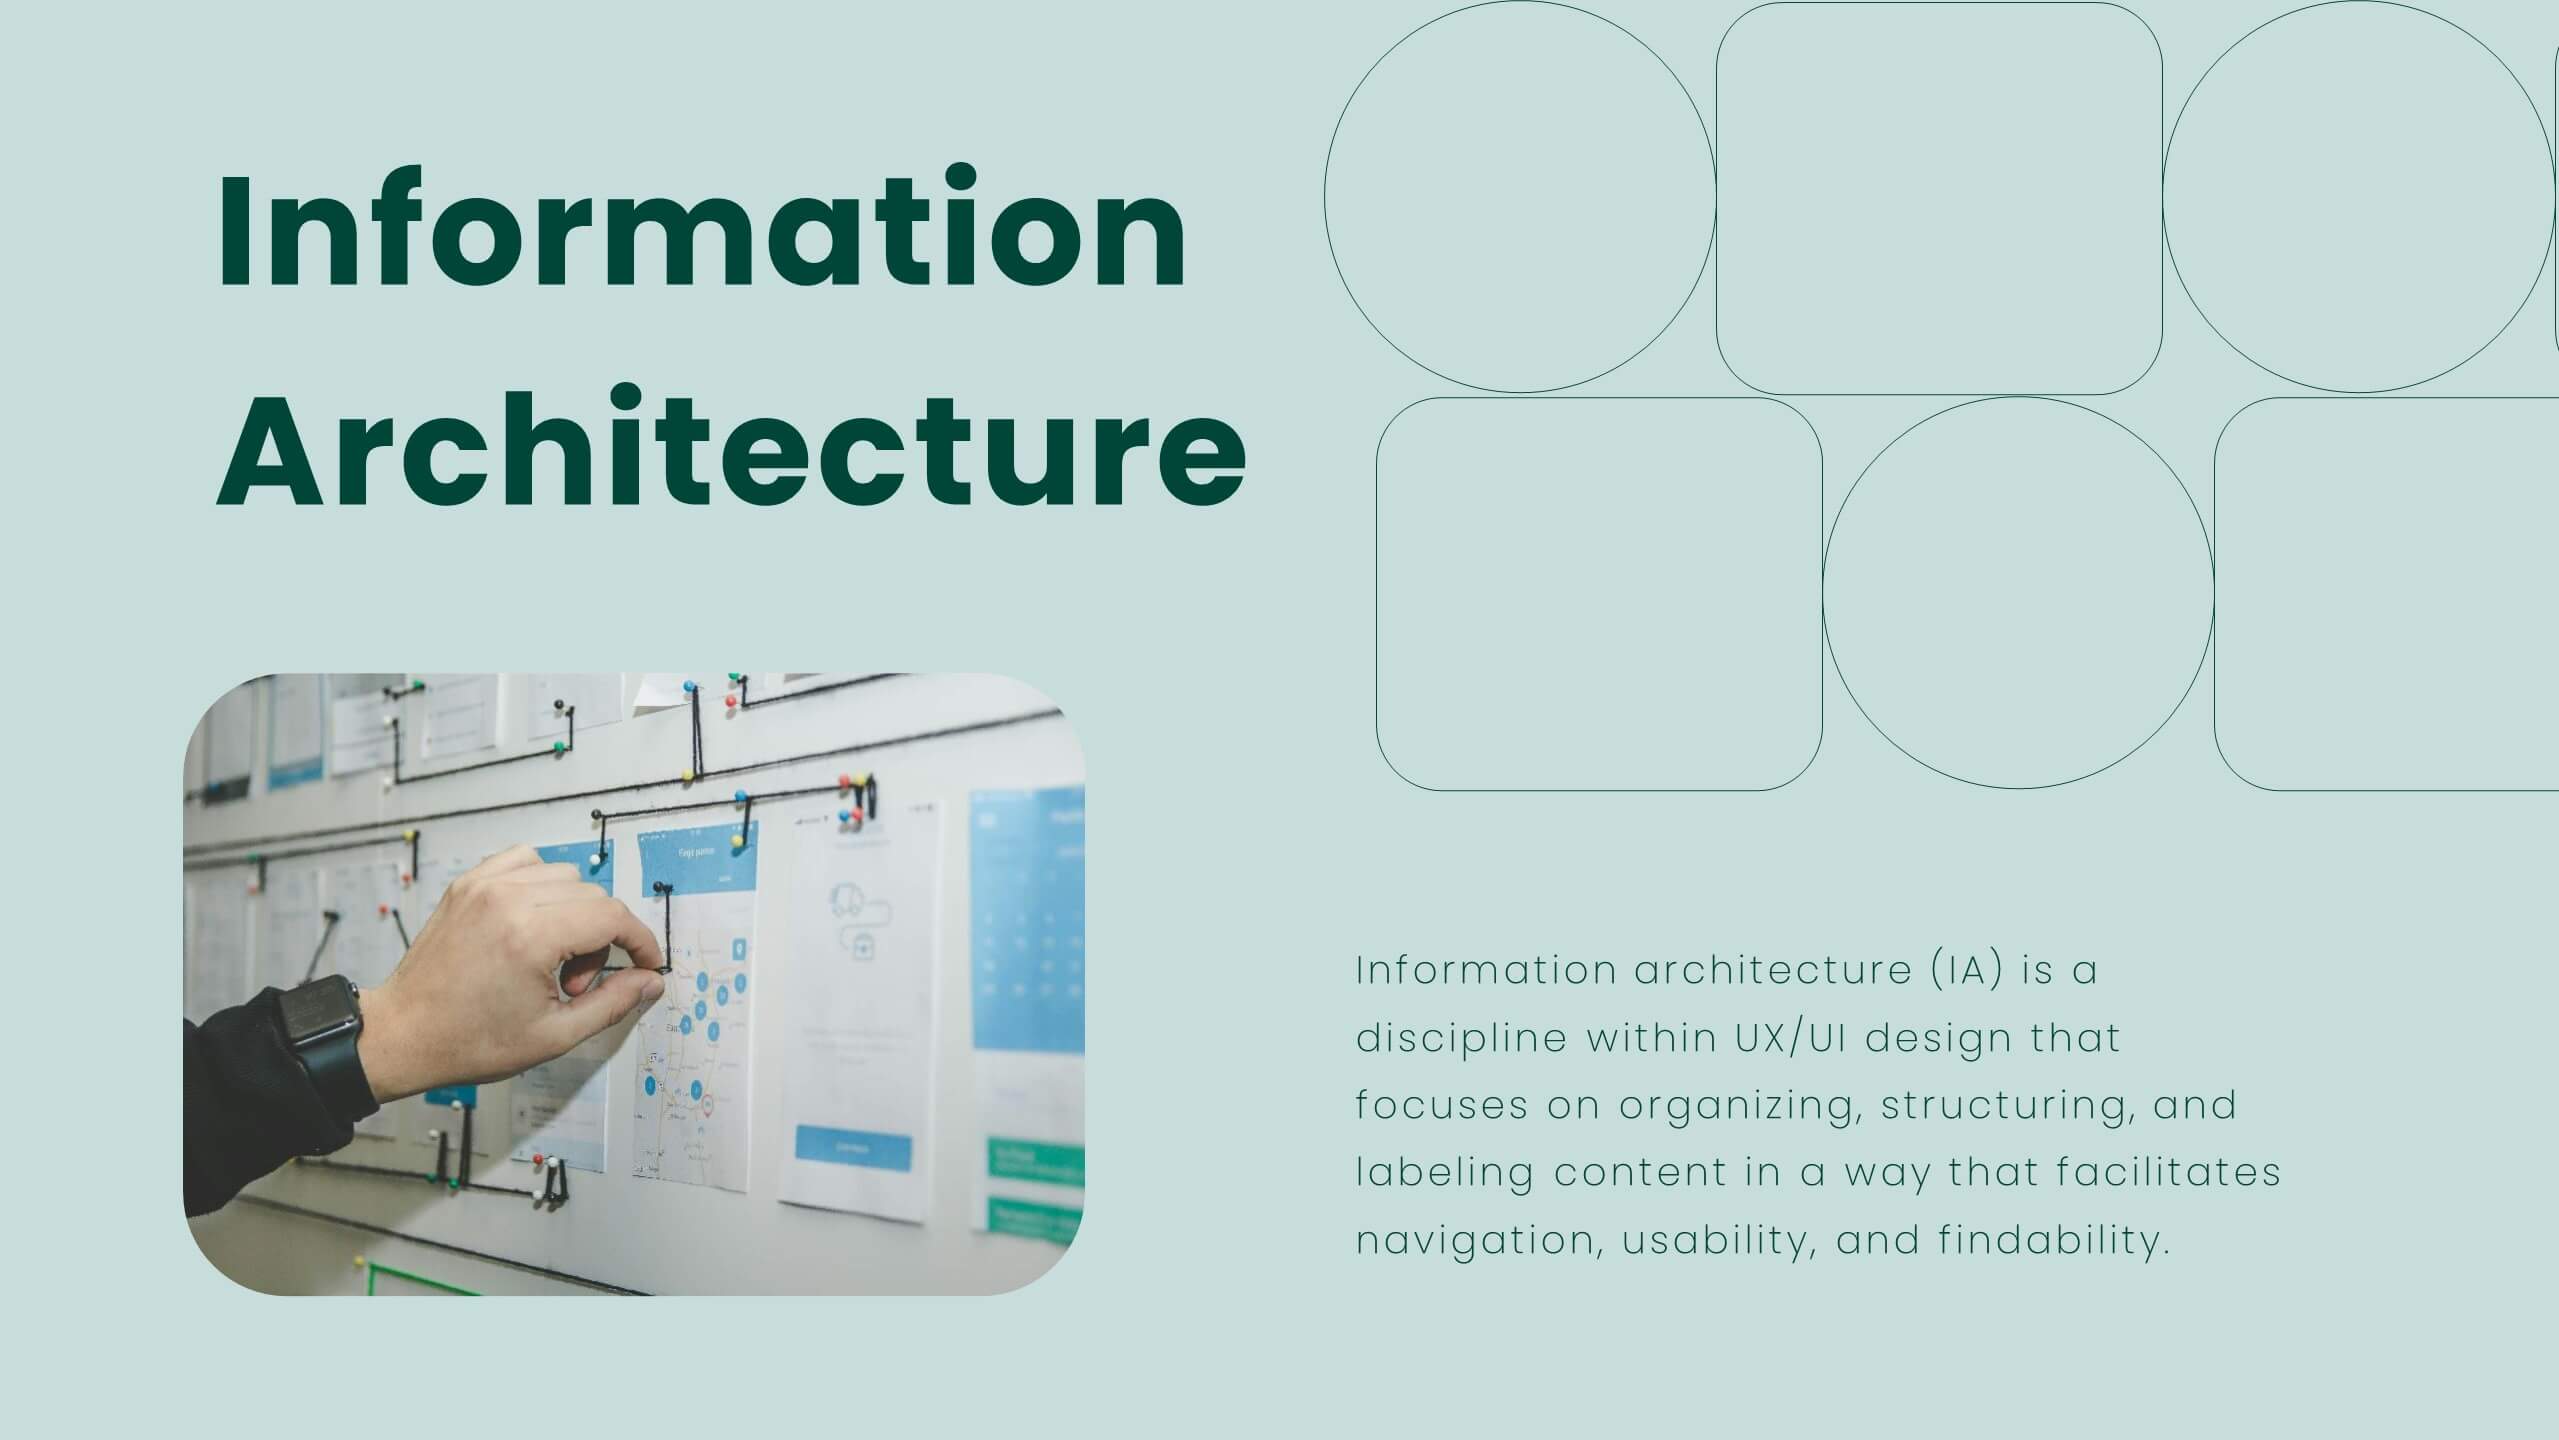
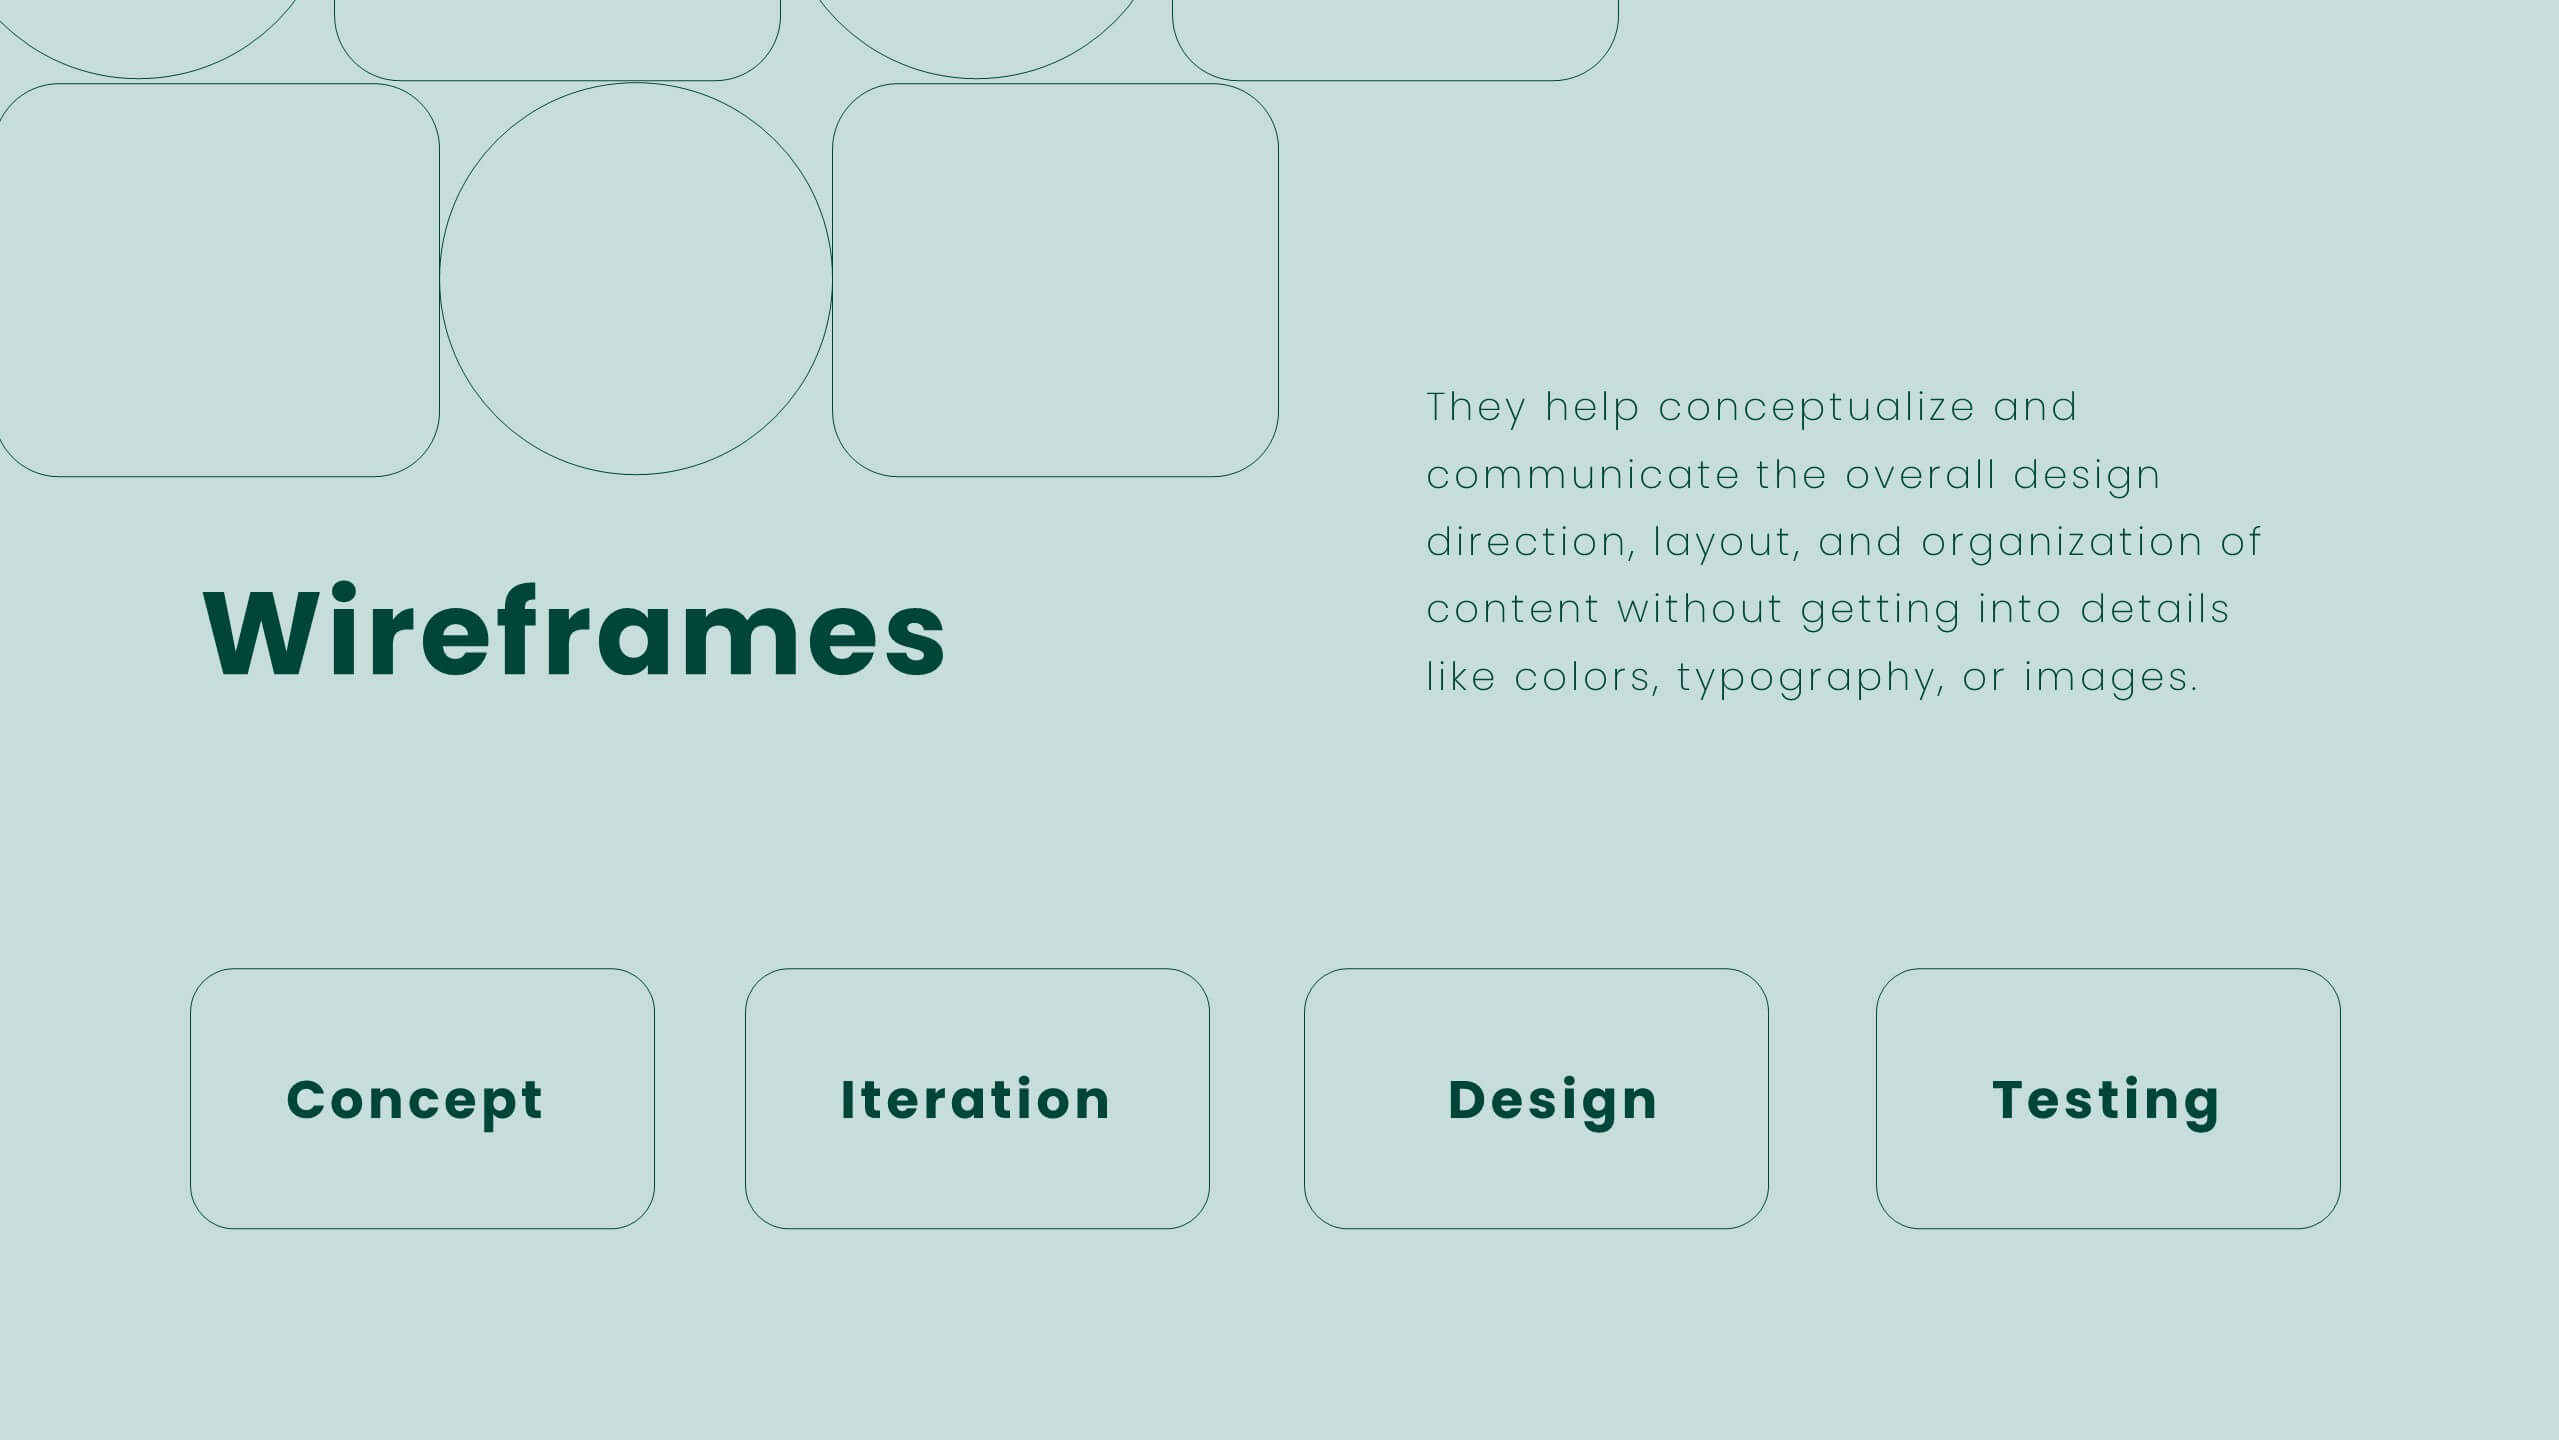
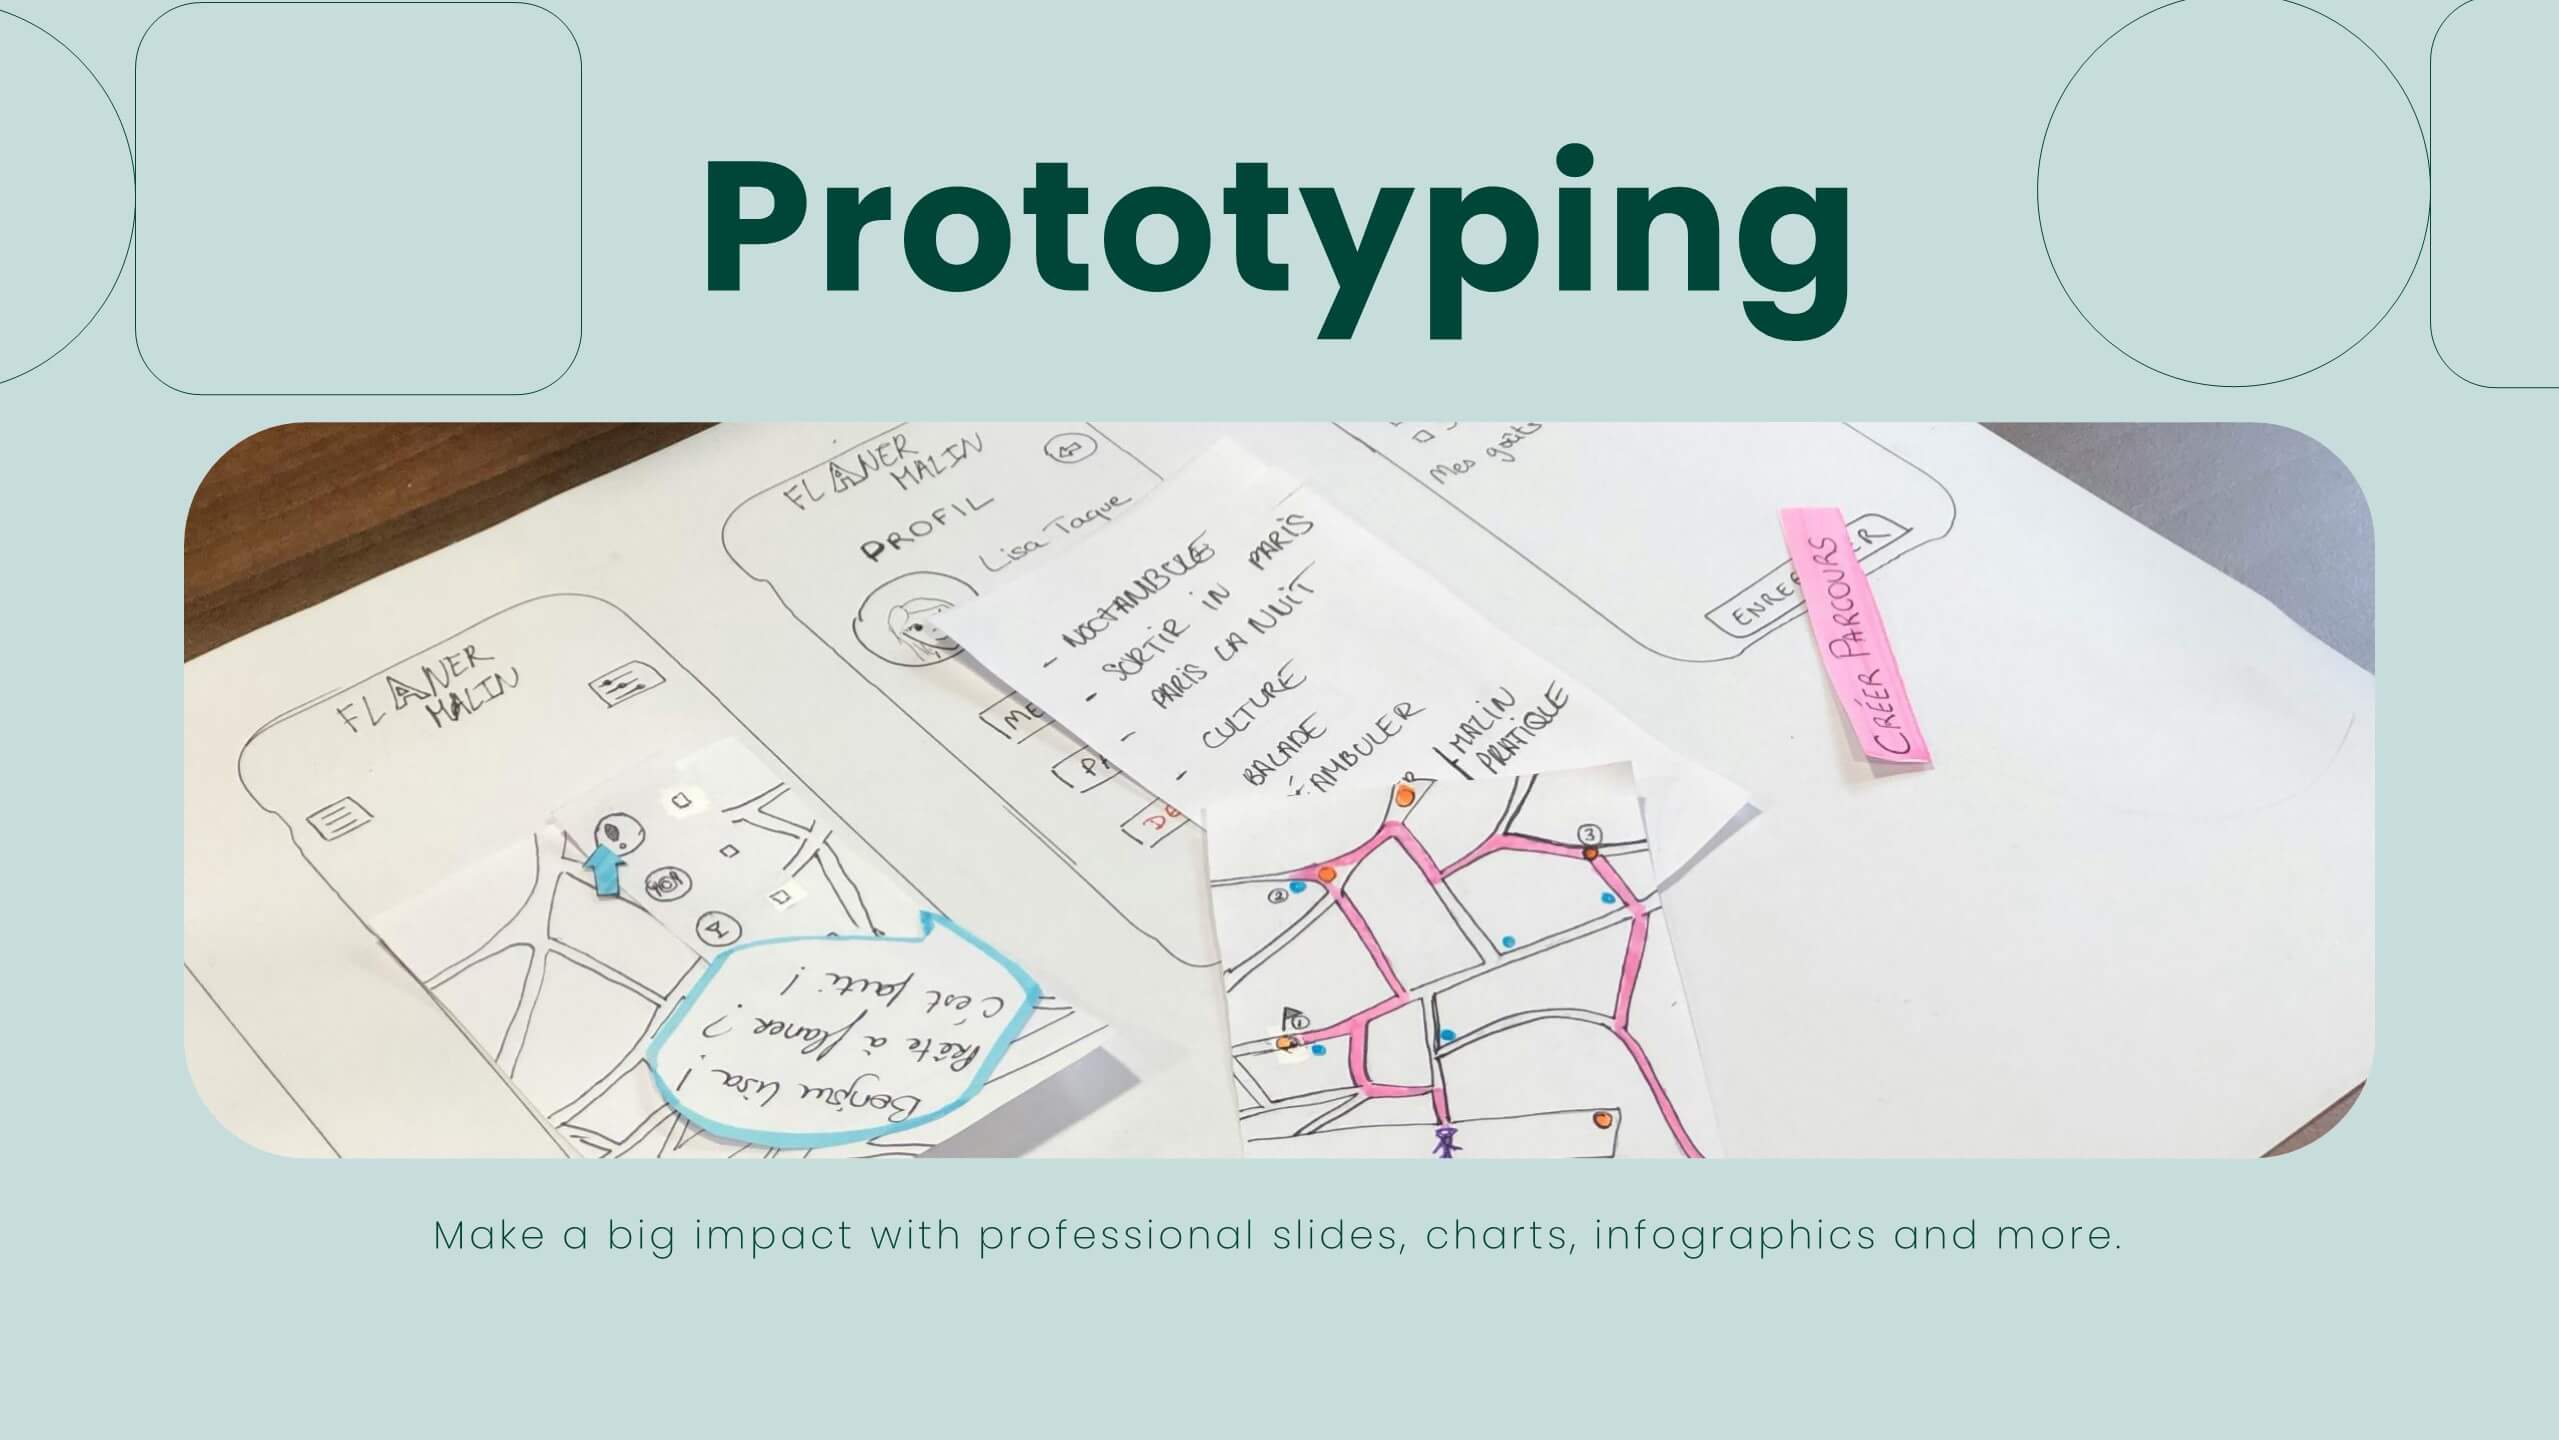
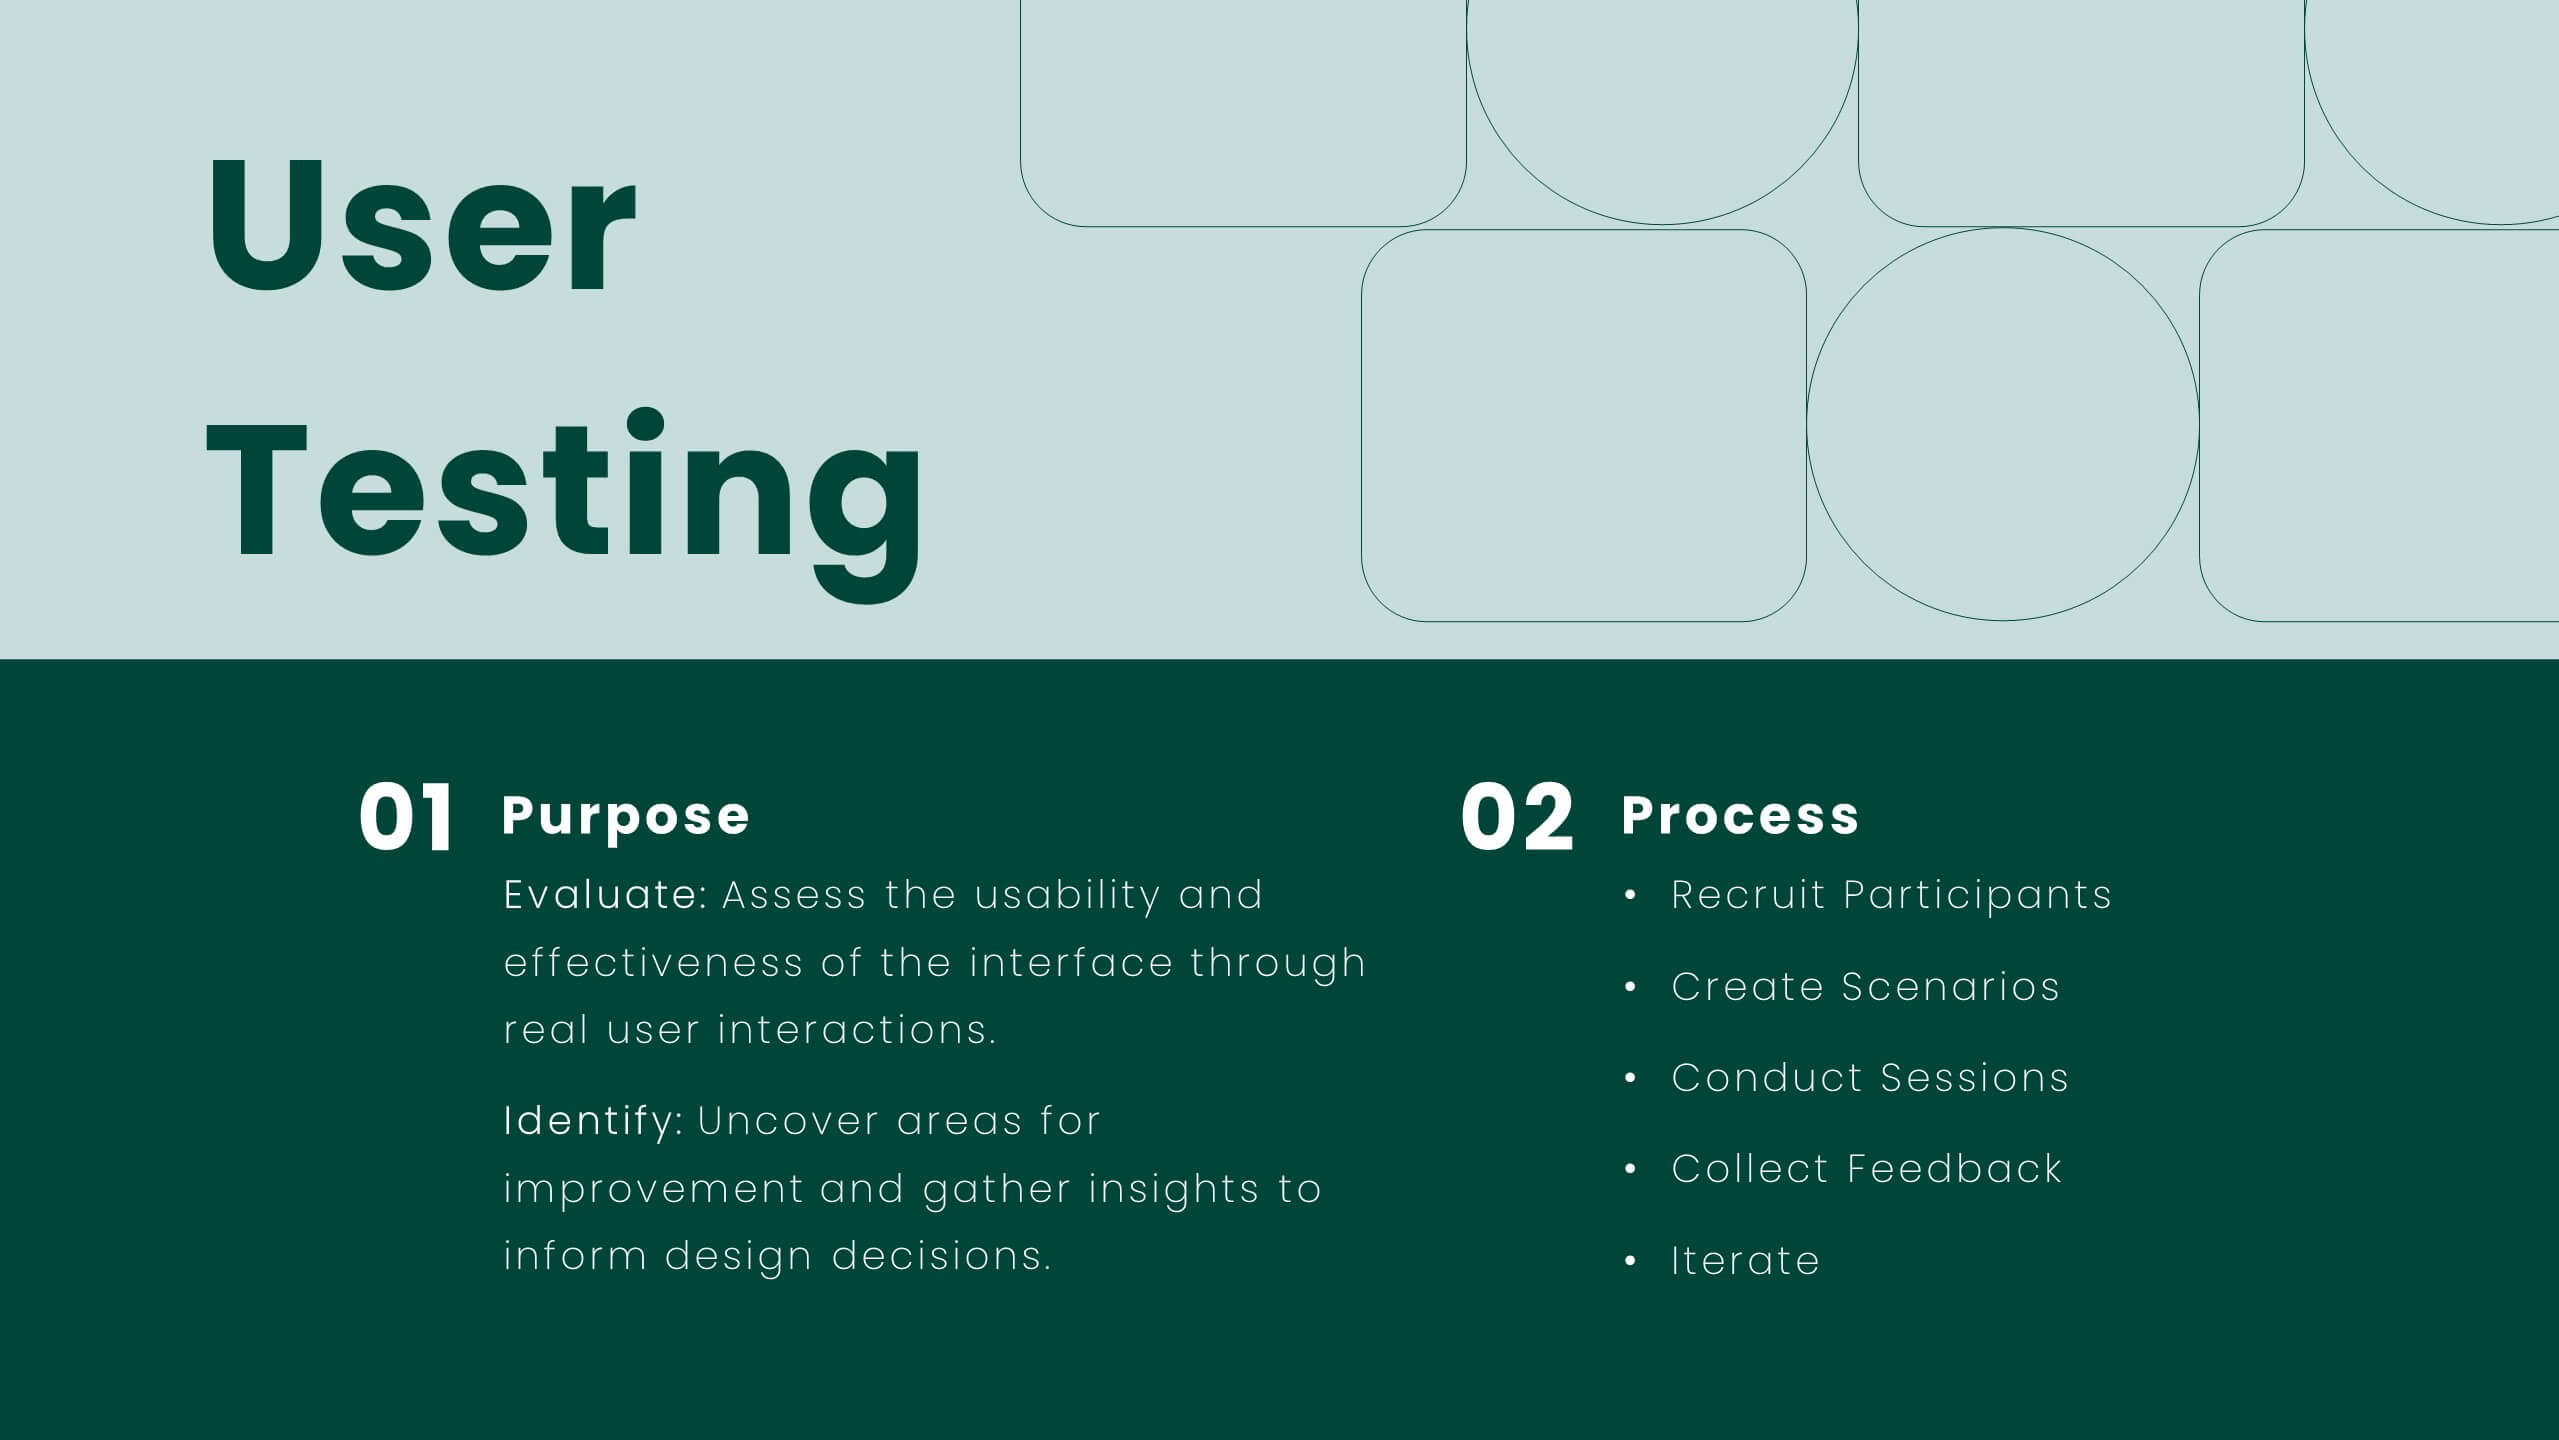
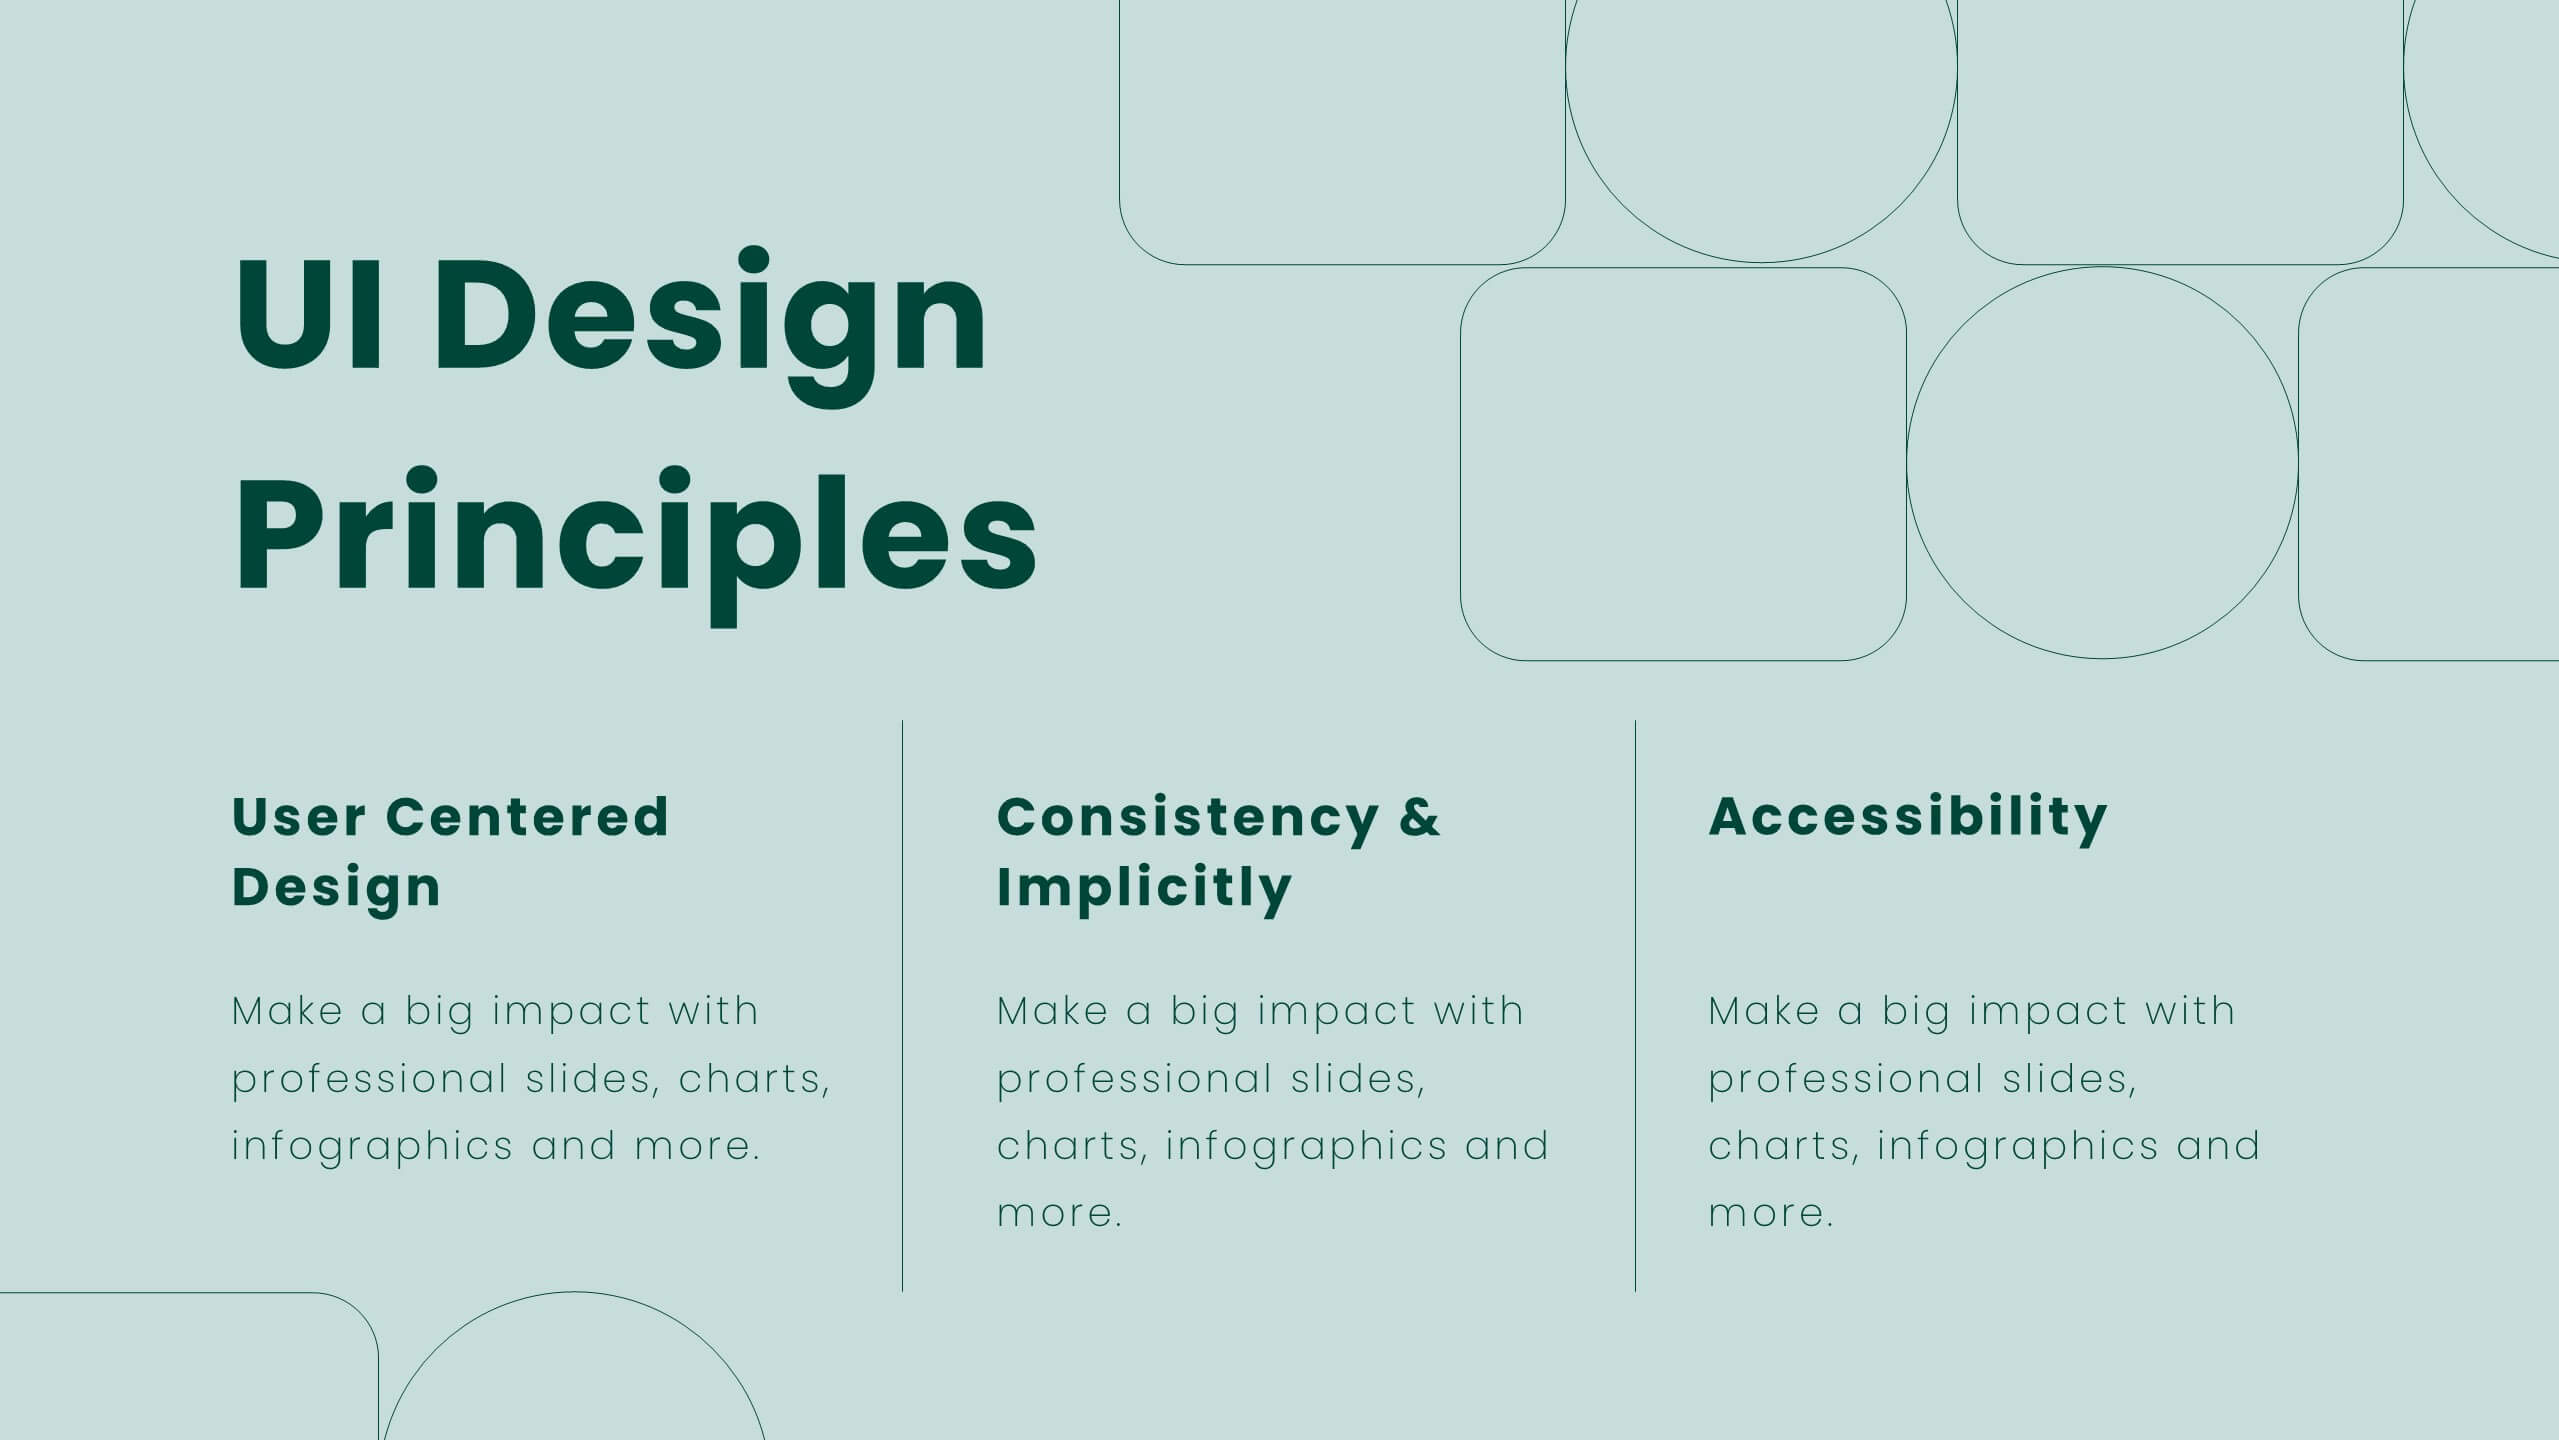
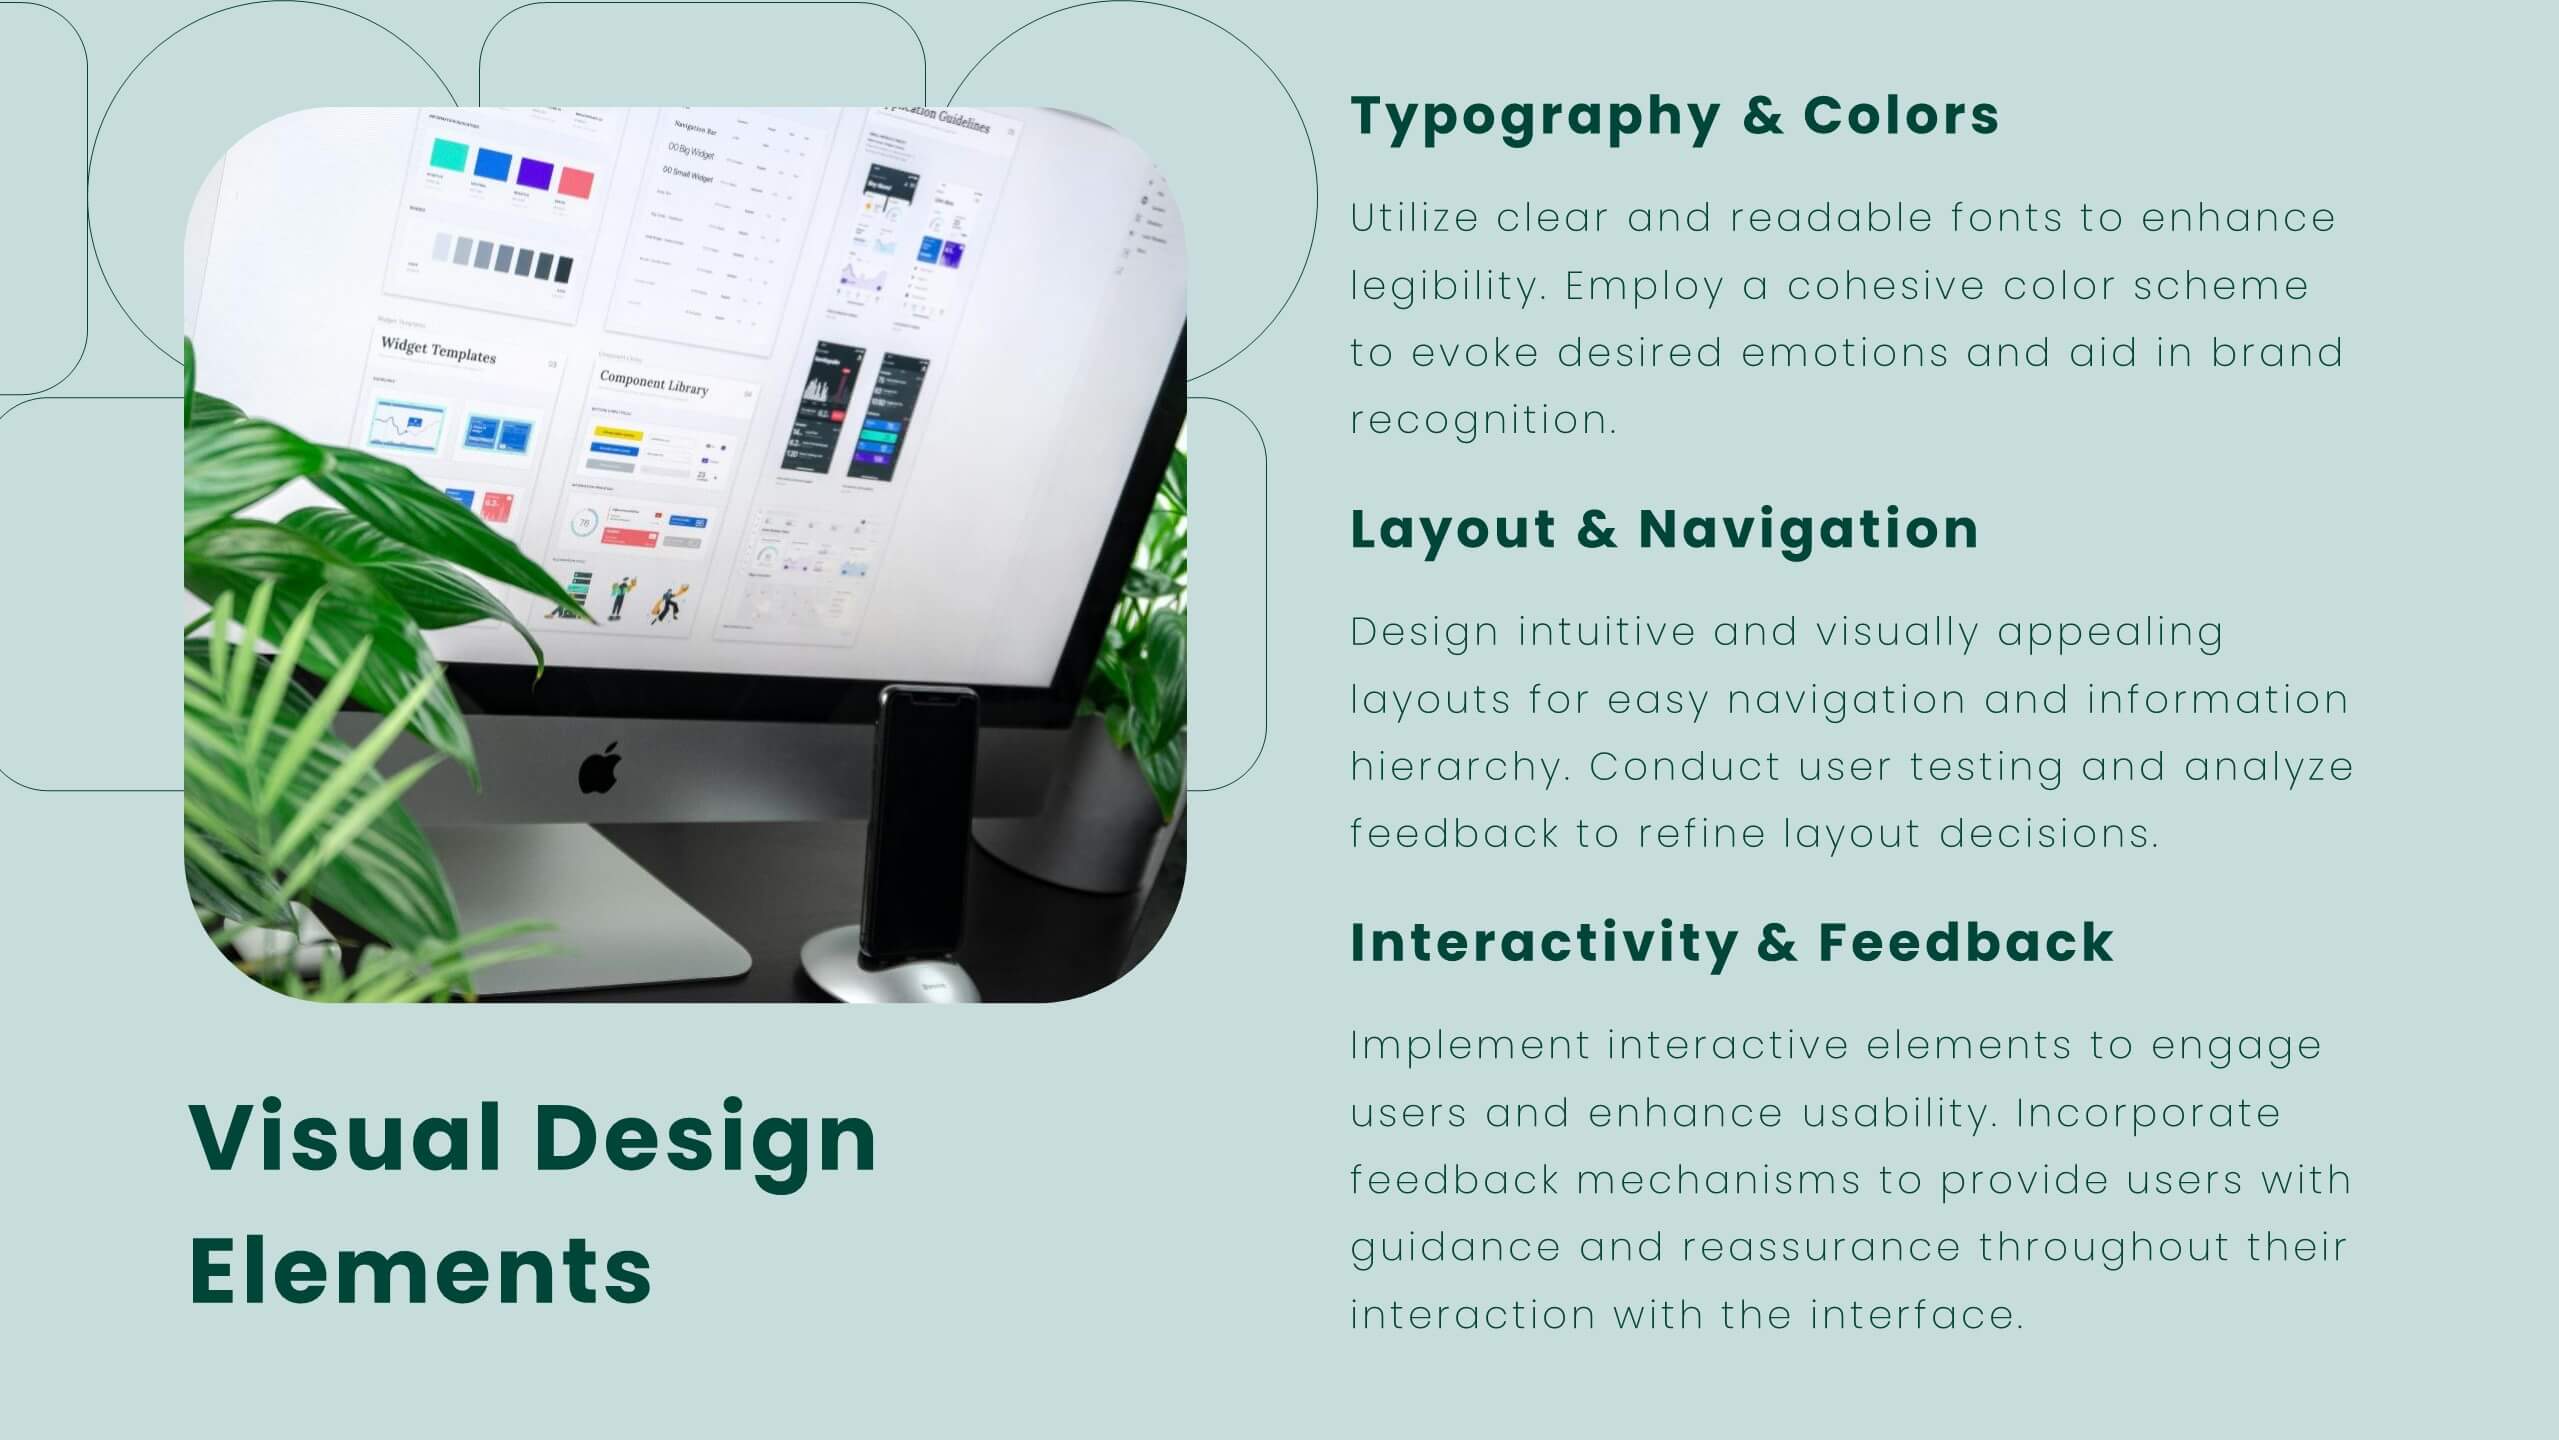
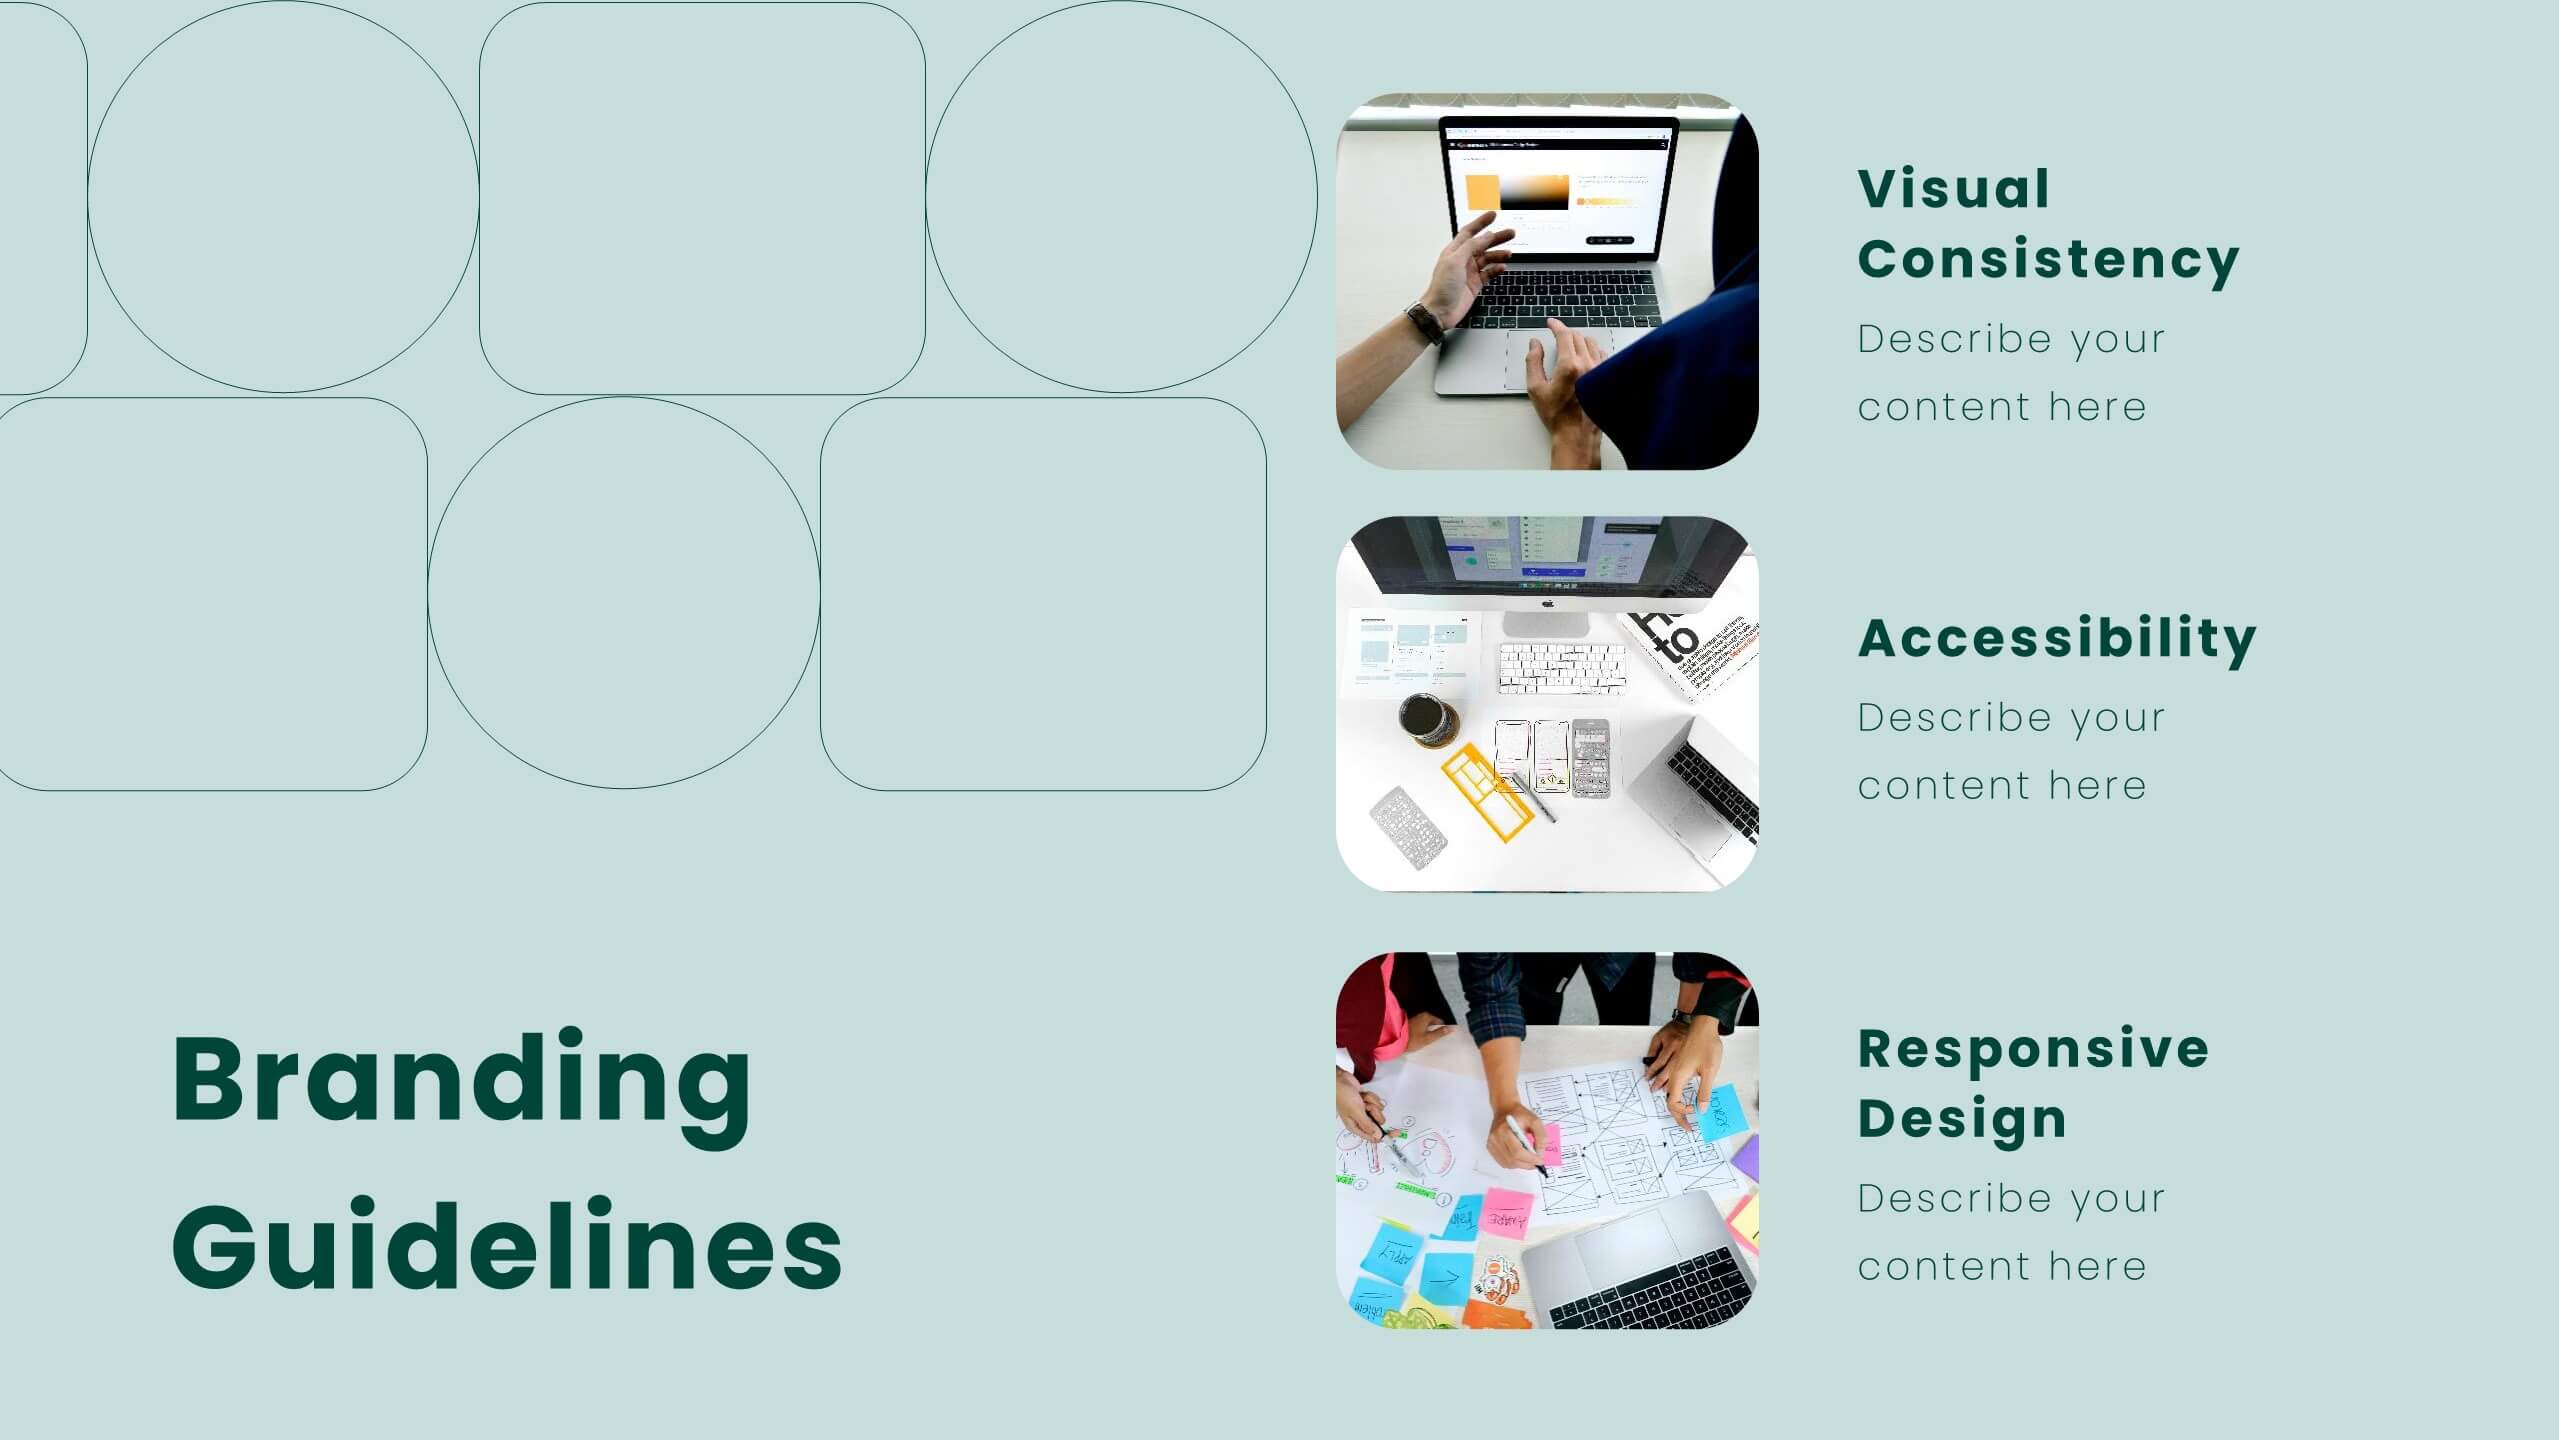
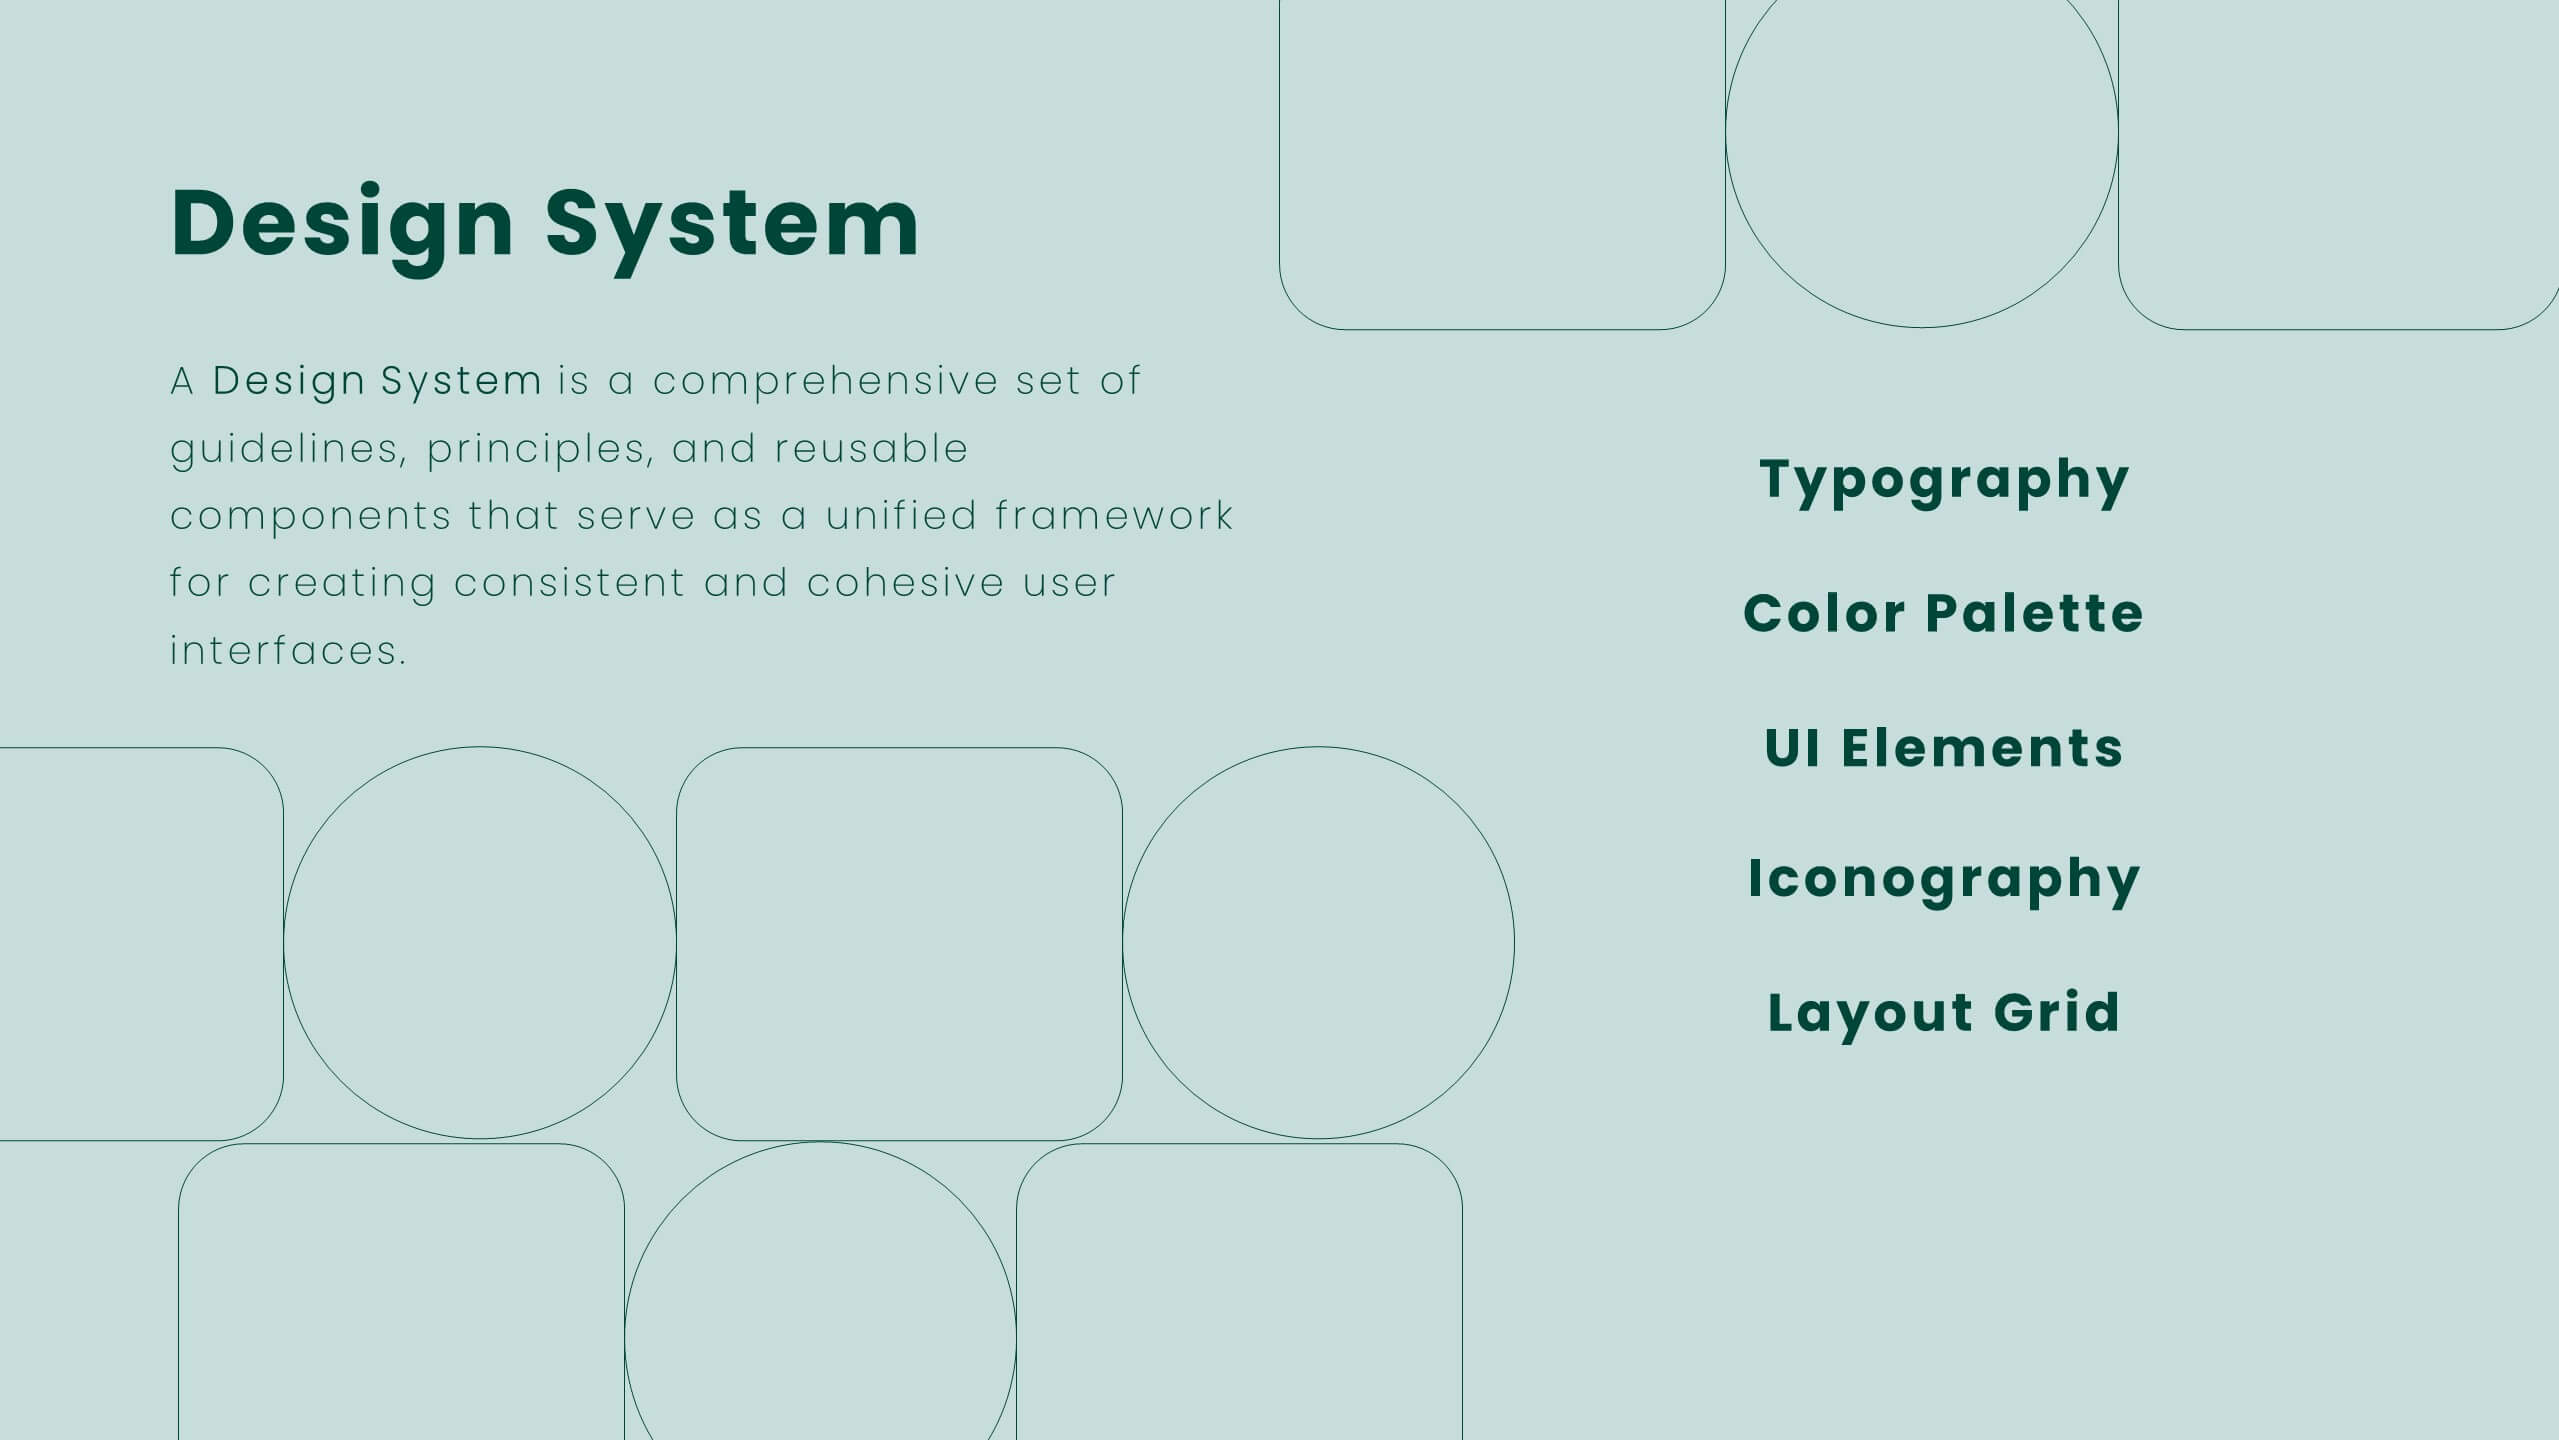
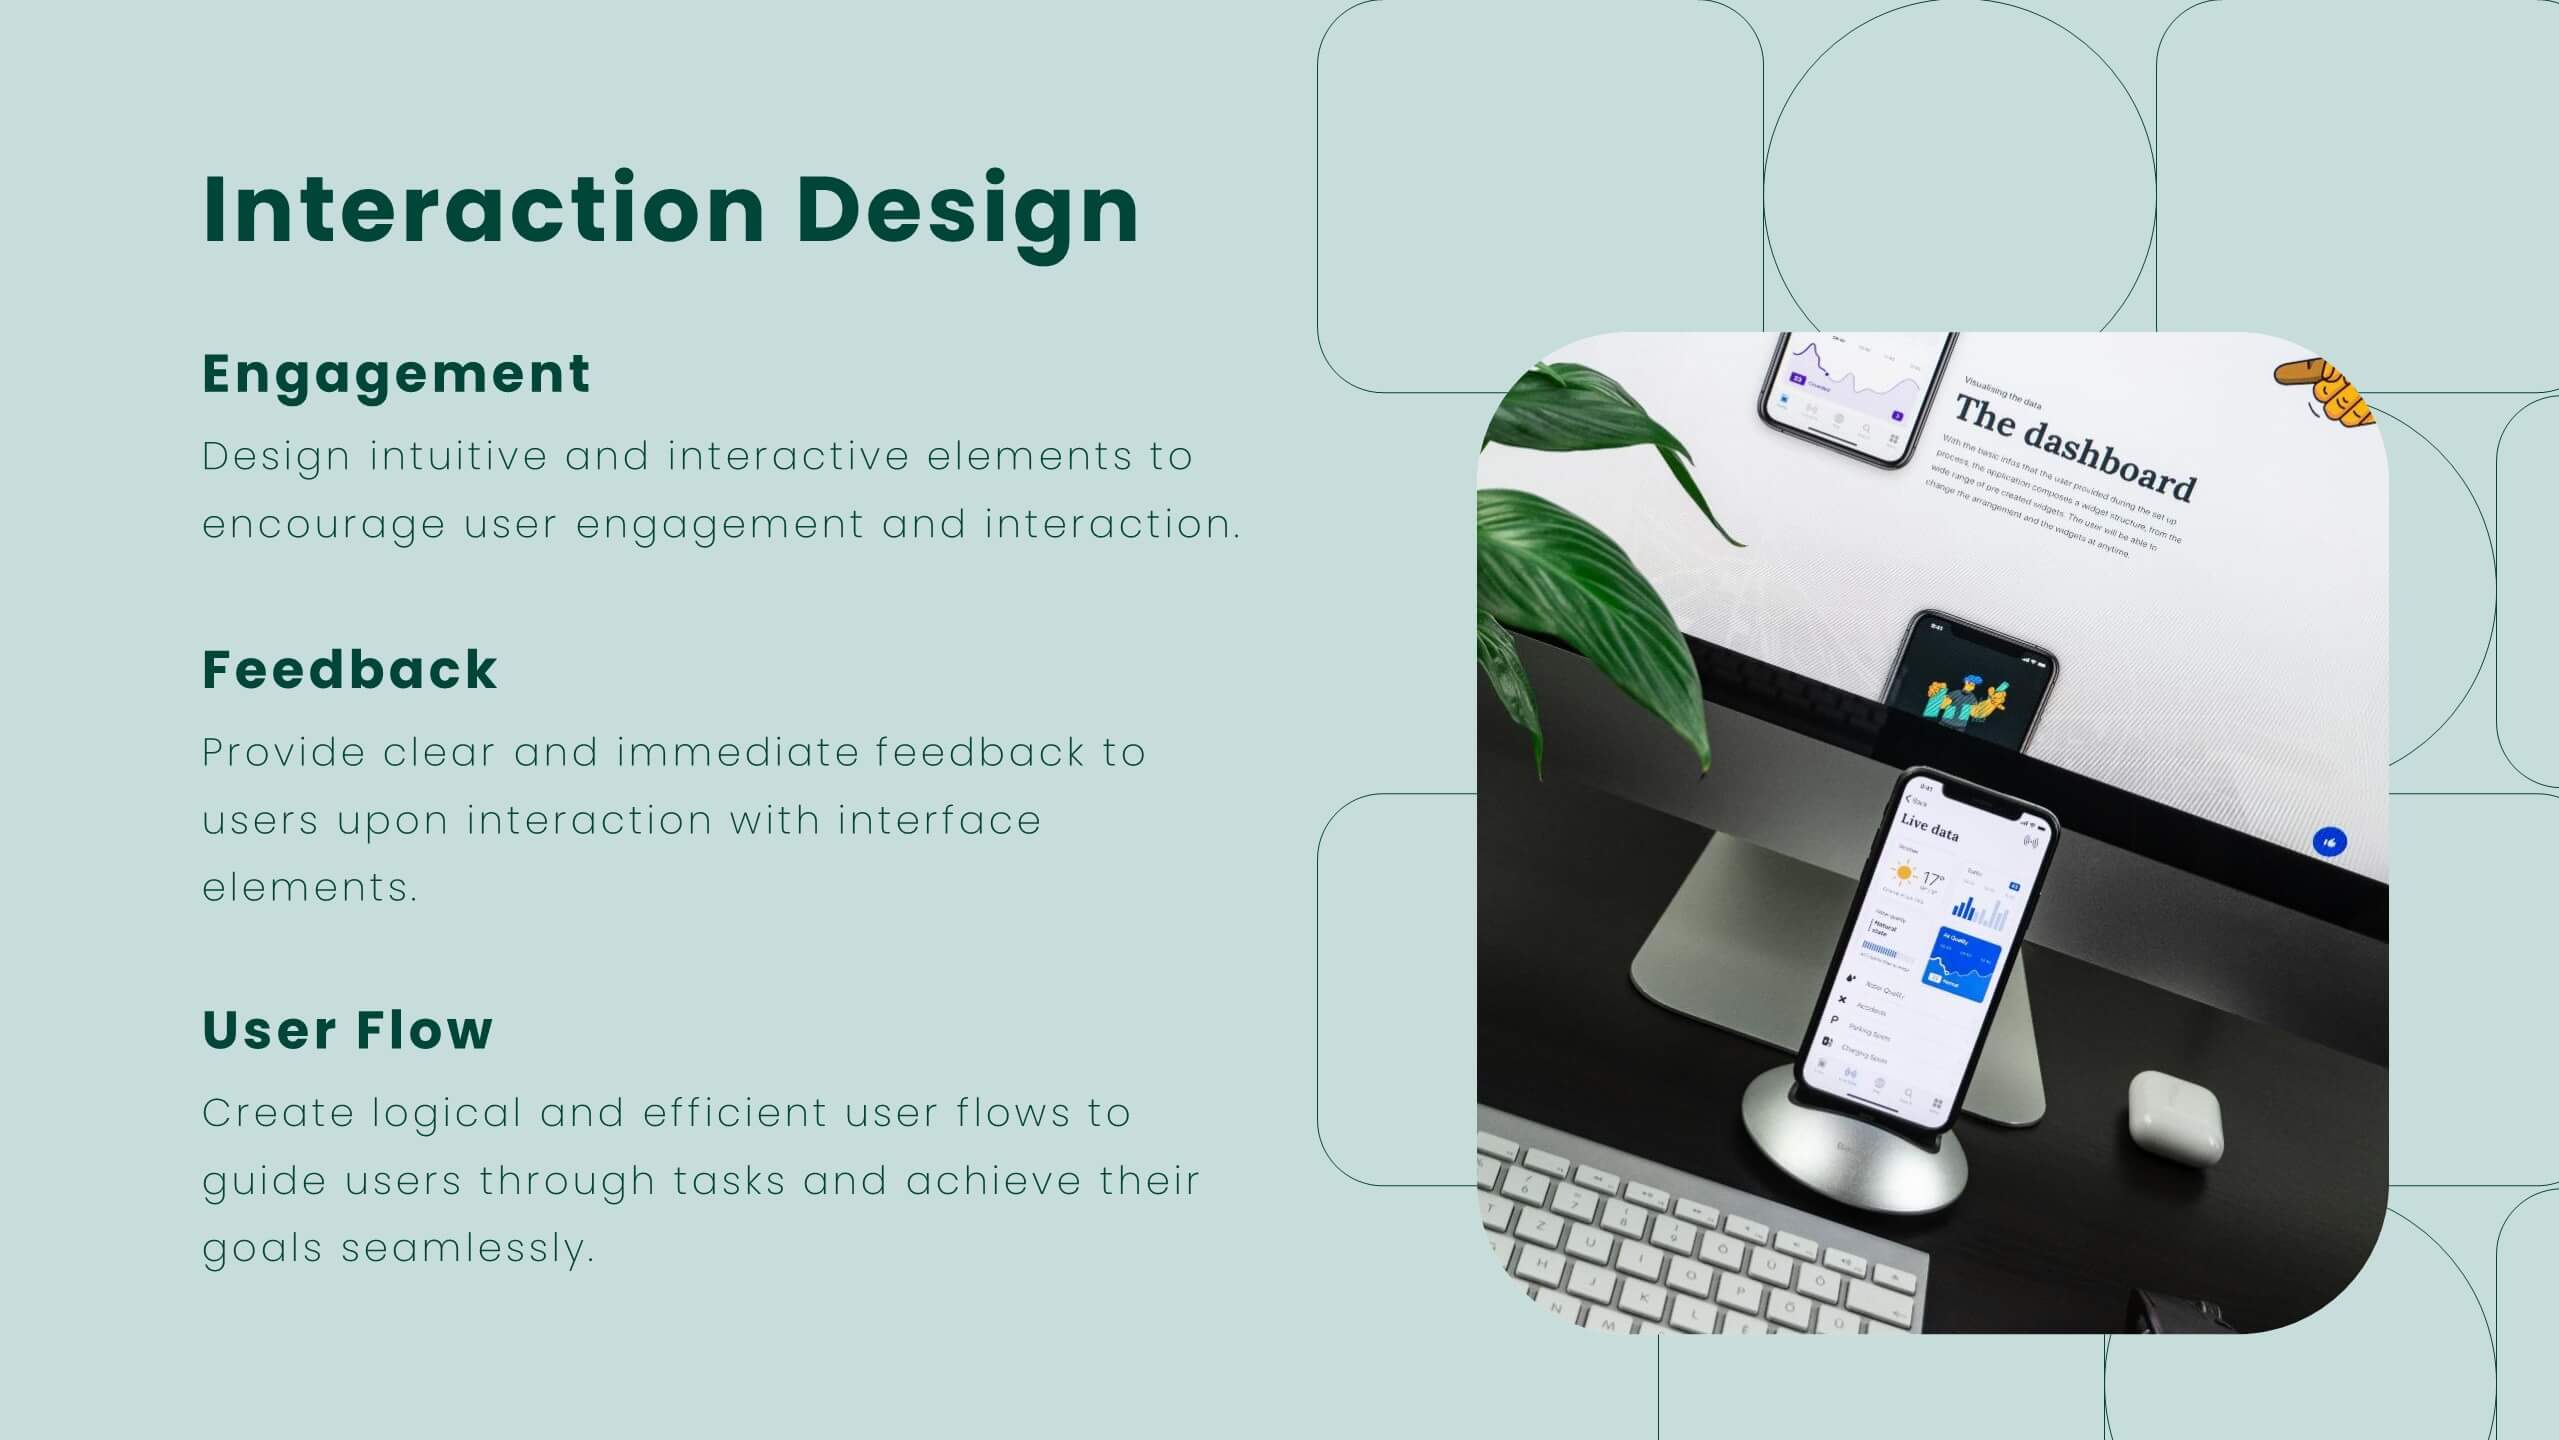
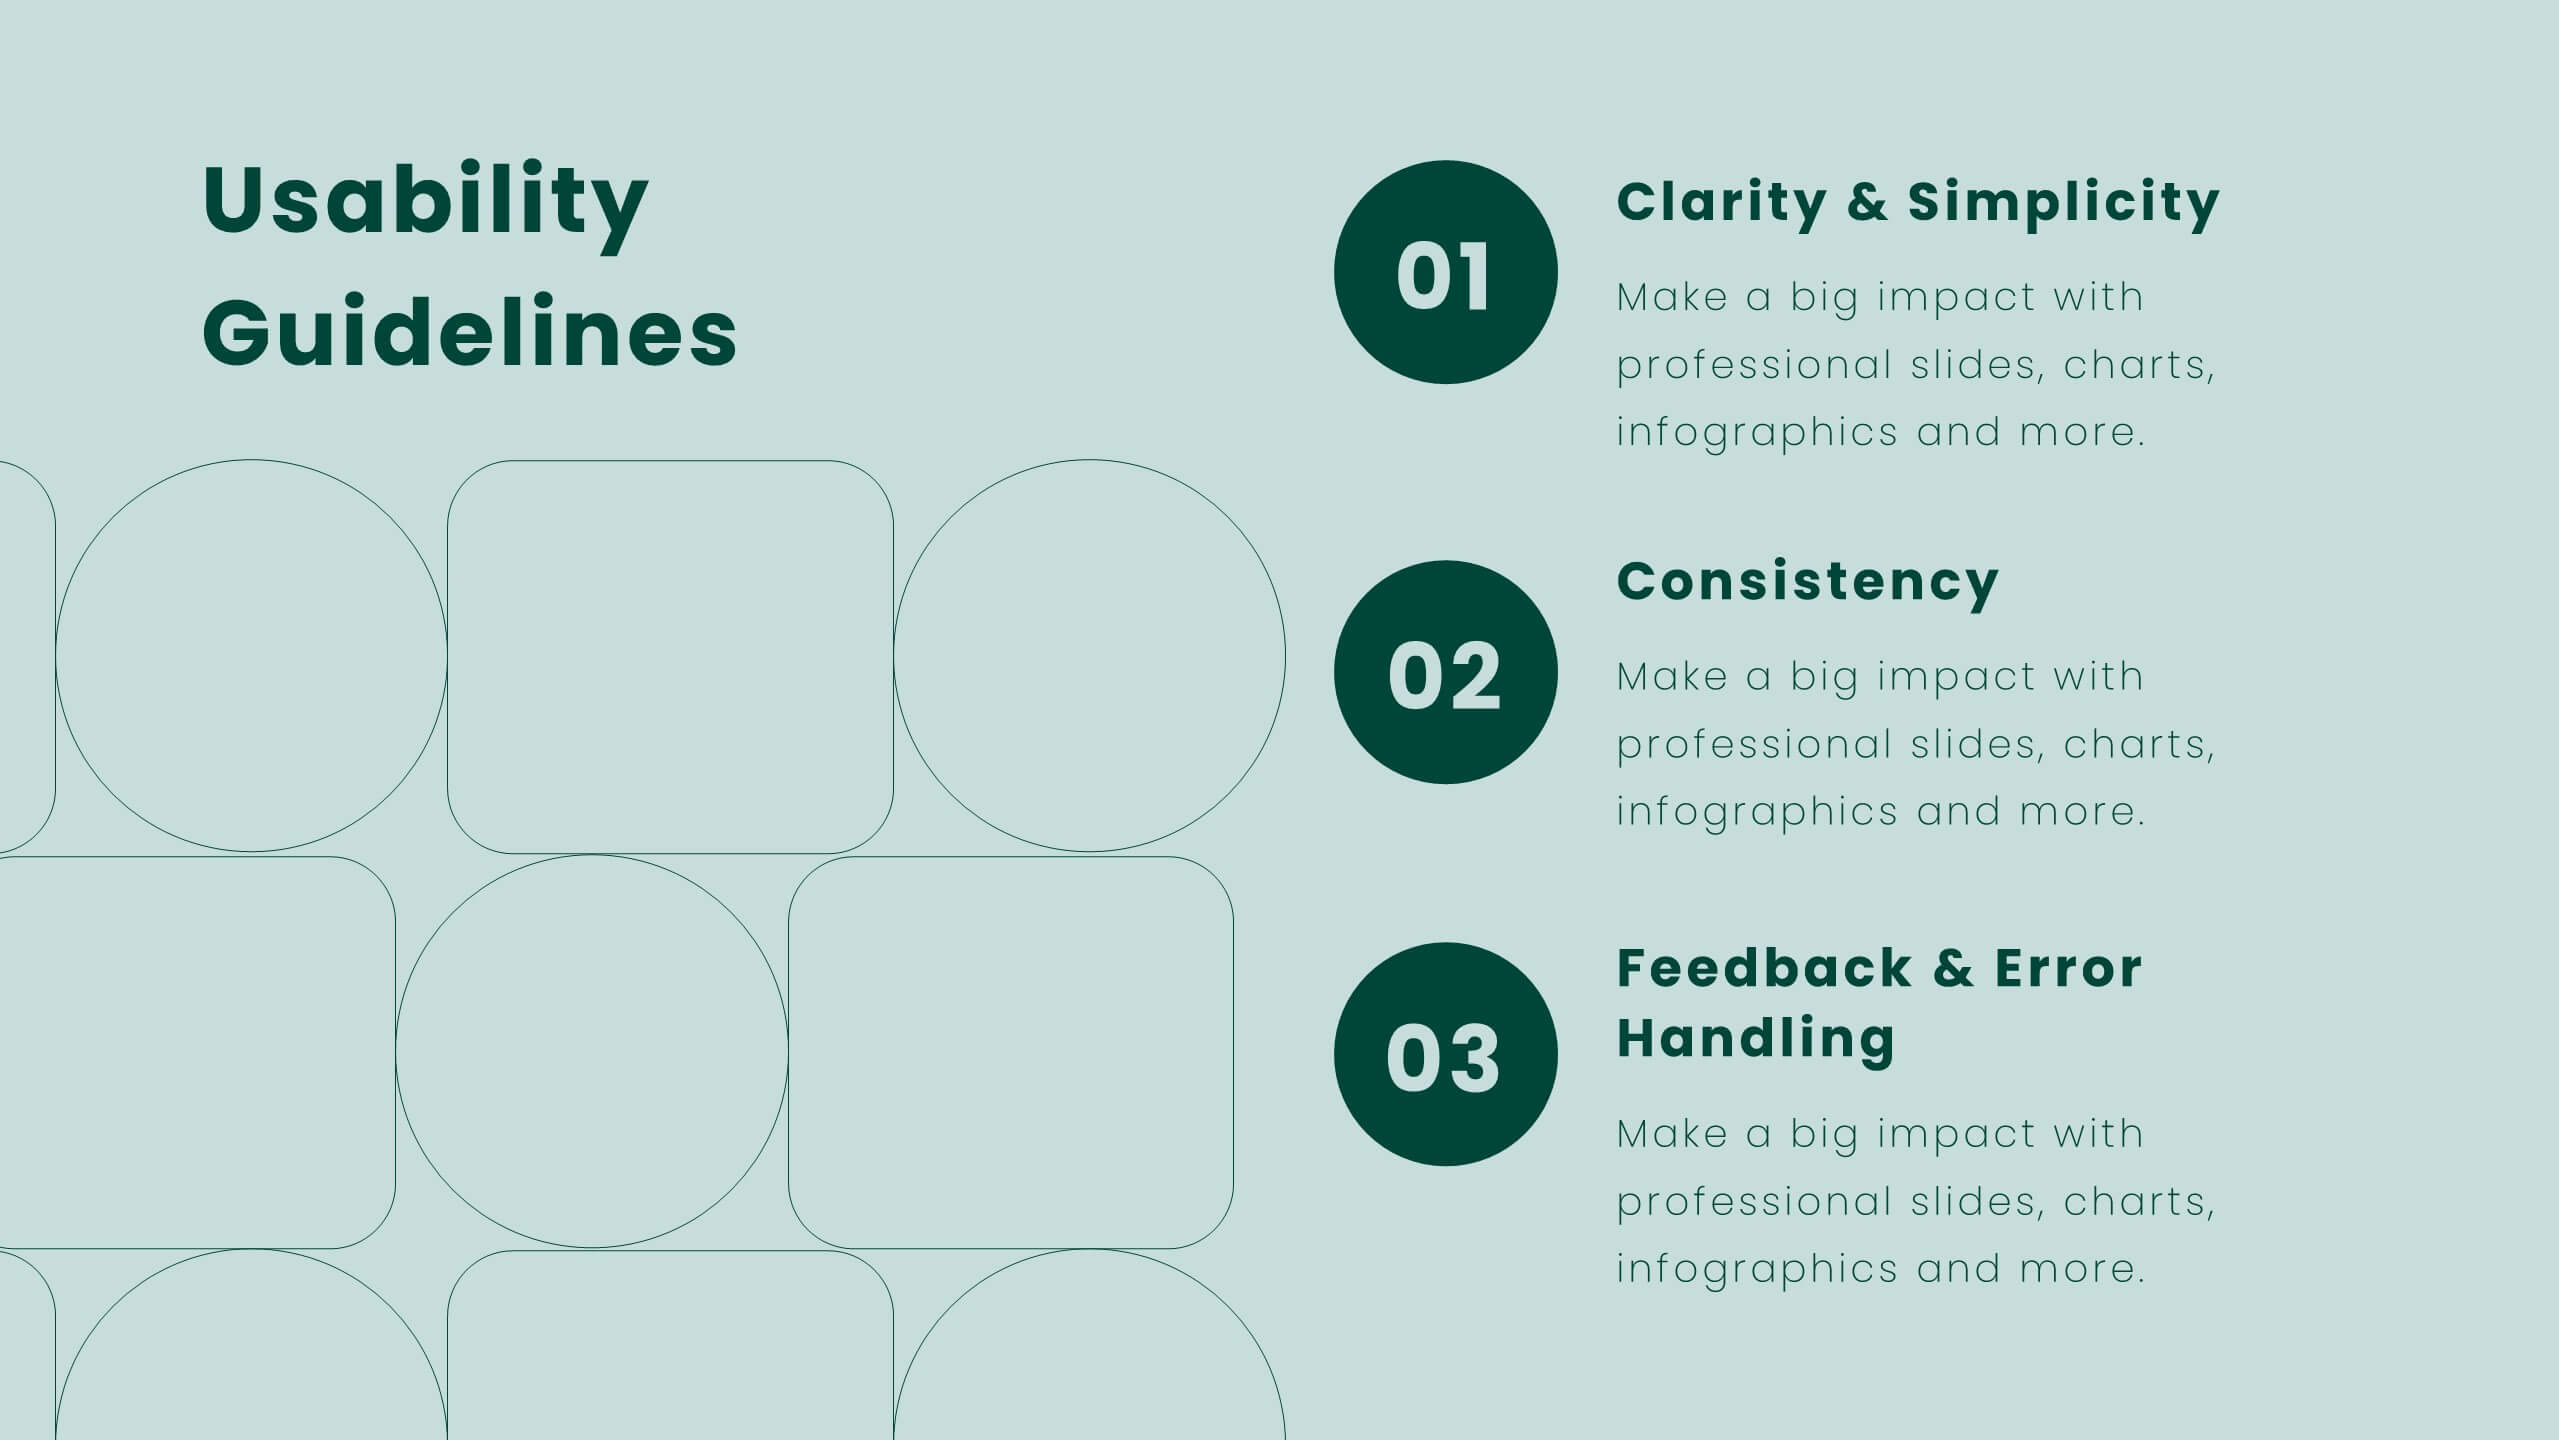
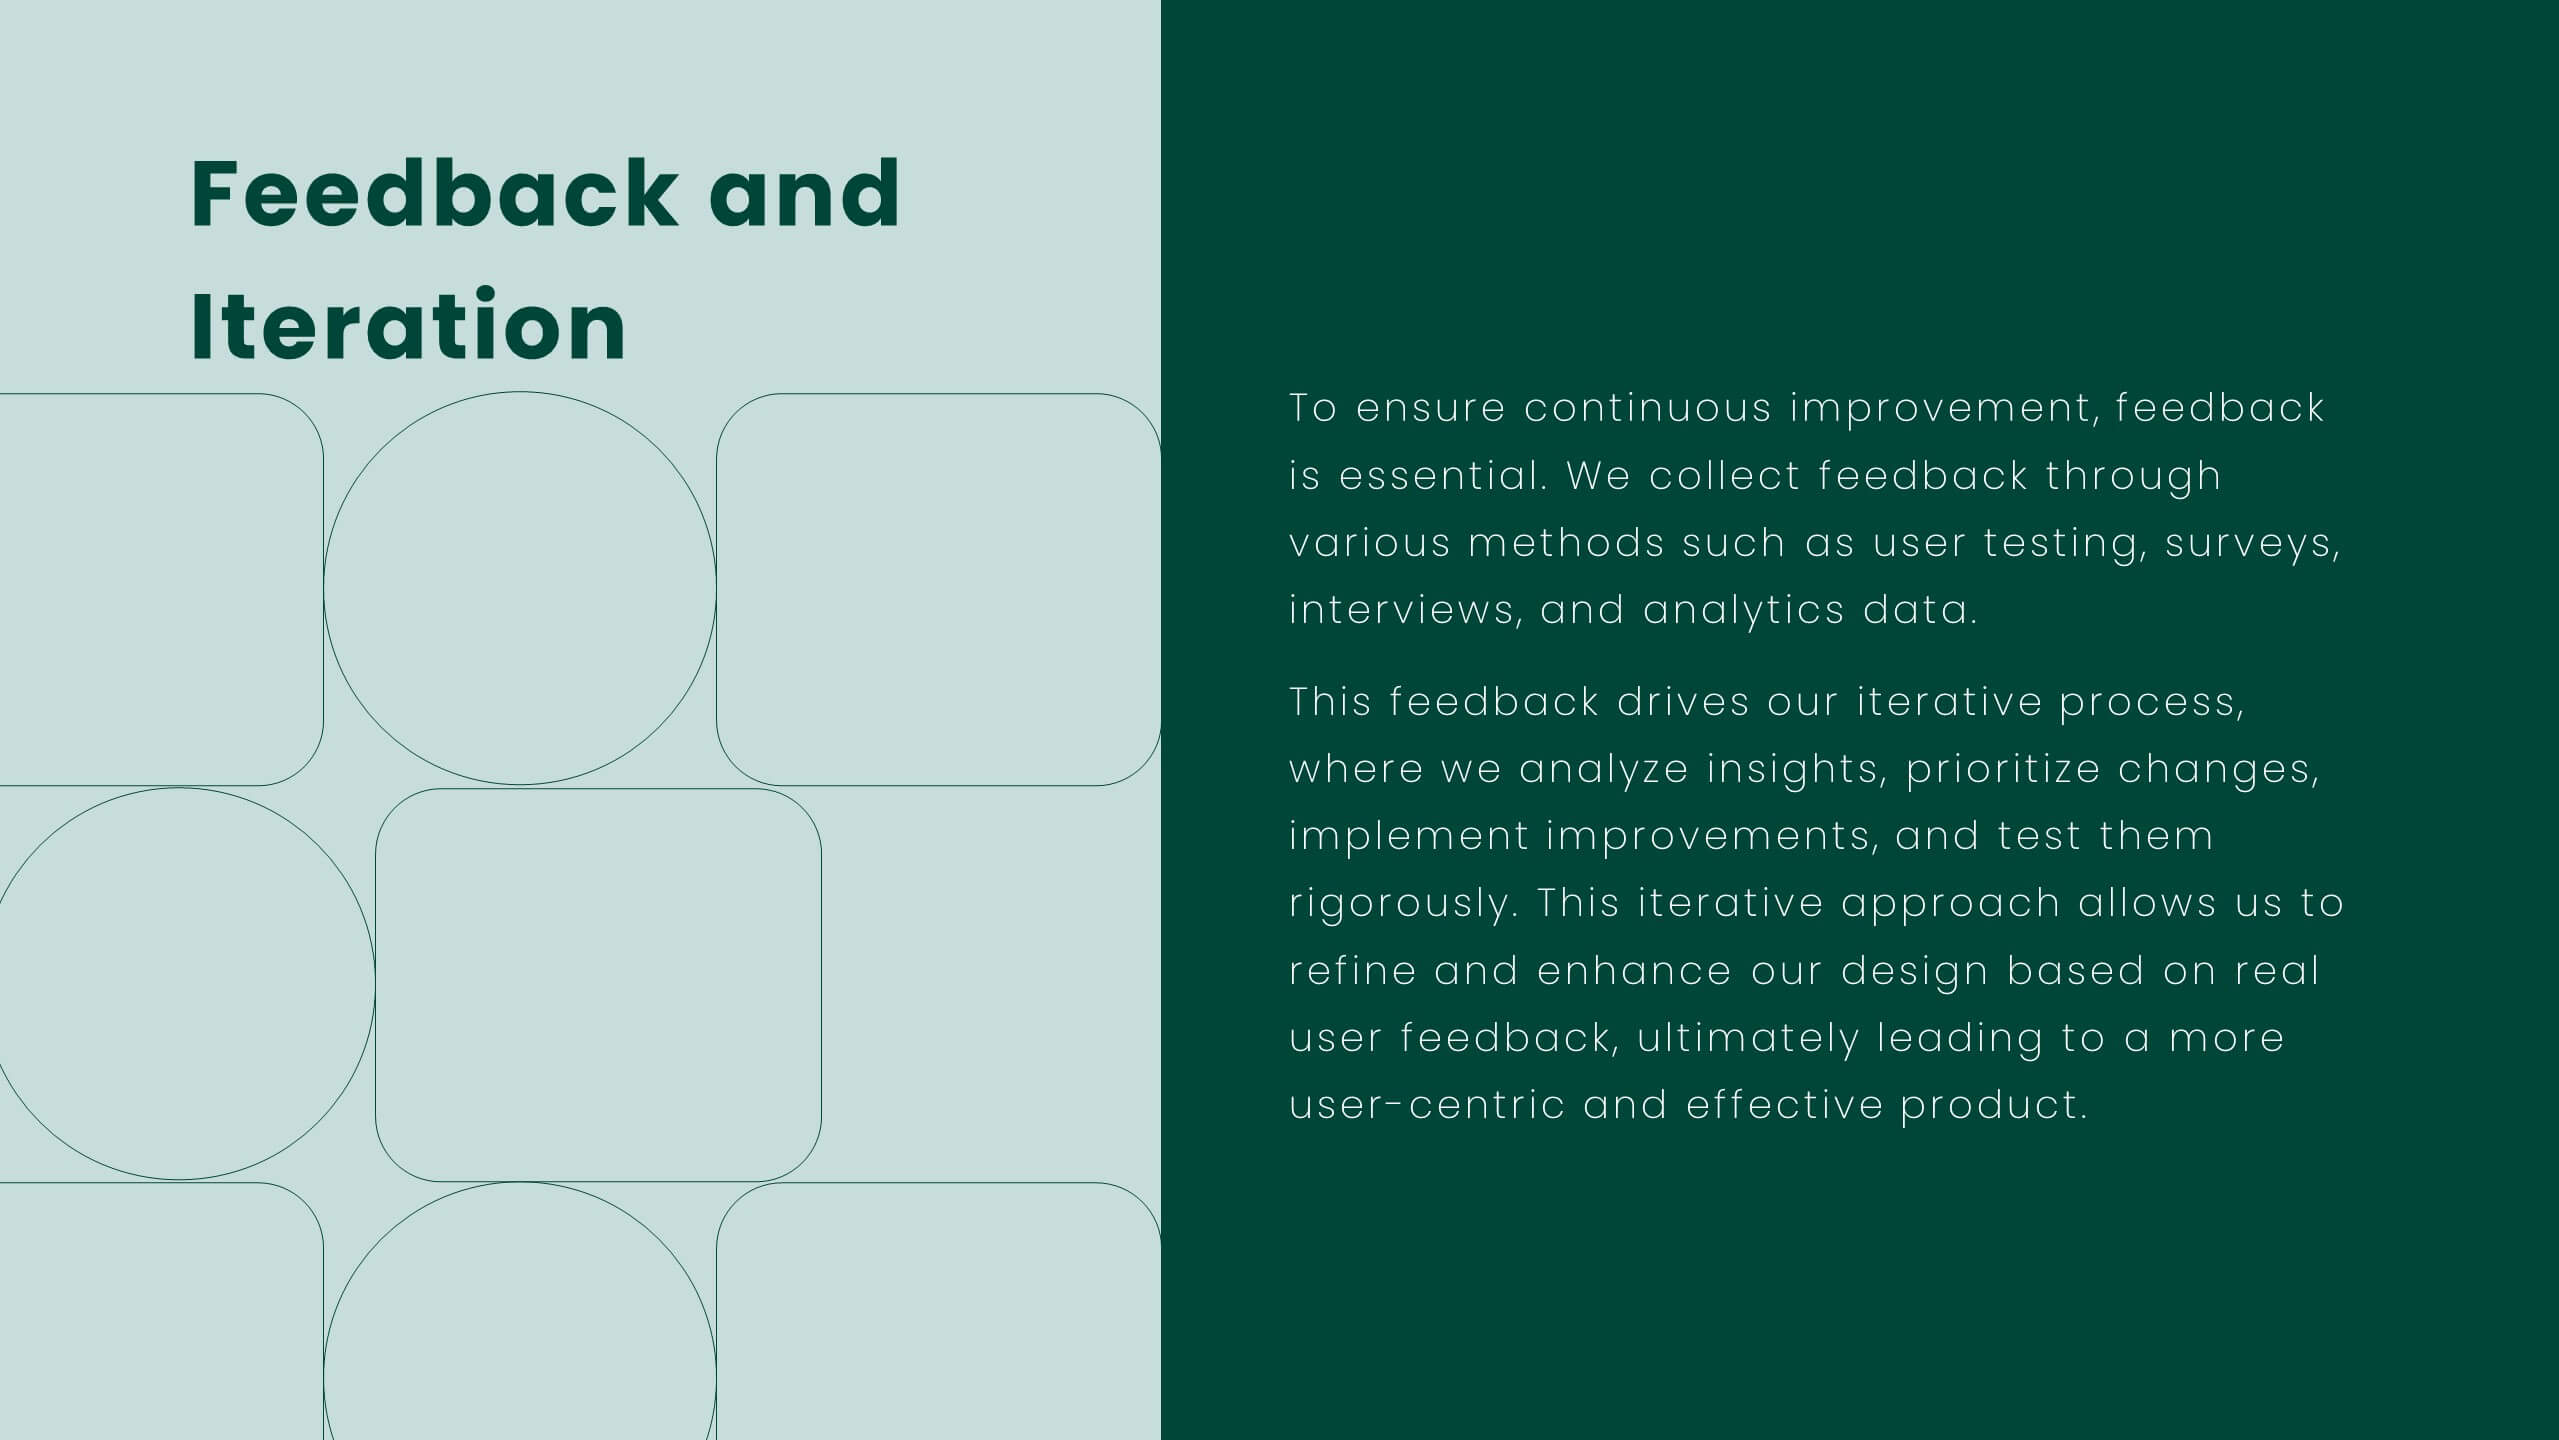
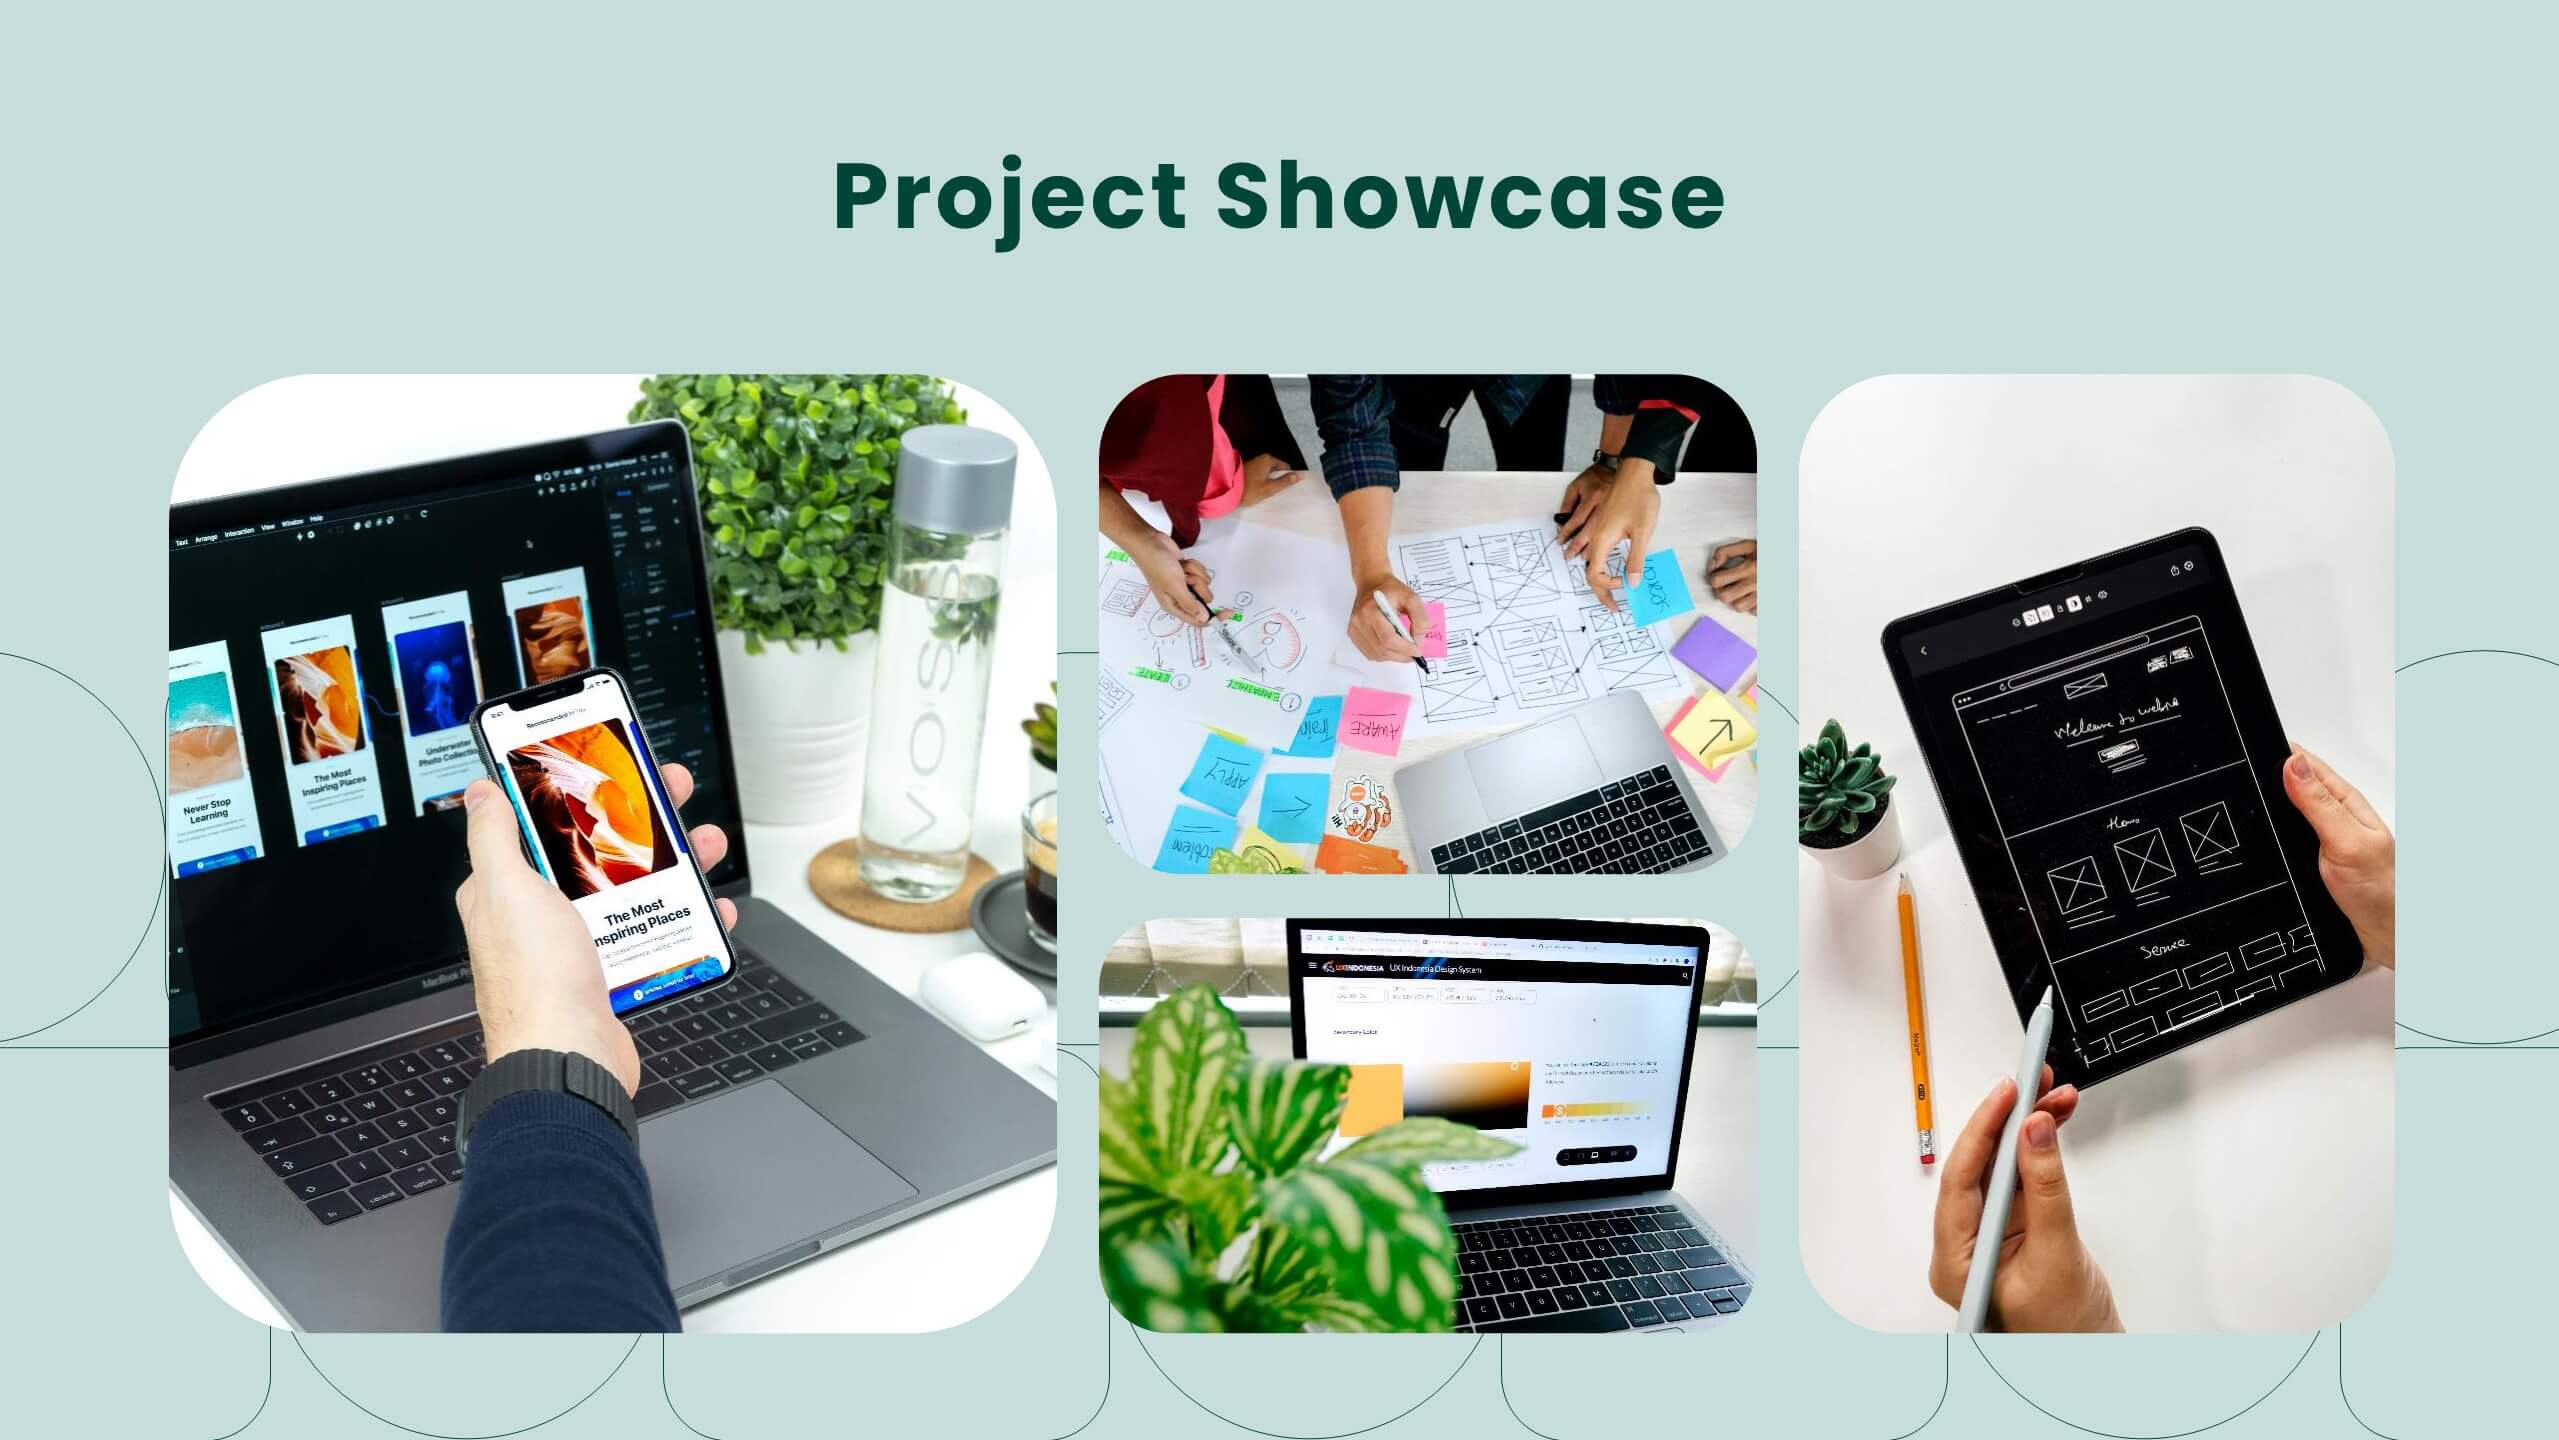
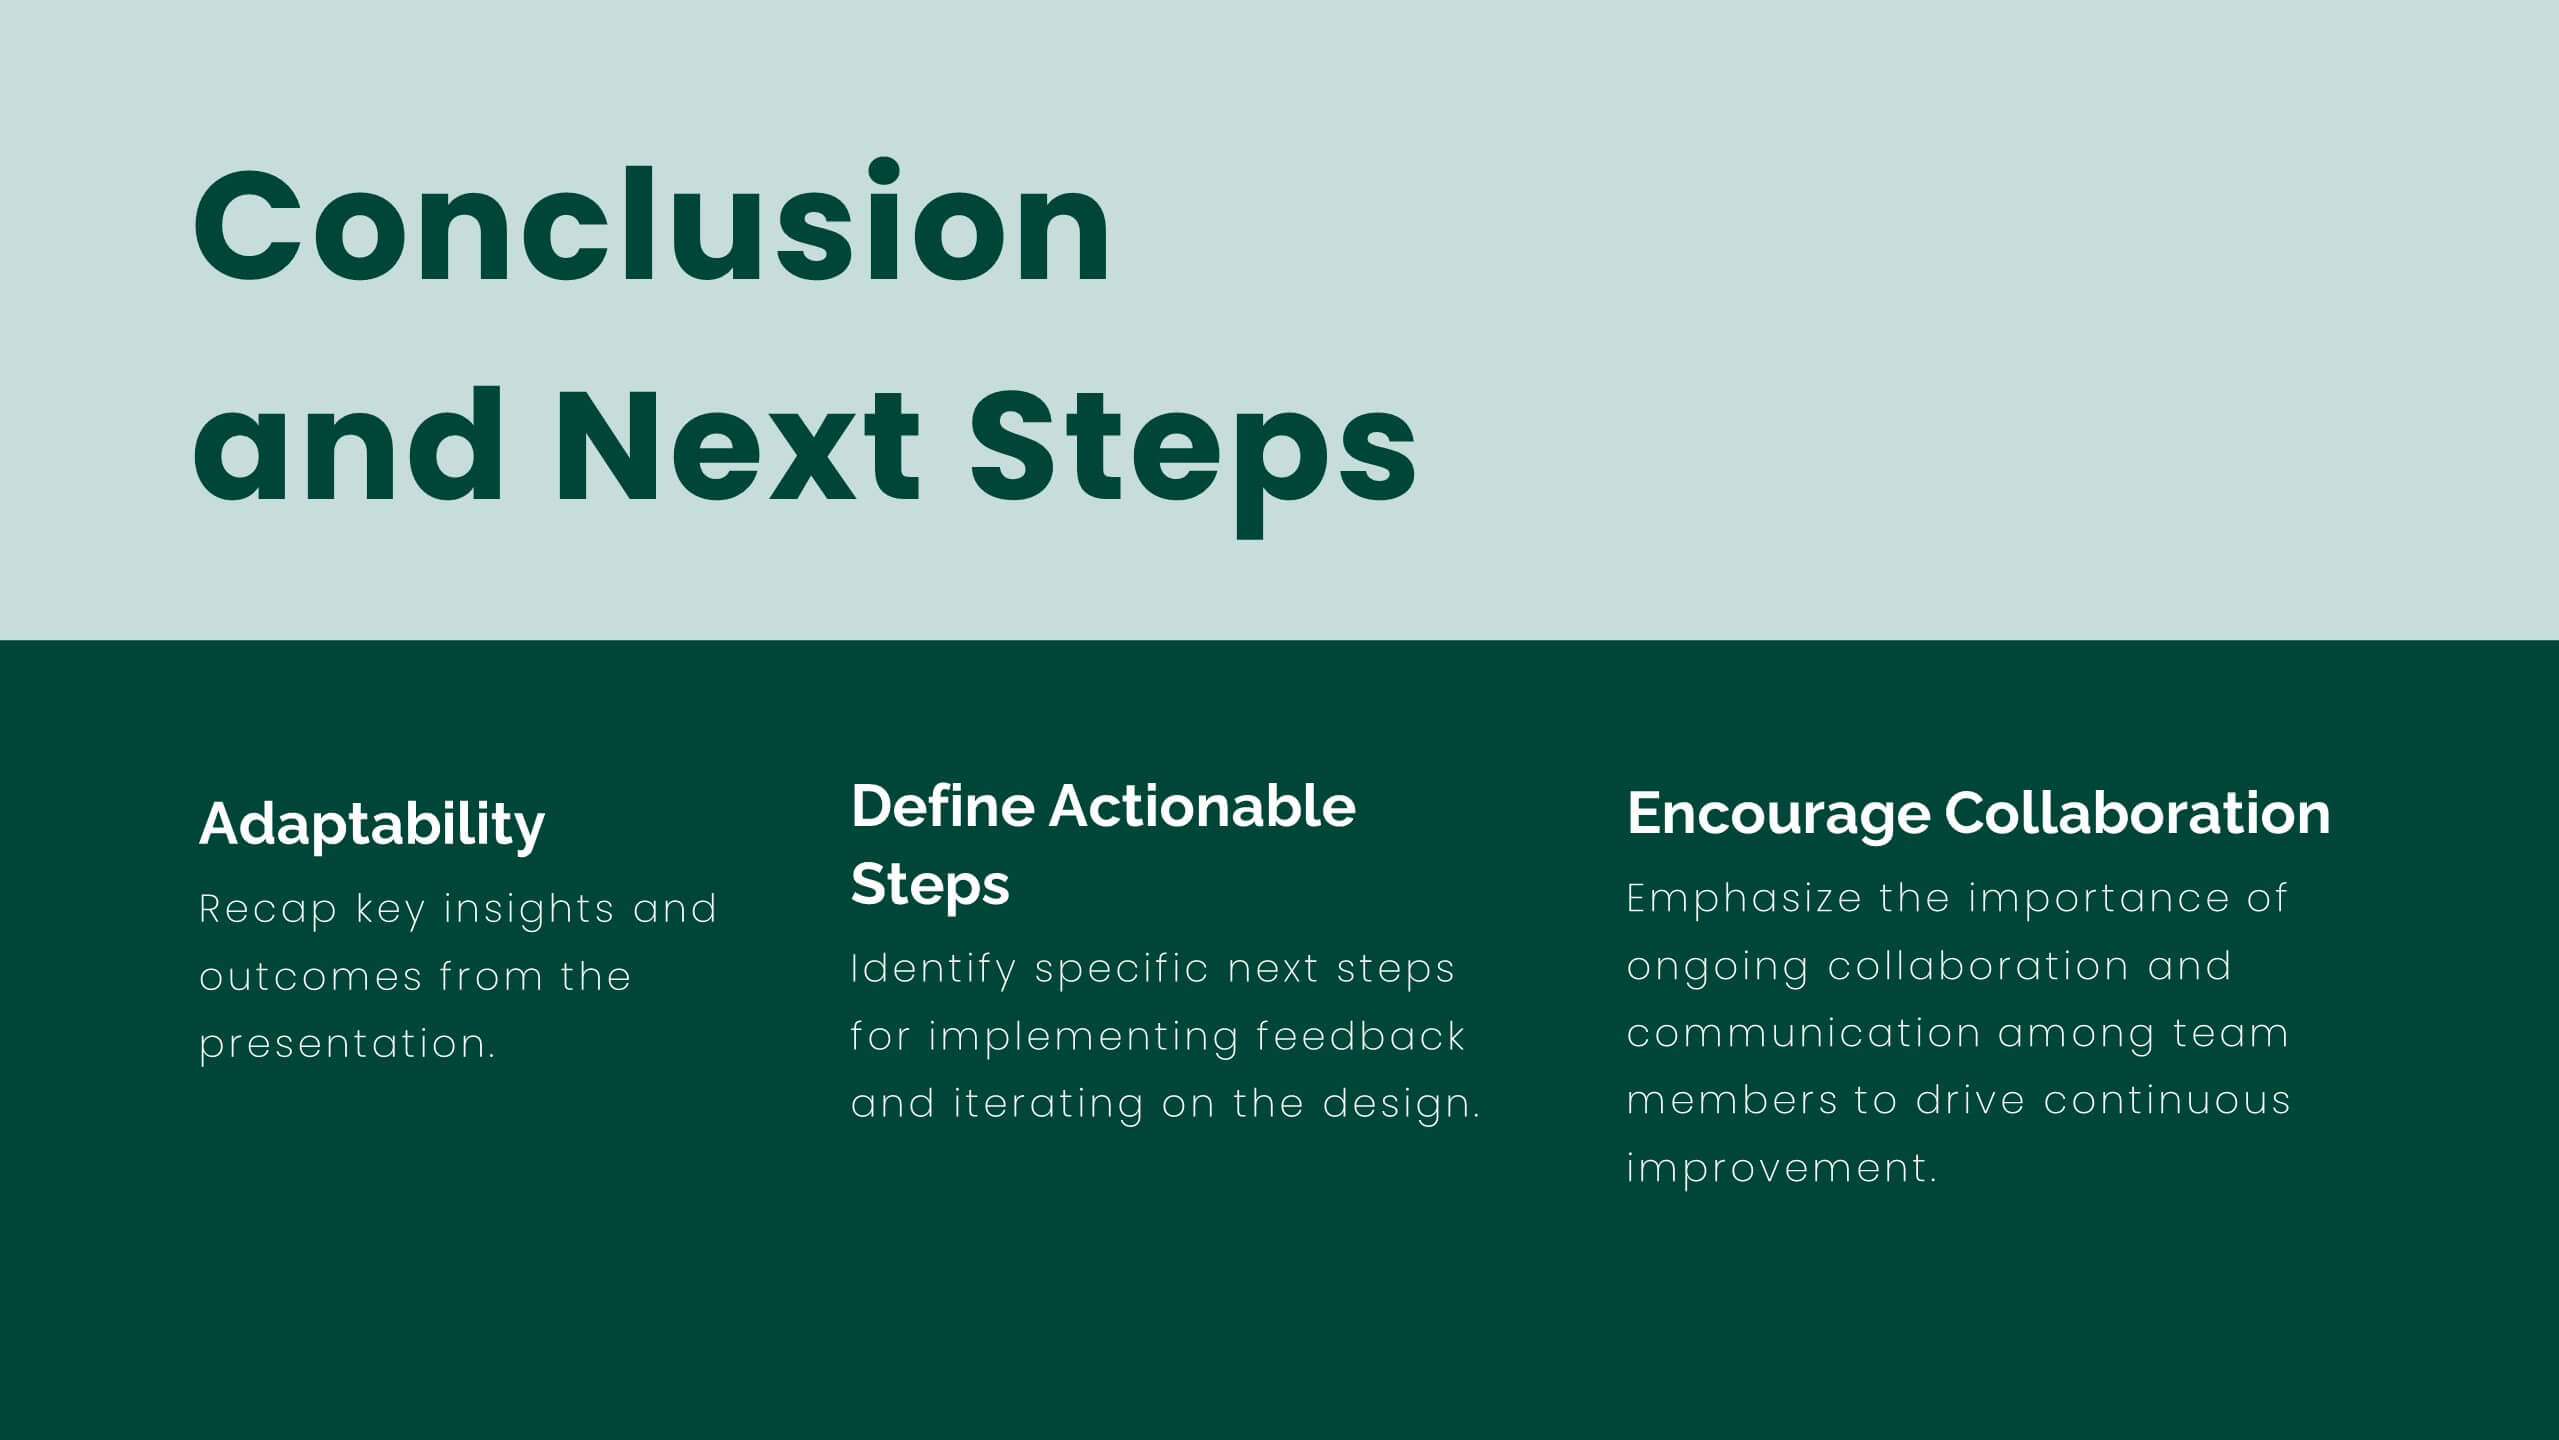
Lumina UX Case Study Presentation
Create compelling UX case studies with this modern template. Cover user research, personas, wireframes, and prototyping. Perfect for showcasing UI design principles, responsive design, and usability guidelines. Highlight feedback, iteration, and project showcase. Compatible with PowerPoint, Keynote, and Google Slides. Elevate your UX presentations and impress stakeholders with clear, detailed insights.


5 diapositivas
Revenue Streams & Expense Management Layout Presentation
Visualize your income and costs with the Revenue Streams & Expense Management Layout Presentation. This slide layout uses a vertical arrow chart to display four data categories, ideal for comparing sources of income and related expenditures. Great for financial reports, budgeting reviews, and strategy discussions. Compatible with Canva, PowerPoint, Google Slides, and Keynote.


5 diapositivas
RAPID Decision-Making Model Presentation
The RAPID Decision-Making Model template simplifies complex decision processes, laying out steps from recommending to deciding in an easily digestible format. It's ideal for team leaders and managers who want to streamline decision-making. The template is designed for seamless use across PowerPoint, Keynote, and Google Slides, ensuring broad compatibility and user-friendly presentations.


6 diapositivas
Ecommerce KPI Dashboards Infographic
Elevate your eCommerce reporting with our comprehensive KPI Dashboard Infographics. Tailored for seamless integration with PowerPoint, Google Slides, and Keynote, this template offers a clear and colorful representation of key performance indicators critical to online business success. From tracking sales growth to monitoring customer engagement metrics, our infographics provide an intuitive layout to display data-driven insights that drive decision-making. This template transforms complex data sets into straightforward visuals, making it easier to communicate progress with your team. Use this template to keep a pulse on your eCommerce performance and narrate the story behind the numbers.


21 diapositivas
Fahrenheit Scientific Research Presentation
Present your findings with clarity using this scientific research presentation template. Designed for researchers, it includes sections for objectives, methodology, data analysis, results, and recommendations. Perfect for academic and professional use, this template ensures a polished, organized presentation and is fully compatible with PowerPoint, Keynote, and Google Slides.


5 diapositivas
E-Learning and Digital Education Trends Presentation
Stay ahead in the digital learning space with the E-Learning and Digital Education Trends Presentation template. Designed for educators, trainers, and e-learning professionals, this modern and insightful layout highlights key trends, innovative tools, and strategies in online education. With fully customizable elements, you can tailor the slides to your audience’s needs. Compatible with PowerPoint, Keynote, and Google Slides for a seamless presentation experience.


7 diapositivas
Relationship Communication Infographic
A Relationship Communication Infographic is a visual representation of key concepts and strategies related to effective communication in relationships. This template can be used to provide practical tips and advice for improving communication skills, resolving conflicts, and building stronger, healthier relationships. This infographic can be a helpful resource for individuals seeking to improve their communication skills and build stronger, more fulfilling relationships. This template is compatible with Powerpoint, Keynote and Google Slides making it easily customizable to fit your needs.


4 diapositivas
Breast Cancer Research and Support
Shine a light on women's health initiatives with this impactful “Breast Cancer Research and Support” infographic slide. Featuring a symbolic visual shaped like a heart and ribbon, this layout is ideal for showcasing comparative stats, awareness milestones, or key messages about prevention and treatment. Use it to advocate, inform, or inspire—perfect for awareness campaigns, nonprofit reports, or healthcare presentations. Fully customizable in PowerPoint, Keynote, and Google Slides.