


Características


¿Tienes alguna pregunta?
Recomendar


5 diapositivas
Professional Relationship Network Presentation
Map out key business connections using this Professional Relationship Network template. Ideal for showcasing client relationships, internal team dynamics, or communication hierarchies. This clean, modern design helps clarify roles and links across stakeholders. Fully editable and compatible with PowerPoint, Keynote, and Google Slides for flexible use in any setting.


5 diapositivas
Root Cause Business Problem Slide
Uncover the foundation of complex challenges with this tree-inspired slide—perfect for visualizing root causes behind business problems. Showcase contributing factors at each root to guide effective solutions. Fully editable in PowerPoint, Keynote, and Google Slides.


4 diapositivas
Elegant Watercolor Background Presentation
Add a touch of sophistication to your presentation with soft watercolor textures that create a calming, professional atmosphere. Perfect for creative projects, proposals, or portfolios, this elegant design blends artistry with clarity. Fully compatible with PowerPoint, Keynote, and Google Slides for seamless customization and a refined visual finish.
5 diapositivas
Workflow Arrow Infographic Presentation
Highlight each step of your process with clarity using the Workflow Arrow Infographic Presentation. This slide set features bold horizontal arrows that guide the viewer from one stage to the next, making it perfect for visualizing timelines, processes, or sequences. Each arrow is numbered and color-coded for easy reference, with accompanying text areas to elaborate on each step. Fully editable in PowerPoint, Keynote, and Google Slide.


23 diapositivas
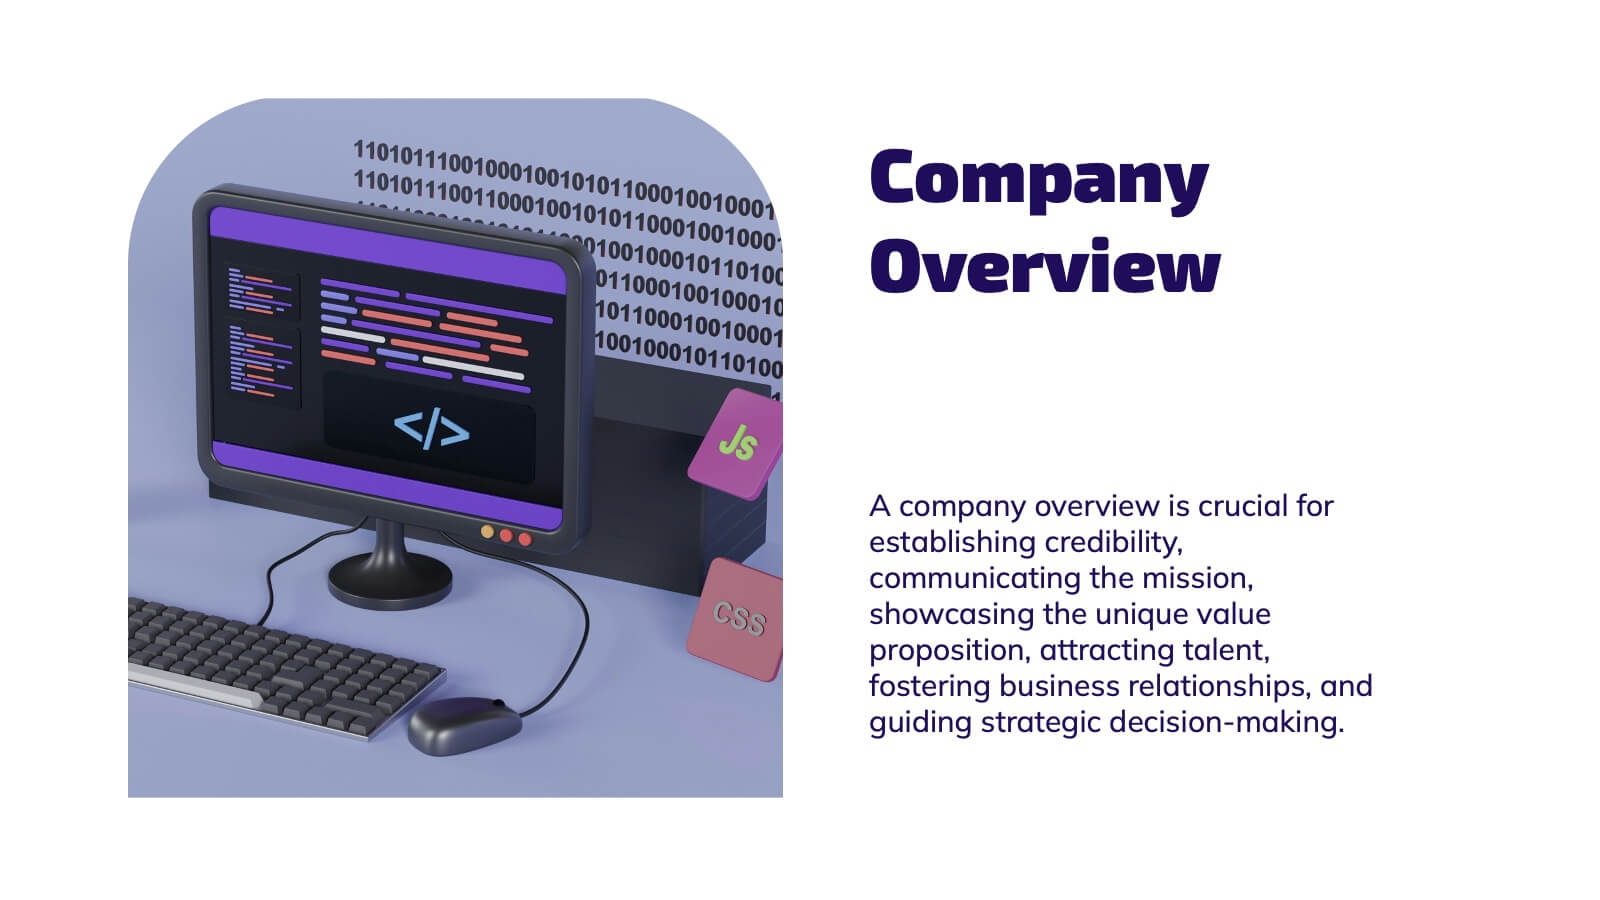
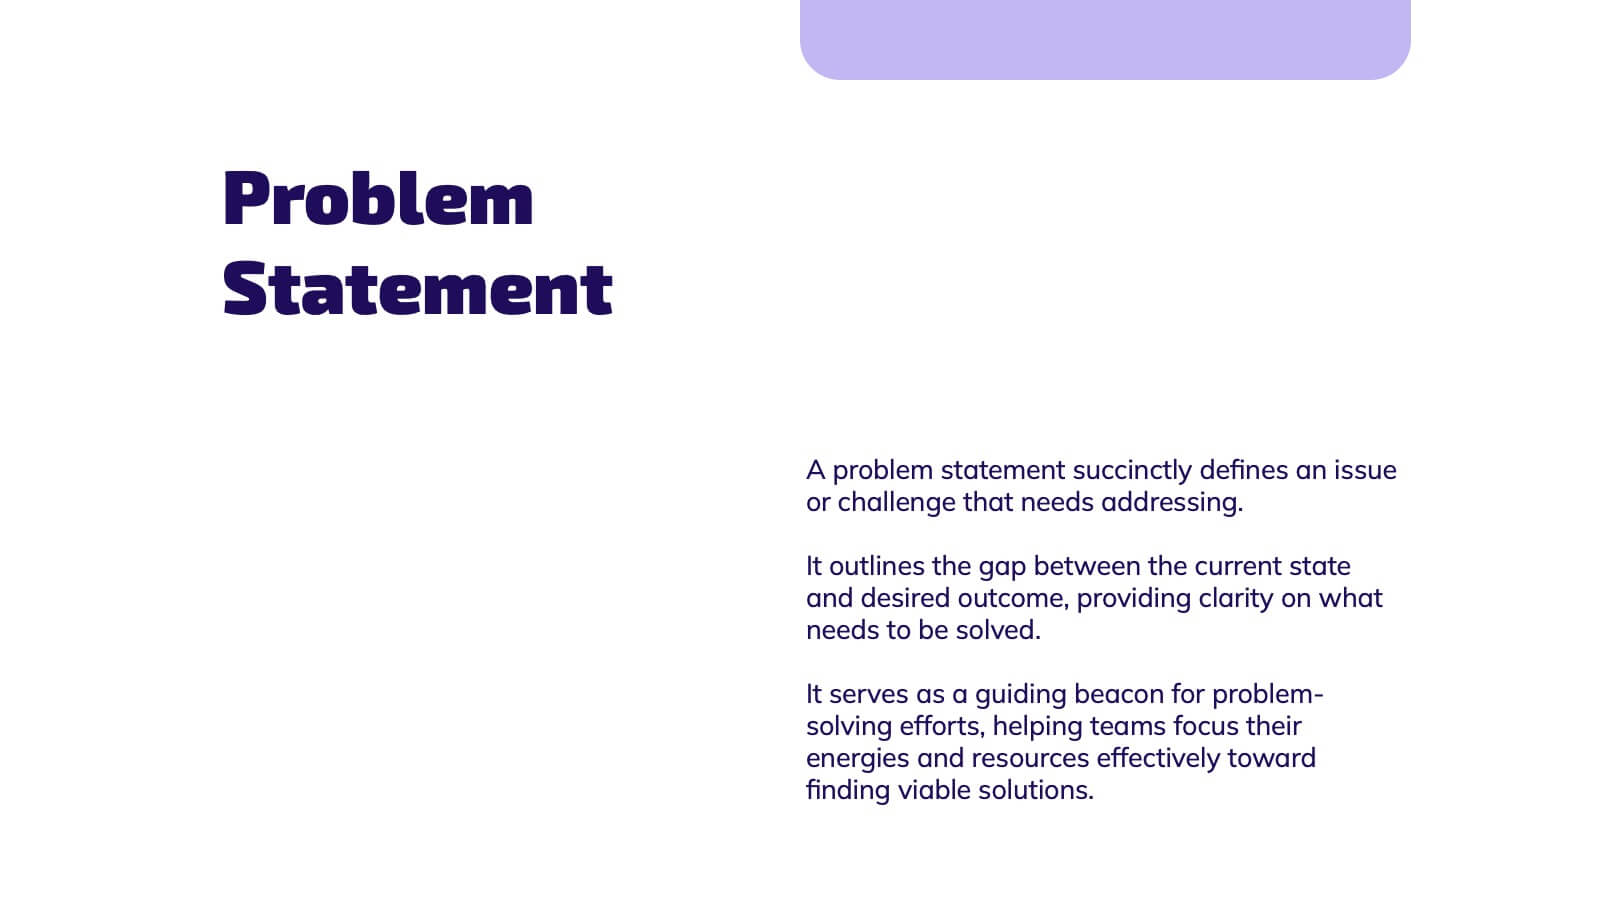
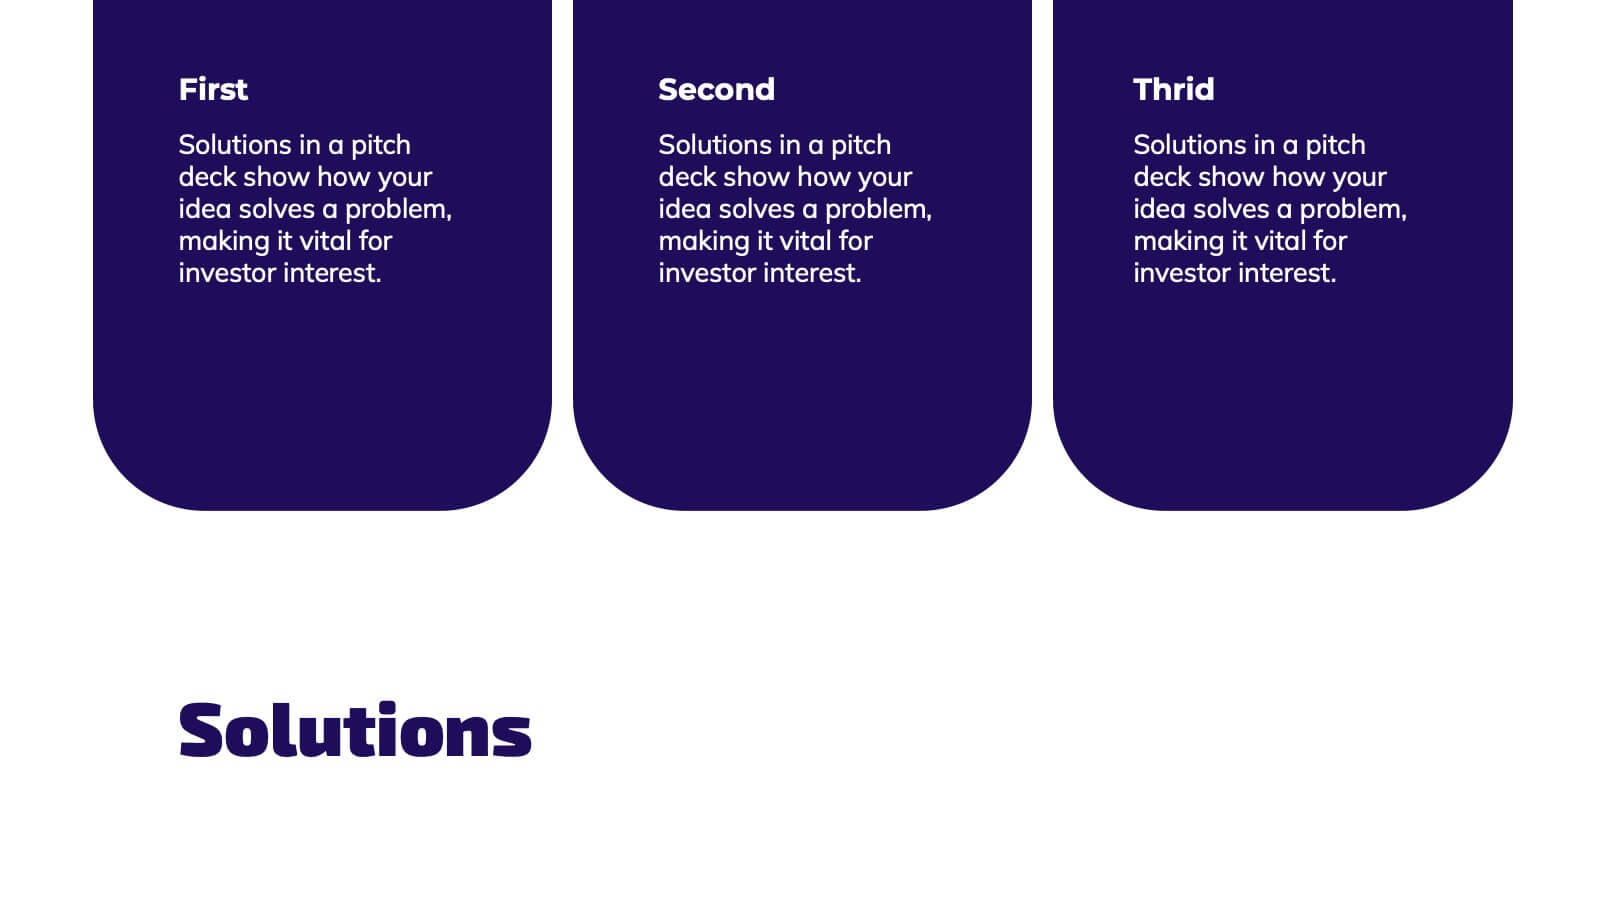
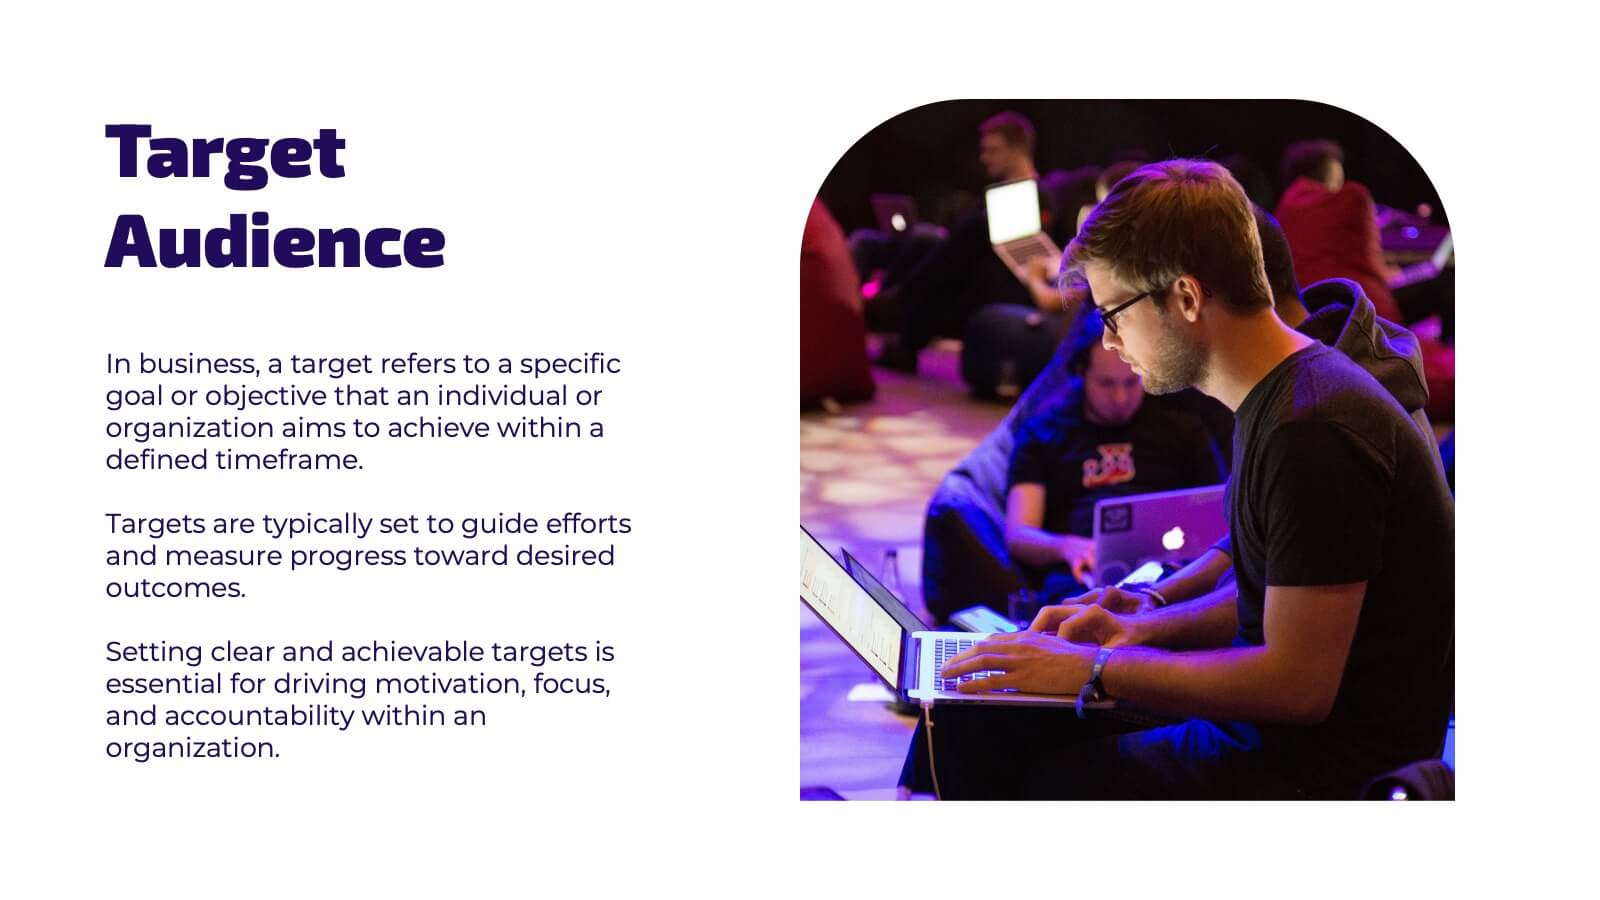
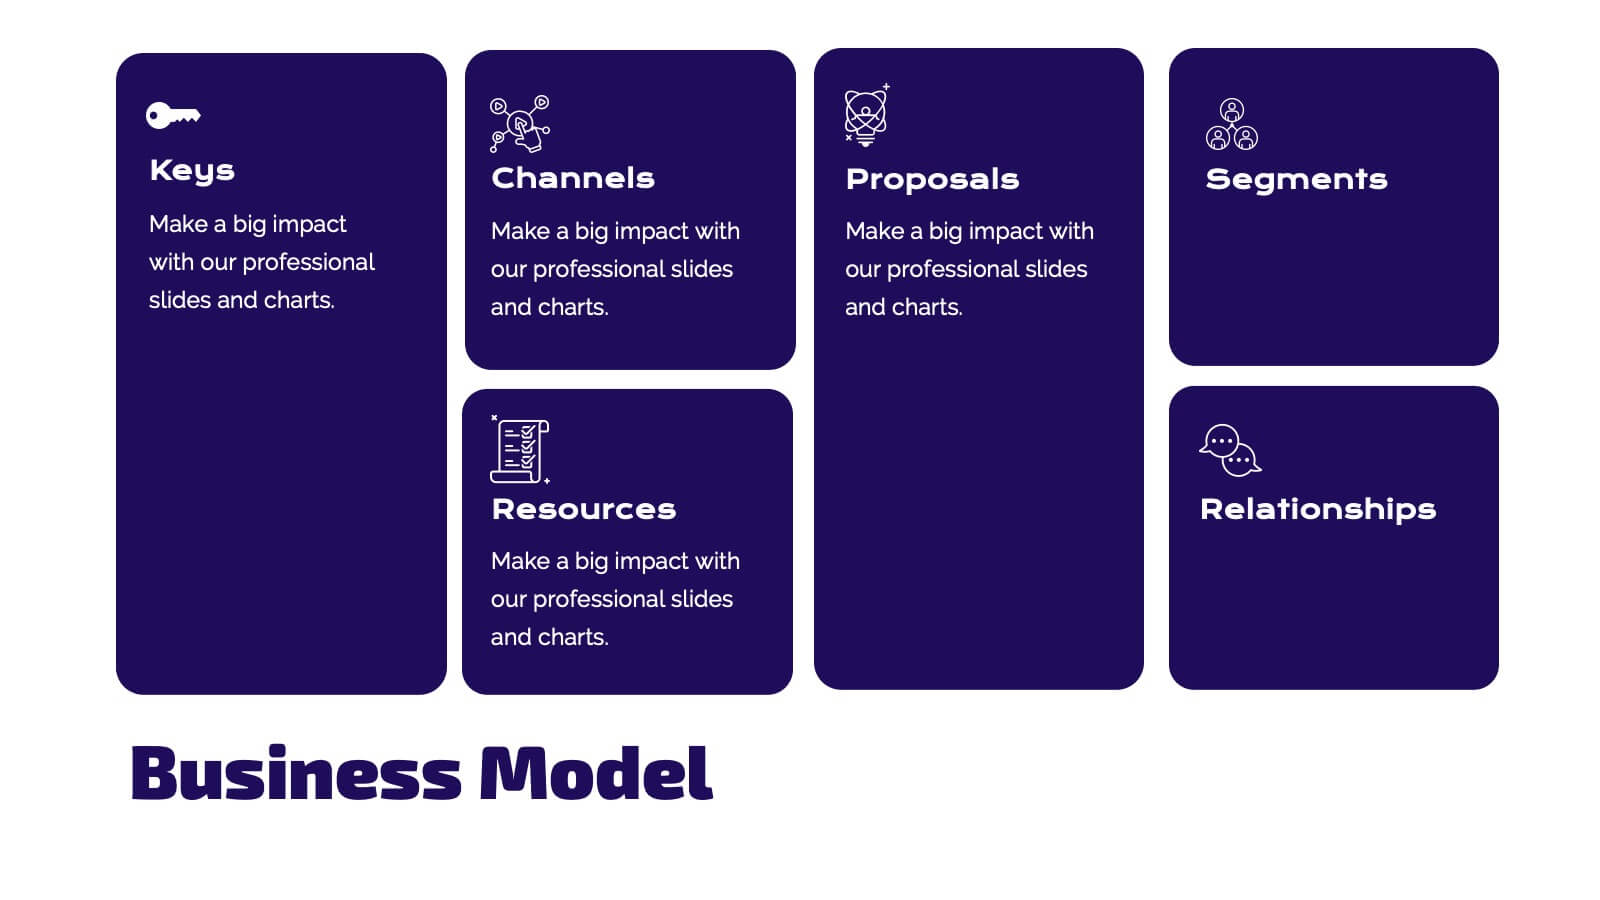
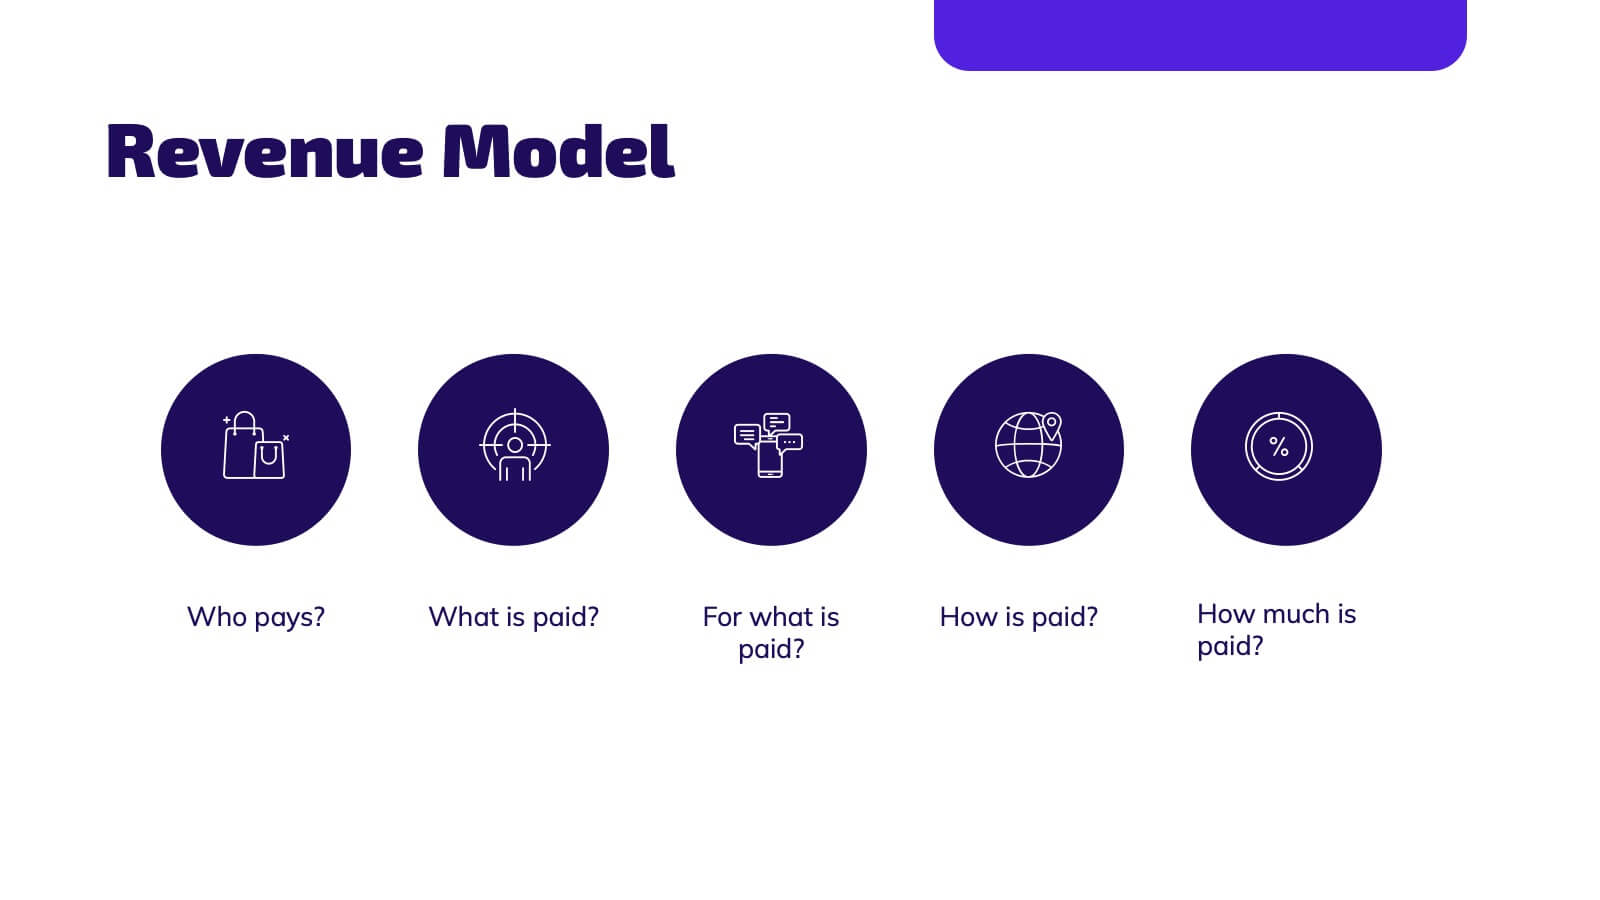
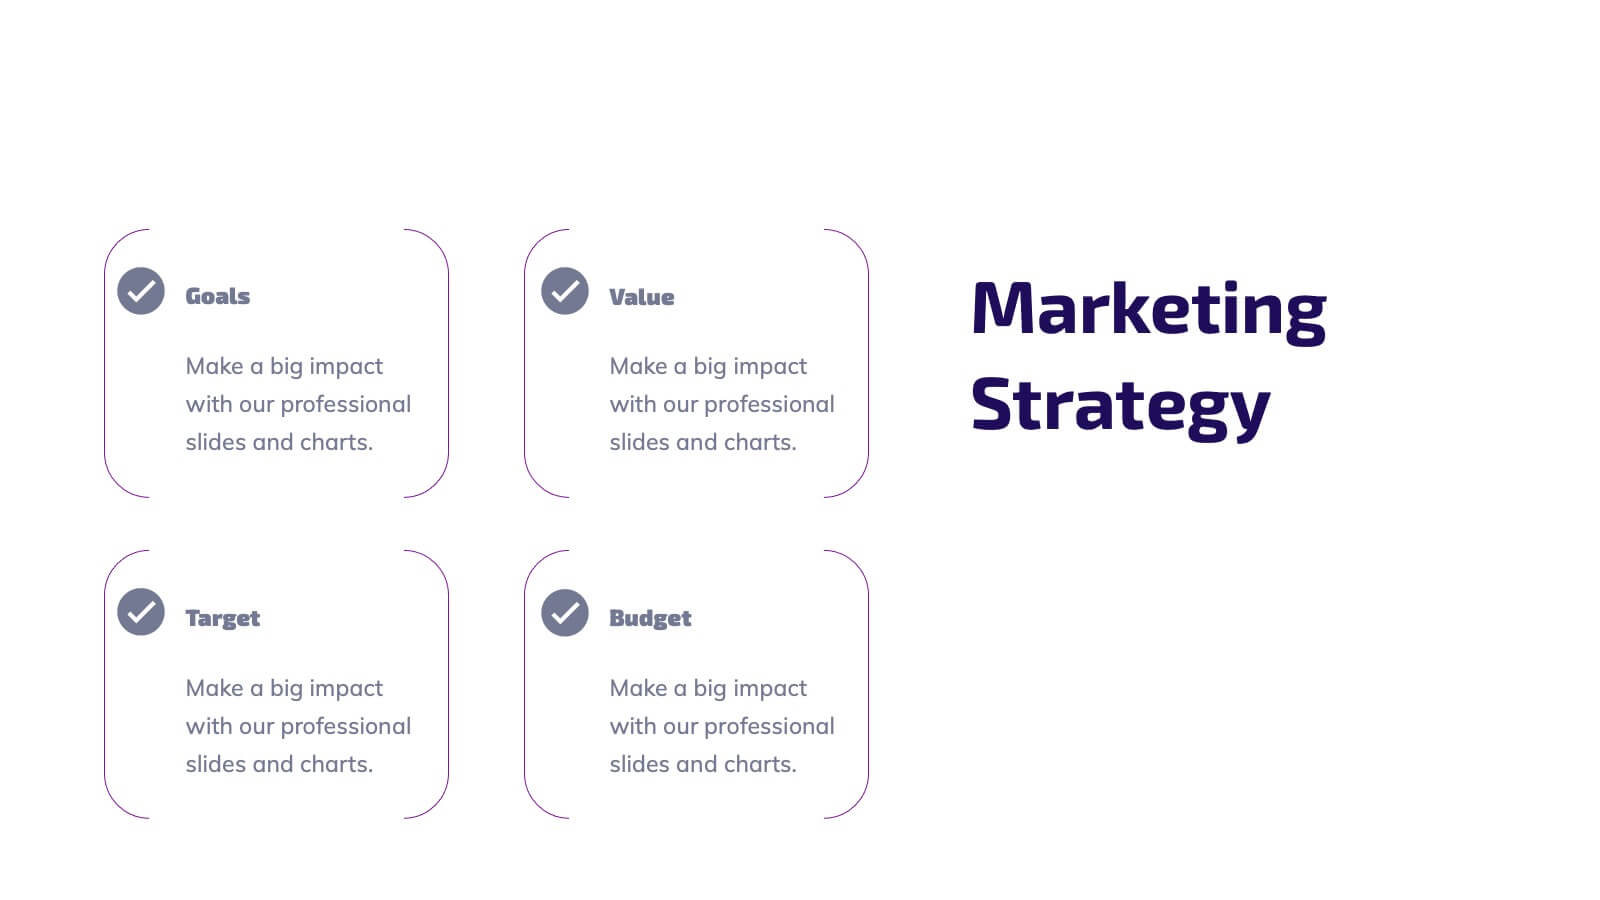
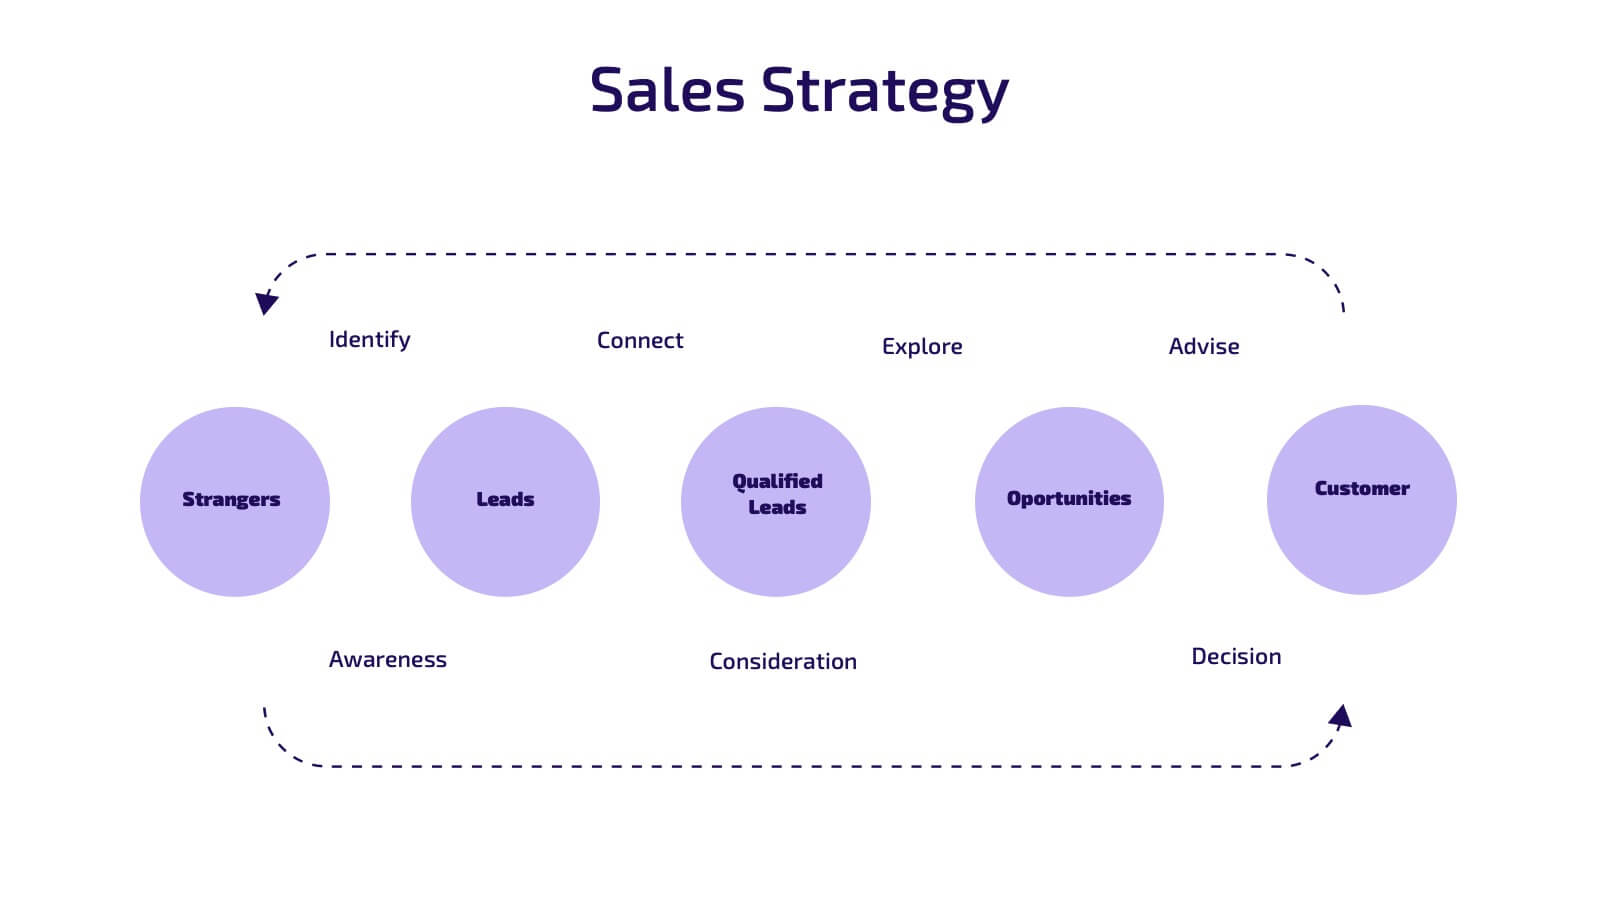
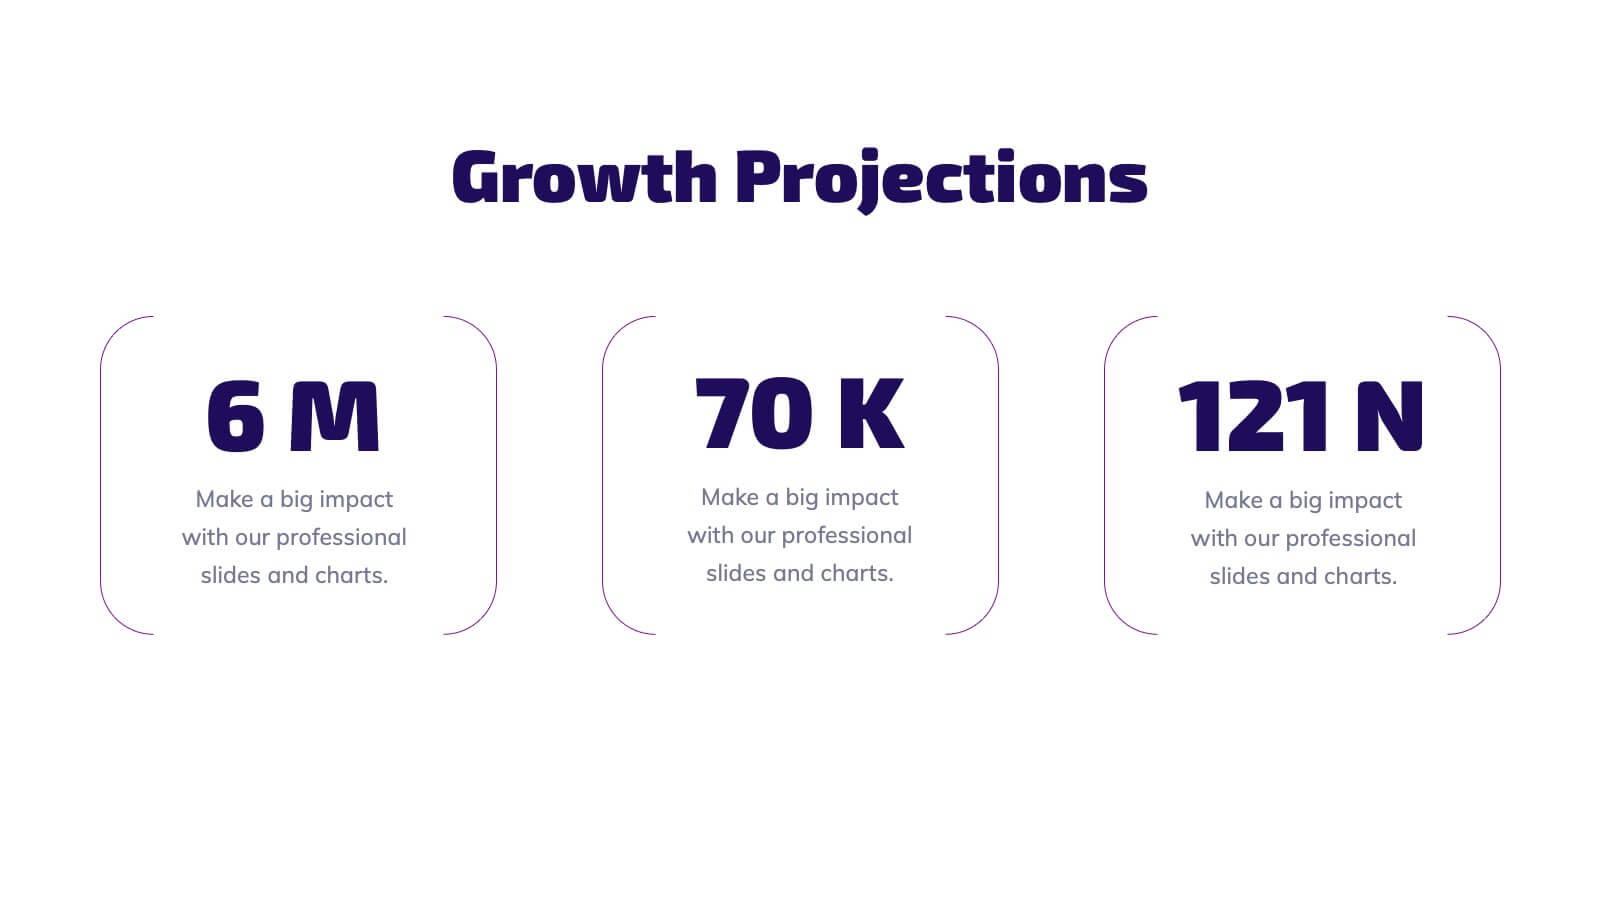
Illume Startup Pitch Deck Presentation
Light up your startup journey with this captivating presentation template! Perfect for pitching your business idea, it guides you through key elements like market analysis, financial projections, and growth strategies. With a modern design that grabs attention, this template will help you shine in front of investors. Compatible with PowerPoint, Keynote, and Google Slides.


12 diapositivas
Creative Alphabet Infographic
Add a bold twist to your data with this Creative Alphabet Infographic slide, featuring a stylized letter “B” puzzle layout. Ideal for branding breakdowns, step-by-step processes, or topic segmentation, each puzzle piece aligns with a customizable title and description. Fully editable in PowerPoint, Keynote, and Google Slides.


7 diapositivas
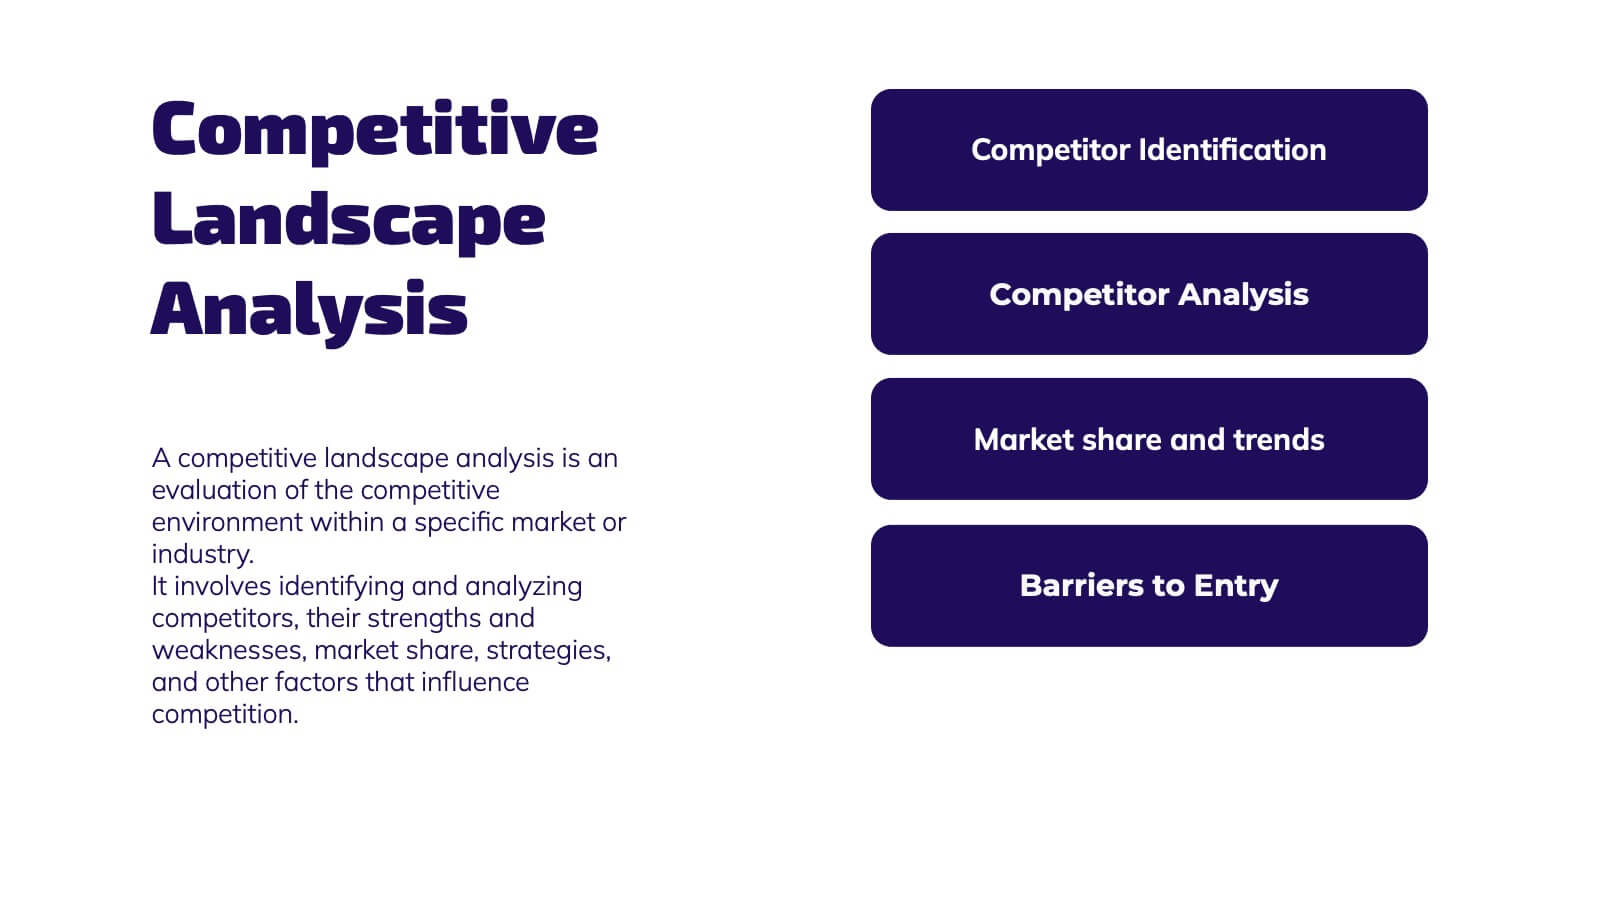
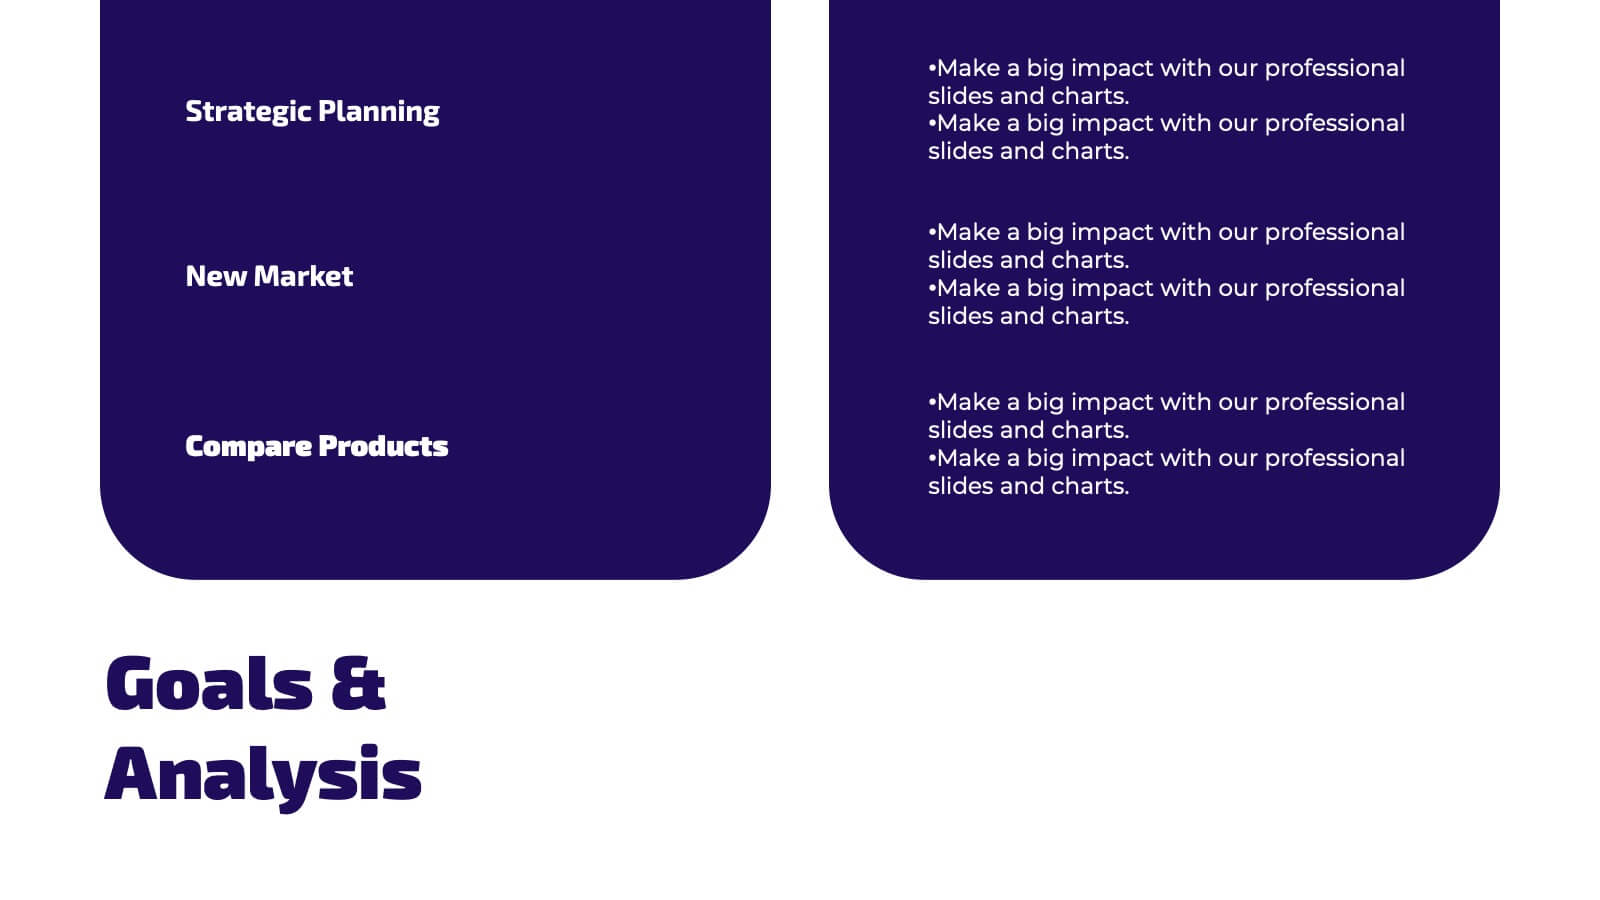
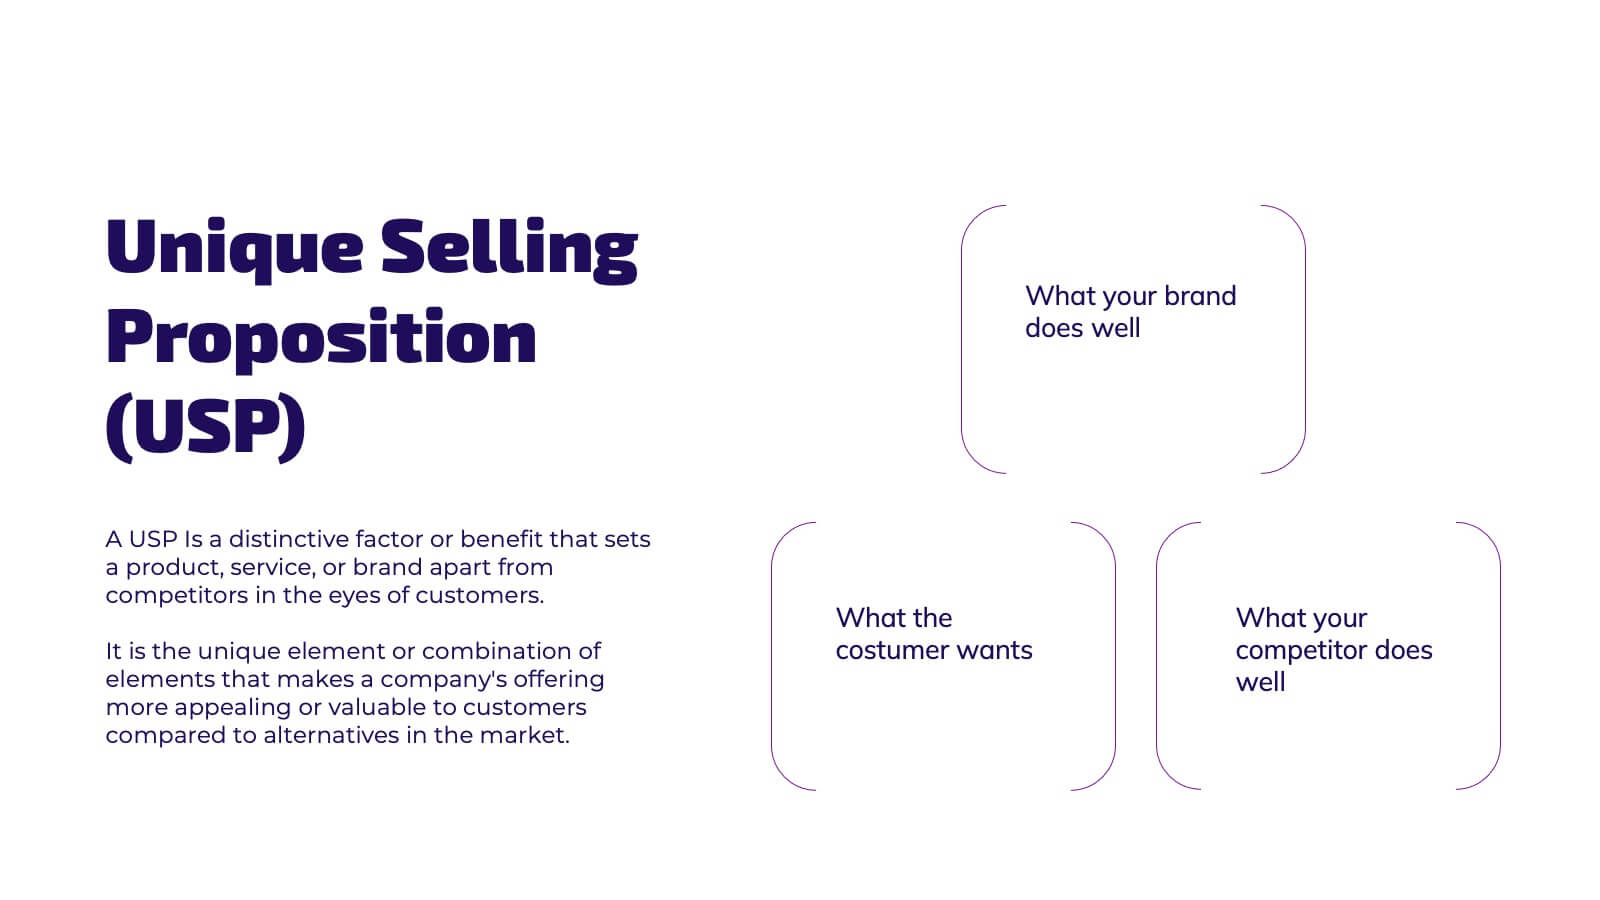
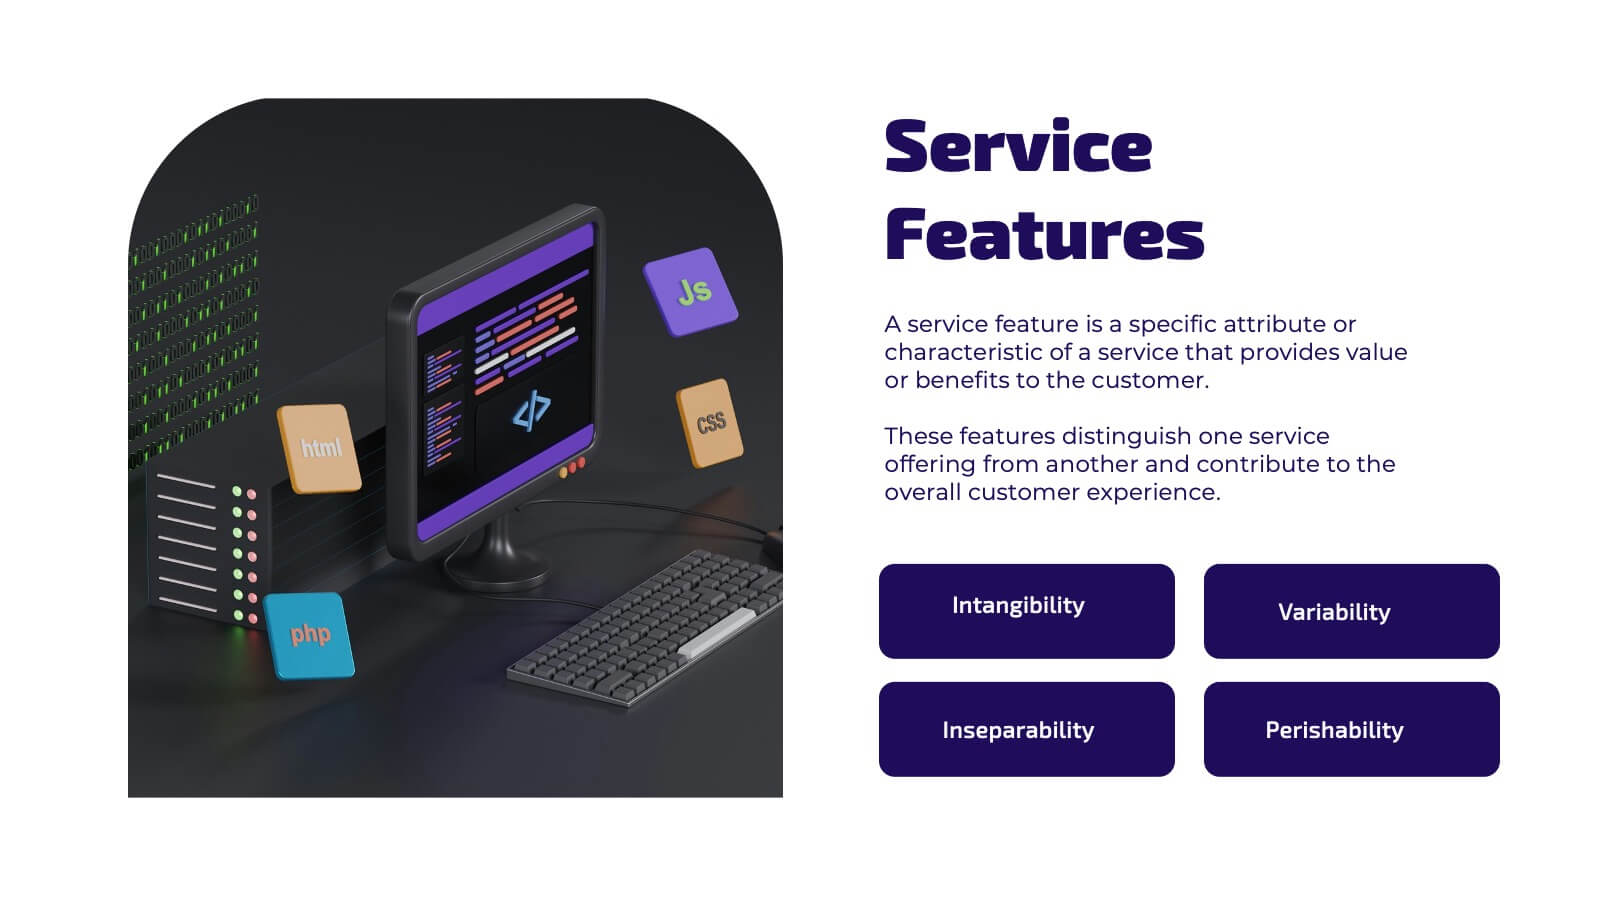
Framework Infographics Presentation Template
A framework infographic is a visual representation of a structured approach or system for addressing a problem, organizing information, or making decisions. Our framework infographic is designed to help you understand complex concepts and to provide a visual roadmap that can be easily followed. This template makes an impact with a professional design, customizable text and graphics, and compelling visual content. If you need to display and share information, charts, graphs or lists in a creative way this template will guide you through each step to create a professional looking infographic.


6 diapositivas
Organizational Objectives and Key Results Presentation
Showcase your strategic goals and measurable outcomes with the Organizational Objectives and Key Results template. Designed with a sleek radial key layout, it’s ideal for mapping priorities and tracking progress. Fully editable in Canva, PowerPoint, and Google Slides, allowing easy customization of colors, icons, and text to fit your objectives.


8 diapositivas
Interactive Digital Learning Experience Presentation
Make your content more engaging with the Interactive Digital Learning Experience Presentation. This layout blends quiz-style visuals and educational icons, helping you present learning modules, assessments, or training checkpoints in a fun and intuitive way. Use it to simplify information, boost audience interaction, or highlight multiple-choice content. Fully editable in Canva, PowerPoint, Keynote, and Google Slides.


5 diapositivas
Company Hierarchical Structure Presentation
Effectively illustrate your company's hierarchy with this Company Hierarchical Structure infographic template. Designed to clarify leadership and team roles, this slide is ideal for corporate presentations, HR onboarding, and management reports. Fully customizable in PowerPoint, Keynote, and Google Slides, ensuring seamless integration with your branding and content needs.
19 diapositivas
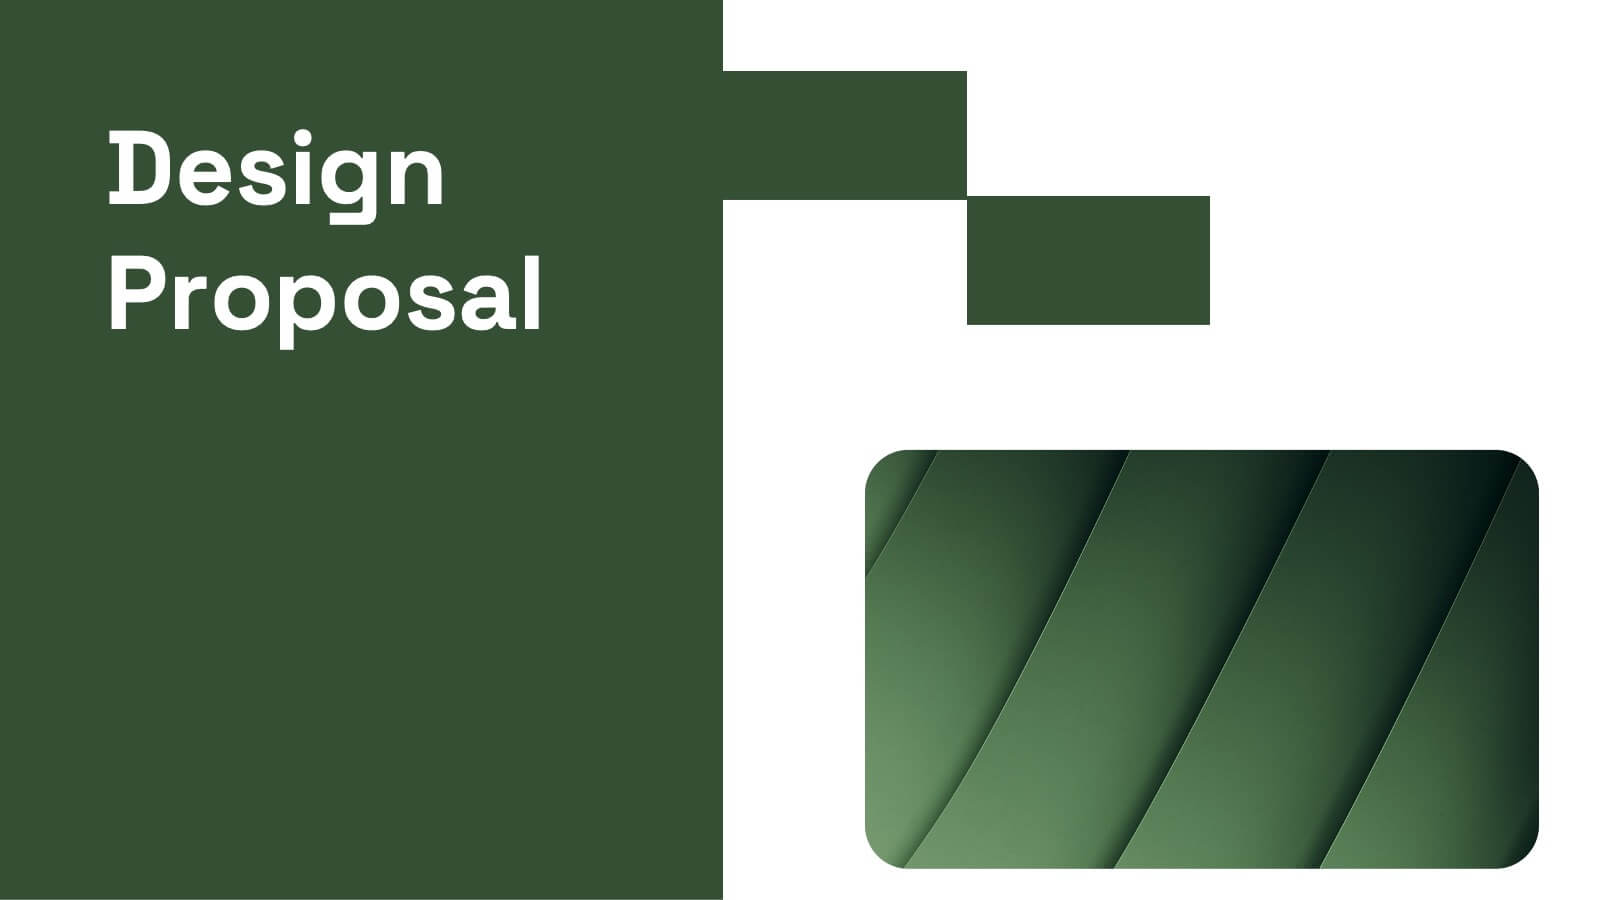
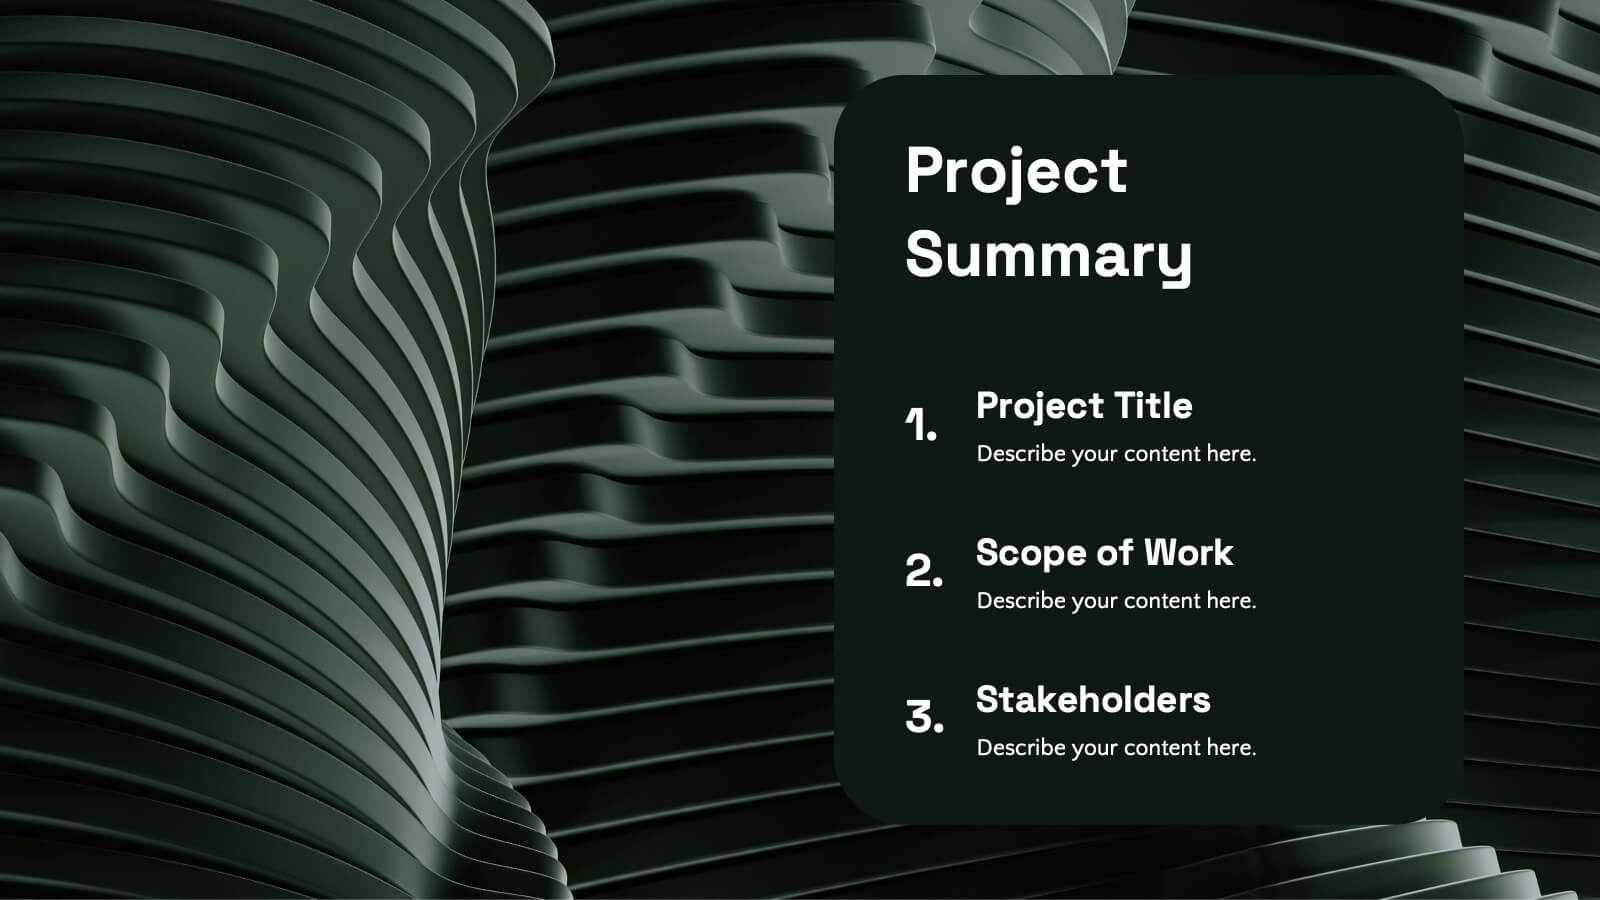
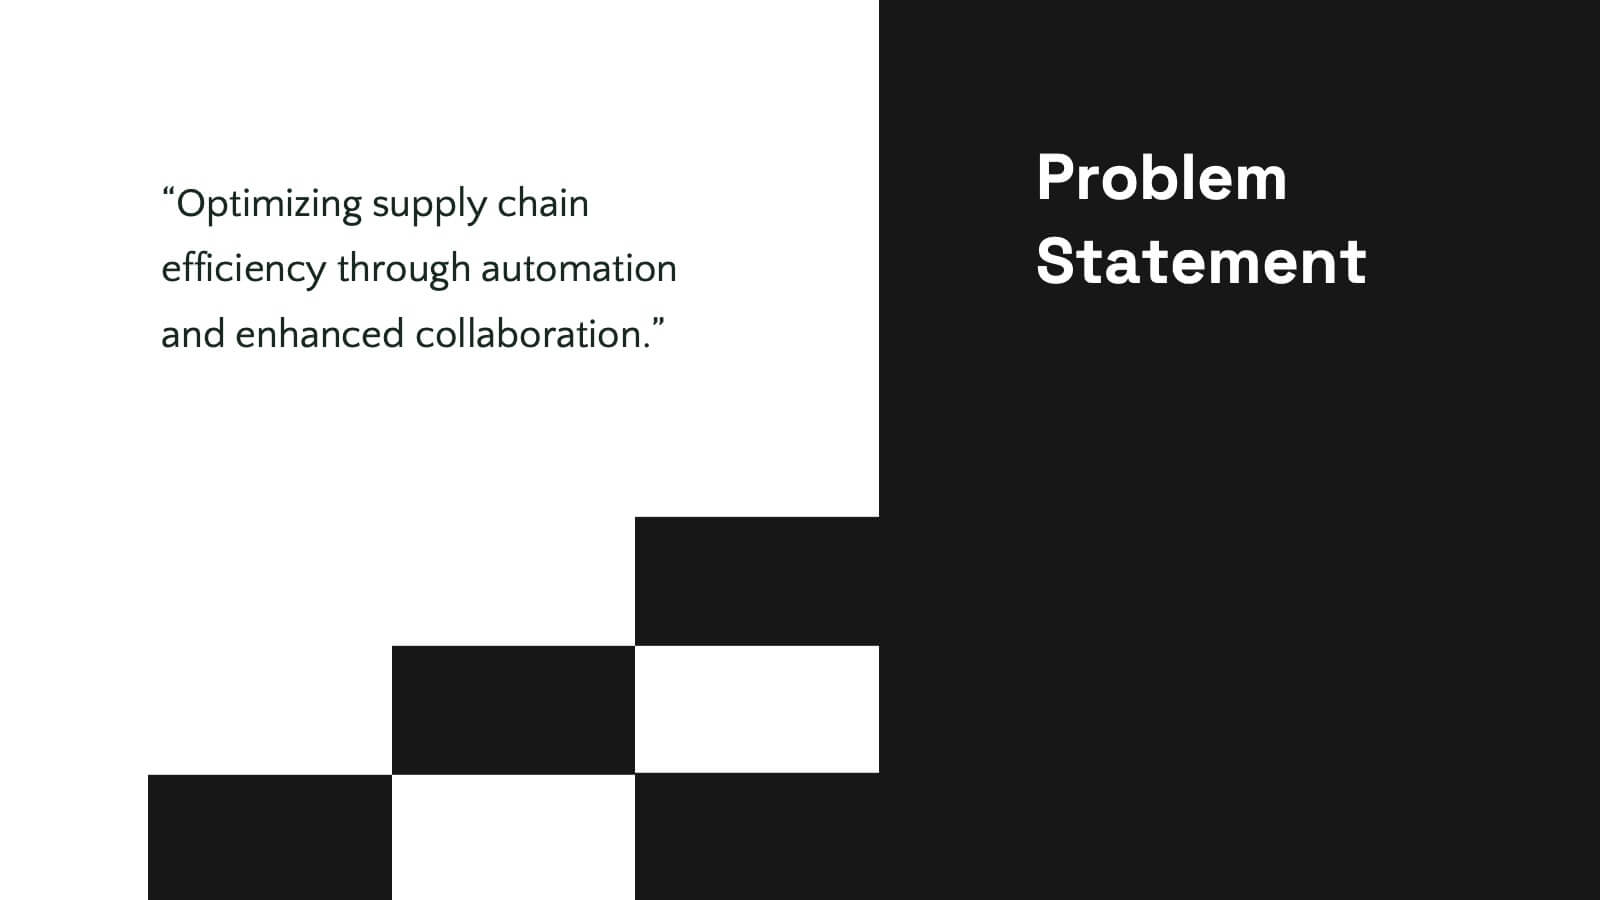
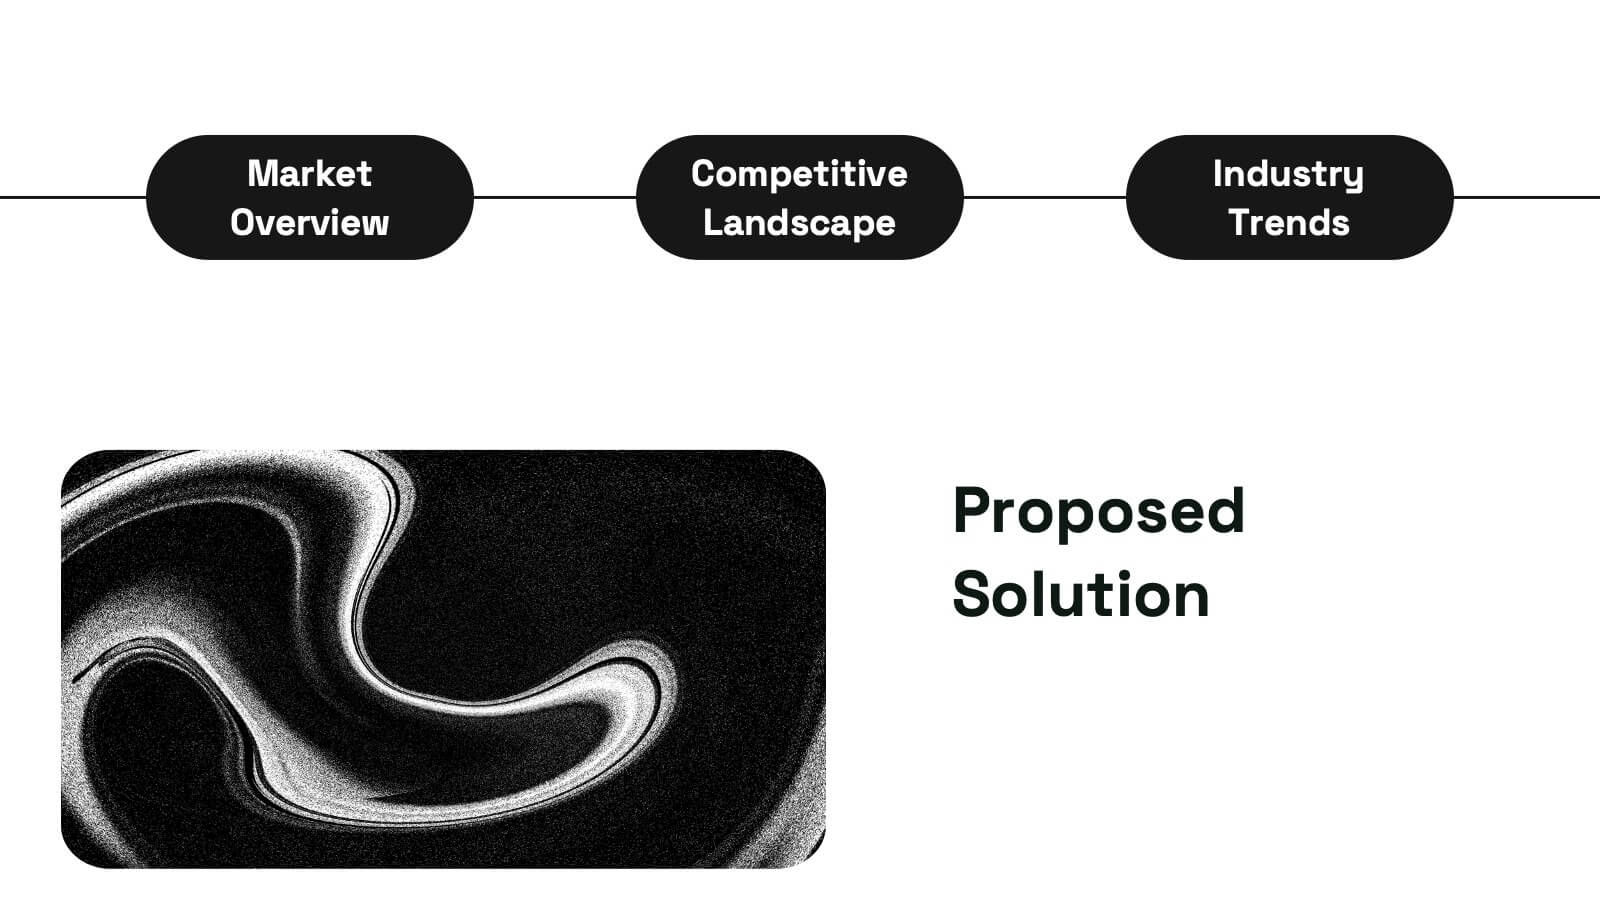
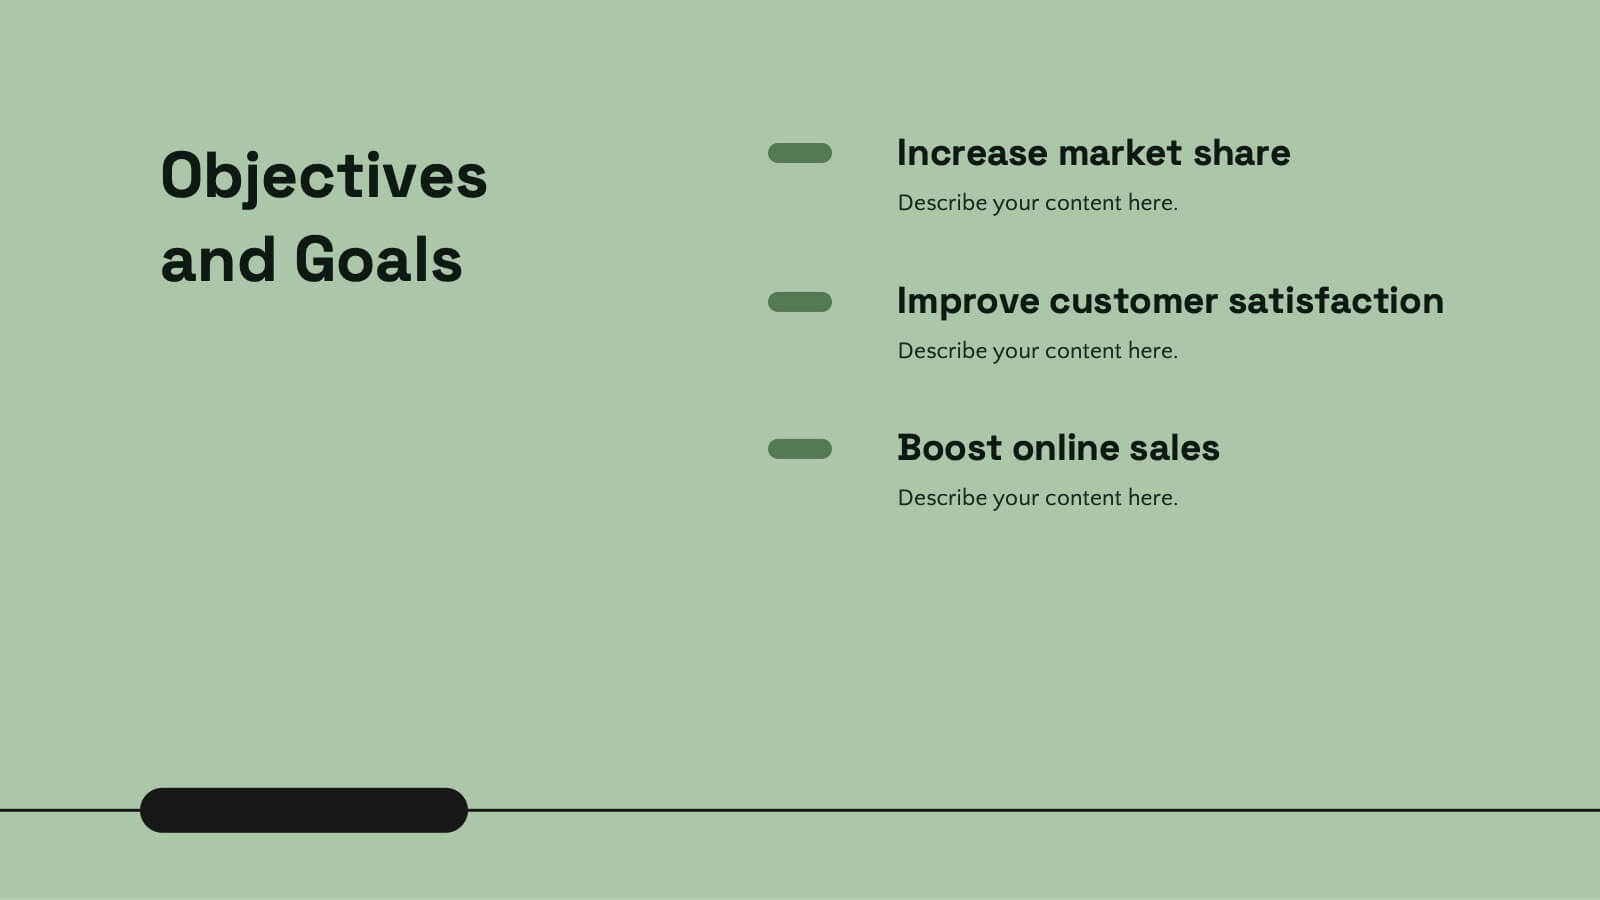
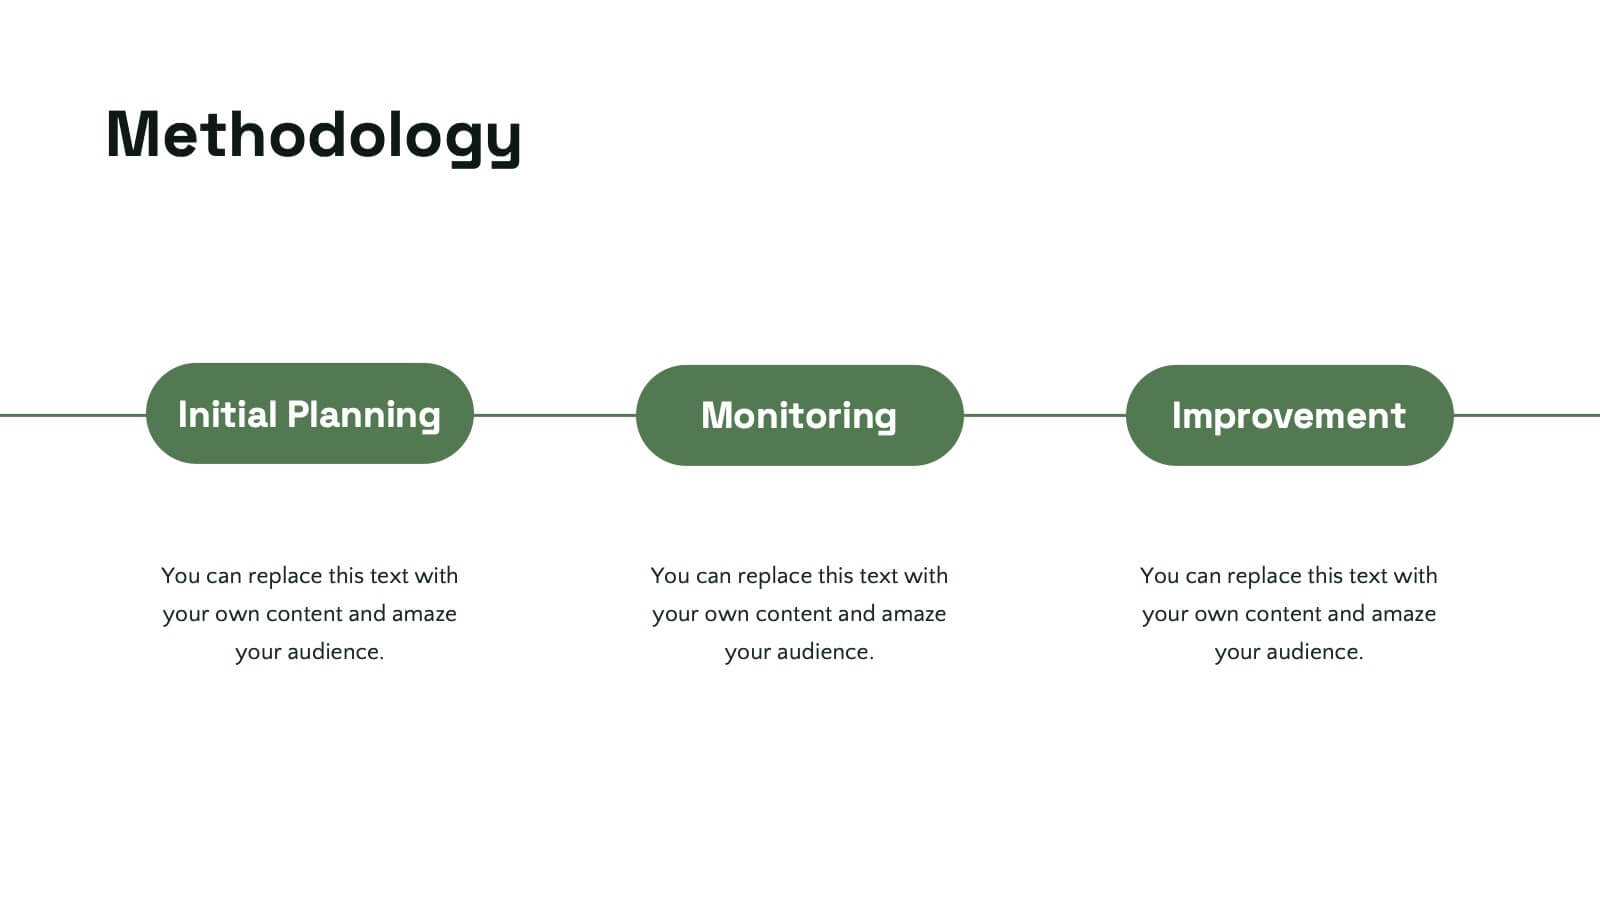
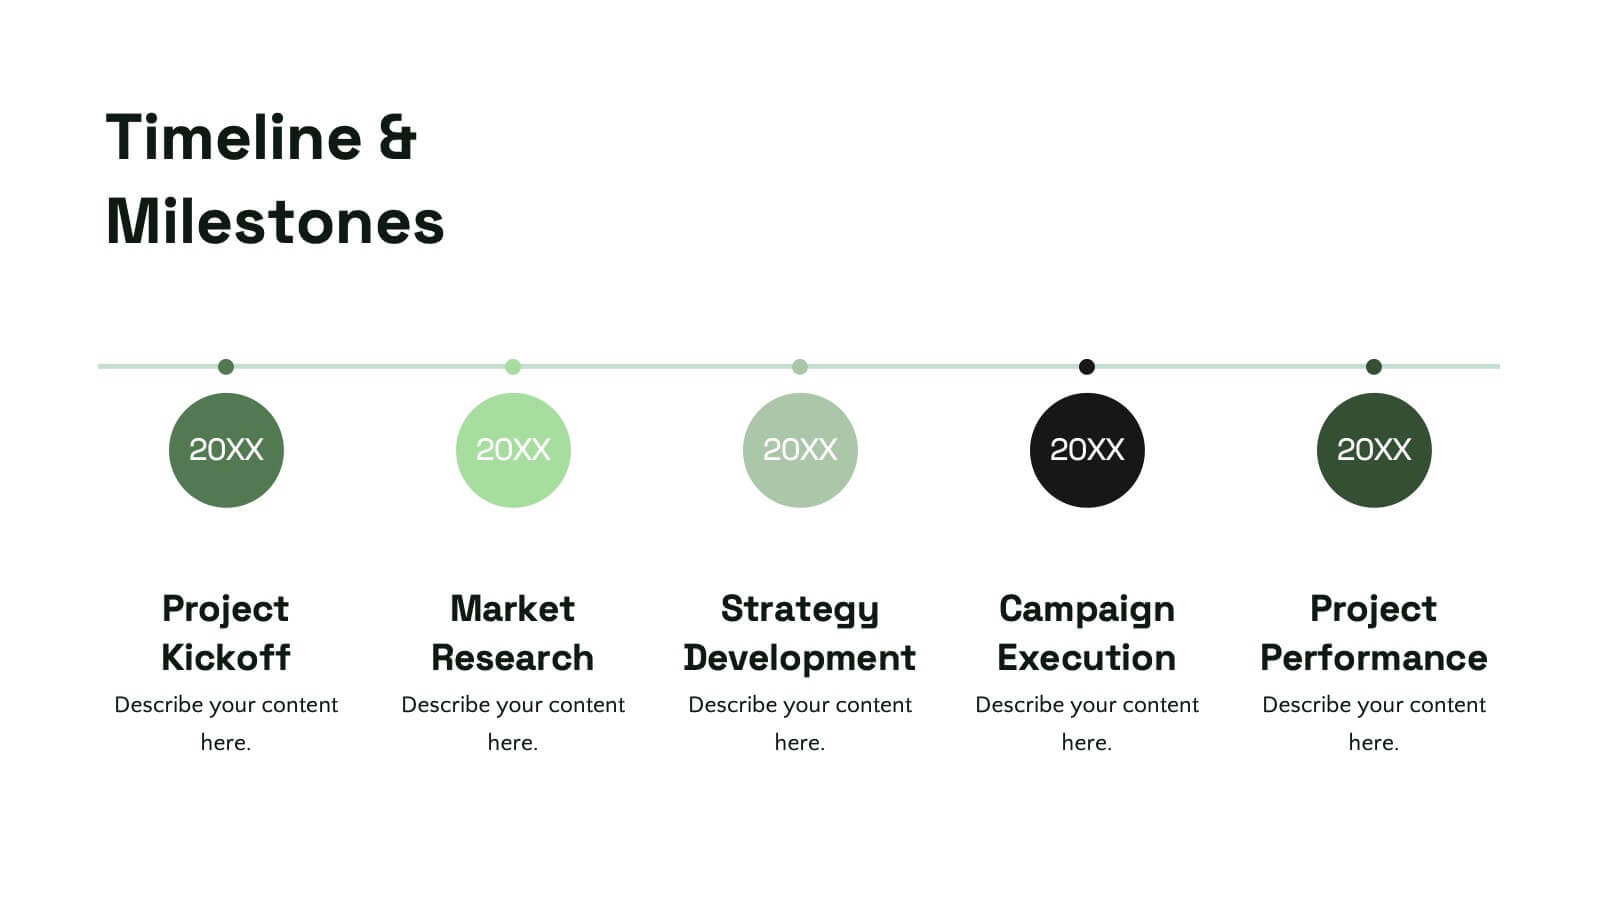
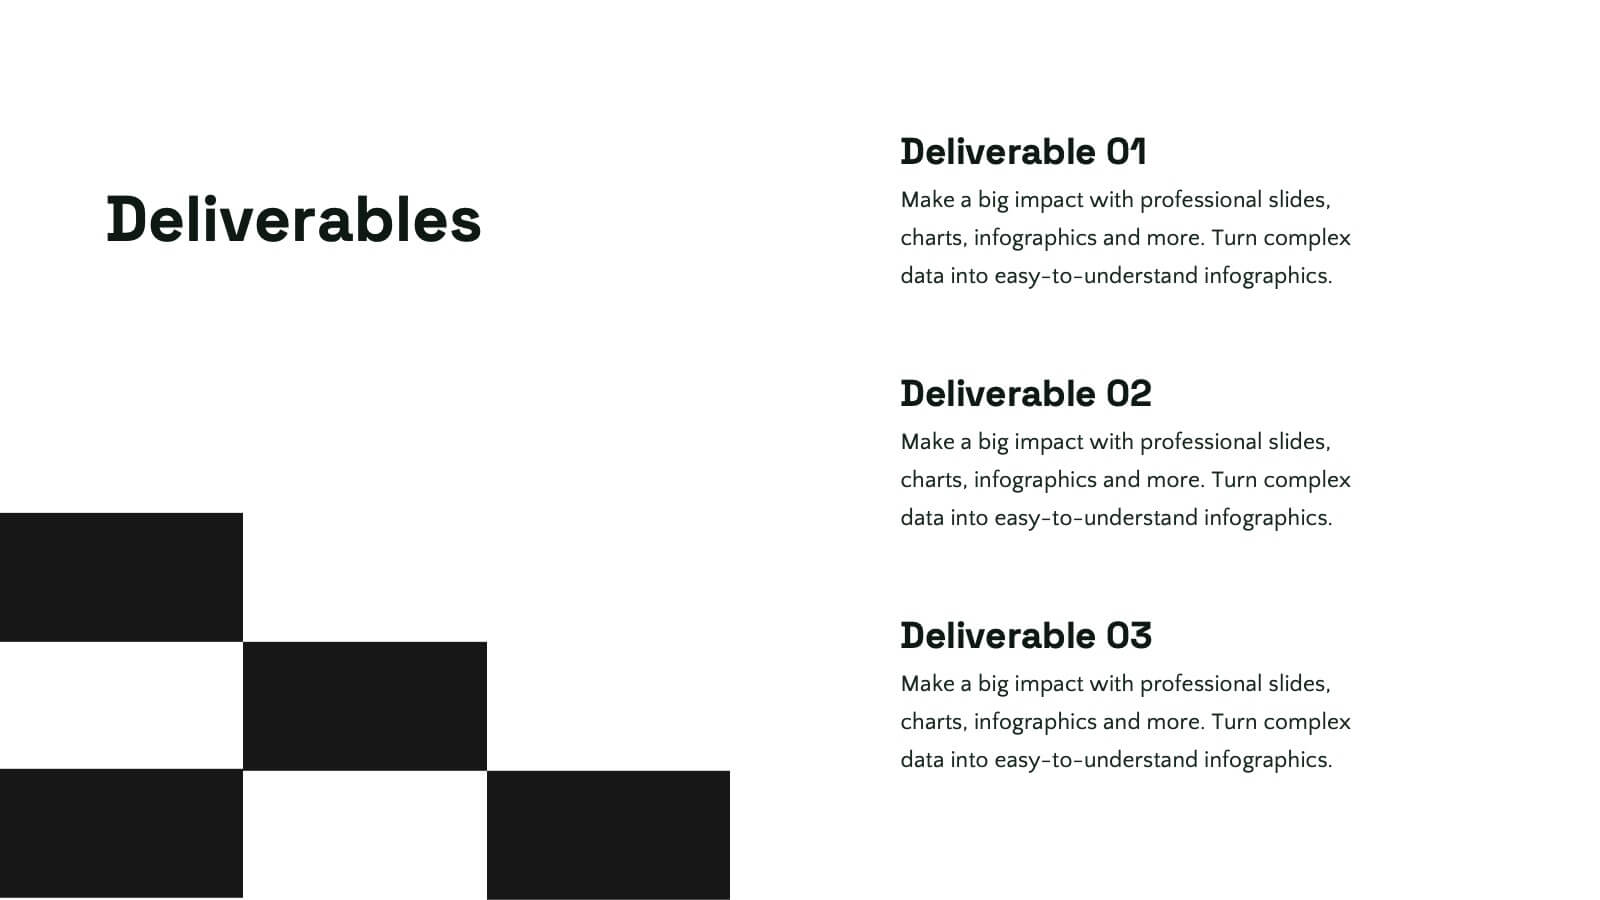
Tidal Design Proposal Presentation
Elevate your pitch with this sleek design proposal template! Perfect for presenting project details, objectives, methodology, and milestones, it ensures your ideas stand out. Impress stakeholders with clear, structured slides and professional aesthetics. Compatible with PowerPoint, Keynote, and Google Slides for a seamless presentation experience across all platforms.


5 diapositivas
Social Distancing and Workplace Safety Presentation
Promote safety in the workplace with this modern and approachable slide layout. Designed around a central illustration of a masked employee at a desk, the slide includes four surrounding text areas with icons to highlight policies, procedures, or key reminders. Perfect for health protocols, return-to-office plans, or HR briefings. Fully editable in PowerPoint, Keynote, and Google Slides.


6 diapositivas
Real Estate and Building Development
Visualize the complete property development process with this modern, keyhole-inspired presentation design. Ideal for real estate developers, architects, and construction planners, this slide clearly outlines six project stages—from concept to completion—using bold icons and a radial layout. Editable in PowerPoint, Keynote, and Google Slides.


4 diapositivas
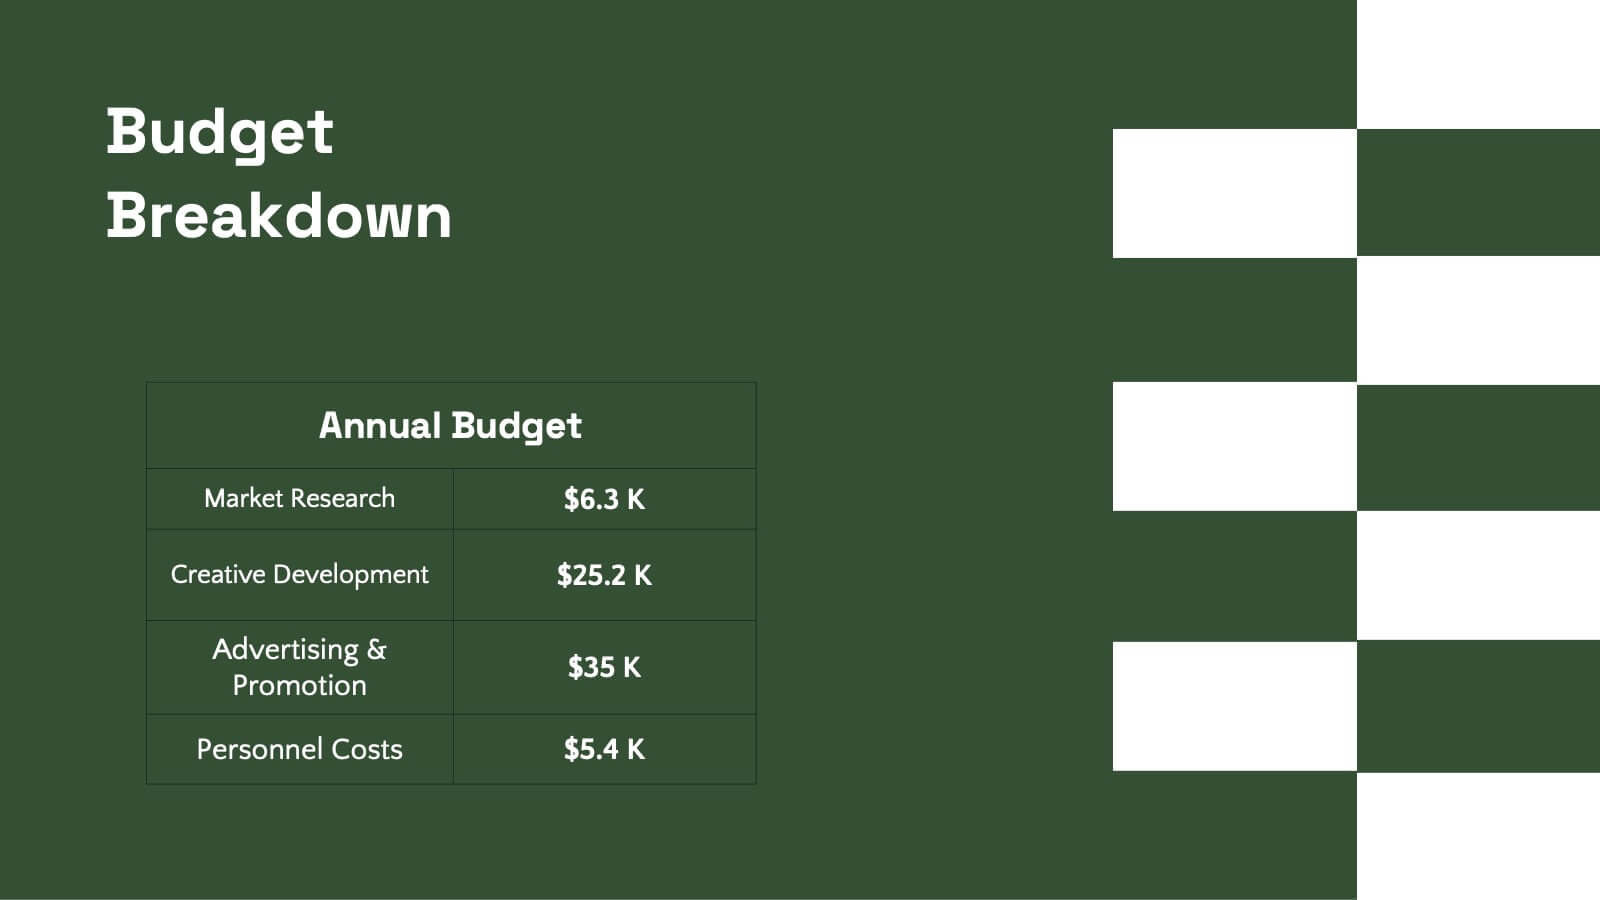
Cost Breakdown for Business Planning Presentation
Visually balance your budget strategy with the Cost Breakdown for Business Planning Presentation. Featuring a scale-style layout, this slide helps you compare two financial metrics or allocations with clarity and simplicity. Ideal for showcasing trade-offs, resource planning, or funding distribution. Fully editable in PowerPoint, Google Slides, Keynote, and Canva.


4 diapositivas
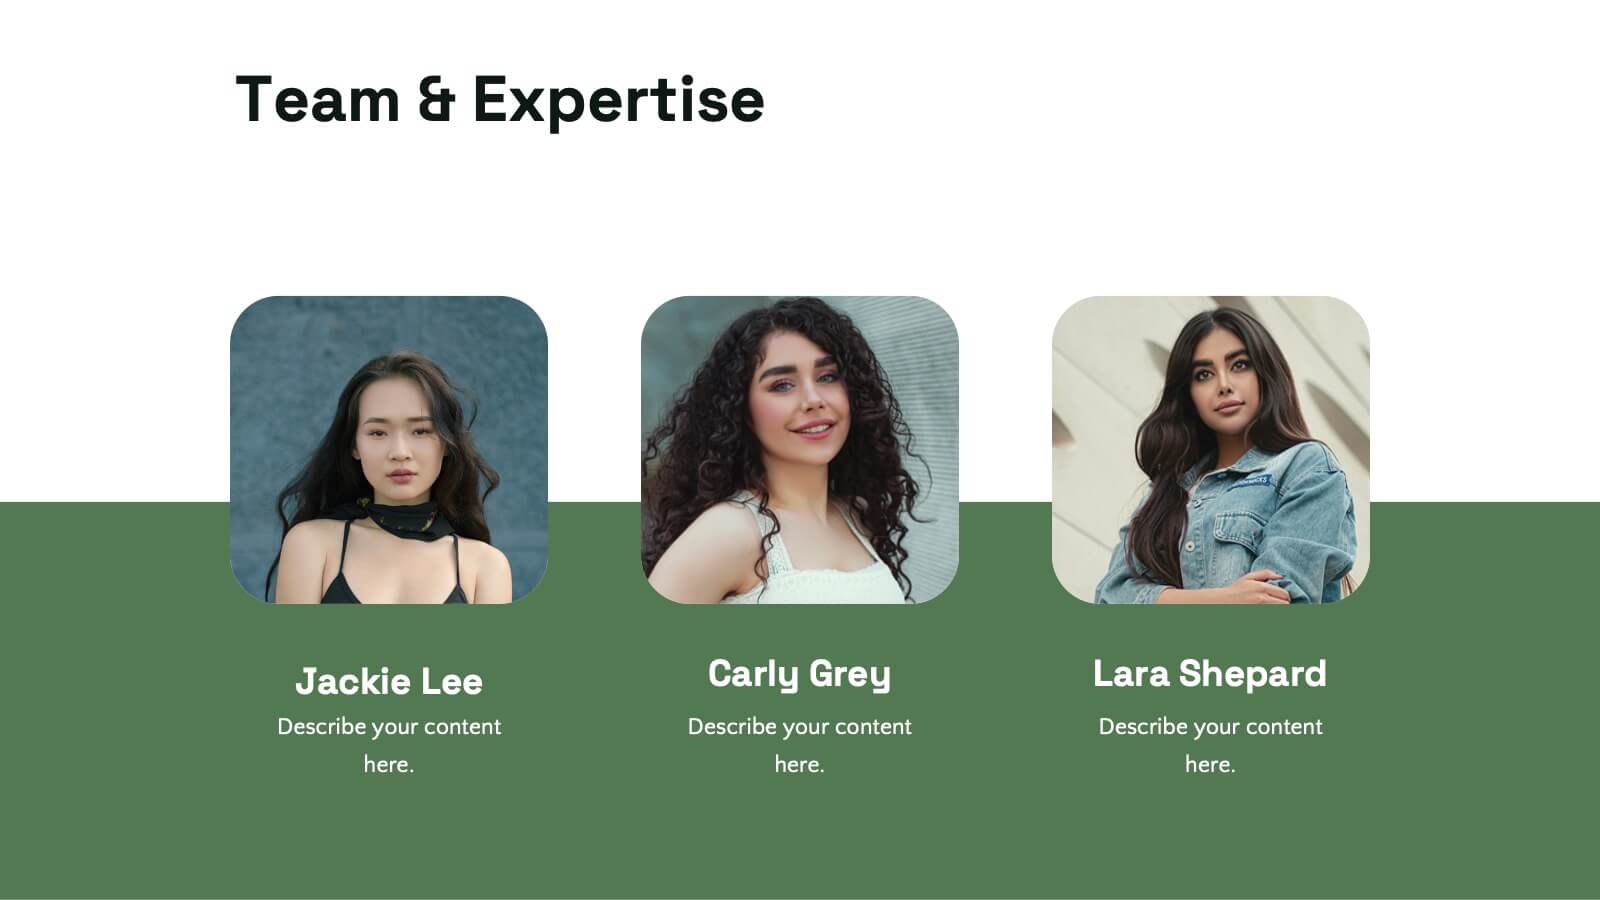
Design and Project Work Samples Presentation
Showcase your creative projects with this visually structured layout. Featuring a bold title area and three image slots for key works, it’s perfect for portfolios, proposals, or pitch decks. Fully editable in PowerPoint, Keynote, and Google Slides to suit your brand and project presentation needs.


6 diapositivas
Company Expansion Timeline Presentation
Show your company’s growth story in a way that’s both professional and visually captivating. This presentation template helps you outline milestones, future goals, and expansion phases with clarity and style. Fully customizable and compatible with PowerPoint, Keynote, and Google Slides for effortless editing and polished results.


6 diapositivas
PESTEL Management Infographic
PESTEL analysis is a framework used to assess and analyze the external macro-environmental factors that can impact an organization, industry, or market. This infographic template provides an overview of the PESTEL analysis framework and its application in strategic management. This template provides a clear and concise explanation of the PESTEL analysis framework, detailing each component of the acronym for you to use. It highlights the significance of considering these external factors when formulating business strategies and making informed decisions. Compatible with Powerpoint, Keynote, and Google Slides.