


Características


¿Tienes alguna pregunta?
Recomendar


6 diapositivas
Search Engine Optimization Campaign Overview Presentation
Kick off your digital strategy with a clean, modern layout that makes every key insight feel connected and actionable. This presentation helps you explain campaign goals, highlight SEO priorities, and break down essential tasks in a structured, visual flow. Fully compatible with PowerPoint, Keynote, and Google Slides.


6 diapositivas
4 Stage Roadmap Template
Navigate your projects with clarity using our "4 Stage Roadmap Template." This engaging presentation template offers a unique, pathway-like design to outline the progression of any project through four distinct stages. Each step is visually differentiated, making it easy to follow and understand the sequence and dependencies of tasks. Perfect for project managers and teams, this template ensures your strategic milestones are visually aligned and easy to communicate. Compatible with PowerPoint, Keynote, and Google Slides, it's an essential tool for effective project visualization and management.


6 diapositivas
Strategic PESTEL Presentation
Kickstart smarter strategy sessions with a clean, colorful layout that makes external factor analysis feel effortless. This presentation helps teams map trends, identify risks, and understand the broader environment shaping business decisions. Clear visuals keep insights organized and actionable. Fully compatible with PowerPoint, Keynote, and Google Slides.


6 diapositivas
Framework Version Infographic
A framework infographic is a visual representation that outlines a structured approach, model, or framework for understanding a concept, solving a problem, or making decisions. This infographic template involves visually presenting different versions of a software or system framework along with their features and benefits. Summarize the improvements and benefits introduced by each framework version. This template provides a clear overview of the evolution of the framework and how each version brought value to users. By using icons, graphics, and concise descriptions, you can make the information easily digestible and engaging for your audience.


21 diapositivas
Frost Design Proposal Presentation
Present your design proposal with sophistication and clarity using this elegant template! Perfect for outlining your project summary, objectives, and proposed solutions, this template covers everything from scope of work and budget breakdowns to deliverables and team expertise. Fully compatible with PowerPoint, Keynote, and Google Slides, it's designed for seamless, professional presentations.


7 diapositivas
Iceberg Infographic Presentation Template
An Iceberg infographic is a powerful and eye-catching way to display information, it is a method for presenting complex information. This template is designed to be fully customizable and include all the elements you need to make an impact on your audience. The Iceberg can be used to visualize any concept that has a direct impact on your performance, from sales to customer retention, from how organizations are staffed to identifying the key players within teams. Use this template to create a detailed iceberg diagram of your business, its customers, and the things that impact them.


4 diapositivas
Project Timeline & Milestone Presentation
Stay on track and visualize your progress with this Project Timeline & Milestone Presentation. Perfect for project managers and team leads, this template features a clean Gantt-style layout that spans multiple months, allowing you to clearly map out tasks, timelines, and key milestones. Use it to enhance stakeholder reporting or internal planning sessions. Fully editable in PowerPoint, Keynote, and Google Slides.


5 diapositivas
Global Warming Crisis Infographics
Global Warming refers to the long-term increase in the Earth's average surface temperature, primarily caused by the buildup of greenhouse gases in the atmosphere. This vertical infographics includes information about the effects of climate change on the planet. There are designed sections where you can feature data on rising temperatures, sea levels, and extreme weather events. These infographics feature unique designs that incorporate colors and images that convey the severity and urgency of this crisis. The goal of this template is to raise awareness about the need to address the global warming crisis and mitigate the impact of climate change.


5 diapositivas
Studio Photography Infographics
Studio Photography is the practice of capturing photographs in a controlled environment, typically a dedicated photography studio. These infographic templates highlight the key aspects of studio photography with examples of fashion photography, photojournalism, and photography terminology. These are designed to assist photographers, photography studios, and enthusiasts in showcasing the essential elements and techniques involved in capturing stunning images in a studio setting. Use these to provides valuable insights and techniques to help your audience create stunning images in a studio environment. Compatible with Powerpoint, Keynote, and Google Slides.


3 diapositivas
Short-Term and Long-Term Action Goals Presentation
Plan with purpose using the Short-Term and Long-Term Action Goals Presentation. This clear, side-by-side layout helps you organize initiatives by timeframe—perfect for project planning, strategy roadmaps, or goal tracking. Fully editable in Canva, PowerPoint, and Google Slides for easy customization across teams and presentations.


5 diapositivas
Financial Market Trends and Forecast Presentation
Visualize economic shifts and data insights with this upward growth line infographic. Ideal for presenting financial forecasts, investment strategies, and market milestones, this layout features a stylized arrow path with icons, letter markers, and space for detailed annotations. Fully editable and compatible with PowerPoint, Keynote, and Google Slides.


24 diapositivas
Kepler Investor Pitch Presentation
Impress potential investors with this thoughtfully crafted investor pitch presentation template. Its sleek design is tailored to captivate attention while delivering a clear and concise narrative about your business. Highlight key sections, including your company overview, problem statement, and innovative solutions, all designed to set you apart from the competition. Dive deep into your market opportunities, target audience, and revenue model, using visually engaging layouts and infographics. Showcase growth projections, financial overviews, and funding requirements with clarity and professionalism. Additionally, present your unique selling proposition, milestones, and risk analysis effectively. With dedicated slides for team introductions and a compelling close, this template is perfect for startups and established businesses alike. Fully customizable and compatible with PowerPoint, Google Slides, and Keynote, it ensures seamless branding and adaptability for any presentation. Engage your audience and secure the investment you need!


4 diapositivas
Breast Cancer Awareness Campaign Presentation
Raise awareness with impact using the Breast Cancer Awareness Campaign Presentation. This visually engaging design uses symbolic visuals to highlight key messages, educate audiences, and inspire action. Perfect for nonprofit initiatives, educational sessions, or health campaigns. Fully editable in PowerPoint, Google Slides, Keynote, and Canva for easy customization.


6 diapositivas
Trip Planning Framework and Schedule Presentation
Plan every detail of your journey with ease using this Trip Planning Framework and Schedule Presentation. This template includes dedicated sections for dates, destinations, transportation, to-do lists, and shopping needs, all structured in a clean and colorful layout. Ideal for travel agents, personal planners, and group trip organizers. Fully editable in PowerPoint, Keynote, and Google Slides.


26 diapositivas
Coffee Shop Simple Presentation
Perk up your presentation with this Coffee Shop template, brimming with the energy of a bustling café. It’s the perfect blend for baristas, café owners, or anyone presenting on the coffee industry. The design features rich, warm colors and images that evoke the cozy ambiance of a coffee shop. Introduce your team with 'Meet Our Team' slides, and discuss your menu or business strategies with the option slides. Utilize the 'Chart Slide' for sales figures or customer preferences, and map out your global coffee sources with the 'Asia Map Slide'. The 'Mobile Device Mockup' is ideal for demonstrating your café's app or online ordering system. Each slide is like a cup of your finest brew—crafted to energize and engage your audience. The 'Thank You' slide sends them off with the satisfaction of a well-spent coffee break. This template isn’t just a visual aid; it's an experience, inviting your audience to savor every detail of your coffee-centric venture.


5 diapositivas
Natural Disaster Effects Infographics
Natural Disasters are sudden and extreme events caused by natural forces that result in significant damage, and loss of life. This template is designed to effectively educate your audience about the effects of natural disasters and promote awareness and preparedness for such events. With this template you can present the effects and consequences of various natural disasters. Compatible with Powerpoint, Keynote, and Google Slides. It features a nature design with customizable photo layouts, charts, and infographics that help illustrate the effects. Use these visuals to depict different types of natural disasters, such as earthquakes, floods, and wildfires.


23 diapositivas
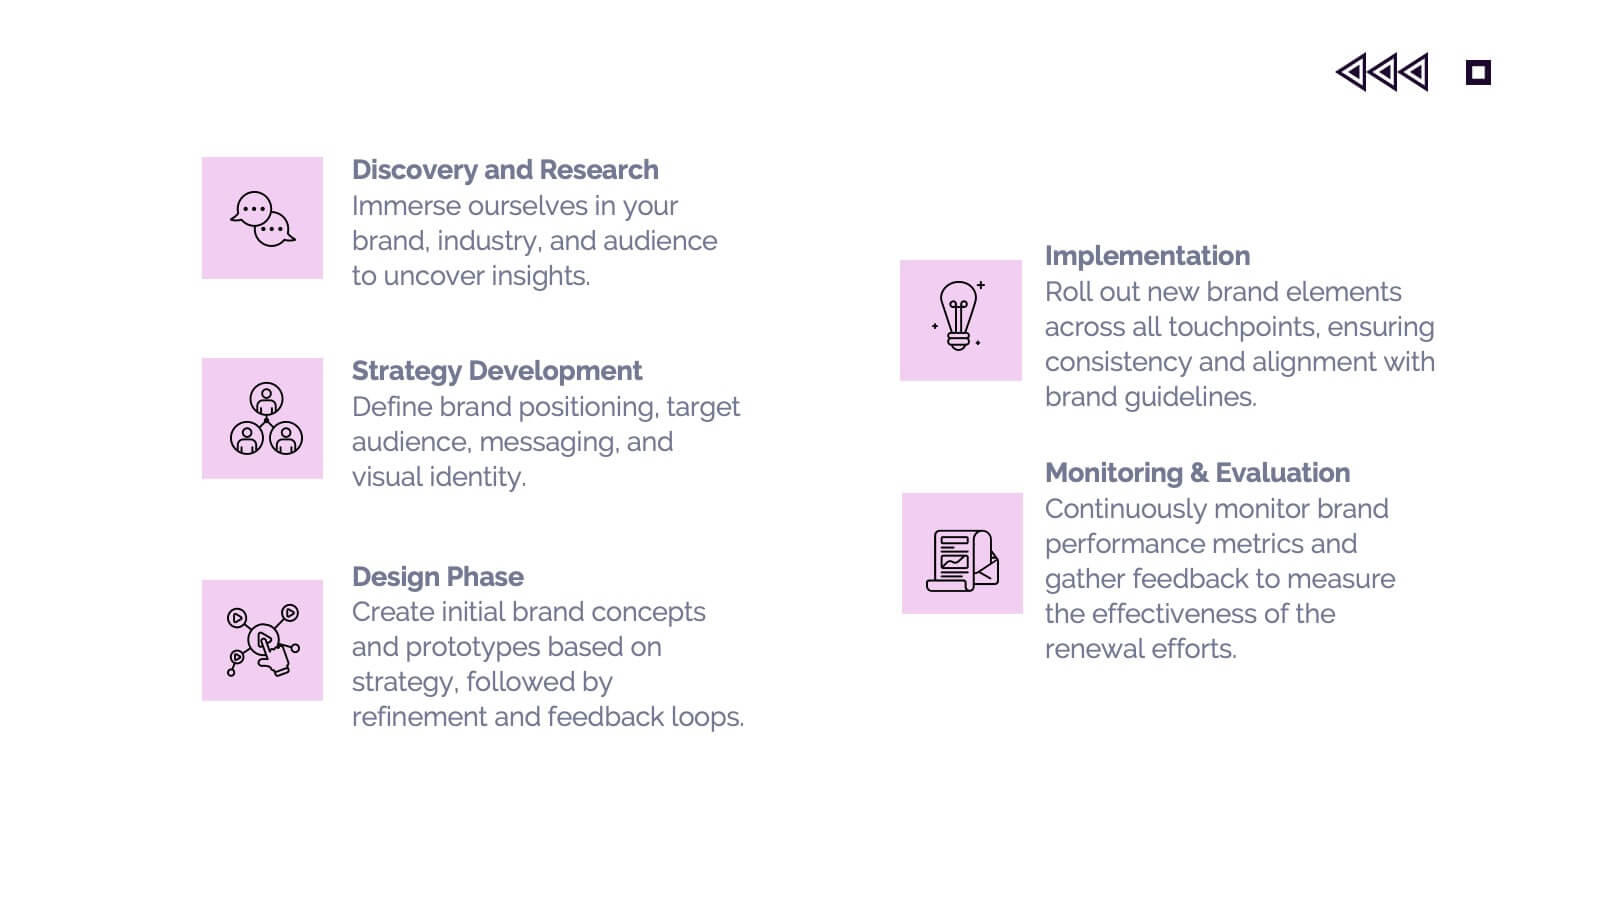
Wendigo Agency Portfolio Presentation
This sleek agency portfolio template showcases your mission, services, and success stories with modern flair. From case studies and strategy development to campaign execution and client testimonials, it’s designed to highlight your agency’s strengths. Perfect for agency presentations across PowerPoint, Keynote, and Google Slides, this template makes your content shine effortlessly.