


Características


¿Tienes alguna pregunta?
Recomendar


6 diapositivas
Hexagon Infographic Diagram Presentation
Turn your data into a story worth seeing with a clean, geometric layout that connects six key ideas in one bold visual. This presentation is perfect for showcasing processes, strategies, or relationships in a modern, engaging way. Fully compatible with PowerPoint, Keynote, and Google Slides.


5 diapositivas
SaaS Pricing Model
Present your pricing plans with confidence using this clear and structured SaaS pricing model template. Perfect for showcasing tiered options like Free, Basic, Medium, and Premium, this design makes feature comparisons easy for your audience to grasp. Fully compatible with PowerPoint, Keynote, and Google Slides for effortless editing and presentation.


6 diapositivas
Business Plan Next Steps Presentation
Map out your strategy with the Business Plan Next Steps Presentation template. This visually structured layout helps outline key actions, milestones, and priorities for business growth and execution. Ideal for entrepreneurs, executives, and project managers, this slide ensures clarity and alignment on upcoming initiatives. Fully customizable in PowerPoint, Keynote, and Google Slides for easy integration into your planning process.


21 diapositivas
Starchime UX Case Study Presentation
Showcase your UX design process with this case study template, covering research, user journey mapping, wireframes, and usability testing. Ideal for presenting design insights and outcomes. Compatible with PowerPoint, Keynote, and Google Slides, it’s perfect for a clear, professional, and impactful UX design presentation.


5 diapositivas
Insurance Risk Management Presentation
Make complex risk strategies easy to understand with this clean and professional presentation design. Perfect for explaining insurance coverage, threat assessment, or business protection plans, it blends clear visuals with modern design elements. Fully editable and compatible with PowerPoint, Keynote, and Google Slides for effortless customization and presentation.


4 diapositivas
Effective Leadership Tips Presentation
Lead with clarity and confidence using this clean, modern presentation design. Perfect for sharing management insights, motivational principles, and communication strategies, it helps visualize ideas that inspire stronger teams and better decision-making. Fully editable and compatible with PowerPoint, Keynote, and Google Slides for effortless professional customization.


5 diapositivas
Asia Geographic and Business Analysis Map Presentation
Gain a strategic edge with the Asia Geographic and Business Analysis Map template, designed to visualize market trends and demographic data across the region. Ideal for businesses, investors, and academics, it supports PowerPoint, Keynote and Google Slides. This adaptable template is perfect for presenting geographic data analyses and exploring regional business potentials.


5 diapositivas
Educational Planning & Class Activities Presentation
Organize your lessons with this creative education-themed layout. Featuring a playful stack of books and apple illustration, this slide is ideal for outlining academic plans, class objectives, or weekly activities. Fully editable in PowerPoint, Keynote, and Google Slides—perfect for teachers, homeschoolers, and education professionals seeking clarity and visual appeal.


24 diapositivas
Djinn Brand Identity Presentation
Unleash the power of your brand with this sleek and modern presentation template! From brand identity components to target audience personas, this template covers everything you need to craft a cohesive and compelling brand strategy. Whether showcasing brand guidelines or success stories, it’s designed for maximum clarity and impact. Compatible with PowerPoint, Keynote, and Google Slides for effortless presentations.


4 diapositivas
Sales and Reach Across Asia Map Presentation
Visualize your company’s market presence with the Sales and Reach Across Asia Map Presentation. Featuring clean markers, color-coded regions, and icon-labeled highlights, this template helps you clearly showcase key sales zones, distribution channels, or growth markets across Asia. Perfect for business reviews, expansion pitches, and performance updates. Fully editable in PowerPoint, Keynote, Google Slides, and Canva.


5 diapositivas
Business Planning and Execution Presentation
Align your business objectives and execution plan with this modern, arrow-themed presentation slide. Featuring four sequential sections with bold icons and customizable titles, this layout is perfect for showcasing milestones, KPIs, or phases of a strategic process. Designed for clarity and impact, it's compatible with PowerPoint, Keynote, and Google Slides.
4 diapositivas
Arrow Path Business Journey Presentation
Visualize growth, decisions, and direction with the Arrow Path Business Journey Presentation. This dynamic slide is designed to illustrate key stages, multiple outcomes, or strategic forks in the road. Great for showing parallel team tracks, phased development, or transformation journeys. Fully editable and works seamlessly in PowerPoint, Google Slides, and Canva.


4 diapositivas
KPI and Business Performance Dashboard
Drive strategic insights with this sleek KPI and business dashboard template. Highlight key metrics, trends, and performance results using easy-to-read graphs and organized data sections. Perfect for management reports, executive summaries, and project tracking. Fully editable in PowerPoint, Keynote, and Google Slides.
6 diapositivas
Task Tracking and Milestone Gantt Overview Presentation
Stay on top of weekly progress with this Task Tracking and Milestone Gantt Overview presentation. Ideal for project managers and teams, it clearly maps tasks by week with visual progress bars and milestone icons. Easily customizable in Canva, PowerPoint, and Google Slides to align with your project timelines and goals.


4 diapositivas
Buyer Persona and Market Segmentation Presentation
Visualize ideal customer types with this engaging buyer persona template. Showcase personality traits, goals, brand affinities, and bios in a stylish format with tropical-inspired accents. Ideal for market segmentation, branding, and campaign alignment. Fully editable in PowerPoint, Keynote, and Google Slides to match your marketing strategy and presentation tone.


20 diapositivas
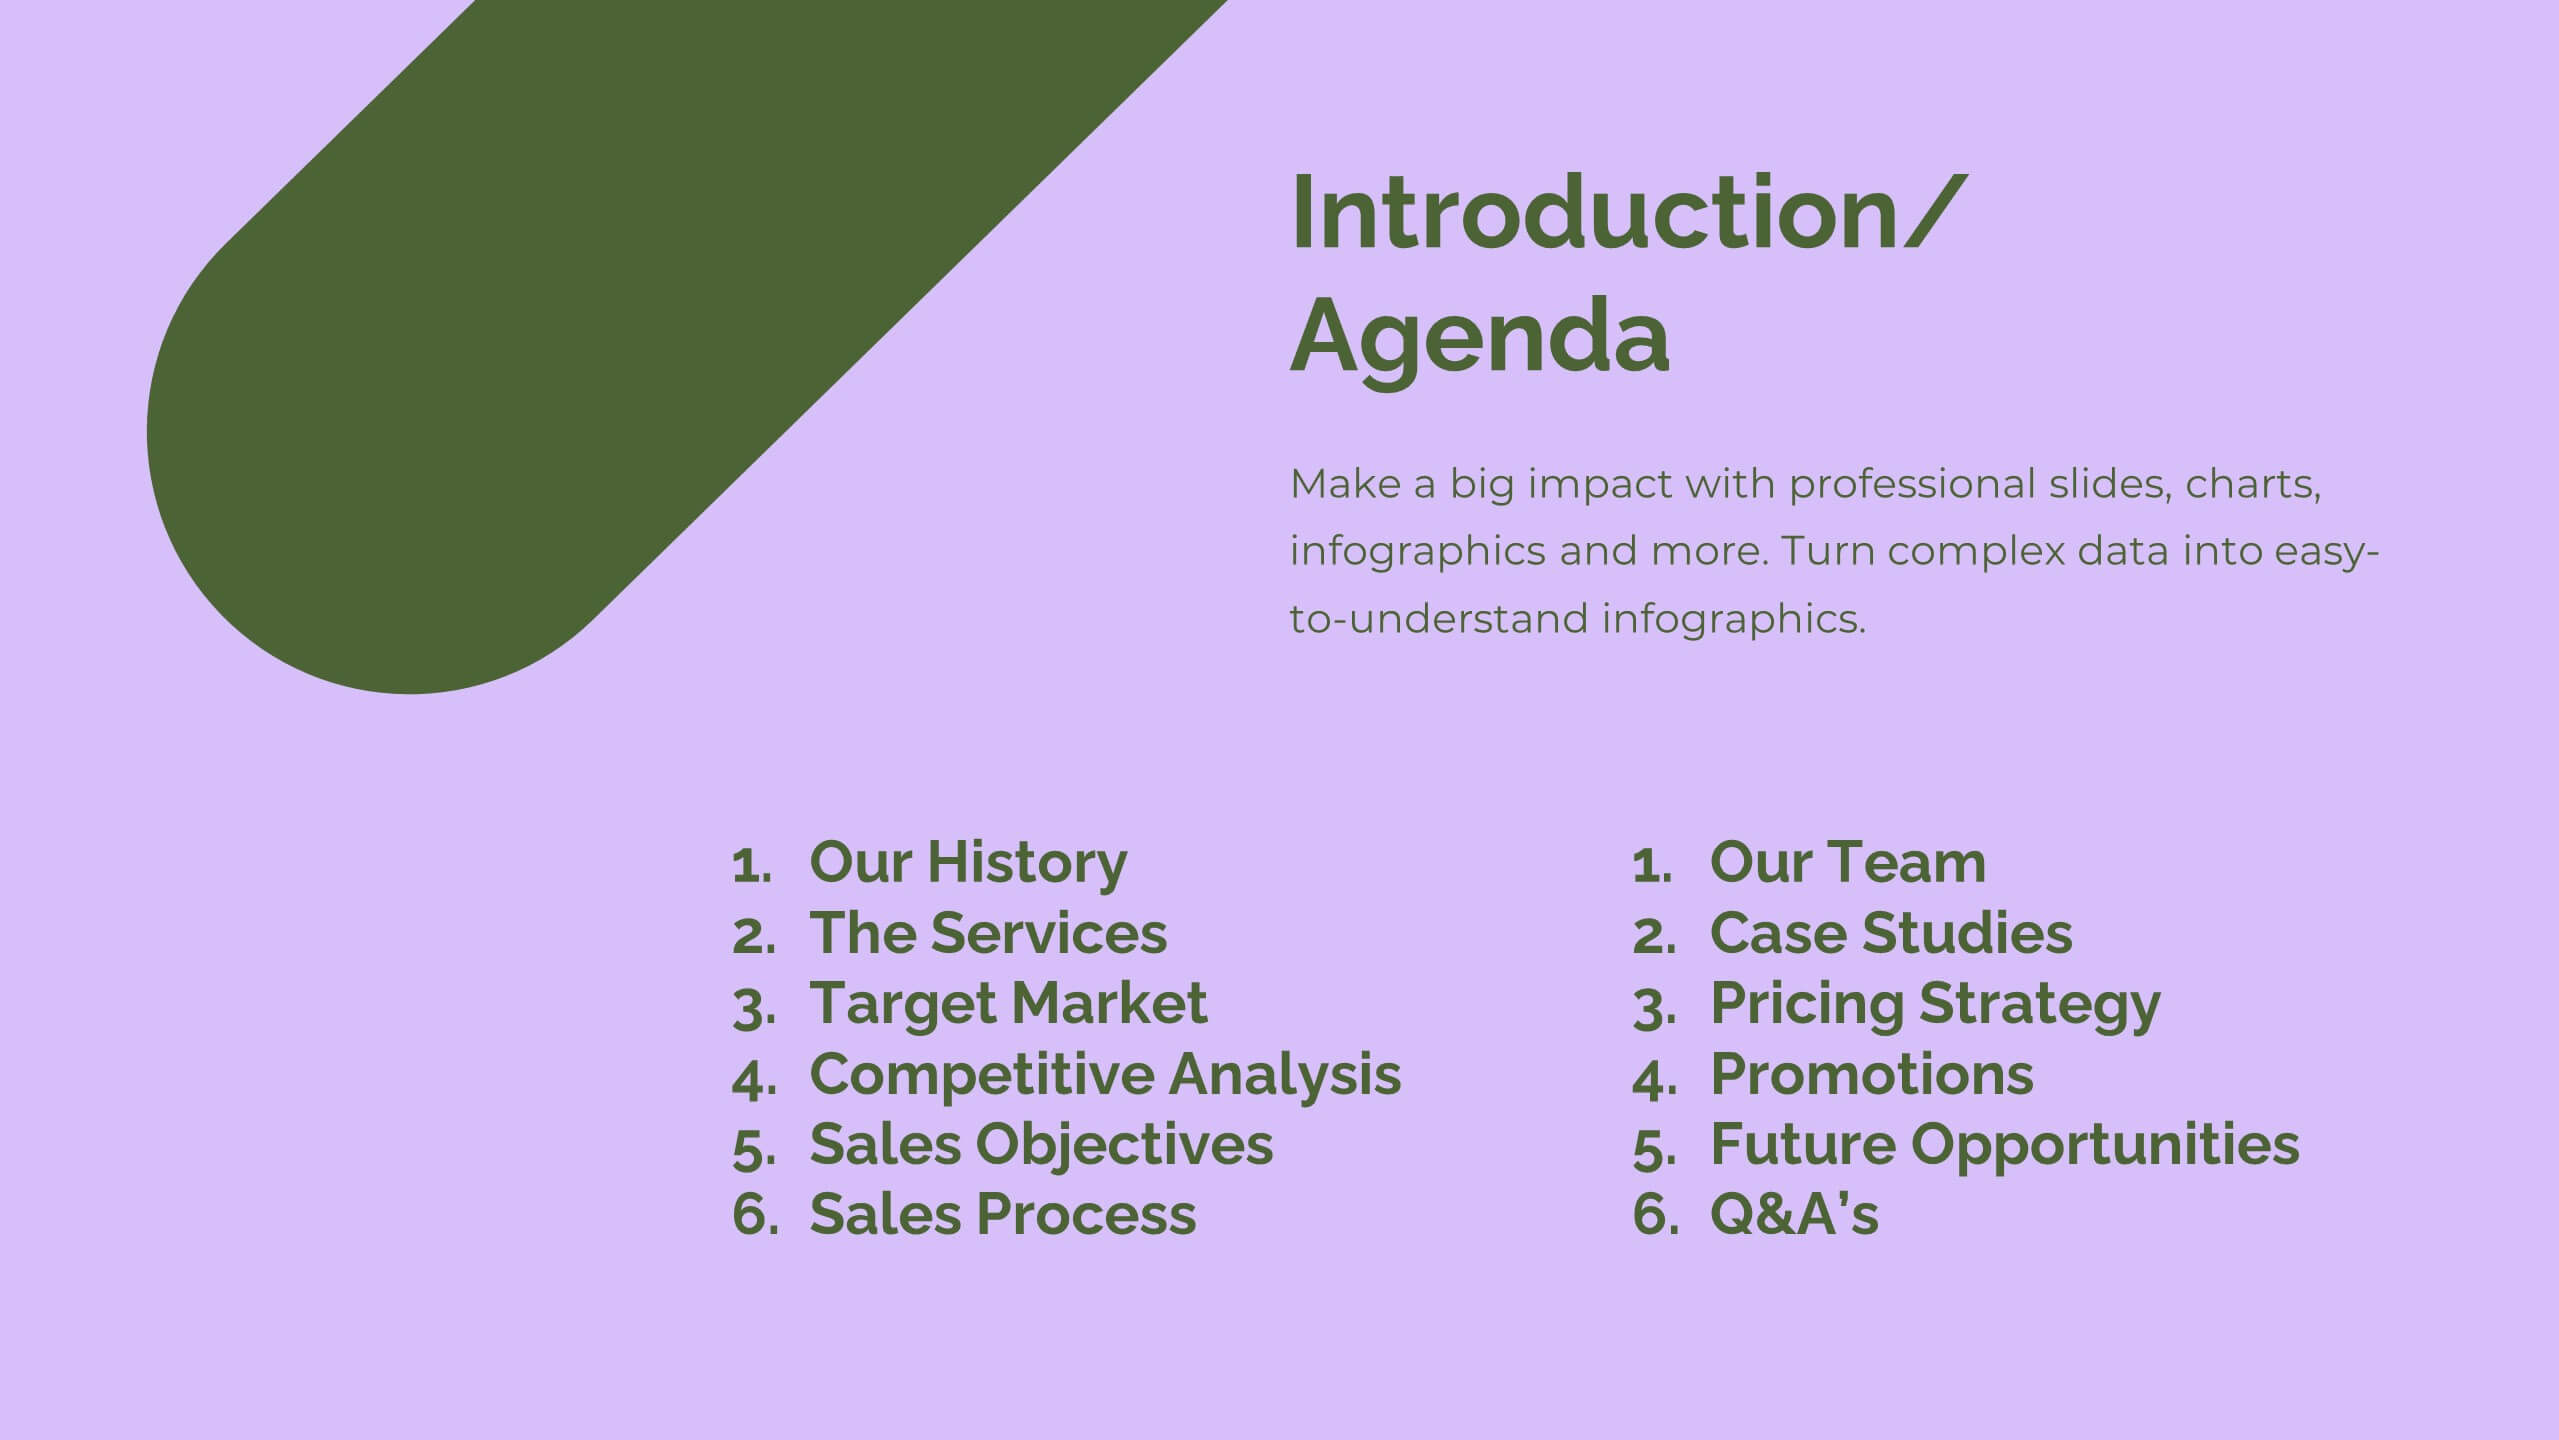
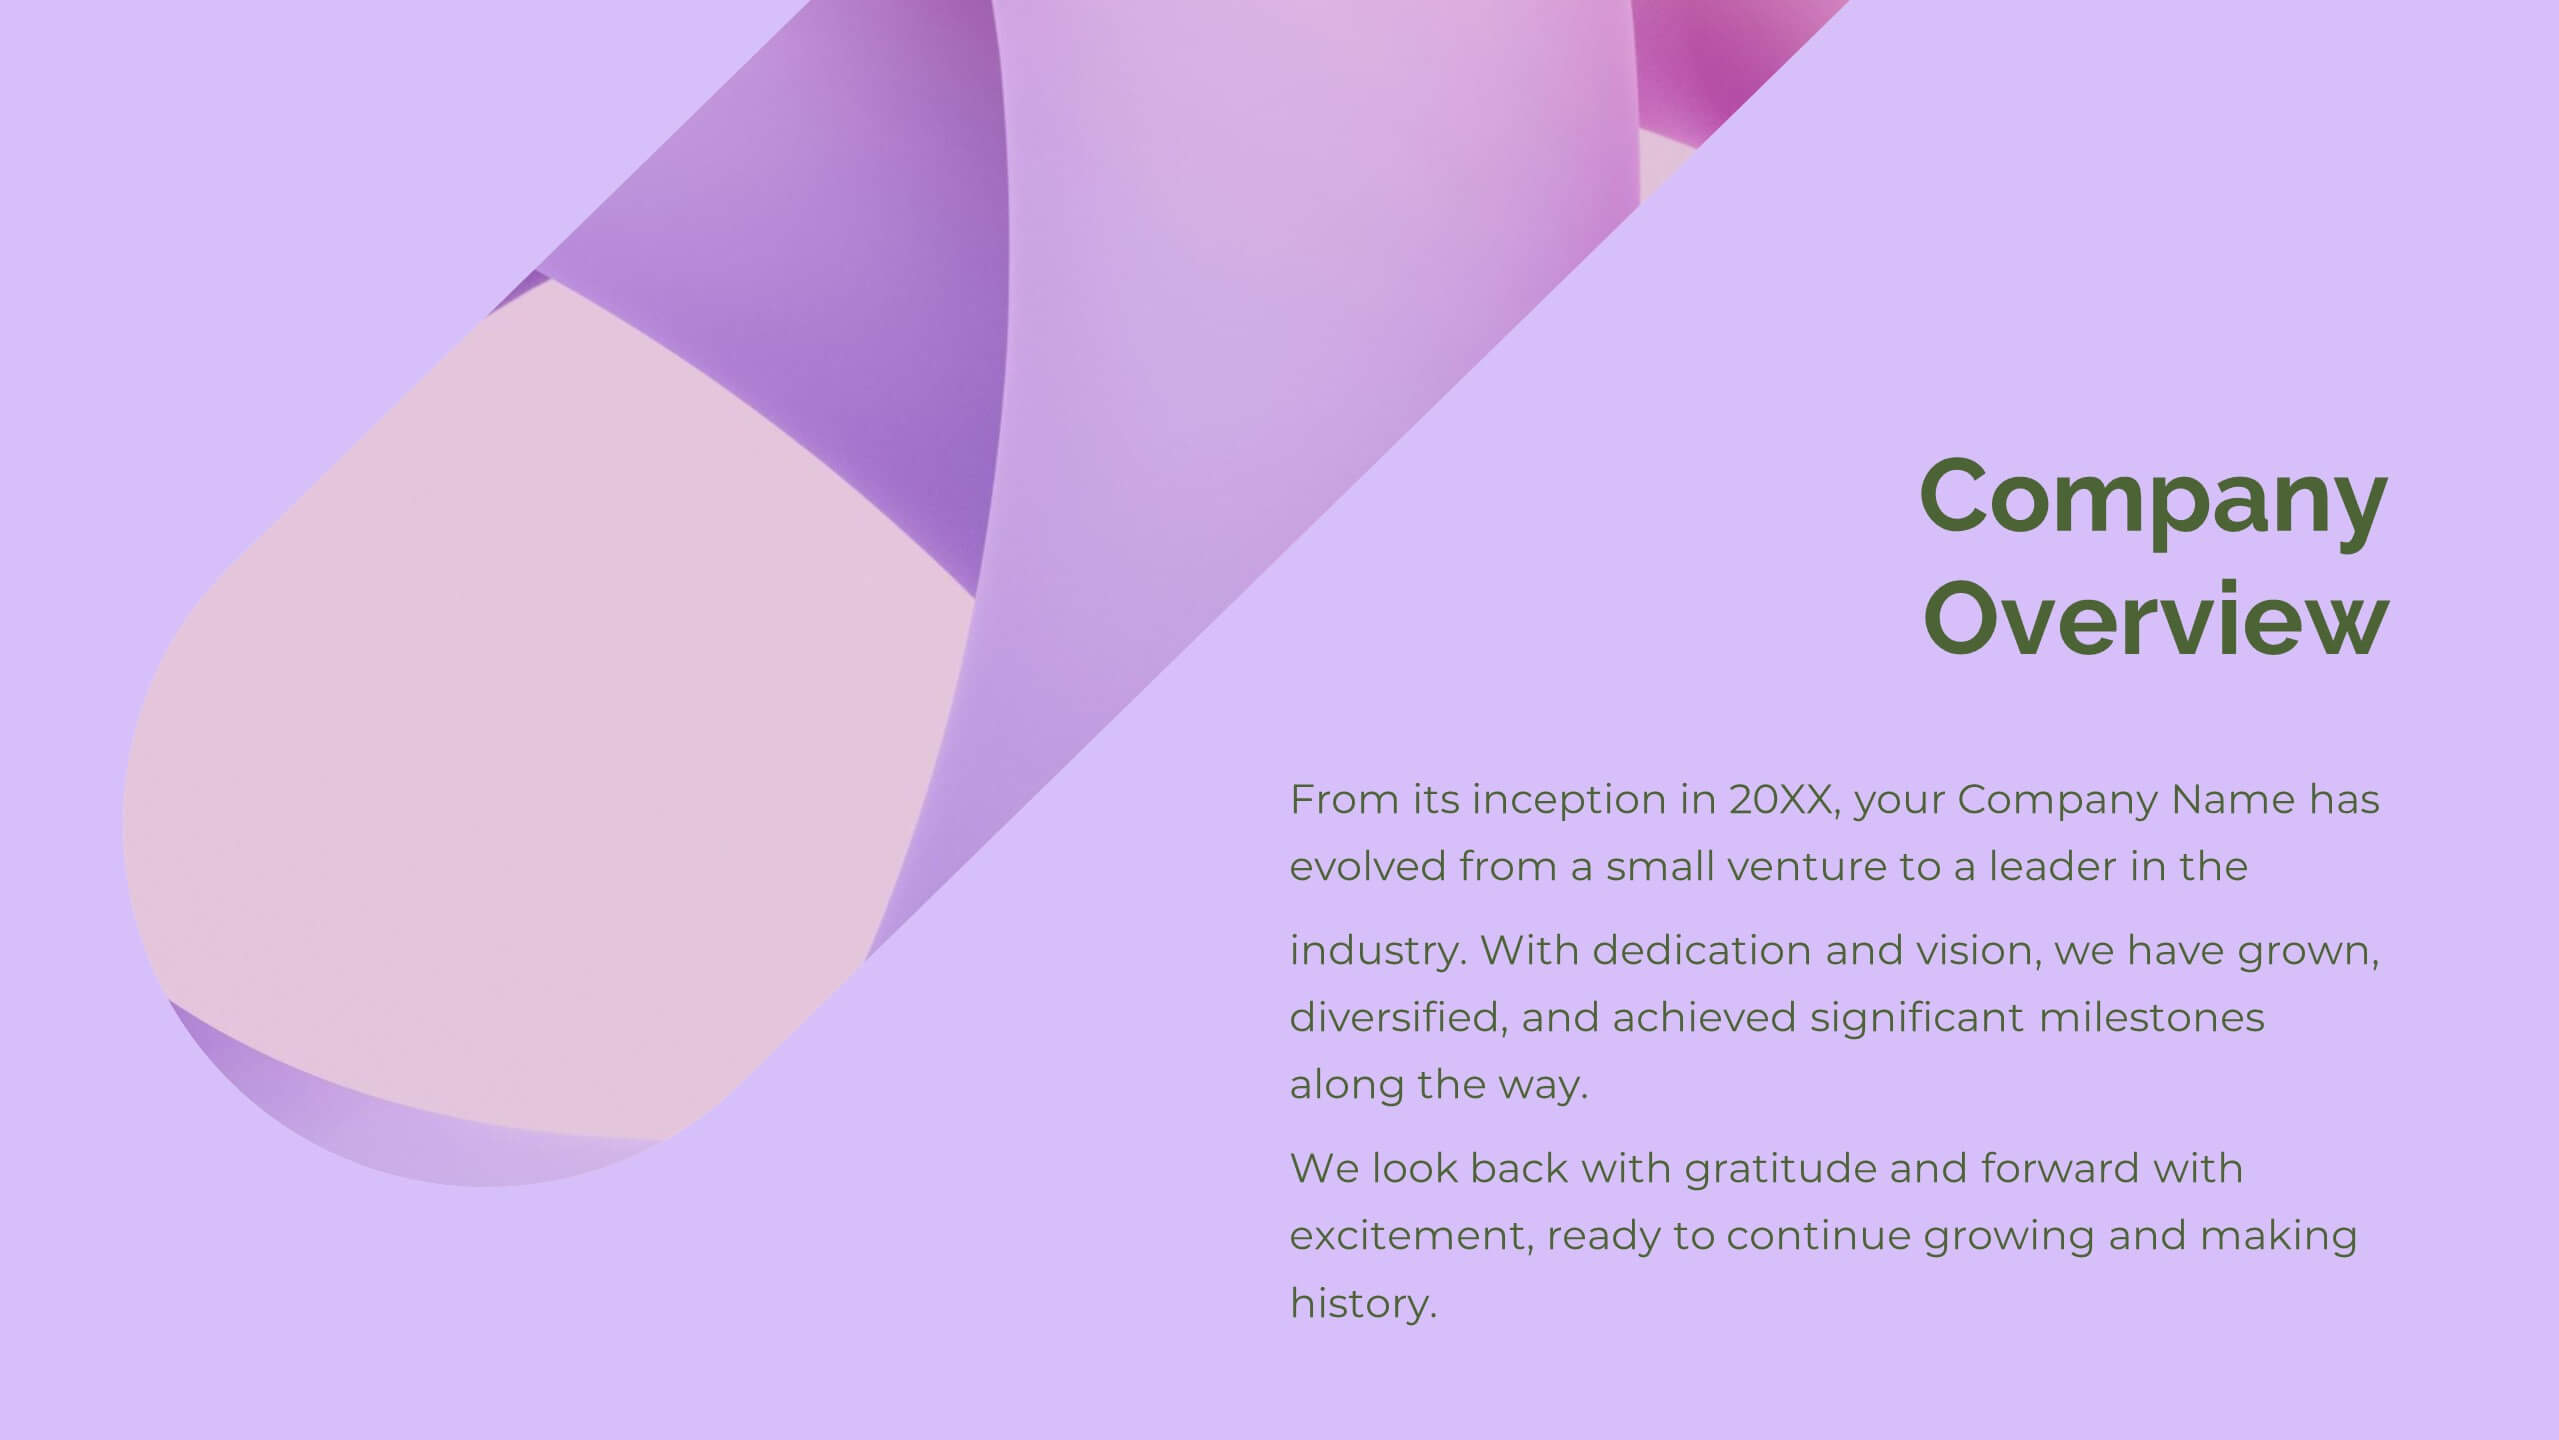
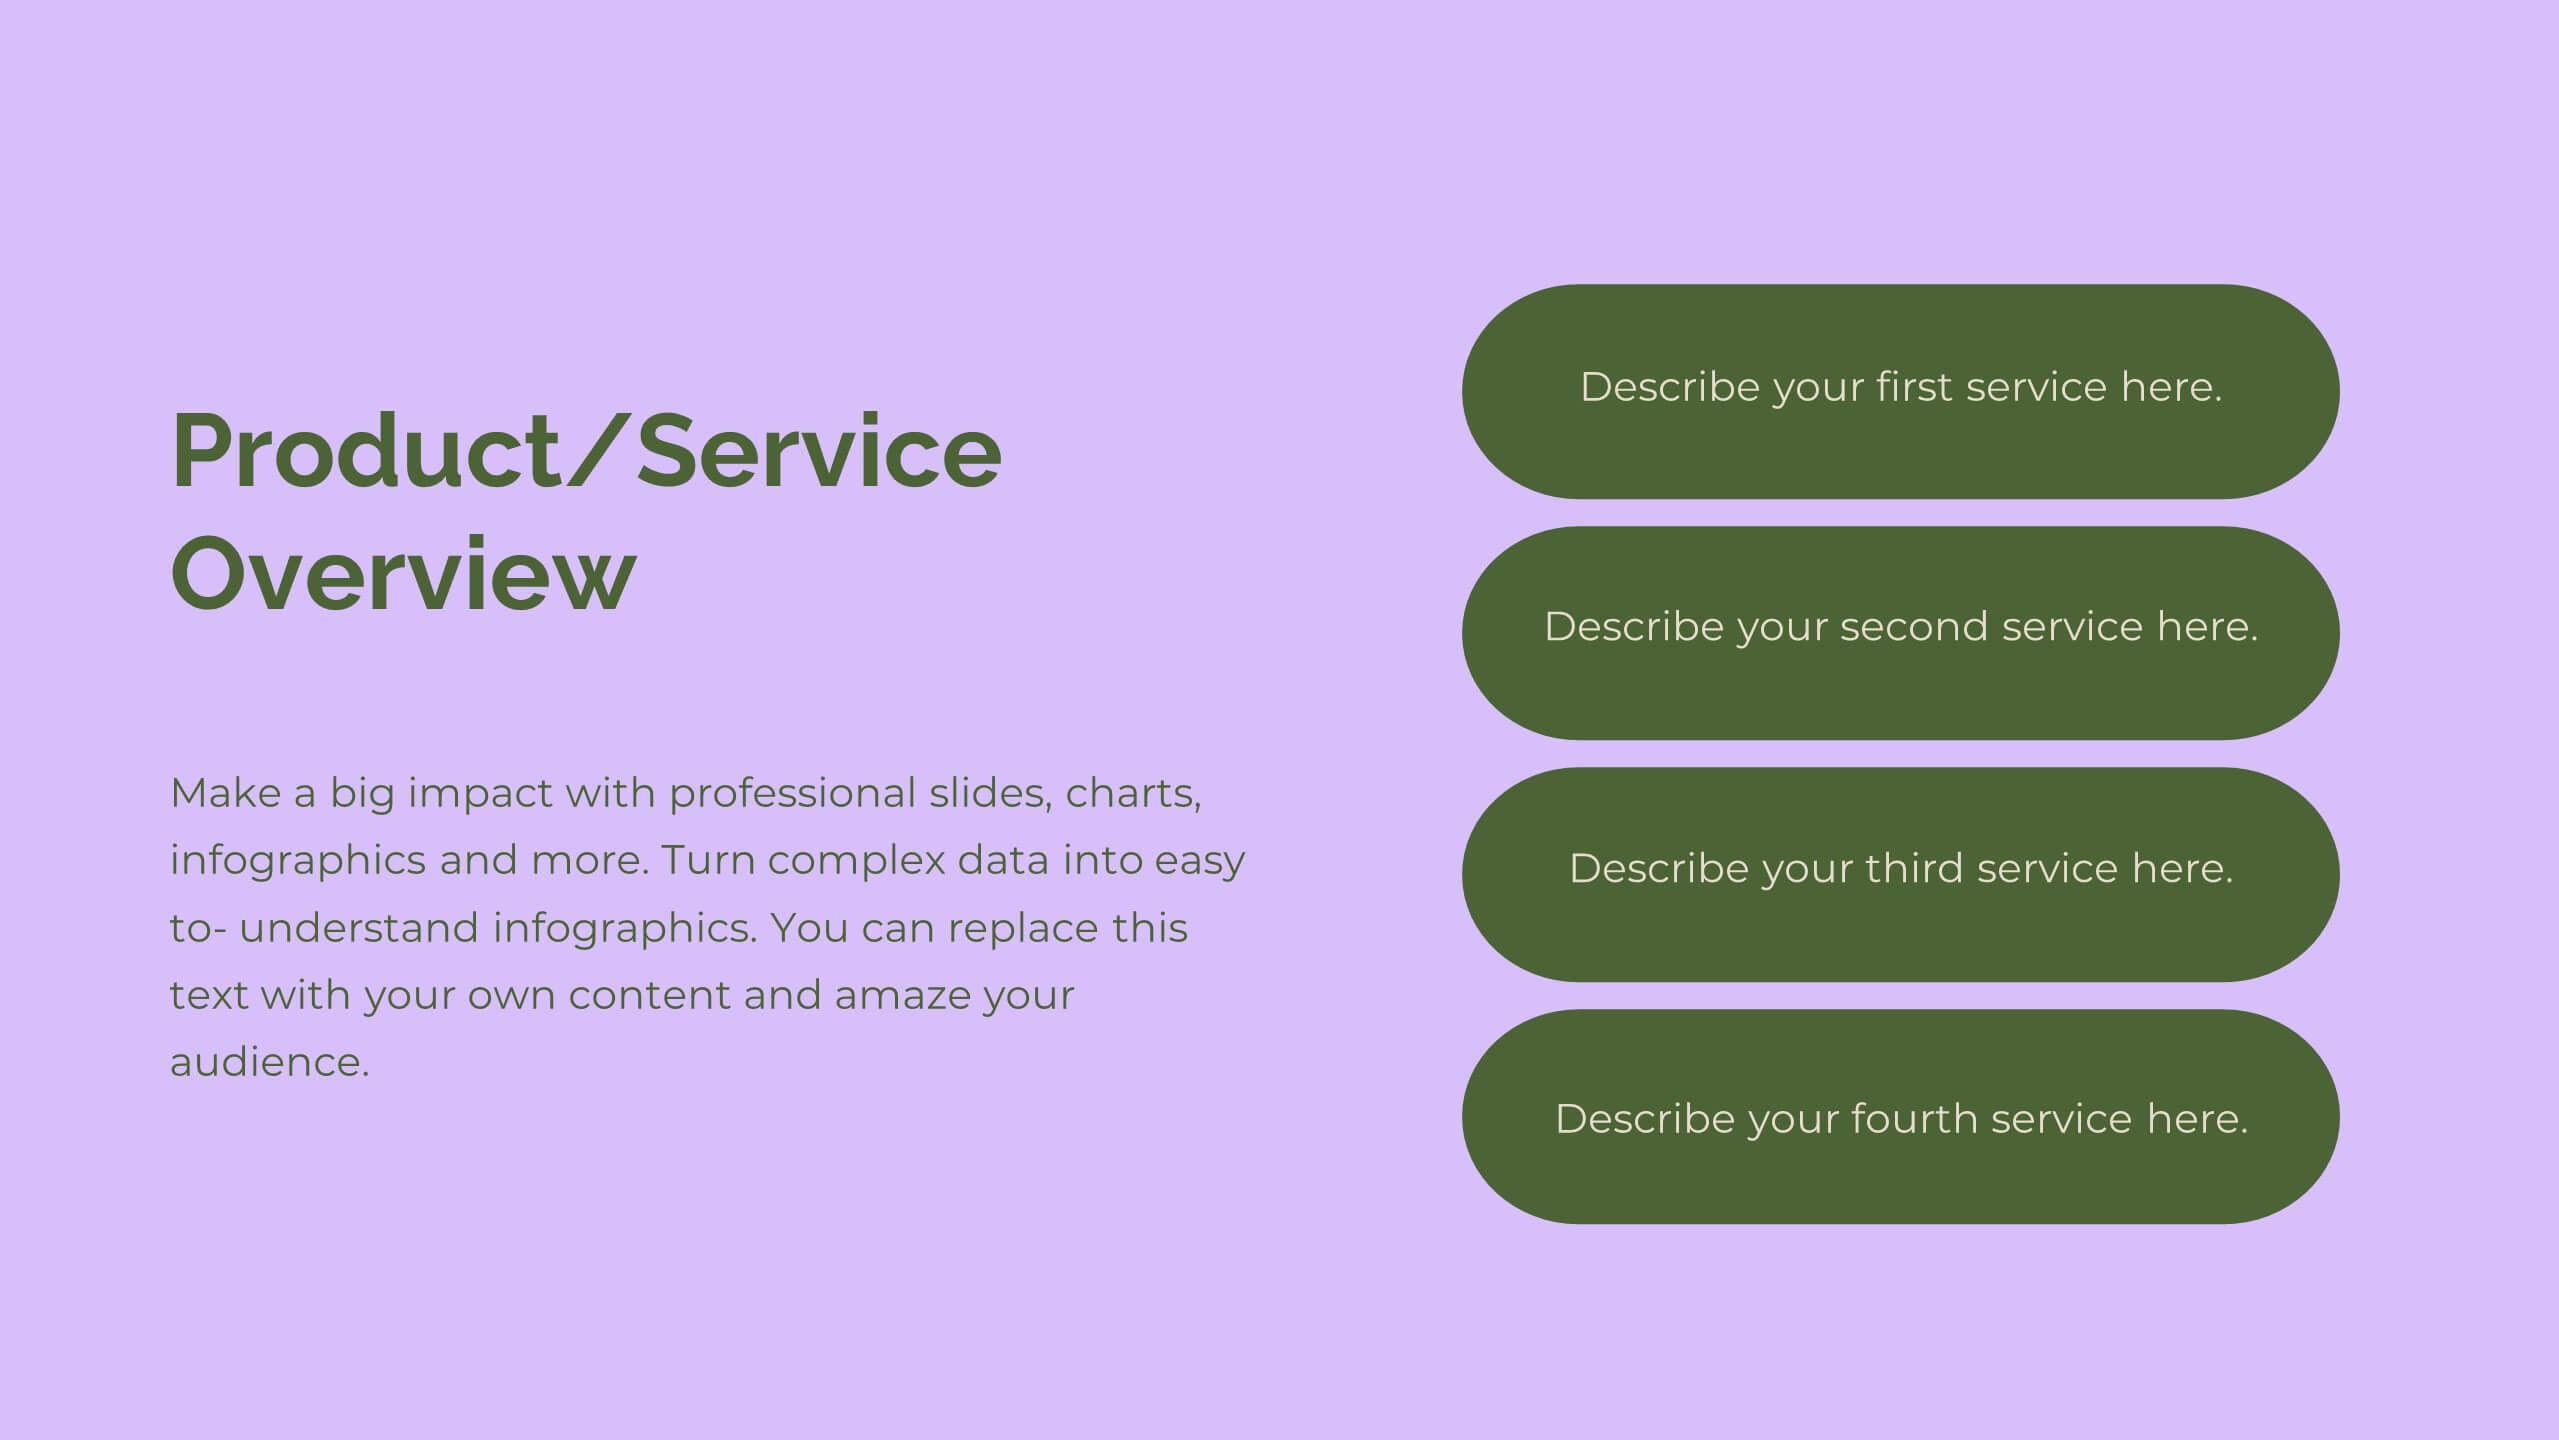
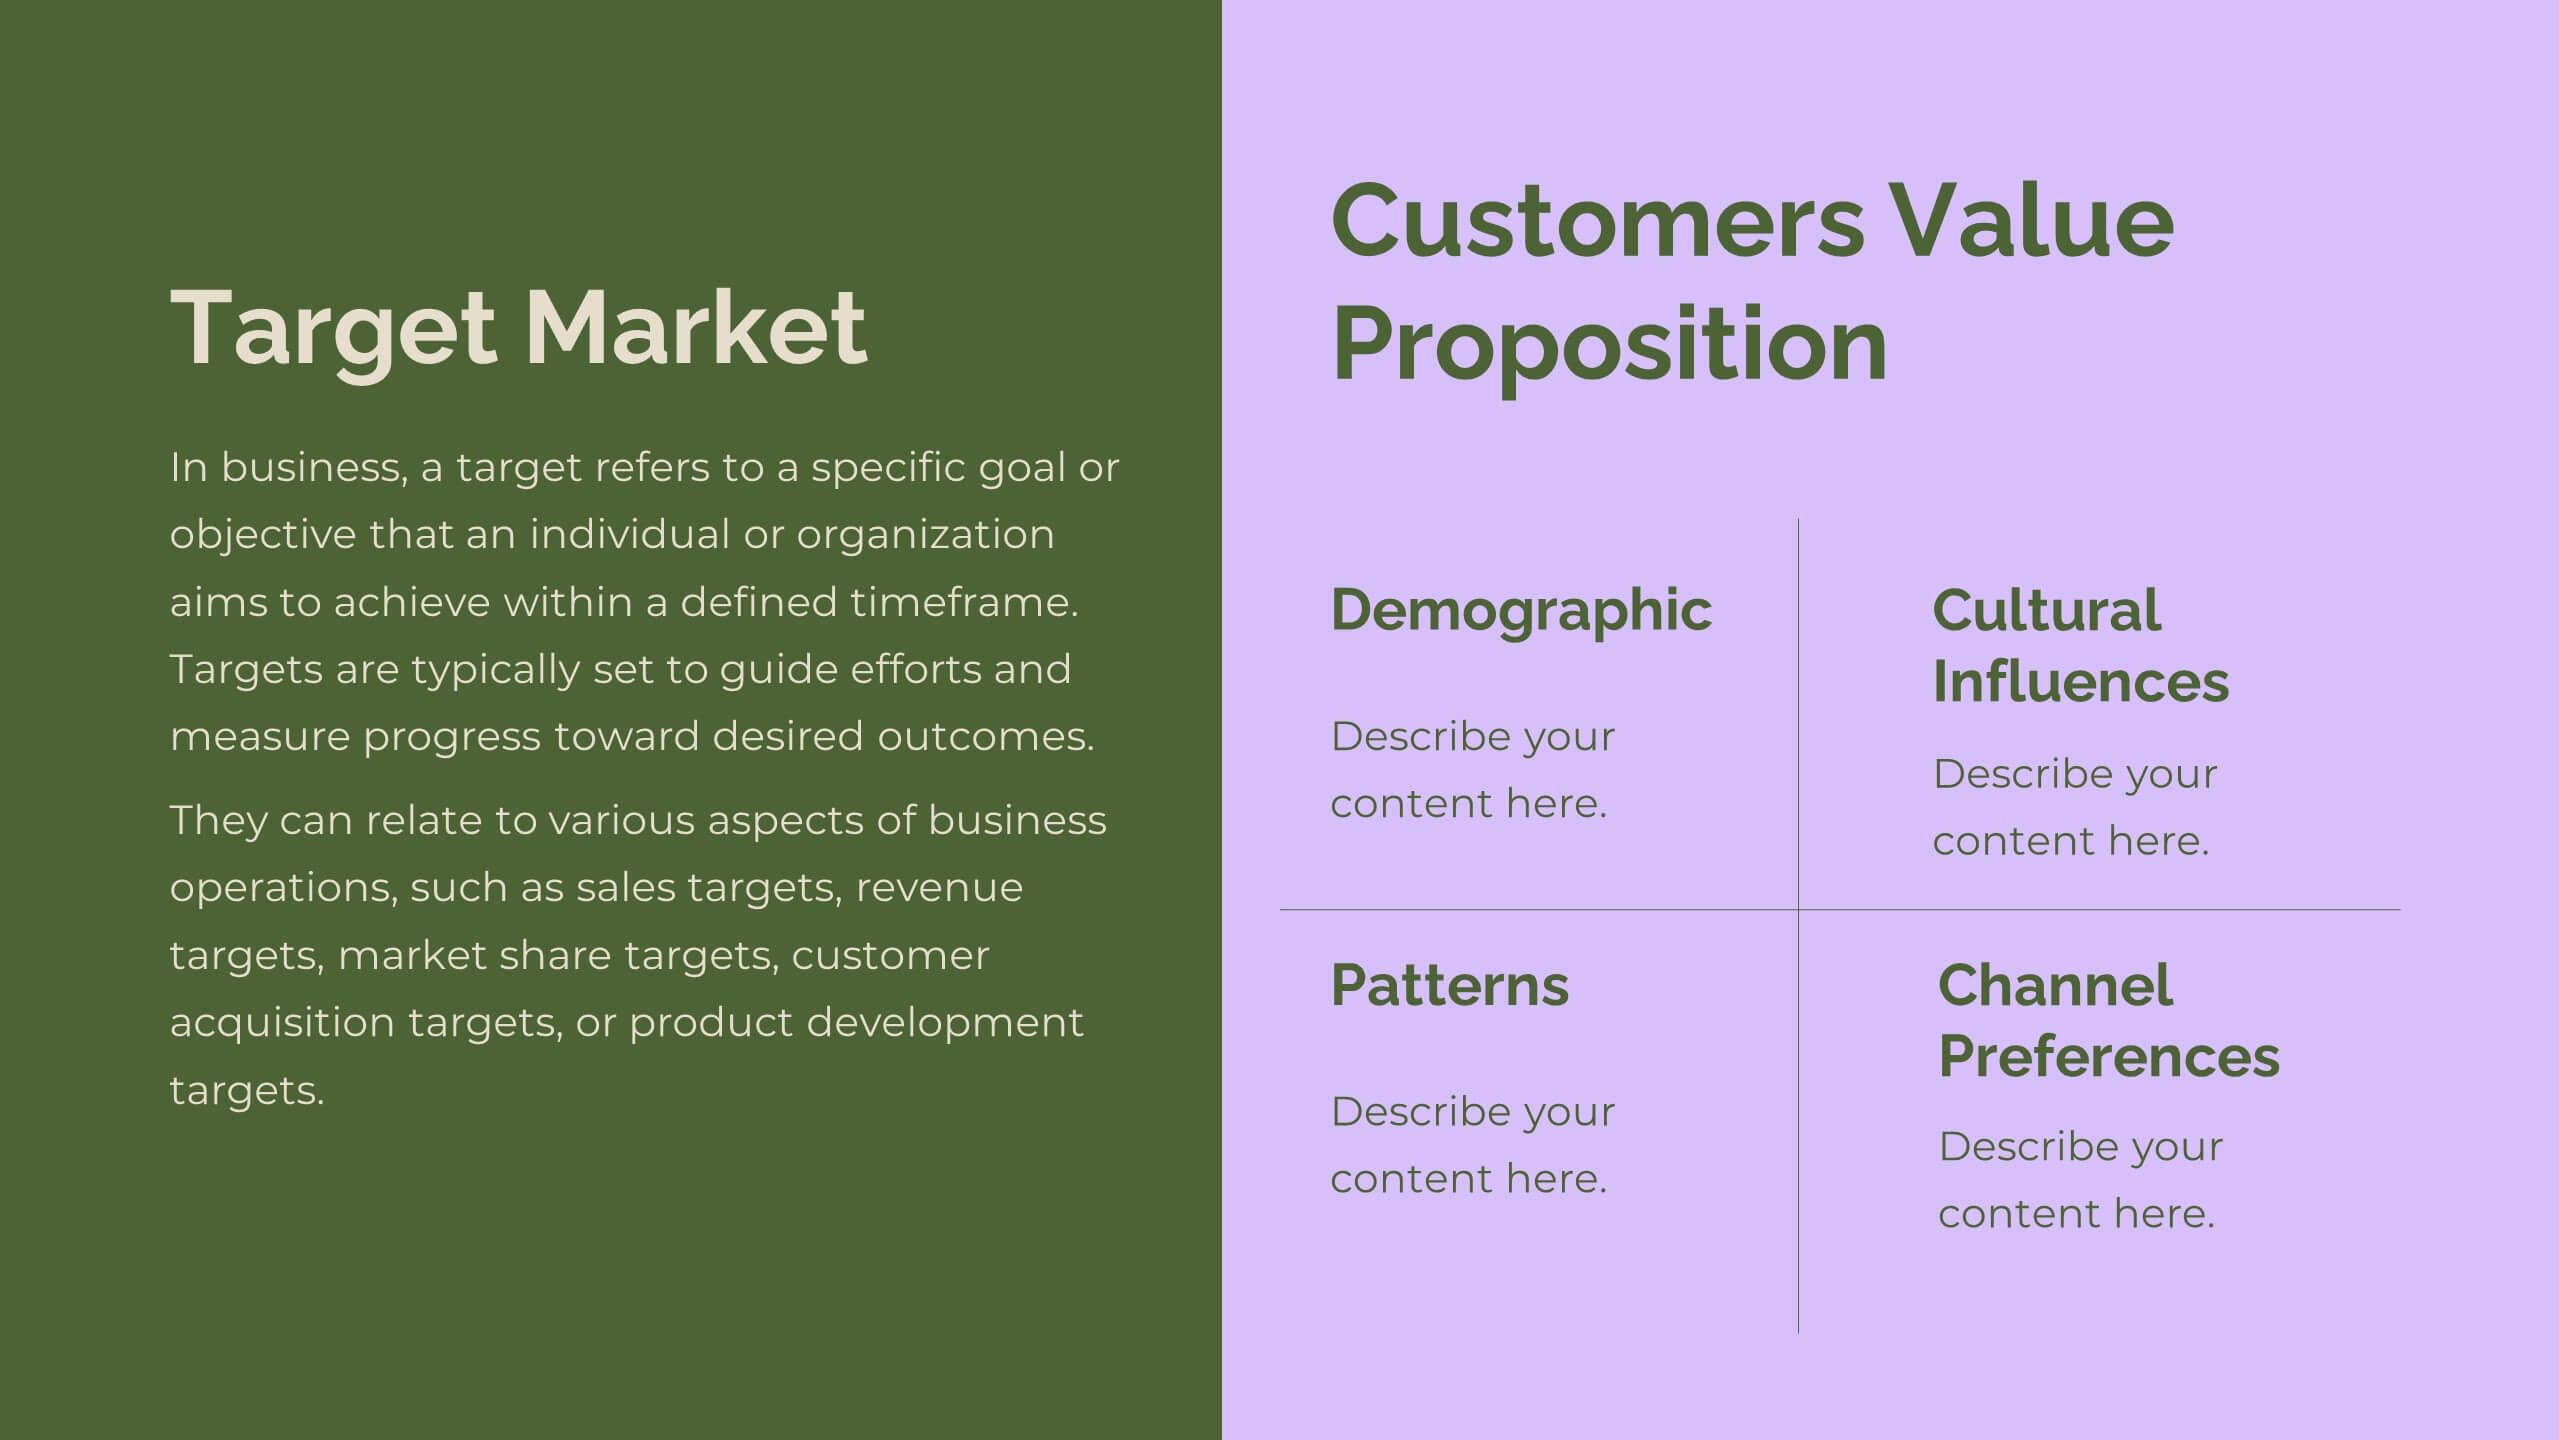
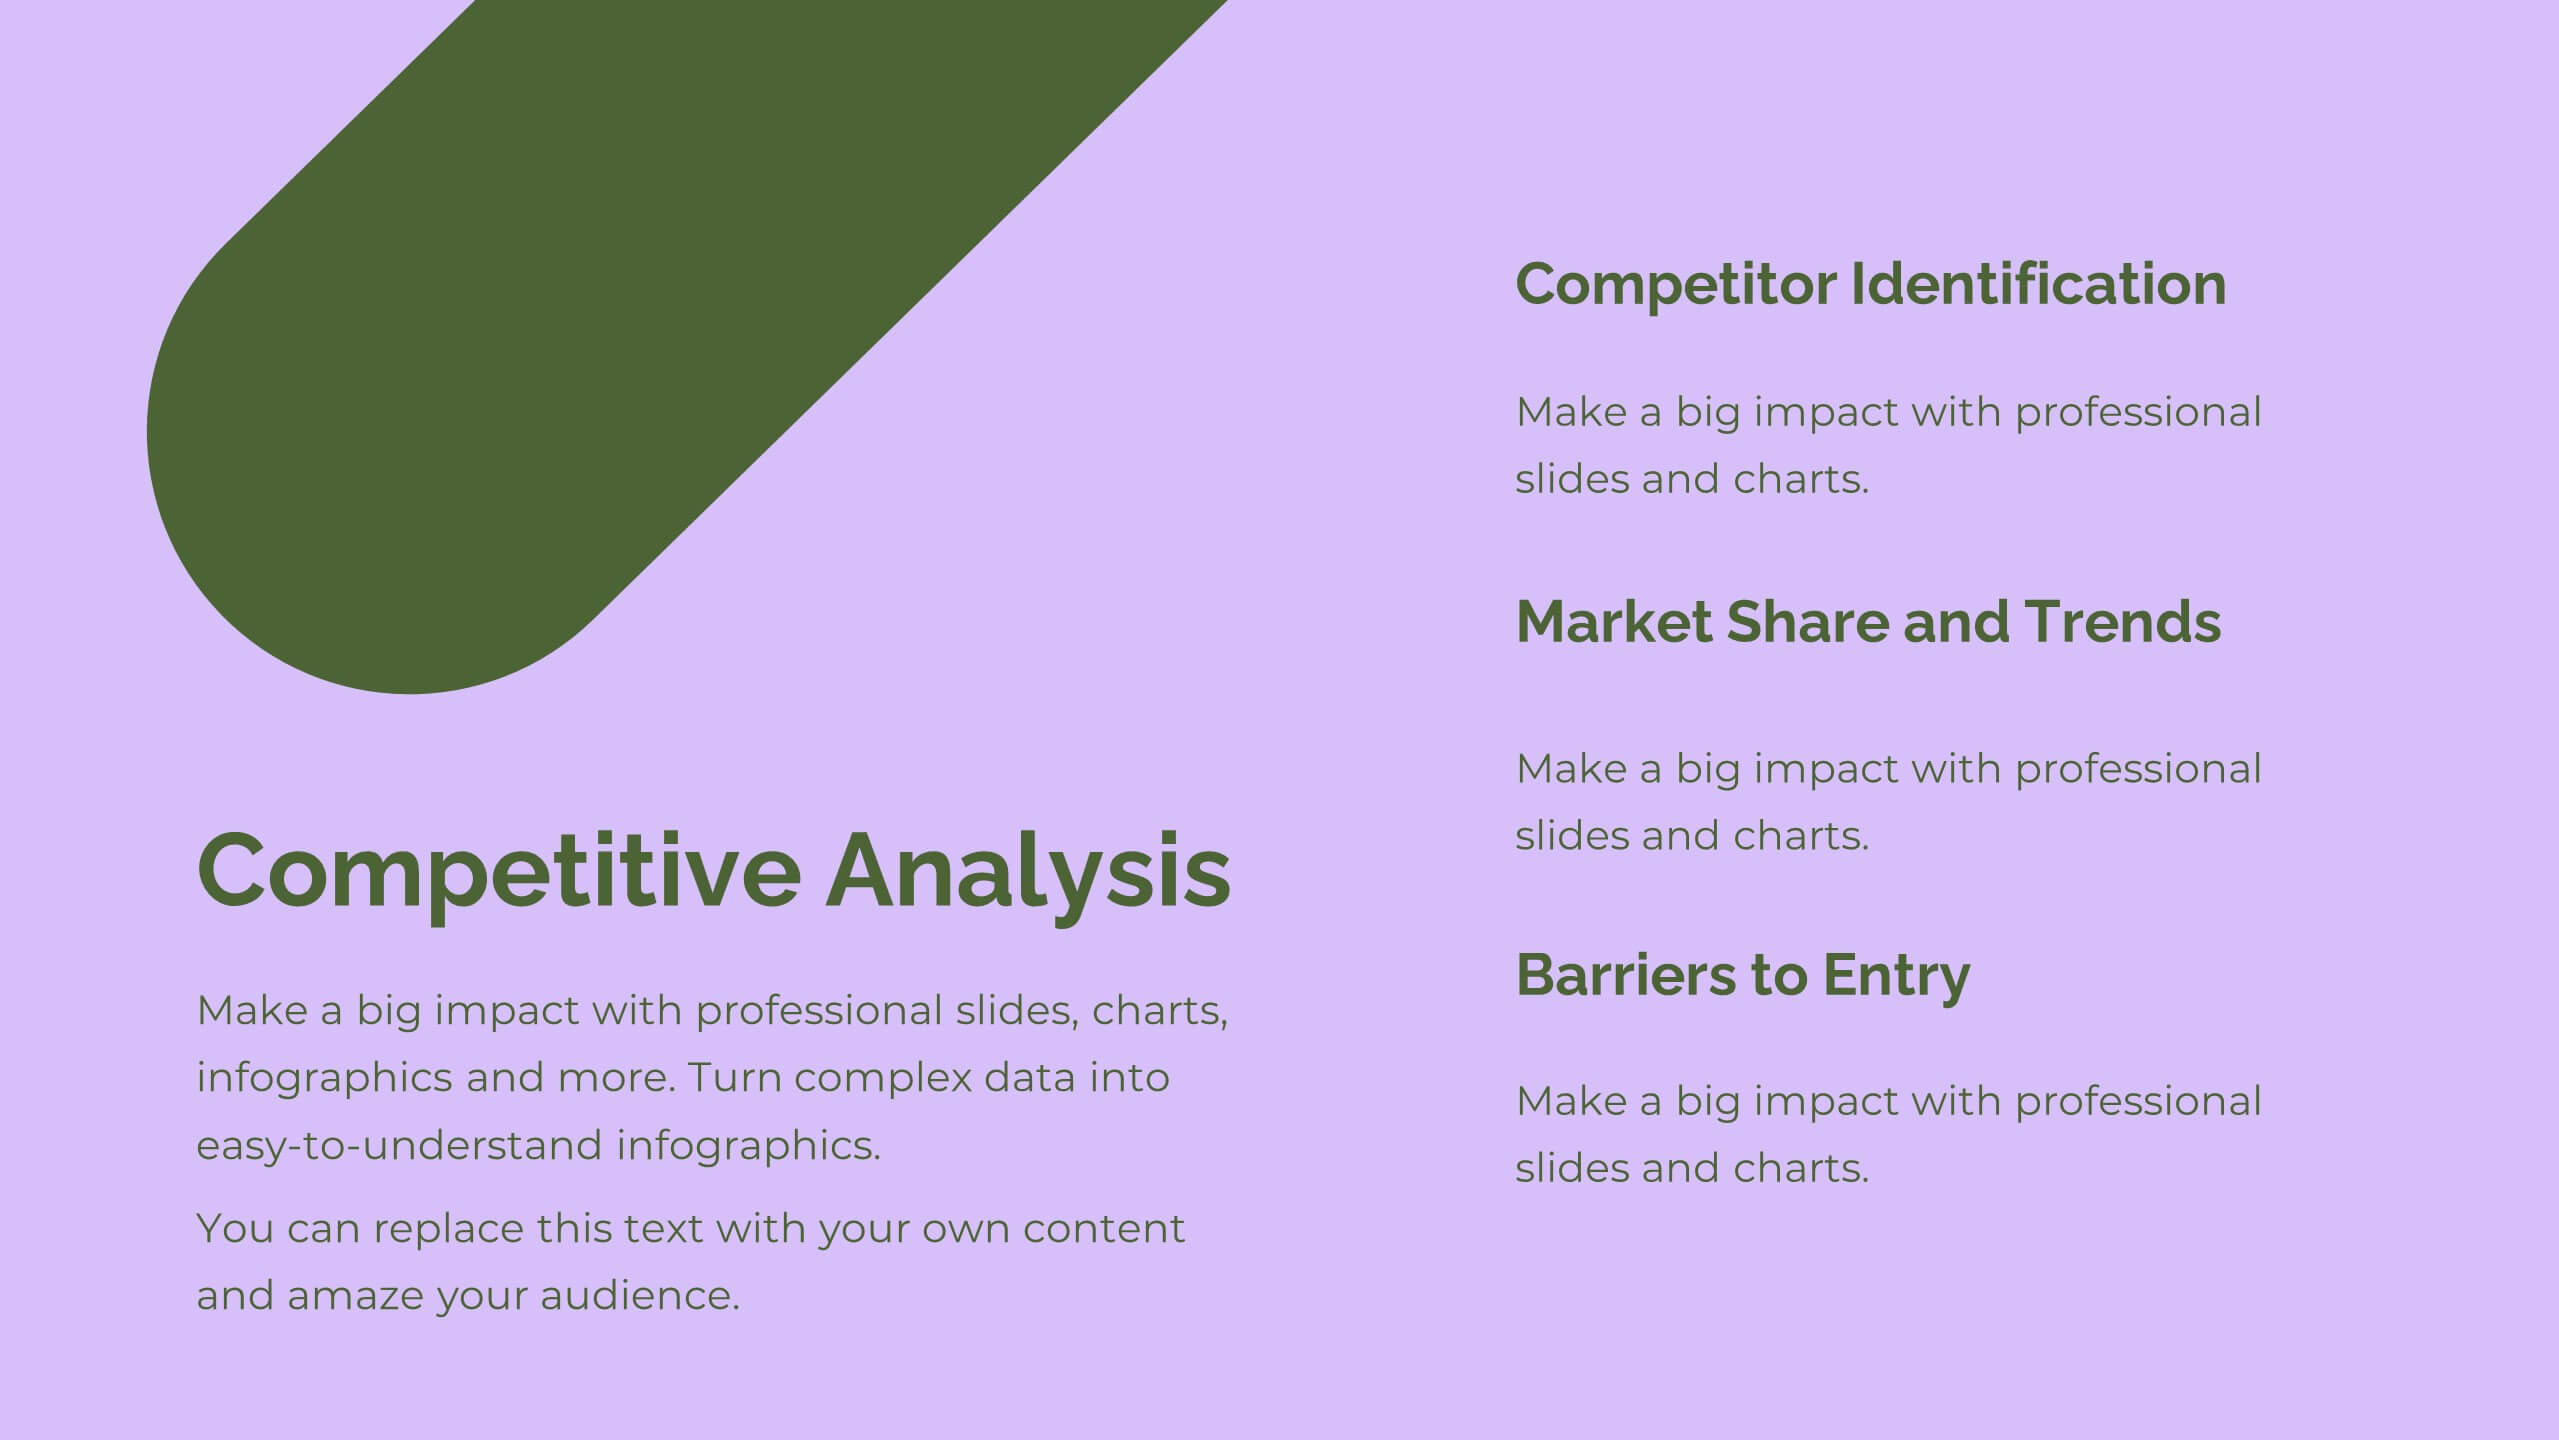
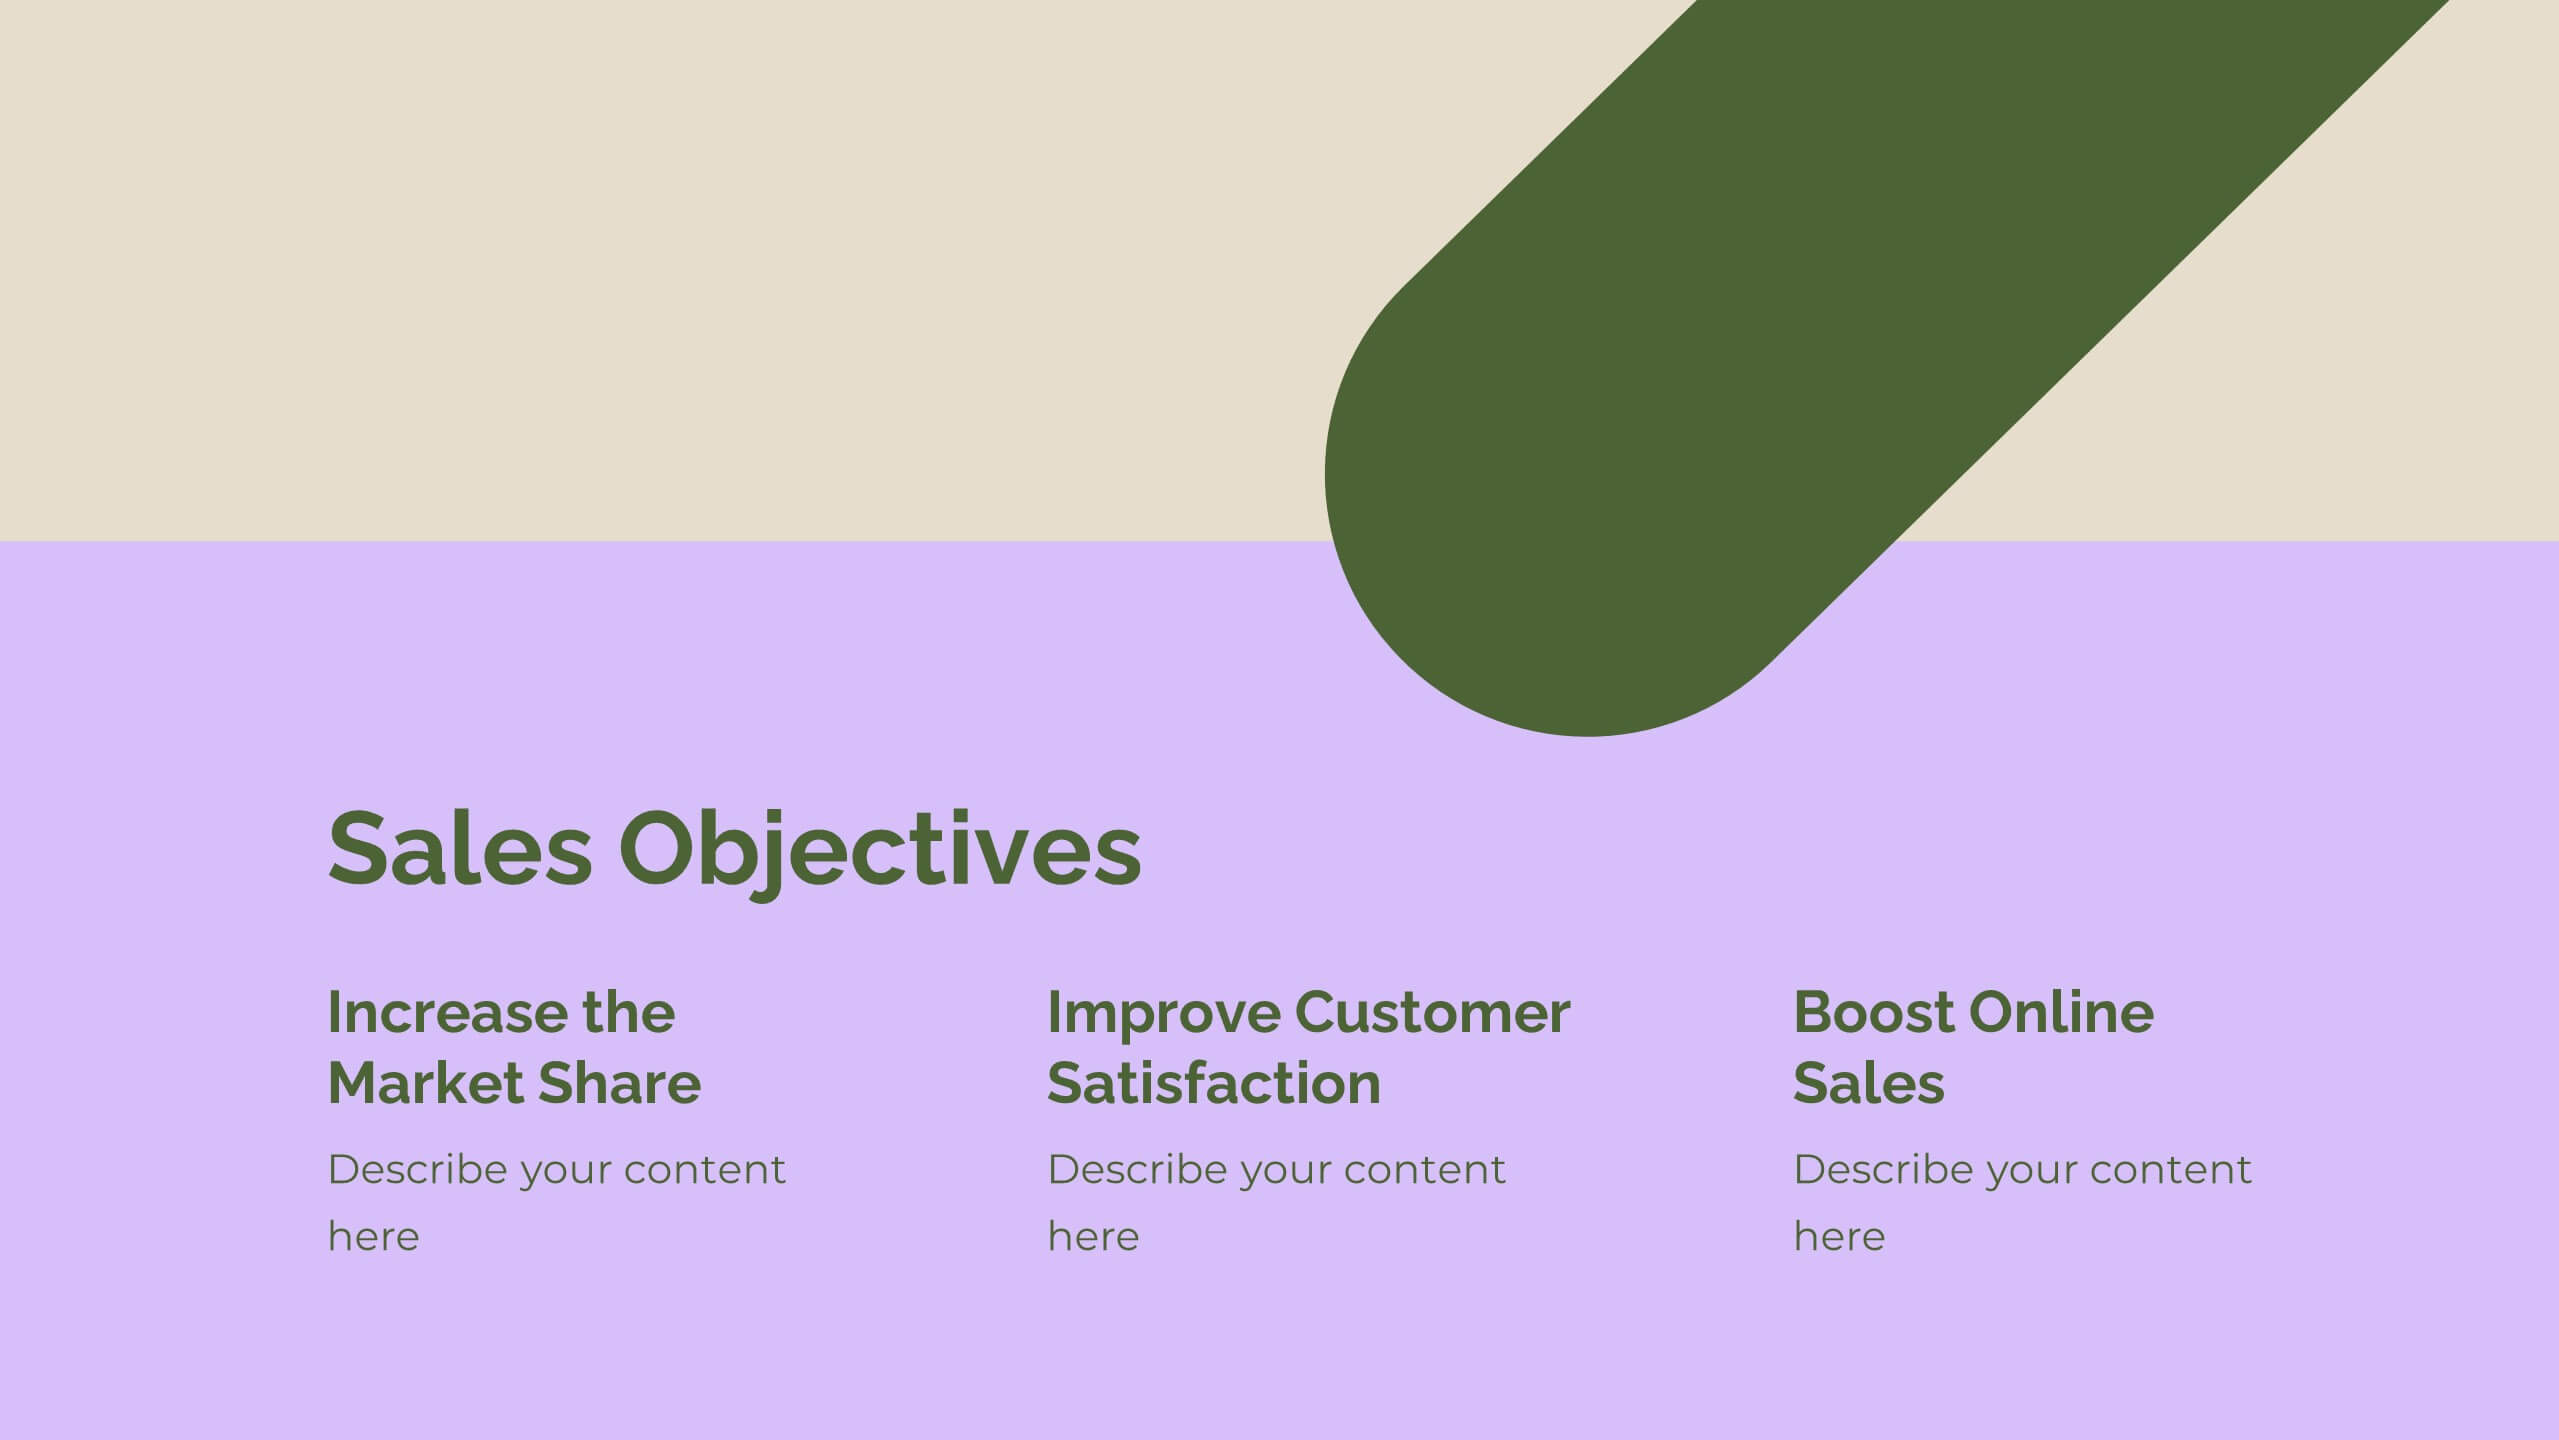
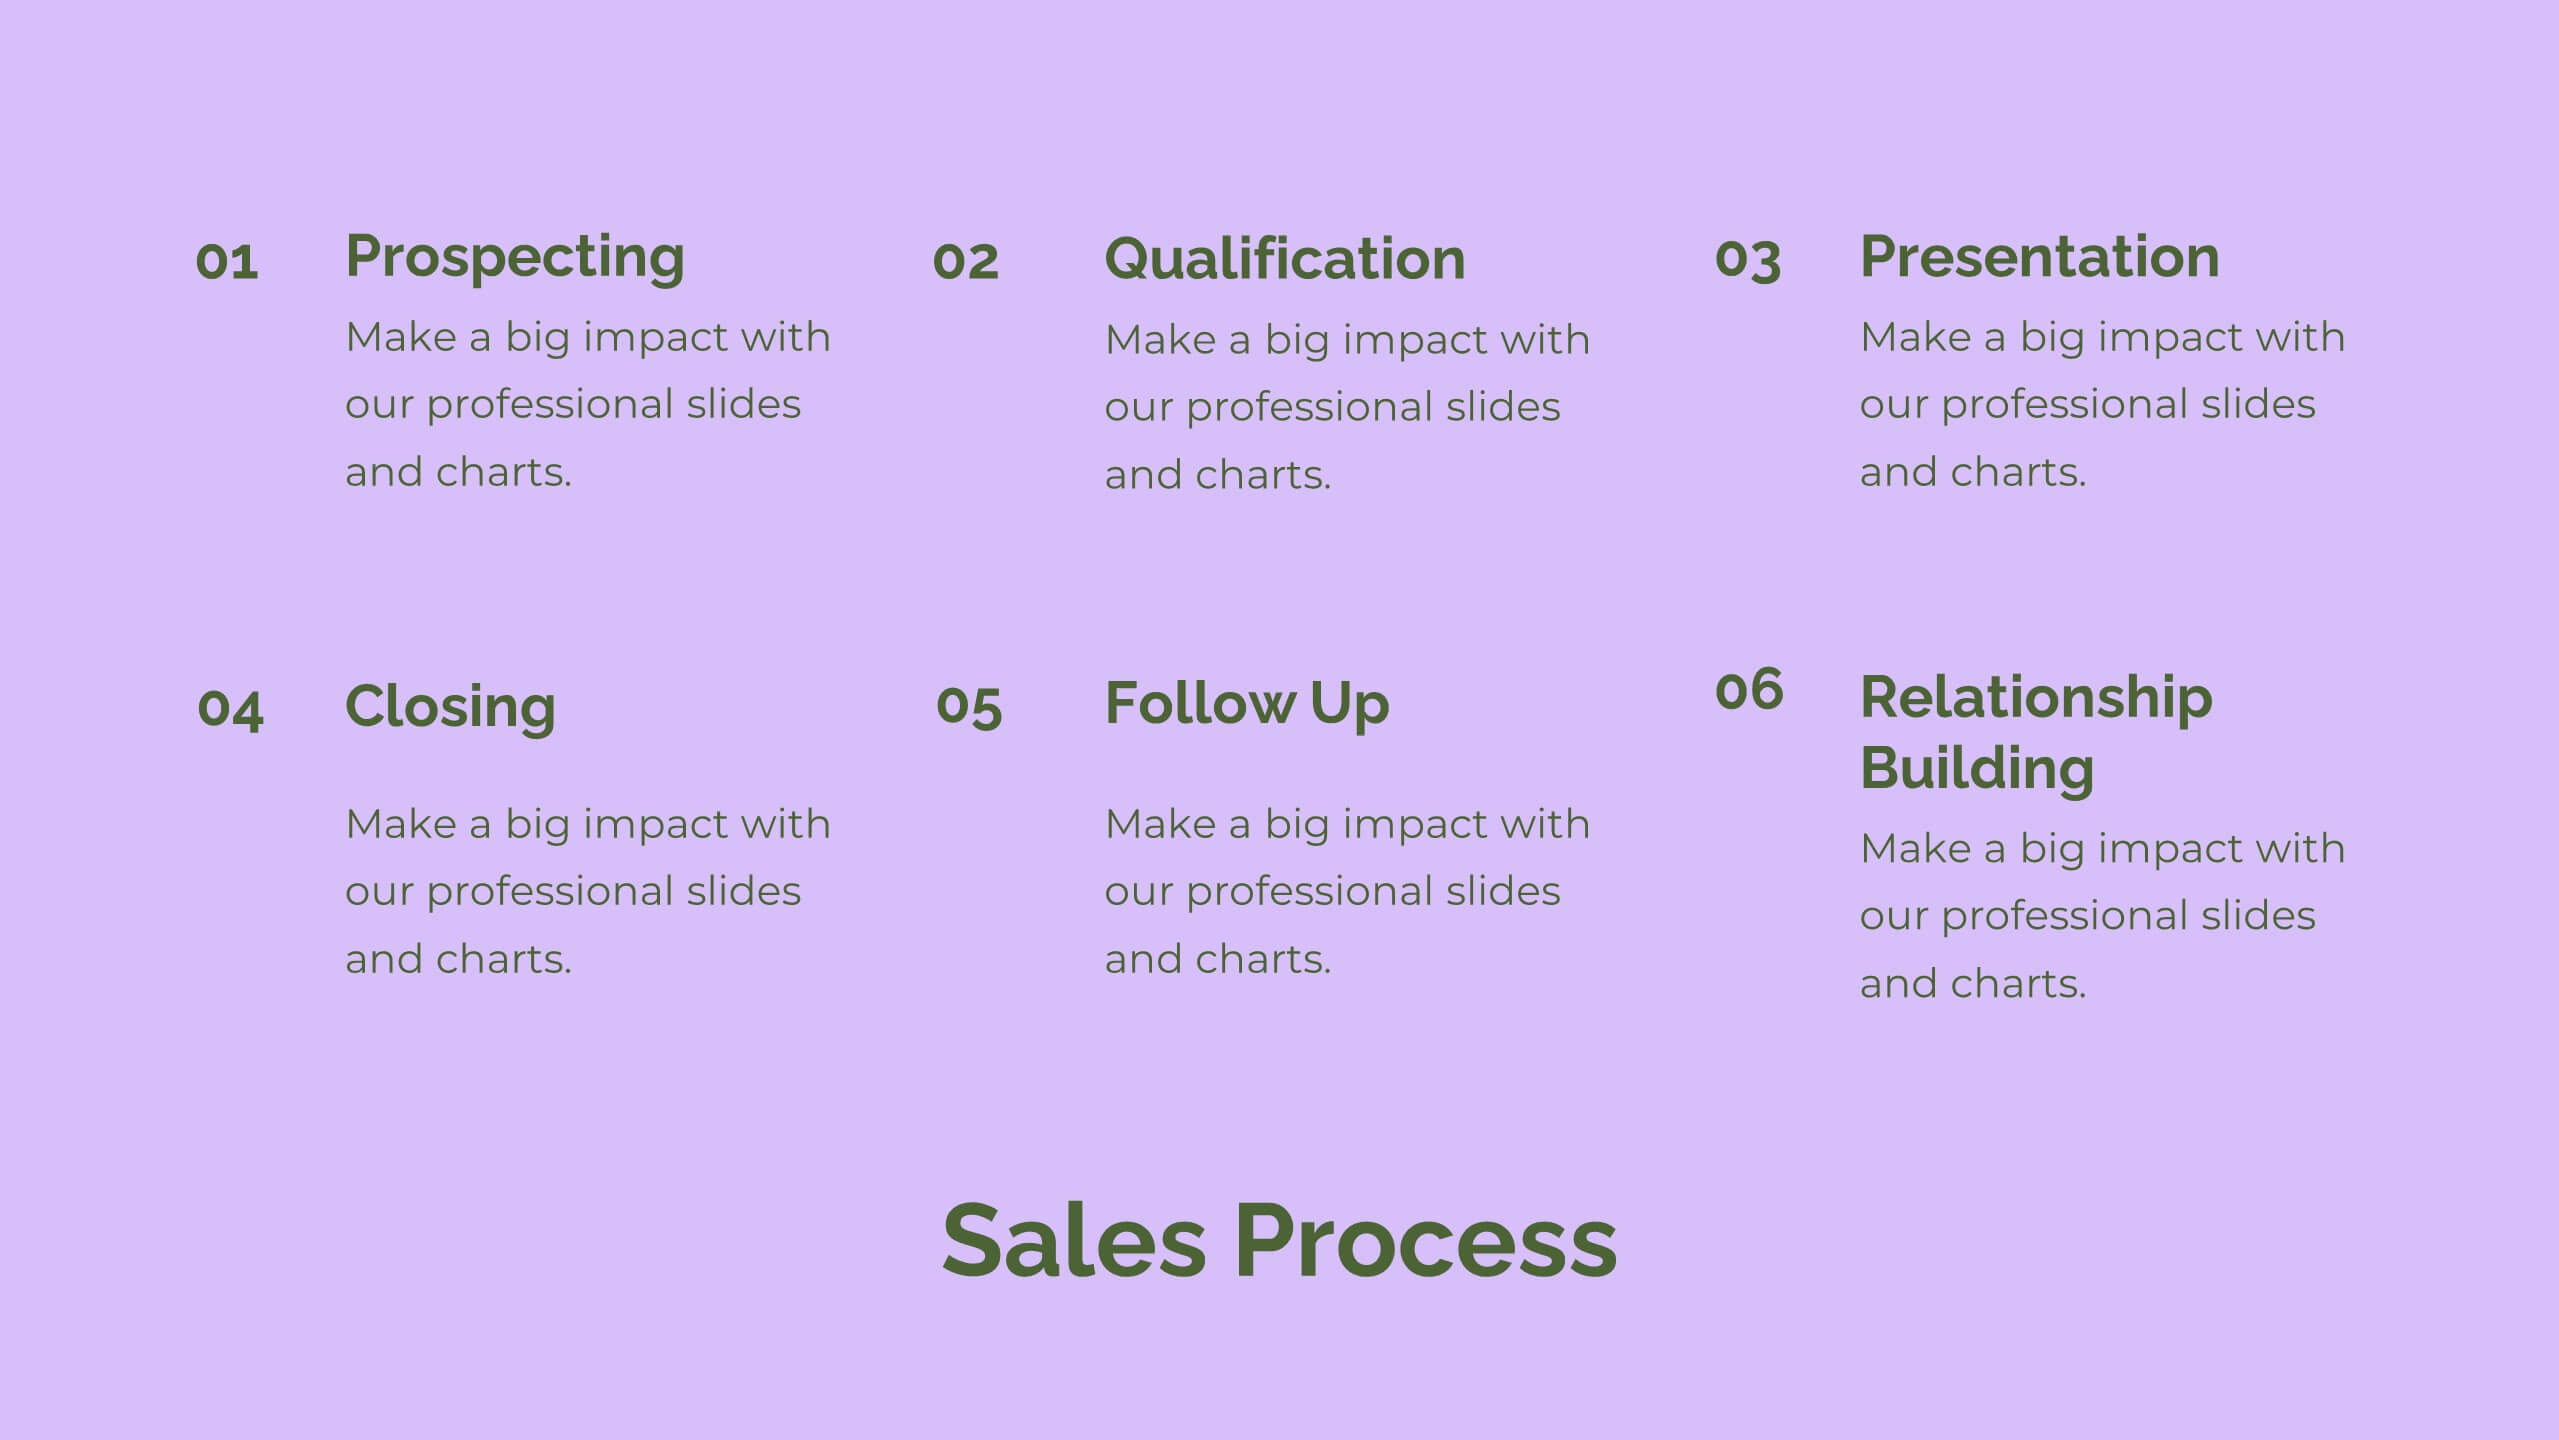
Glint Sales Strategy Presentation
Boost your sales performance with this dynamic sales strategy template! Perfect for presenting your company overview, product details, and competitive analysis, it includes slides for sales objectives, pricing strategy, and performance metrics. Engage your team with vibrant visuals and clear, structured content. Compatible with PowerPoint, Keynote, and Google Slides for seamless presentations on any platform.


21 diapositivas
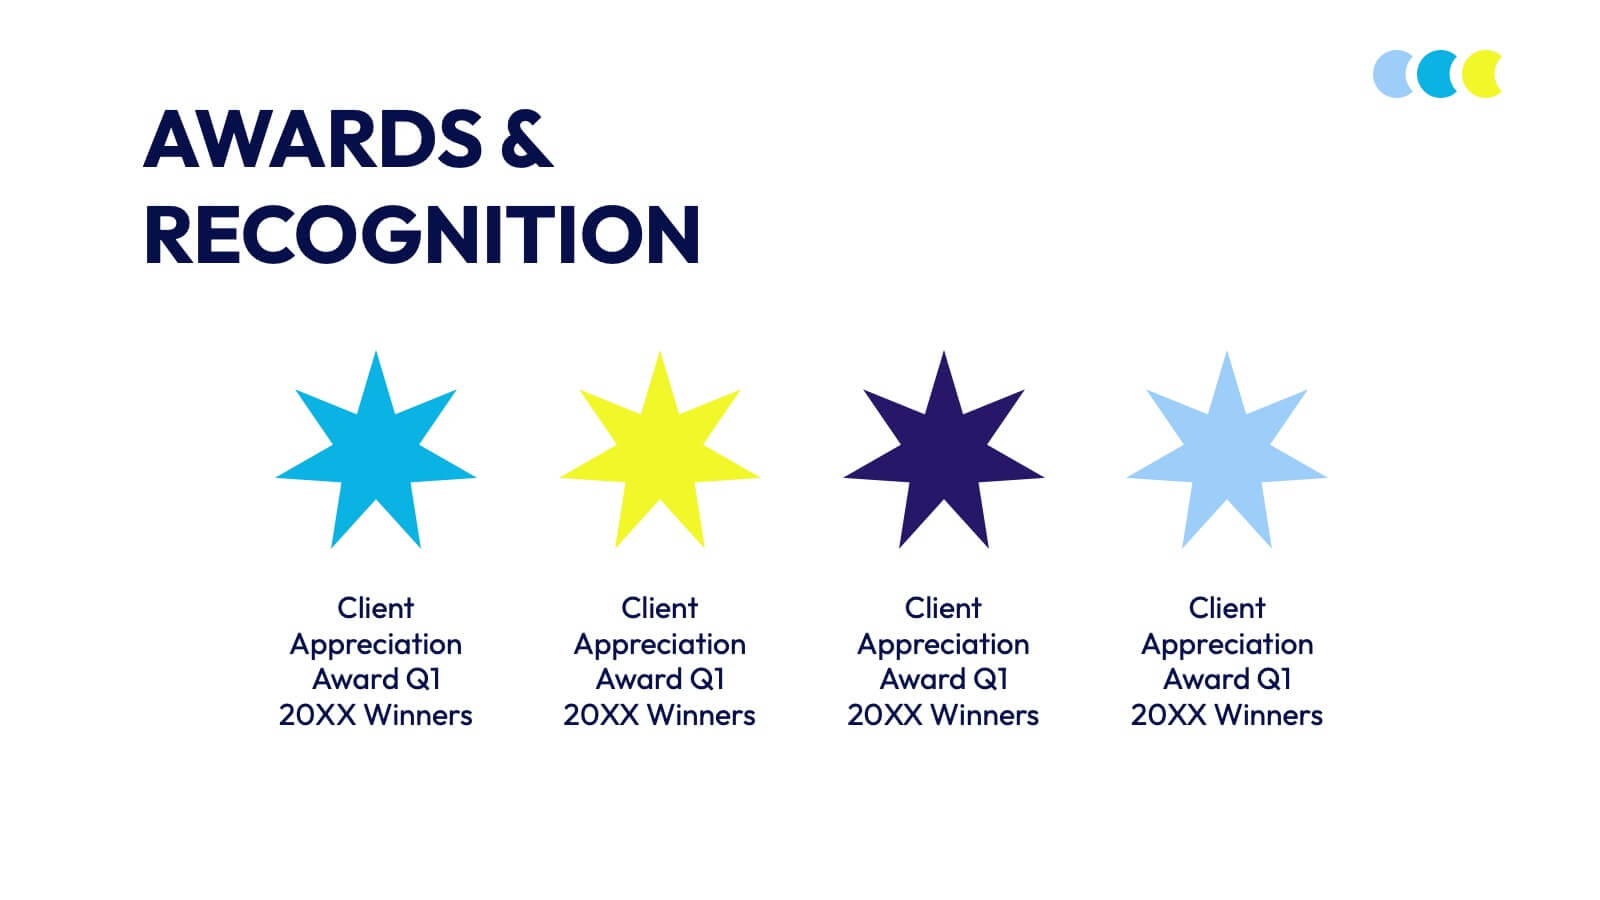
Fablelight Digital Agency Strategy Plan Presentation
This sleek and modern presentation template is designed to effectively communicate a strategic plan for any professional agency. It includes sections for mission and vision, team structure, services offered, and a detailed creative process. Dive into market analysis, industry trends, and case studies to showcase expertise and success stories. Strategy development, campaign execution, and measurement analytics are highlighted to demonstrate goal-oriented planning. Client testimonials, partnerships, social impact initiatives, and awards provide credibility and enhance trust. Fully customizable and compatible with PowerPoint, Keynote, and Google Slides.