


Características


¿Tienes alguna pregunta?
Recomendar


5 diapositivas
Smart Agriculture and Sustainability Trends
Highlight the future of farming with the Smart Agriculture and Sustainability Trends Presentation. This slide features a sleek visual progression of plant growth stages, symbolizing innovation, eco-conscious development, and data-driven agricultural trends. Ideal for sustainability reports, agritech proposals, and environmental briefings. Fully editable and compatible with PowerPoint, Keynote, and Google Slides.


6 diapositivas
Startup Investors Pitch Deck Presentation
Inspire confidence and spark investor interest with the Startup Investor Pitch Deck Presentation. Featuring a creative visual of a rocket launching from a piggy bank, this slide is ideal for illustrating funding momentum, business growth, or financial milestones. Each section allows space to highlight critical investment points such as traction, market opportunity, financials, and team highlights. Fully customizable in PowerPoint, Keynote, or Google Slides, this pitch-ready layout is perfect for entrepreneurs, startup founders, and innovation teams aiming to deliver a memorable and professional presentation.


4 diapositivas
Economic Trends and Analysis of North America Map Presentation
Present key regional insights with this North America economic analysis map. Compare up to four locations using percentage stats and customizable titles. Ideal for showcasing market trends, financial metrics, or growth data. Fully editable in PowerPoint, Keynote, and Google Slides—perfect for economic forecasts, business reports, or strategy meetings.


4 diapositivas
Project Proposal Executive Summary Presentation
Optimize your project presentations with the 'Project Proposal Executive Summary' template. Crafted to clearly showcase your project’s most crucial elements, this template uses visuals and concise text to highlight objectives and deliverables effectively. Ideal for professionals preparing proposals in PowerPoint, Keynote, or Google Slides.


7 diapositivas
Enterprise Sales Infographic
Enterprise sales, often referred to as B2B (business-to-business) sales, involves selling products or services to larger organizations and enterprises. Prepare for an exhilarating journey through our sales infographic - a high-energy presentation designed to fuel your enterprise sales like never before. Illuminate the path to a seamless customer experience, leading to a galaxy of satisfaction. This infographic is fully customizable and compatible with Powerpoint, Keynote, and Google Slides. This template isn't just a sales roadmap; it's a launchpad to your unparalleled success!


5 diapositivas
Behavioral Psychology Diagram Presentation
Give your audience something to think about—literally. This bold and modern infographic layout lets you visualize complex human behavior patterns through simple, colorful brain-mapping diagrams. Perfect for presenting psychological insights, decision-making models, or behavioral science data. Fully compatible with PowerPoint, Keynote, and Google Slides for easy customization and professional use.


7 diapositivas
North America Map Infographic Presentation Template
North America is a continent entirely within the Northern Hemisphere and almost all within the Western Hemisphere. It can also be considered a northern subcontinent of the Americas. North America is the third largest continent in the world, and home to some of the world's most iconic landmarks. This North America template is great for creating a simple and clean map. This easy-to-customize map includes icons in both light and dark color variations. This North America map template is great for presentations, reports and more. Add your data to create a professional presentation.


25 diapositivas
Luminous Qualitative Research Findings Presentation
Elevate your qualitative research findings with this sleek and professional template. It covers research objectives, methodology, data collection, and key findings. Ideal for clear and compelling presentations. Fully compatible with PowerPoint, Keynote, and Google Slides for seamless integration.


4 diapositivas
Marketing KPI Dashboard Presentation
Visualize marketing performance at a glance with this Marketing KPI Dashboard Presentation. Designed with a modern funnel graphic and monthly performance bars, this slide highlights key metrics such as audience reach, engagement rate, conversion rate, and campaign effectiveness. Color-coded indicators make insights easy to interpret. Ideal for marketing teams, strategy updates, and performance reviews. Fully customizable in PowerPoint, Keynote, and Google Slides.


7 diapositivas
Tree Diagrams Infographics Presentation Template
Tree diagrams are visual diagrams of different outcomes that can result when you take a certain action. They can be used to depict the various possible outcomes of an event or problem, helping you understand your options and choose the best one for a given purpose. They can be used to show statistical probabilities, or general issues that result in many possible ways of moving forward. Use this template to create your own tree diagram, as a new business planning tool to develop goals and objectives. This tree diagram template can help you visualize any project, large or small.


4 diapositivas
Artificial Intelligence Strategy Map Presentation
Step into the future with a clean, modern layout that makes complex technology easy to grasp and exciting to explore. This presentation helps you break down emerging innovations, real-world applications, and industry opportunities using clear visuals and structured sections. Fully customizable and compatible with PowerPoint, Keynote, and Google Slides.


5 diapositivas
Fashion History Infographics
Fashion History is a rich and fascinating study that allows us to appreciate the artistry, craftsmanship, and cultural significance of clothing and style. These infographic templates explore the evolution of fashion over time. These templates are designed to present key milestones, trends, and influential figures in fashion history in a concise and engaging manner. The color scheme, icons, and illustrations included help these serve as visually captivating resources for anyone interested in the evolution of fashion. Perfect for fashion history presentations, museum exhibitions, or any occasion where you want to share the rich and diverse history of fashion.


6 diapositivas
Peak Flow Chart Infographic
A flowchart is a visual representation of a process or workflow using various symbols, arrows, and connectors to show the sequence of steps and decisions involved in that process. This infographic template is a powerful tool for illustrating complex processes in a clear and easy-to-understand manner. Compatible with Powerpoint, Keynote, and Google Slides. The flowcharts featured consist of various shapes or symbols that represent different process steps or activities. The infographic depicts the sequential order of steps in a process, showing the logical progression from one step to another. Each step is connected to the next step using arrows.


22 diapositivas
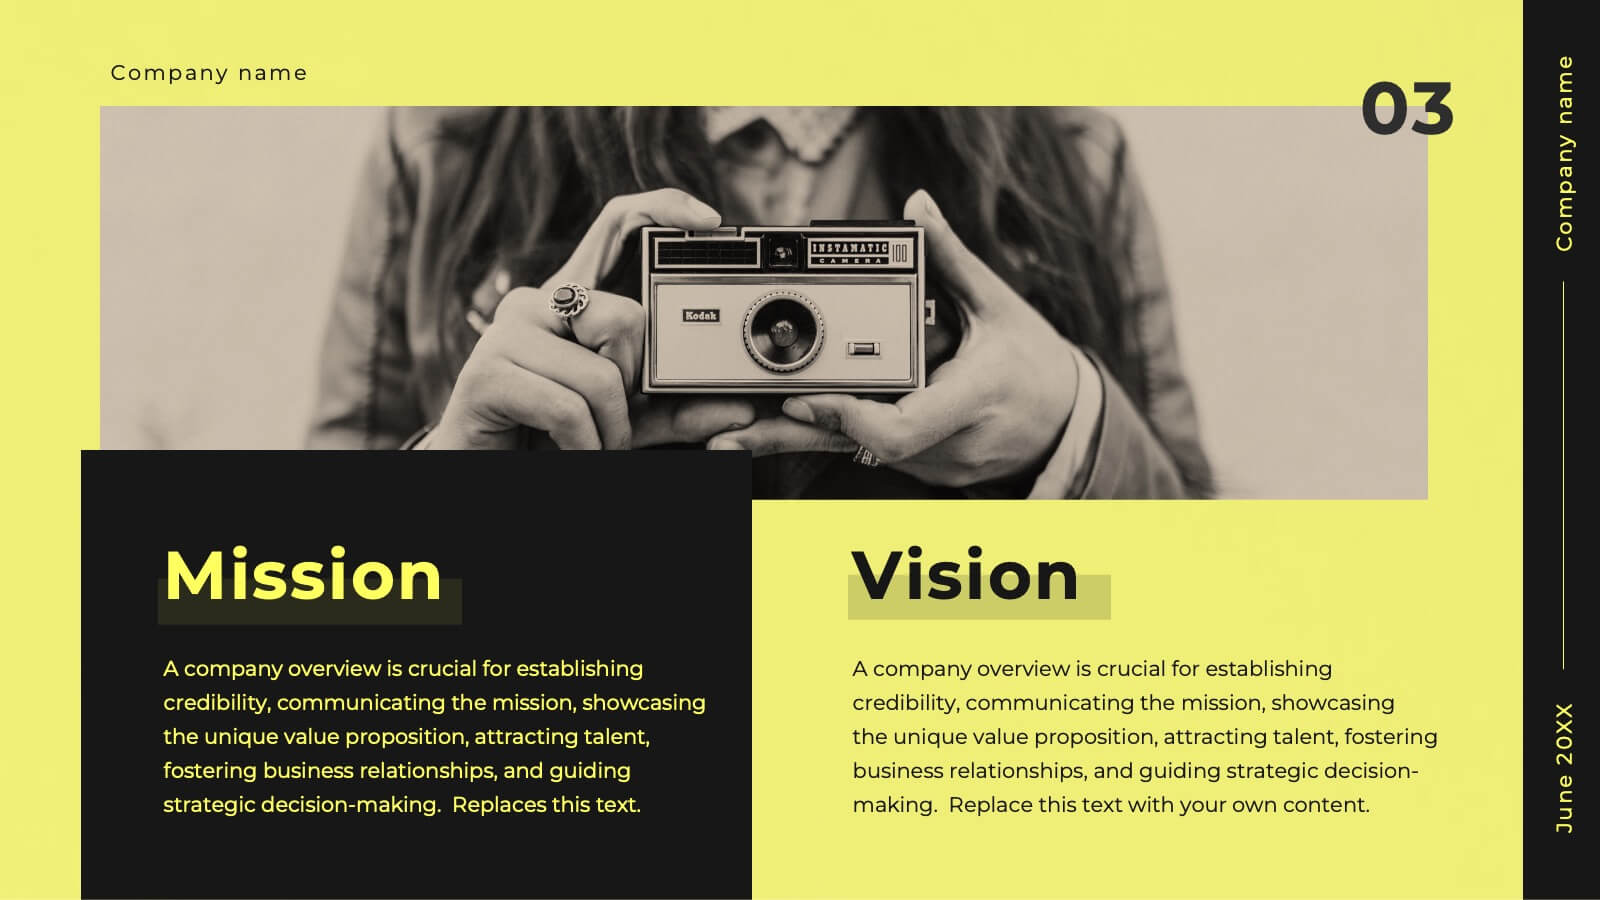
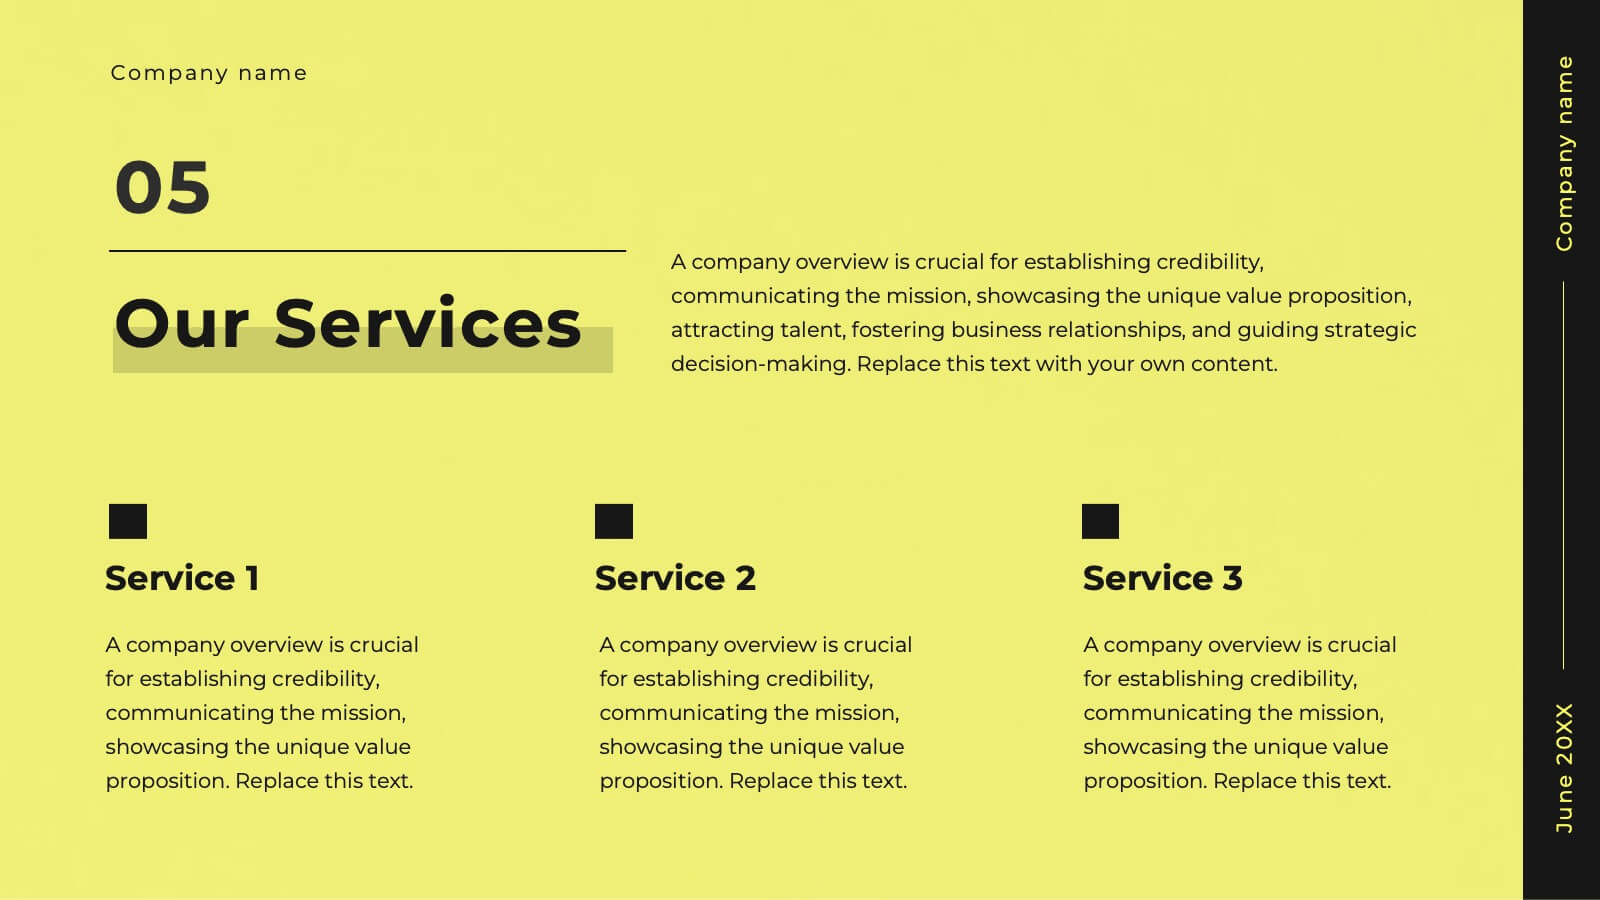
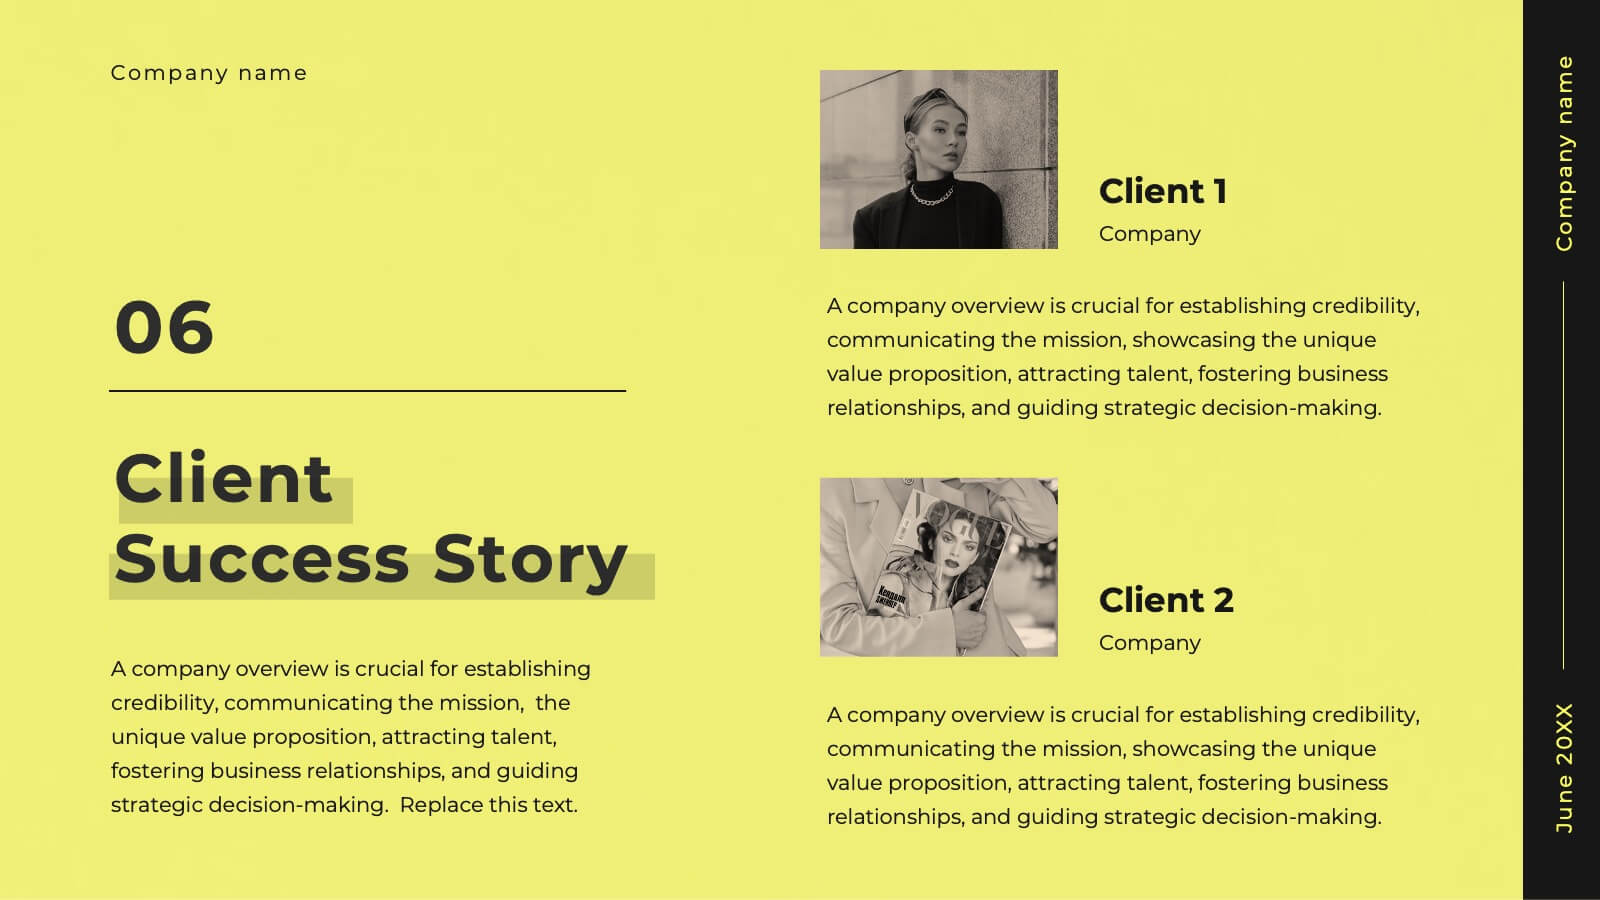
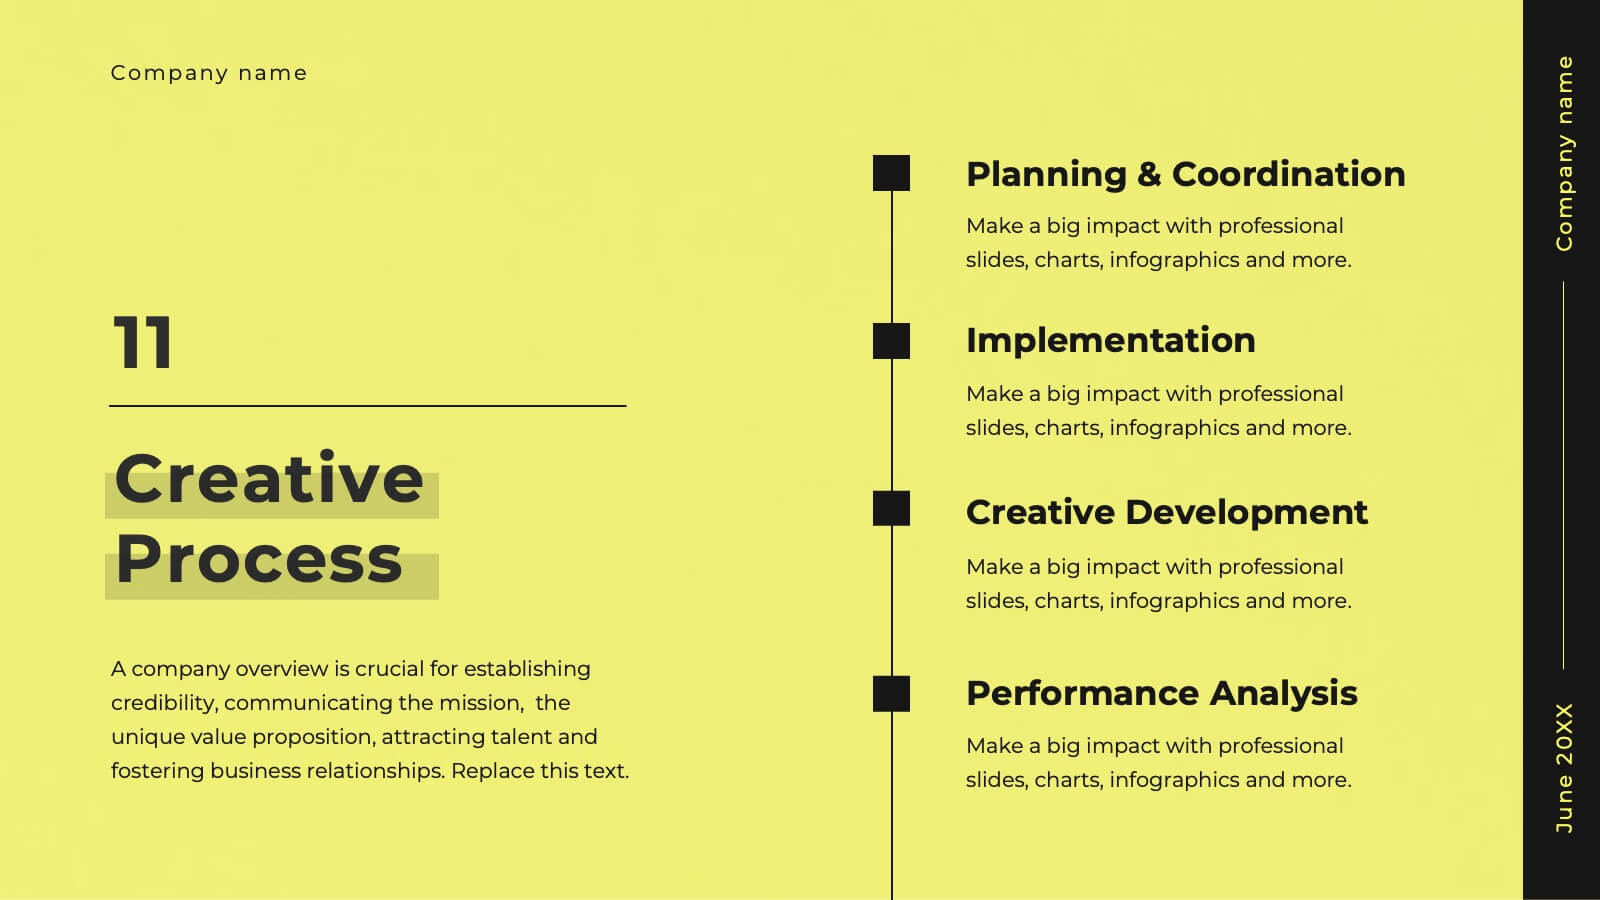
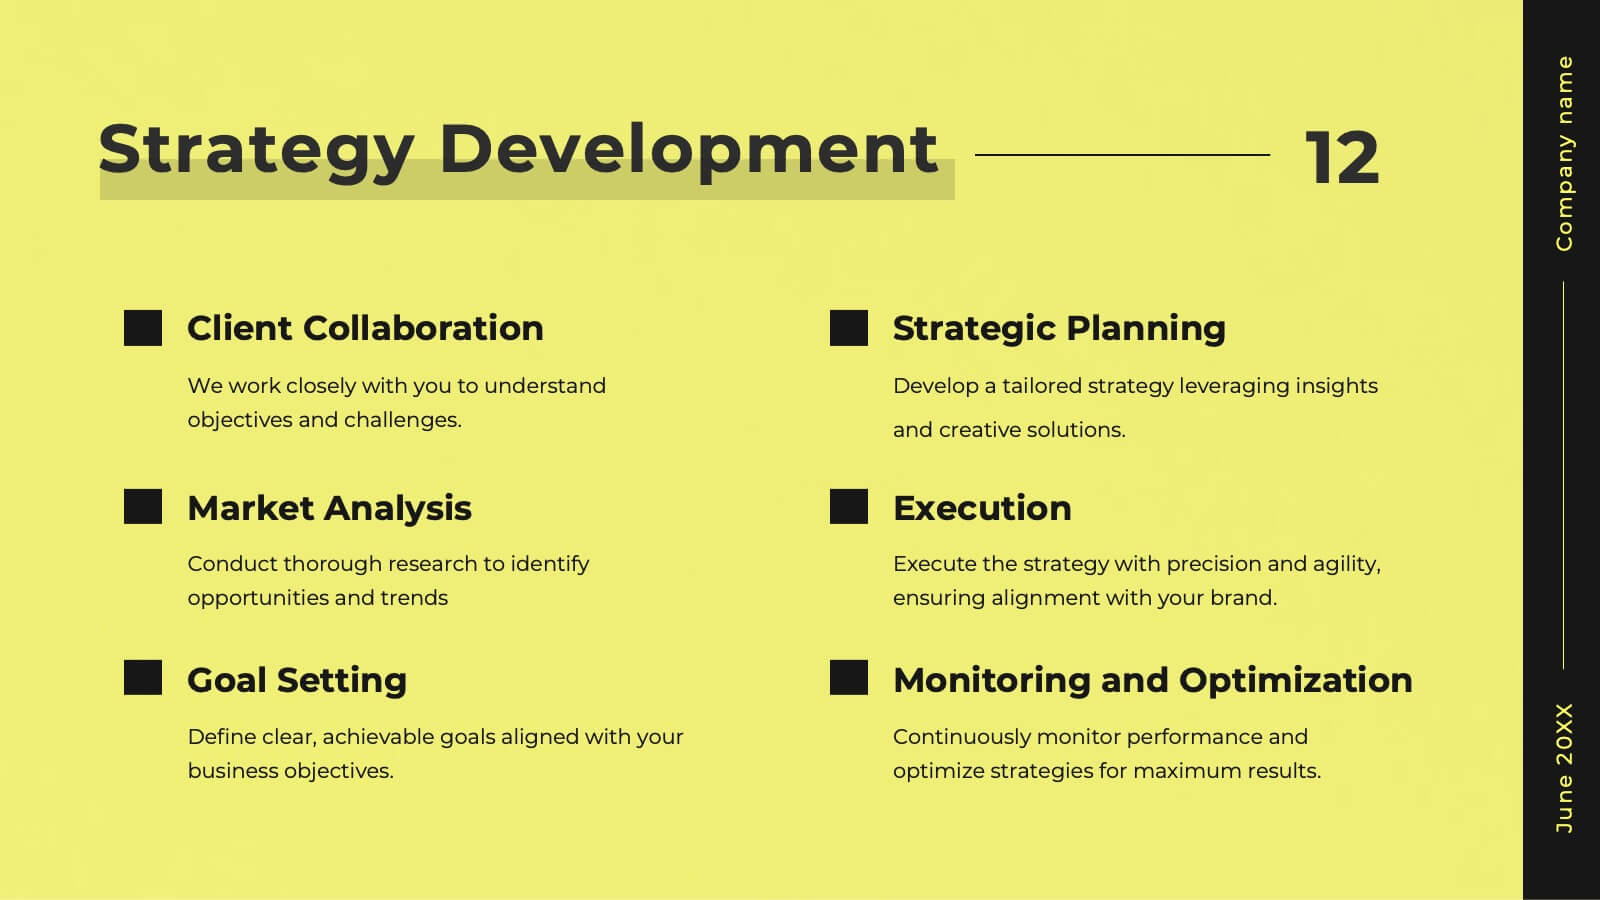
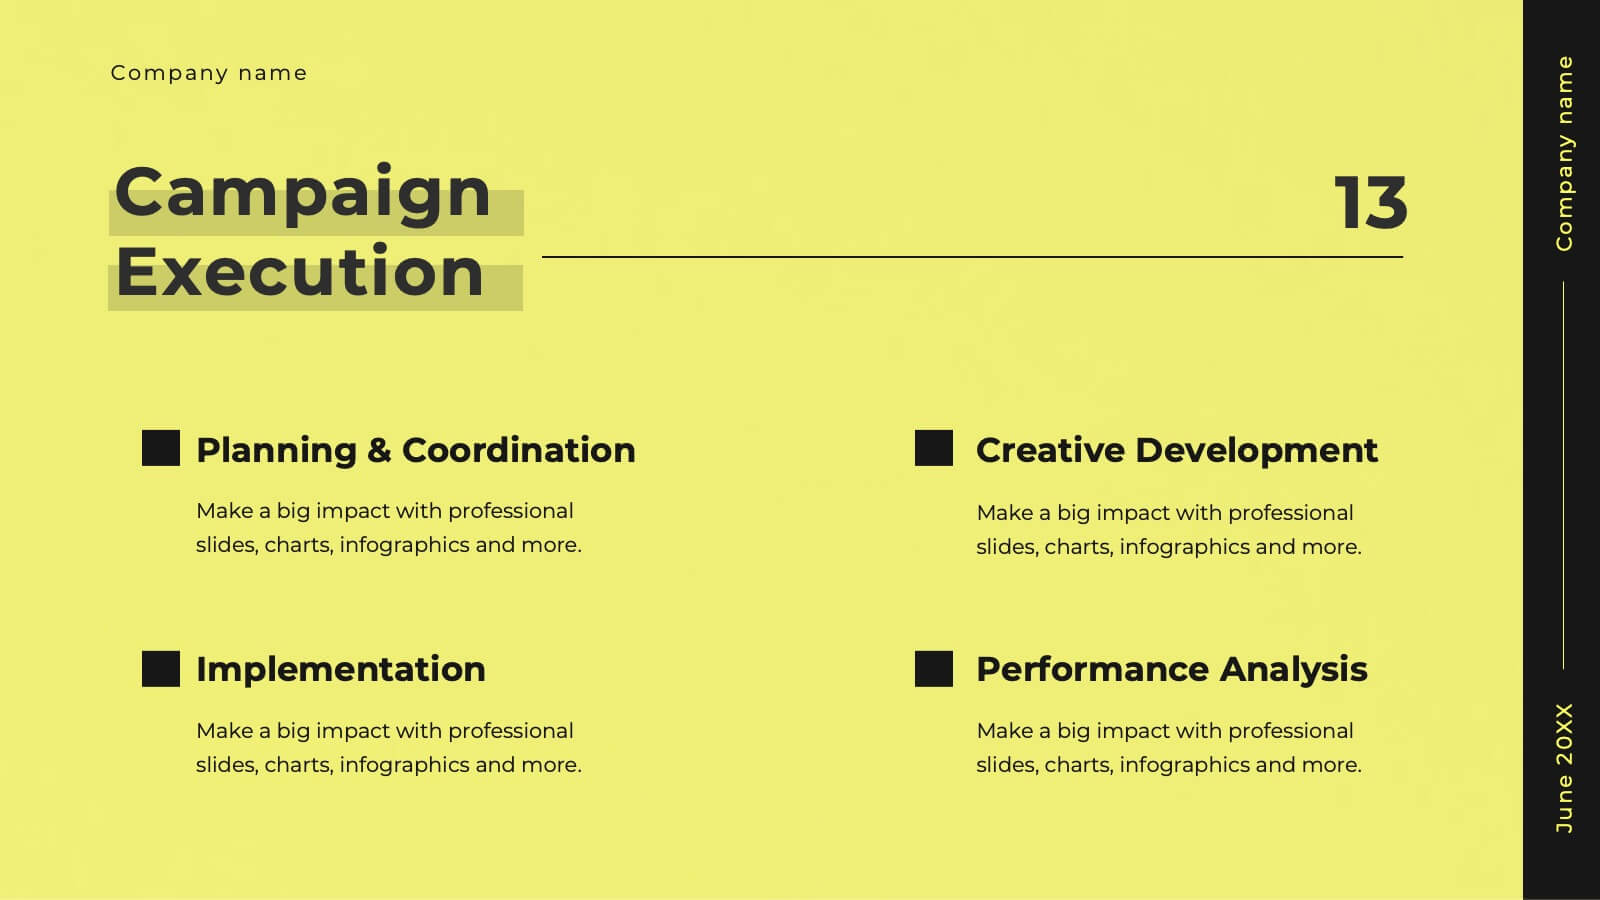
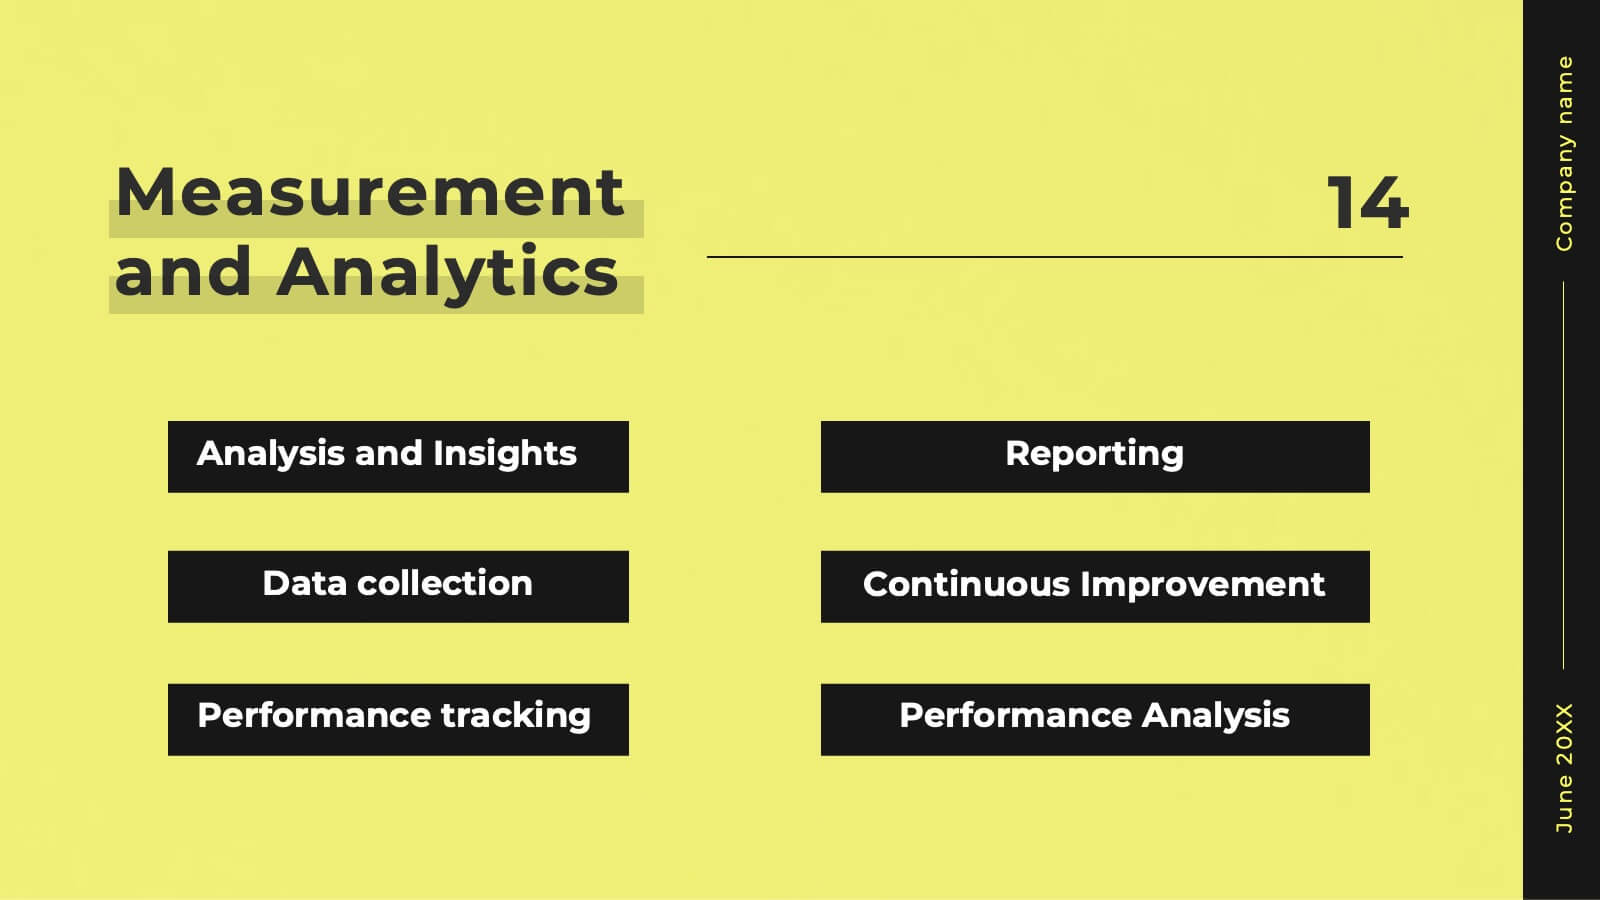
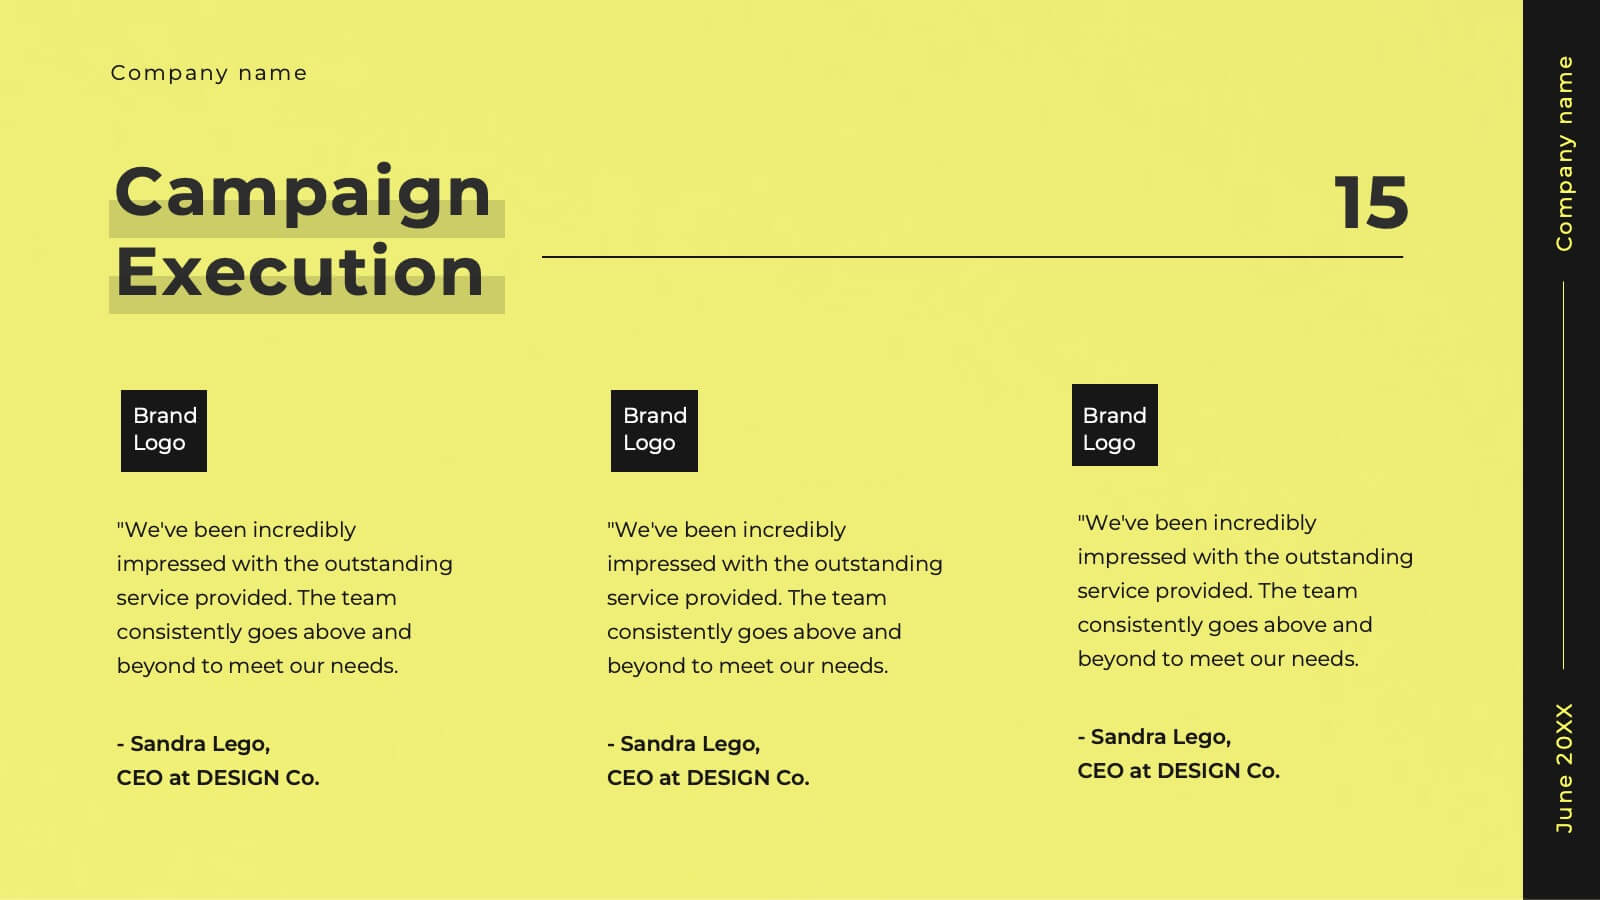
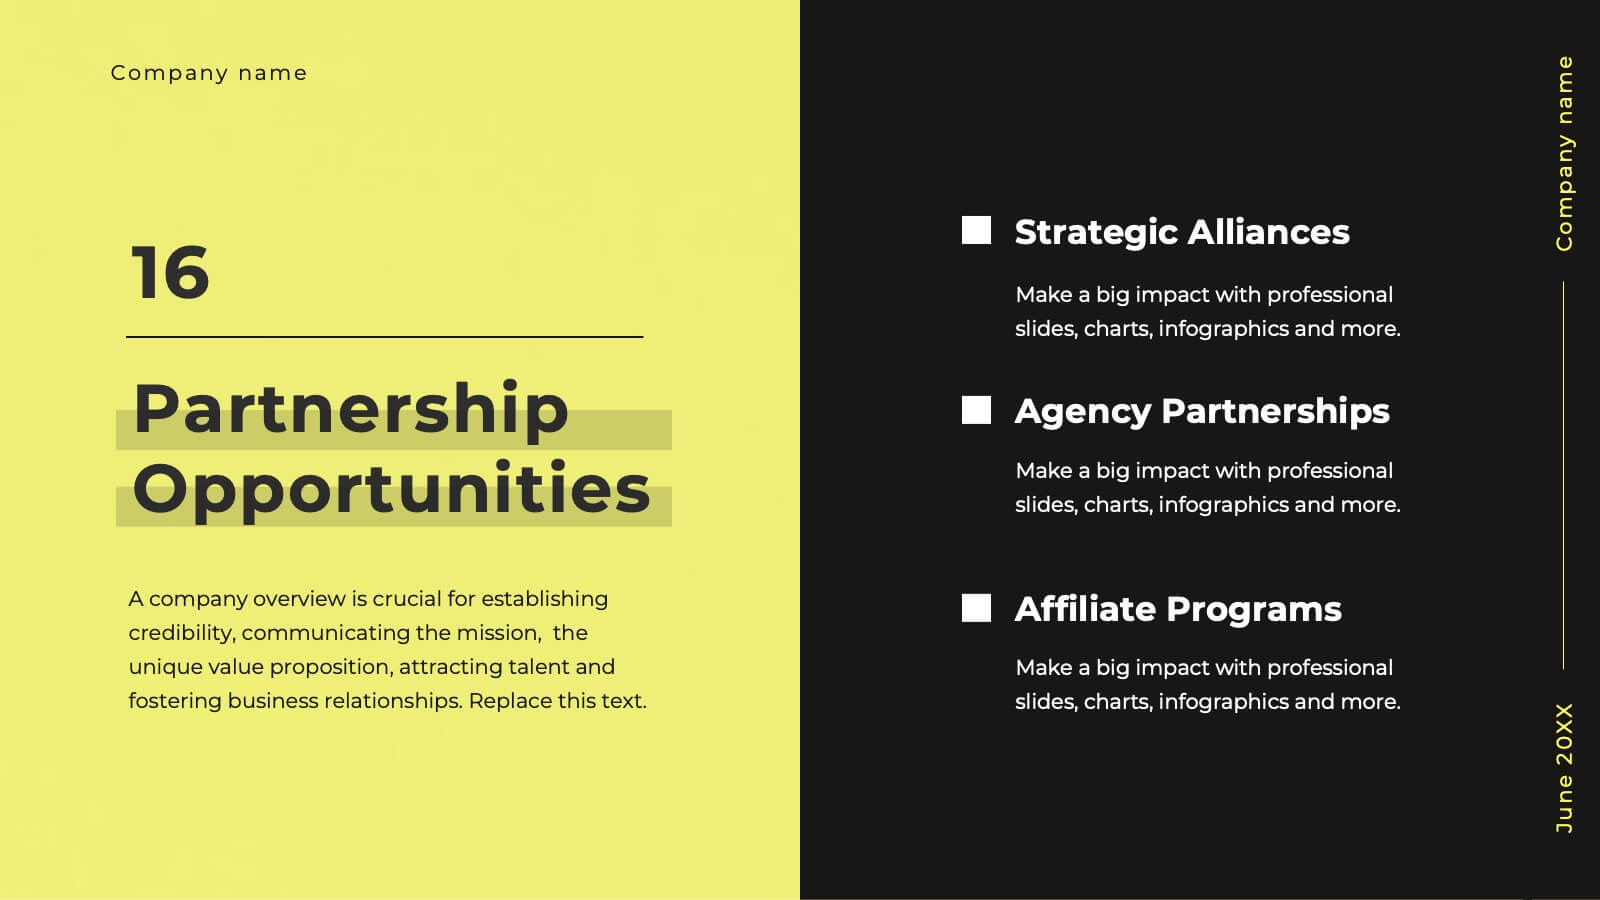
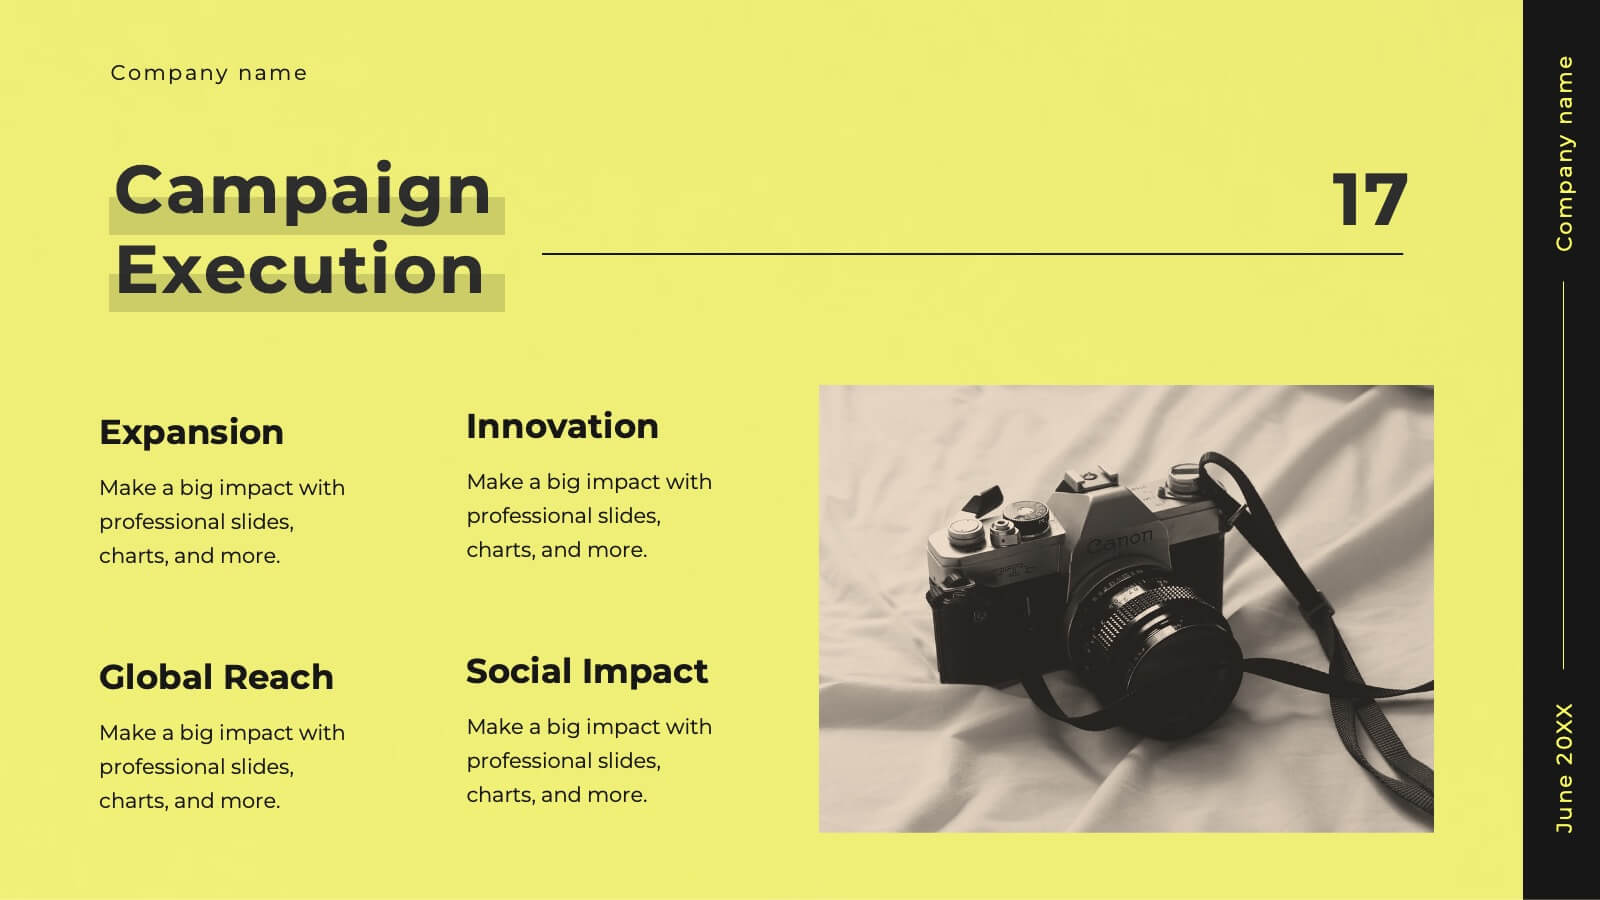
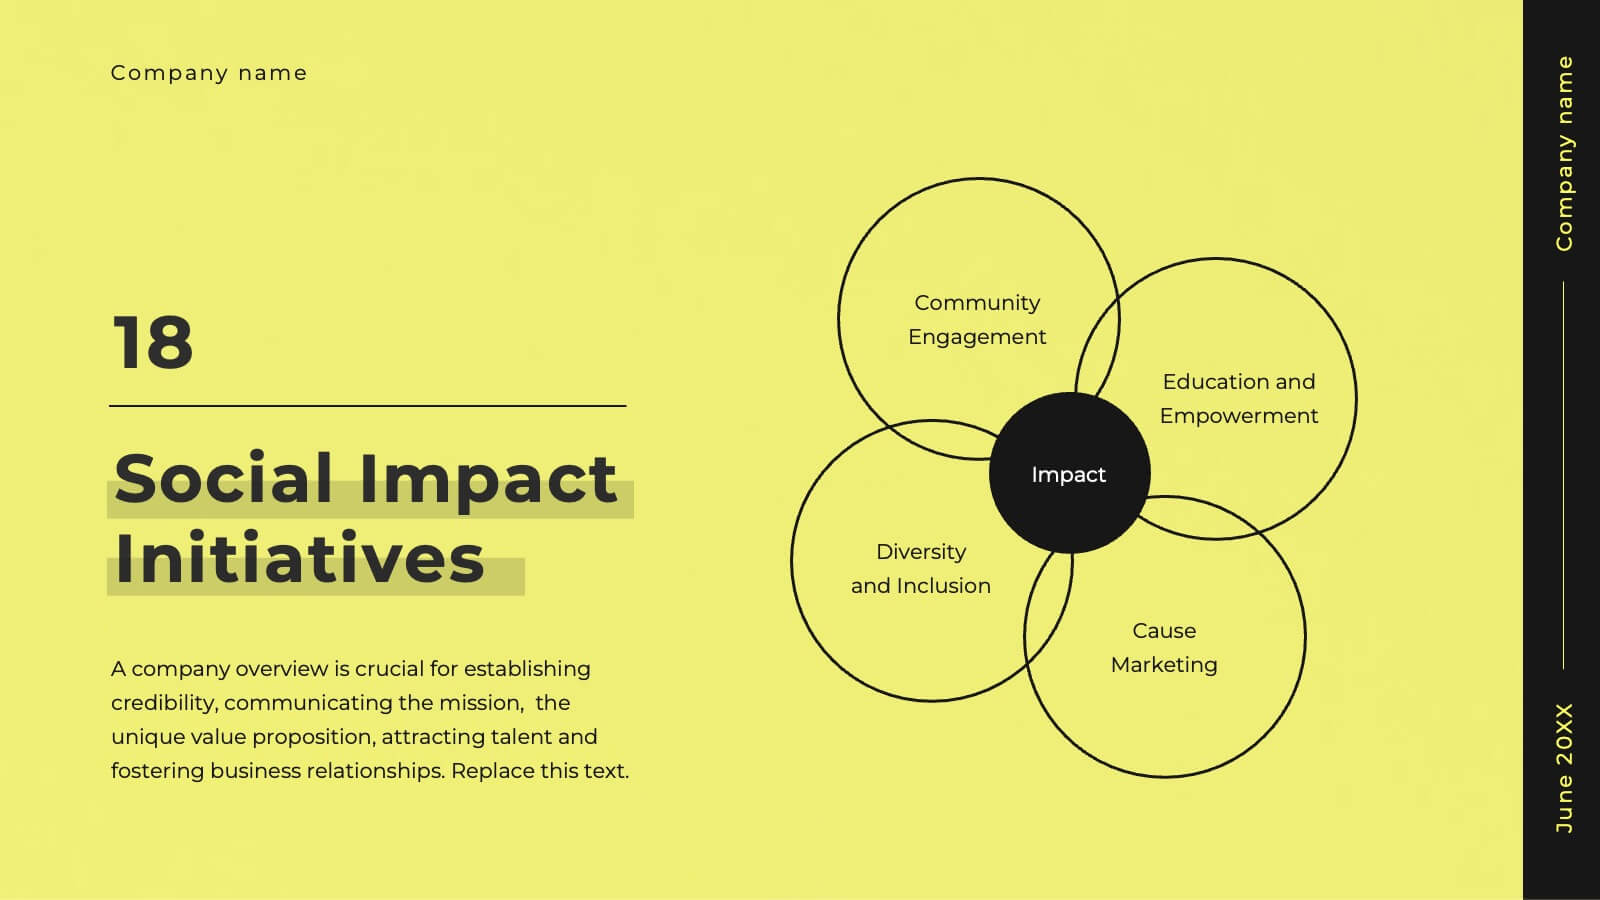
Glimmer Creative Agency Pitch Deck Presentation
Step up your game with this vibrant agency pitch deck template! Ideal for showcasing your services, client success stories, and strategic approach, it includes dynamic slides for market analysis and campaign execution. Engage potential clients with compelling visuals and well-organized content. Compatible with PowerPoint, Keynote, and Google Slides for a smooth presentation experience on any platform.


24 diapositivas
Zenith Investor Pitch Presentation
Impress your investors with this sleek, modern pitch deck presentation template. Perfect for detailing problem statements, solutions, business models, and revenue projections, it features a professional design with a cohesive color scheme. Highlight key elements like market opportunities, competitive landscapes, and financials to captivate your audience. Compatible with PowerPoint, Keynote, and Google Slides, it ensures seamless presentations on any platform.


5 diapositivas
Poaching Facts Infographics
Poaching refers to the illegal hunting, capturing, or killing of wildlife, typically for profit or personal gain. These compelling and informative infographic templates are designed to shed light on the issue of poaching and its impact on wildlife and ecosystems. They present key facts, statistics, and illustrations to raise awareness about the seriousness of poaching and the need for conservation efforts. By increasing awareness and understanding of the poaching crisis, these templates contribute to the collective efforts in protecting our precious wildlife and preserving the natural world.


10 diapositivas
Modern Healthcare Technology Trends Presentation
Highlight innovations in healthcare with the Modern Healthcare Technology Trends Presentation. This slide features a central device graphic connected to four key icons, perfect for showcasing digital tools, emerging trends, or medical tech strategies. Fully customizable in Canva, PowerPoint, Keynote, and Google Slides—ideal for medical tech briefings and strategic presentations.