


Características


¿Tienes alguna pregunta?
Recomendar


12 diapositivas
Startup Investor Pitch Deck Presentation
Craft a compelling pitch with this Startup Investor Pitch Deck template. Featuring a structured layout, it helps showcase your startup’s vision, market potential, and financial projections. Designed for clarity and engagement, this template ensures a persuasive investor presentation. Fully compatible with PowerPoint, Keynote, and Google Slides for seamless customization.


4 diapositivas
Asia Market Distribution Map Presentation
Highlight your business reach with the Asia Market Distribution Map Presentation. This dynamic layout features a regional color-coded map paired with labeled icons for clear segmentation by country or territory. Ideal for marketing teams, sales updates, and geographic performance reviews. Fully customizable in PowerPoint, Keynote, Google Slides, and Canva.


7 diapositivas
PESTEL Analysis Marketing Infographic
PESTEL Analysis, often referred to as PESTLE Analysis, is a strategic management tool used to analyze and evaluate external macro-environmental factors that can impact an organization. This infographic template is a comprehensive and visually captivating template that unravels the strategic insights derived from the PESTEL analysis in the realm of marketing. Explore the critical external factors that influence your marketing strategy and steer your business towards success. Compatible with Powerpoint, Keynote, and Google Slides. Empower your marketing strategies with our PESTEL Analysis Marketing Infographic!


7 diapositivas
Data Analysis Research Infographic
A Data Analysis Research infographic is a visual representation of the key findings of a research study that used data analysis techniques. The purpose of this template is to provide a clear summary of the research study's most important results, making it easier for your viewers to understand and interpret the findings. This infographic include visualizations such as charts, graphs, icons, and tables that present key data points in a visually compelling way. This template is designed to highlight differences between groups or subgroups, or show how various factors are related to one another.
8 diapositivas
Performance Tracking Using OKRs Presentation
Track success effectively with the Performance Tracking Using OKRs presentation. This sleek infinity loop design showcases key metrics across People, Products, and Processes, making it ideal for business performance reviews, goal alignment, and strategic planning. Fully editable and compatible with PowerPoint, Keynote, and Google Slides for seamless customization.


21 diapositivas
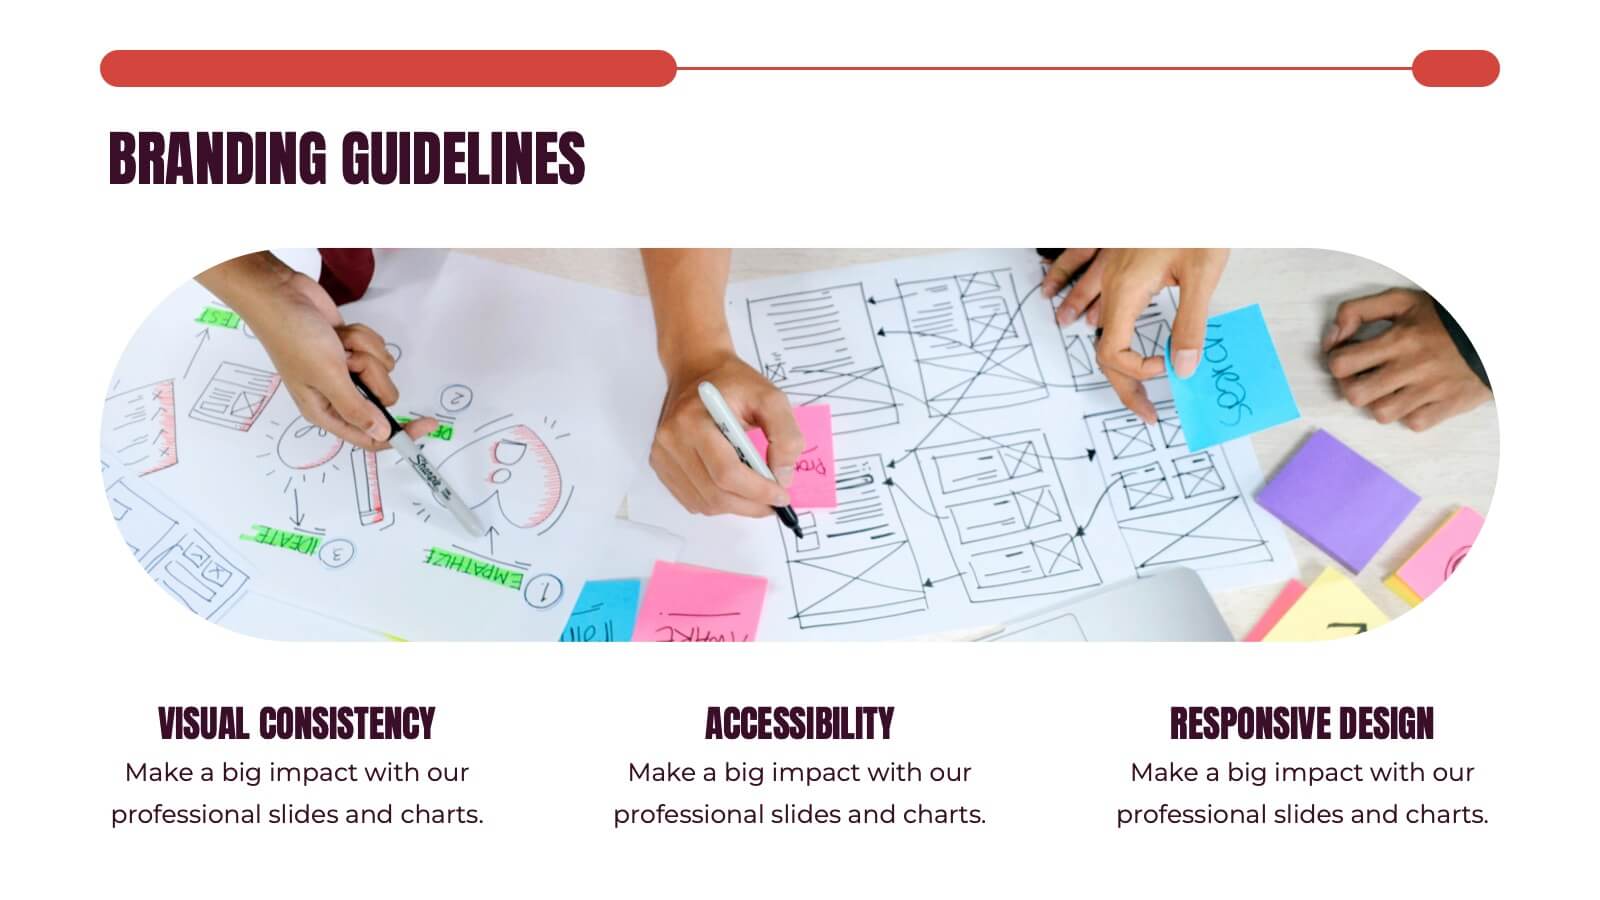
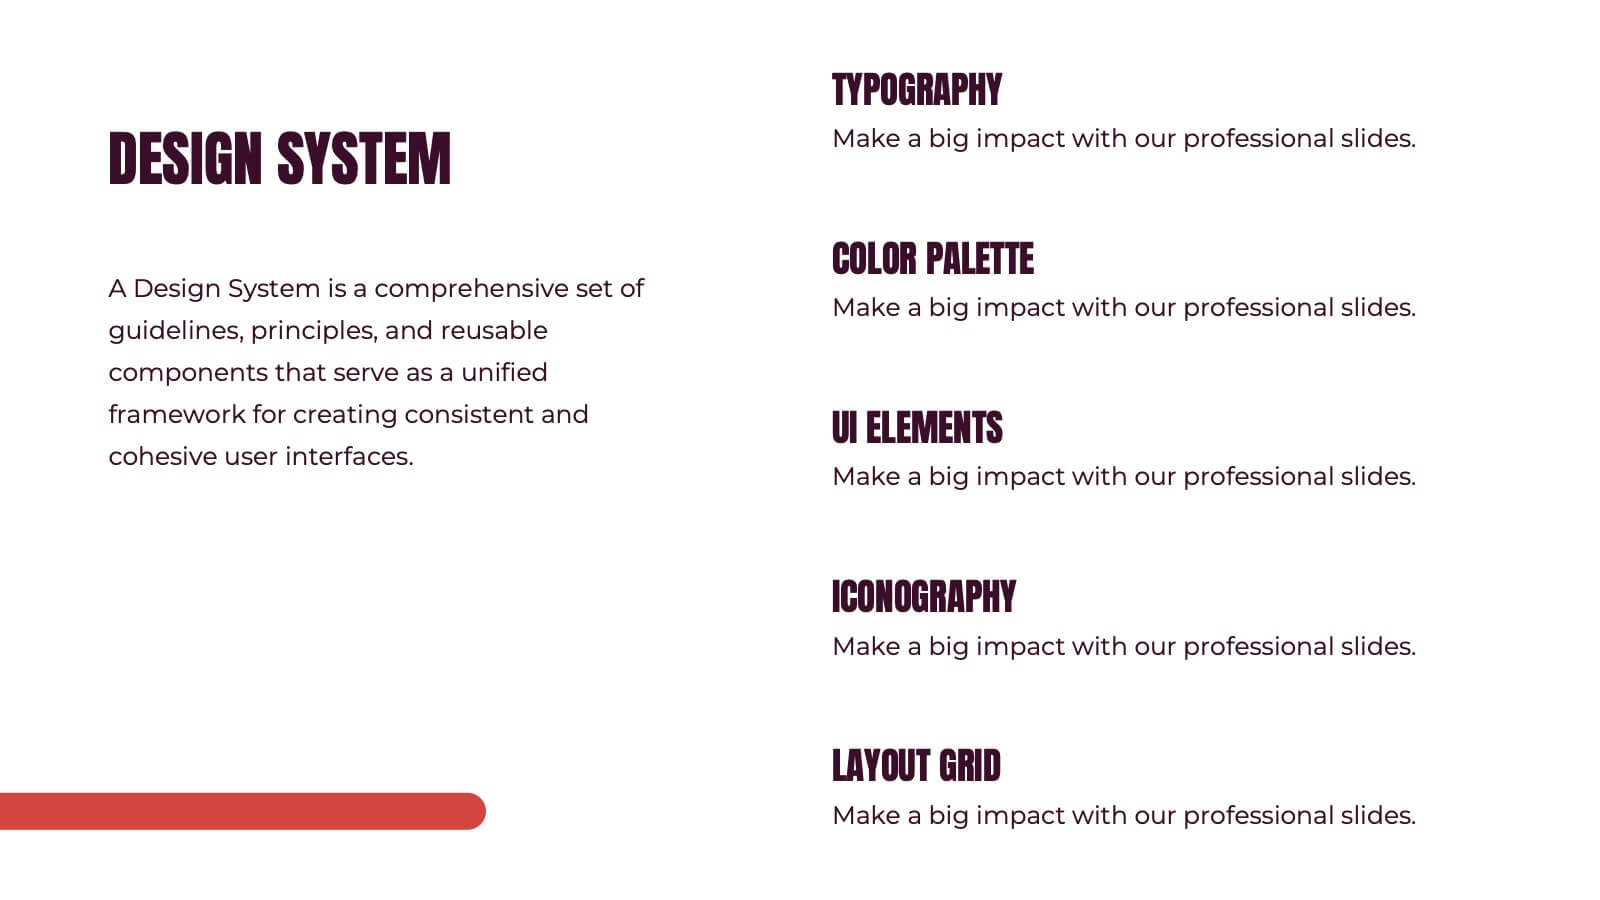
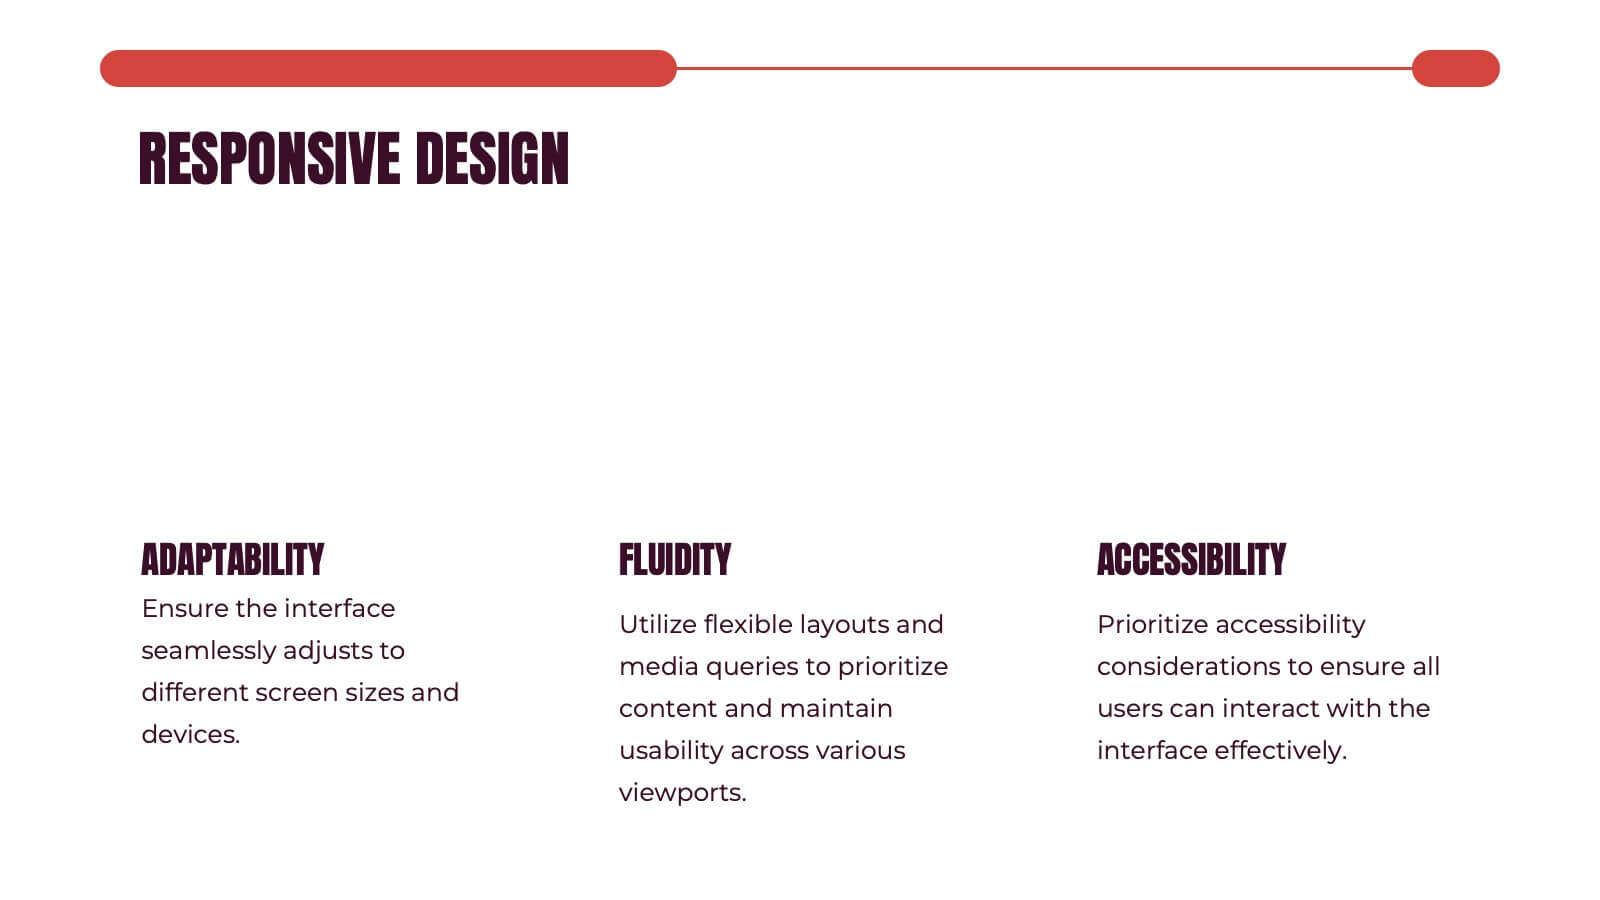
Ecliptica Design Strategy Proposal Presentation
Elevate your design strategy proposals with this clean and professional presentation template. Featuring a structured layout, it covers essential sections like design briefs, target audience analysis, concept development, and final presentation deliverables. Visuals such as wireframes, design process breakdowns, and project timelines help convey your creative ideas effectively. With placeholders for typography, color schemes, and visual direction, this template is tailored for creative professionals, agencies, and designers. Easily adaptable to suit your branding needs, it's compatible with PowerPoint, Google Slides, and Keynote for seamless customization and presentation. Perfect for pitching new strategies or showcasing your design process.


5 diapositivas
Corporate Risk Assessment Framework Presentation
Streamline corporate risk evaluations with a structured framework. This Corporate Risk Assessment Framework provides a clear, organized approach to identifying, analyzing, and managing risks. Ideal for business strategists, project managers, and compliance teams. Fully customizable and compatible with PowerPoint, Keynote, and Google Slides for seamless integration into your workflow.


6 diapositivas
Progress Monitoring Infographic
Progress monitoring provides insights into whether a project is on track, identifies any areas of concern or challenges, and informs decision-making. This infographic template is a visual representation of how to effectively monitor and track progress in various projects, tasks, or initiatives. This infographic aims to provide a clear overview of the steps and strategies involved in monitoring progress to ensure that goals are being met. This infographic is designed to provided insights into whether a project is on track, identifies any areas of concern or challenges, and informs decision-making to ensure successful project management.


6 diapositivas
Optimizing Business Through Value Chain Presentation
Improve operational efficiency and gain competitive advantage with the Optimizing Business Through Value Chain Presentation. This template breaks down each segment of your business activities—from inbound logistics to service delivery—using a modern chain-style visual layout. Perfect for strategy meetings, operational planning, or business model analysis. Fully editable in PowerPoint, Keynote, Canva, and Google Slides.


6 diapositivas
Business Case Study Slide Deck Presentation
Bring your success story to life with a clean, data-driven layout designed to showcase real results and insights. Perfect for highlighting challenges, solutions, and measurable outcomes, this presentation helps make your analysis clear and engaging. Fully compatible with PowerPoint, Keynote, and Google Slides for easy customization and professional delivery.


34 diapositivas
Pitch Deck Startup
Introducing our Pitch Deck Startup! Whether you are pitching to investors, partners, or customers, this template will help you create a persuasive presentation that showcases your company, growth plans, and financial projections. Customize the template to suit your needs and deliver a successful pitch that highlights the unique value of your startup and attracts potential investors or customers. This template includes sections for introducing your startup, explaining your business idea and market opportunity, showcasing your products or services, highlighting your financial projections, and outlining your growth plans.


7 diapositivas
Operational Workflow Chart Presentation
Turn complex operations into clear, engaging visuals with this clean, structured presentation design. Ideal for outlining procedures, systems, or process improvements, it helps your audience easily follow each stage from start to finish. Fully customizable and compatible with PowerPoint, Keynote, and Google Slides for effortless editing and professional results.


24 diapositivas
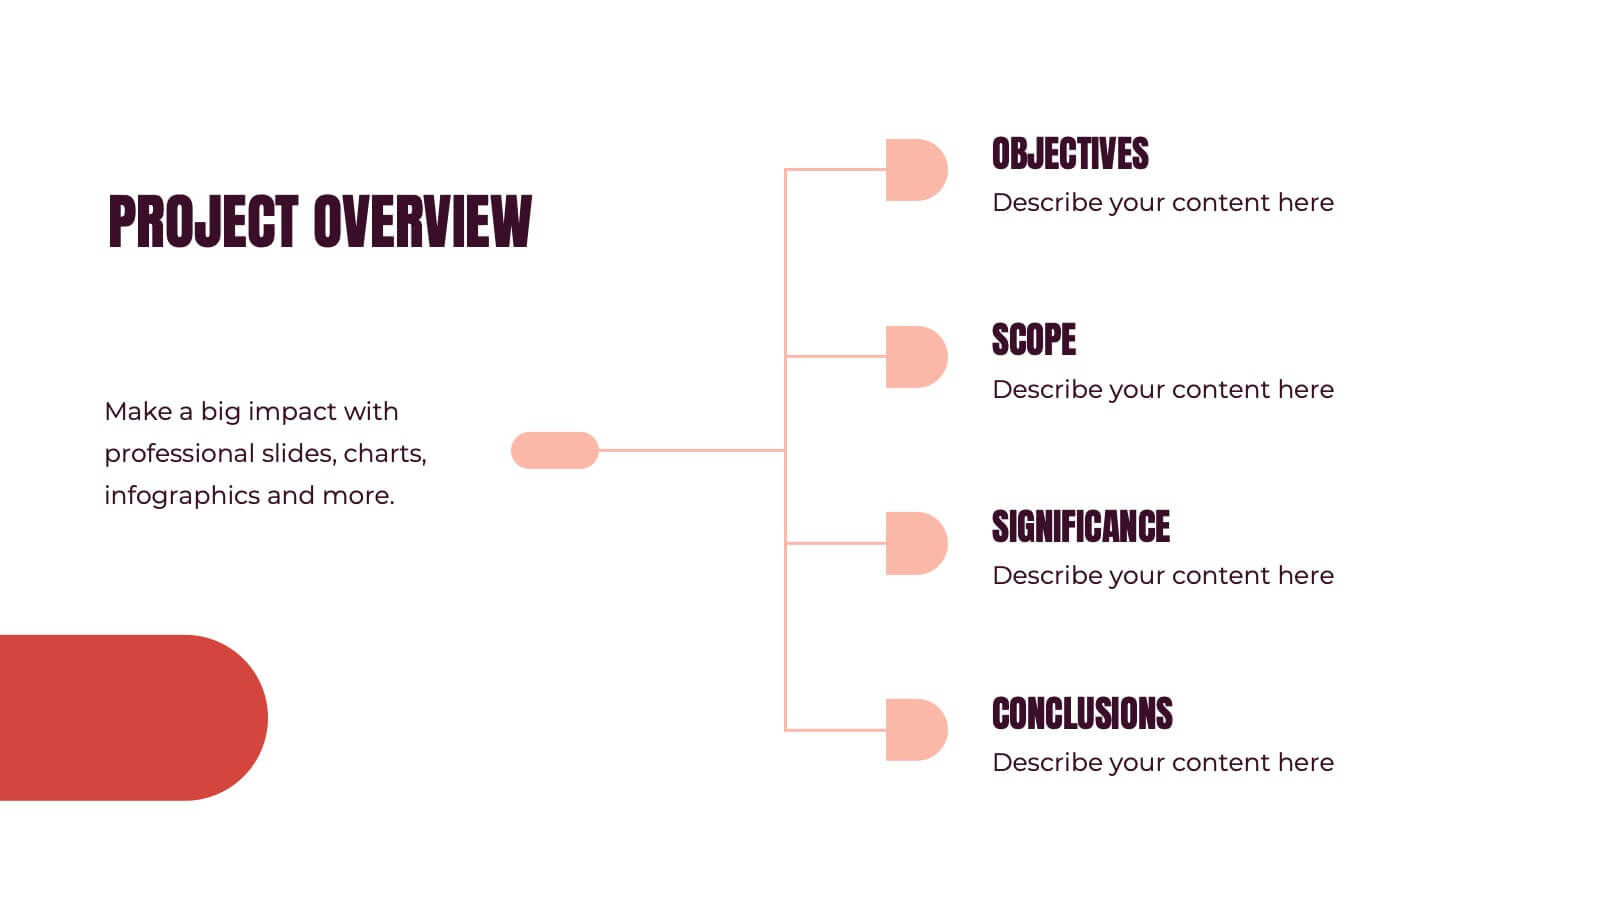
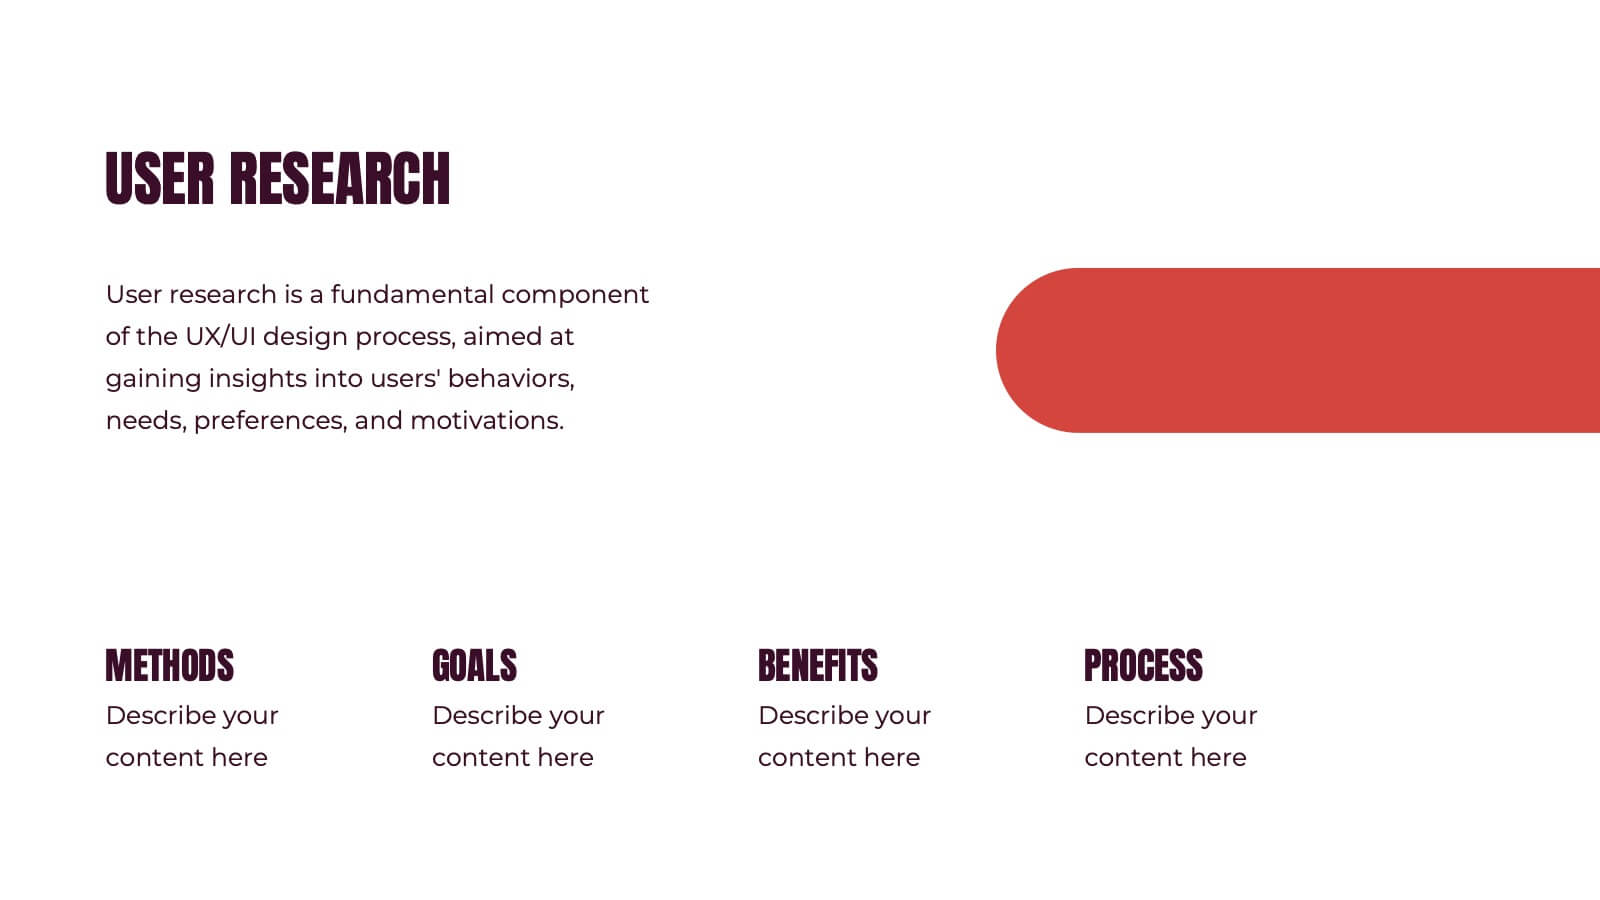
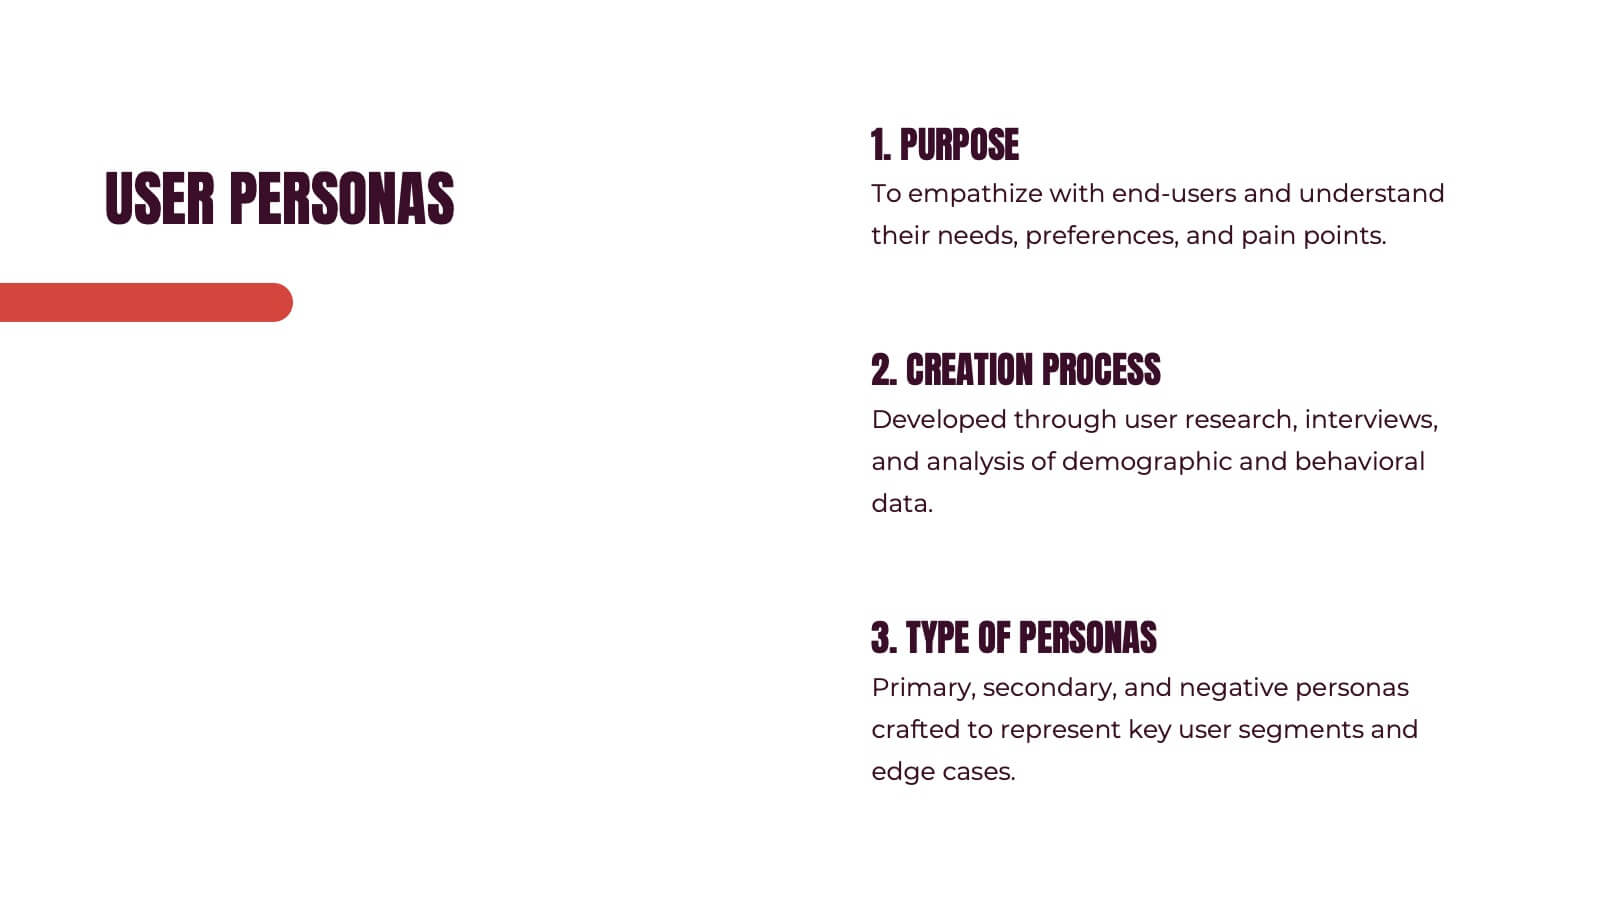
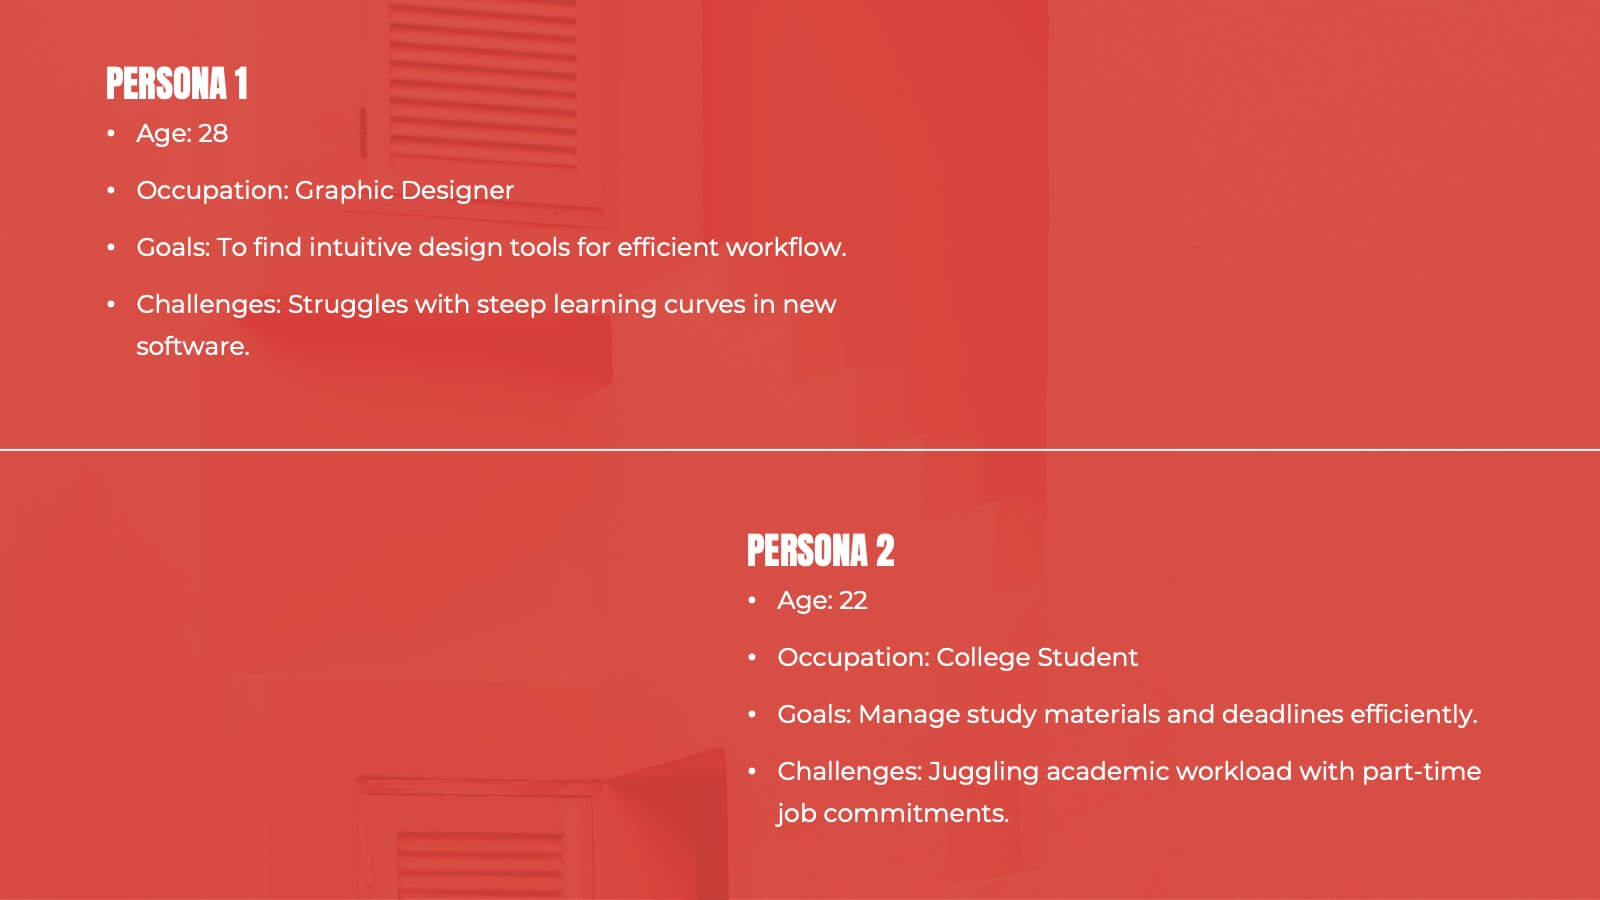
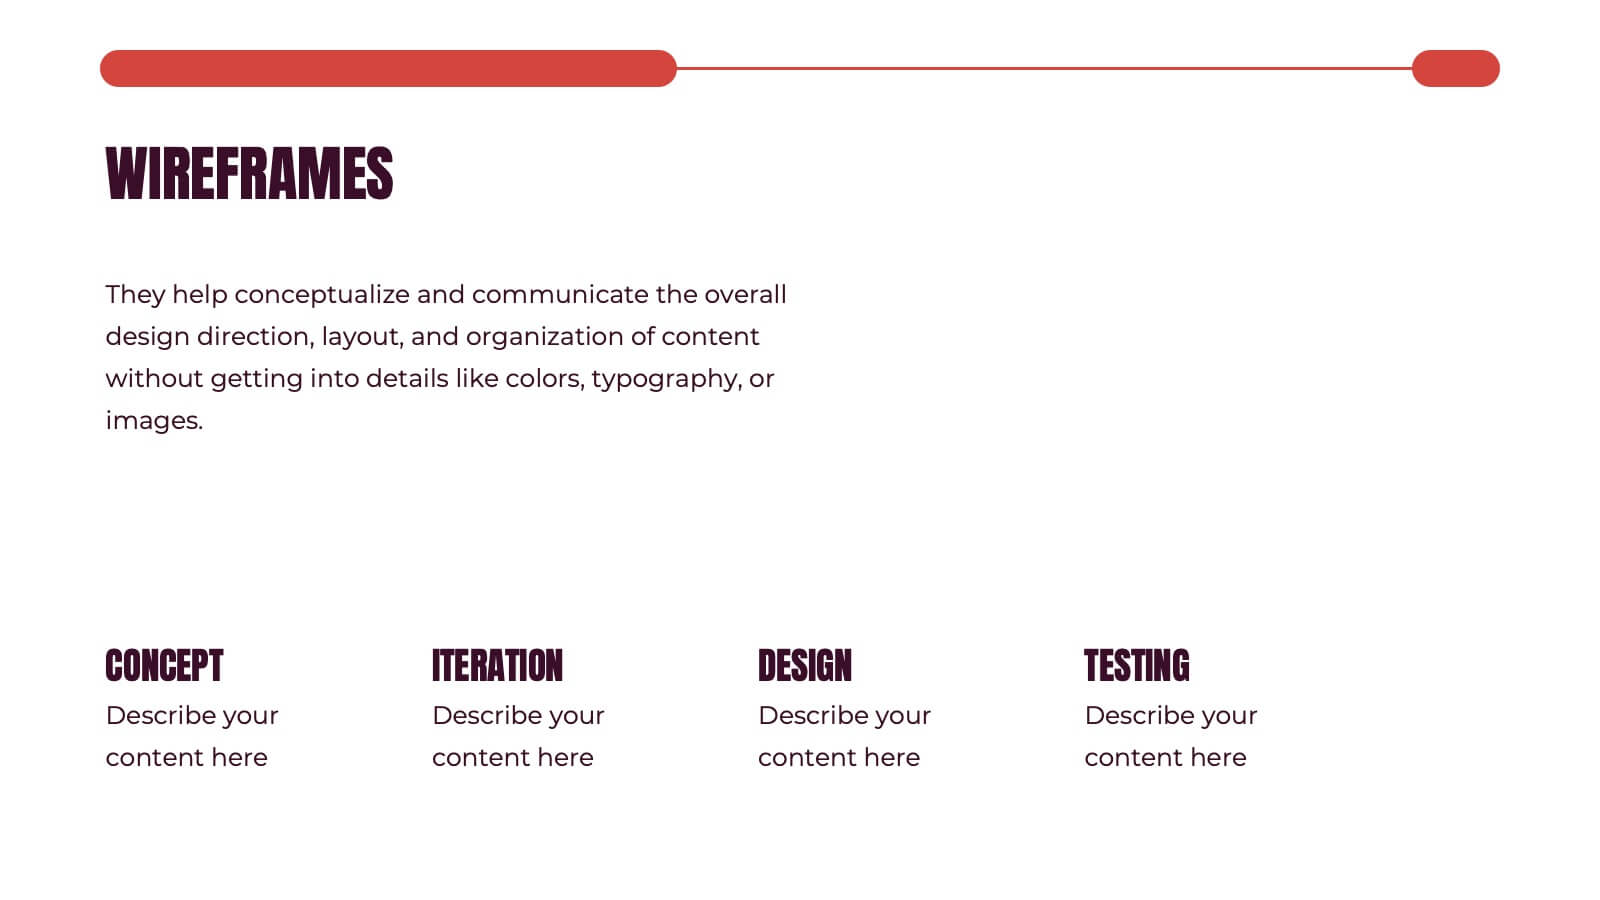
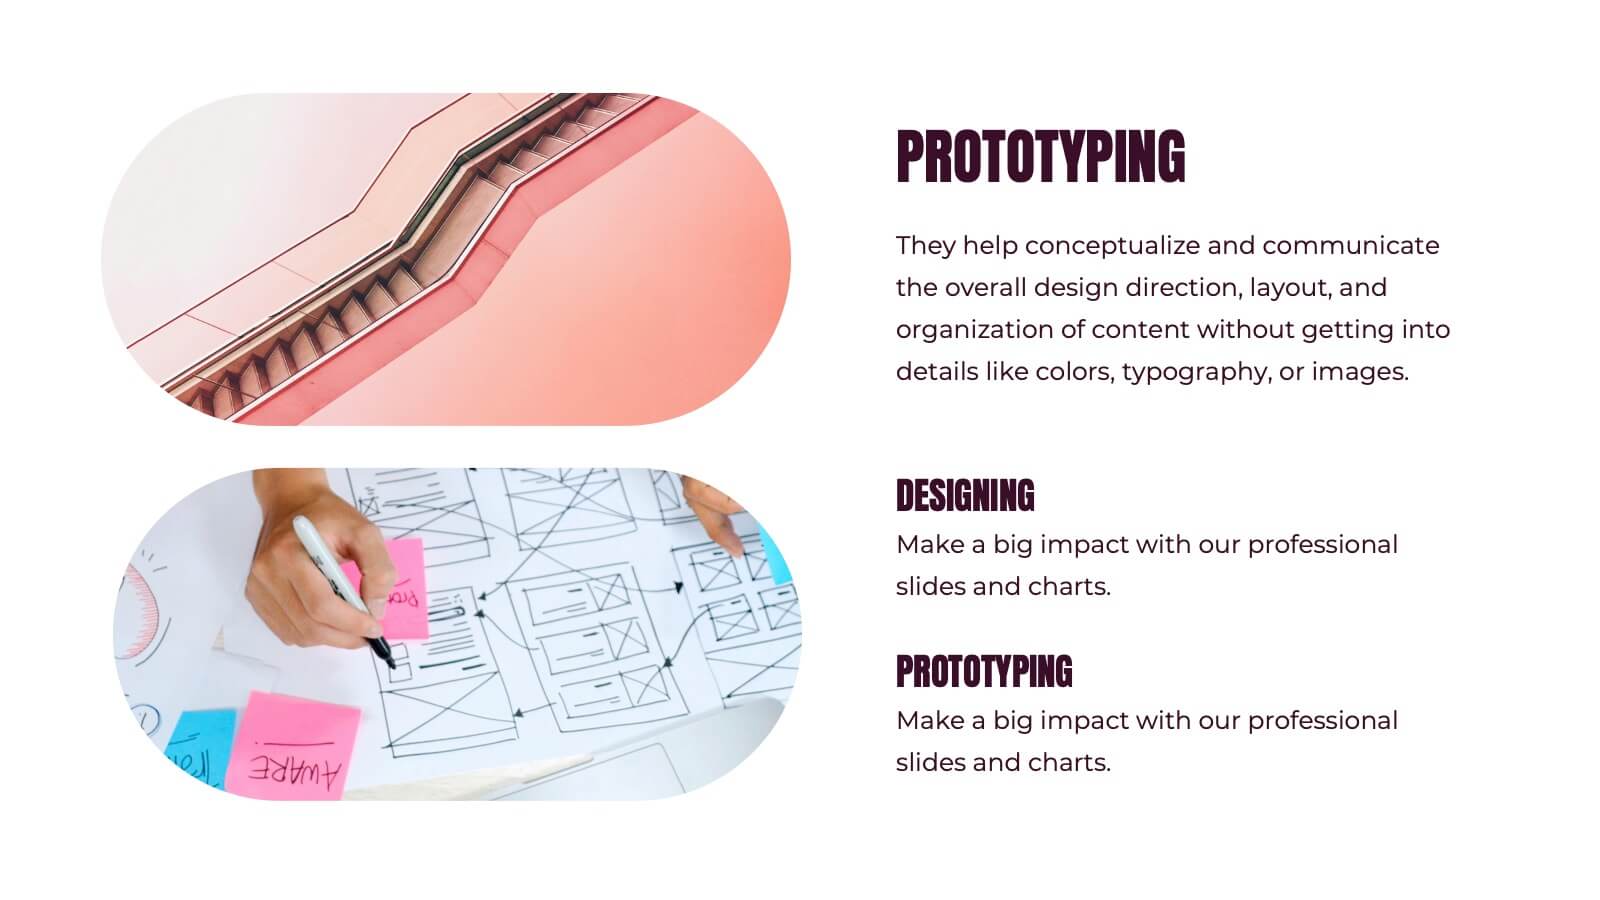
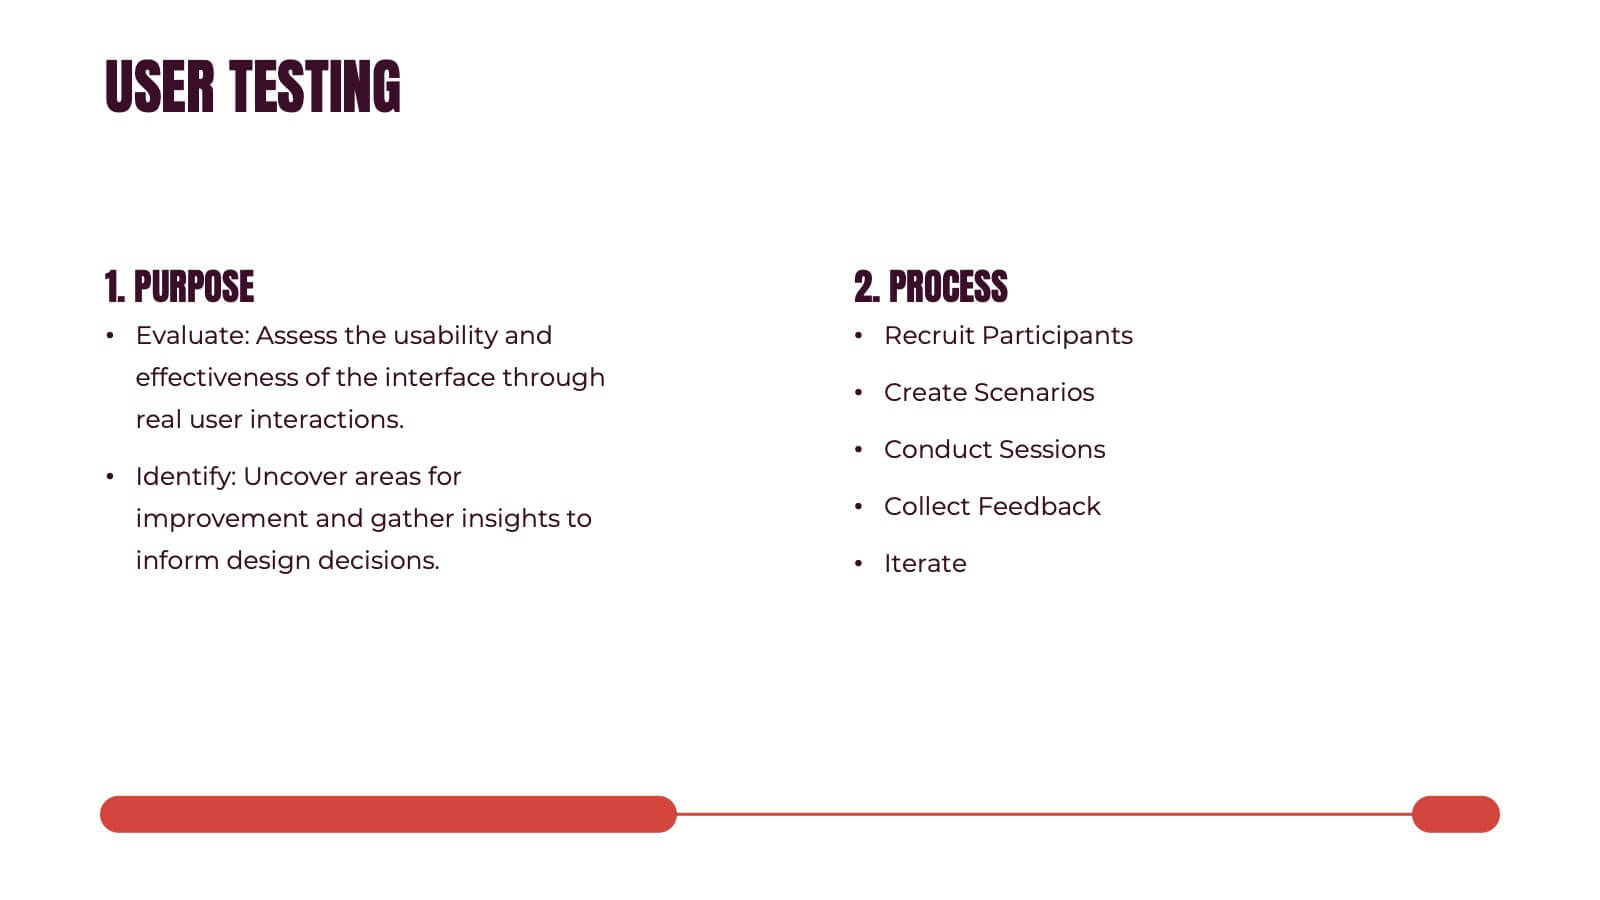
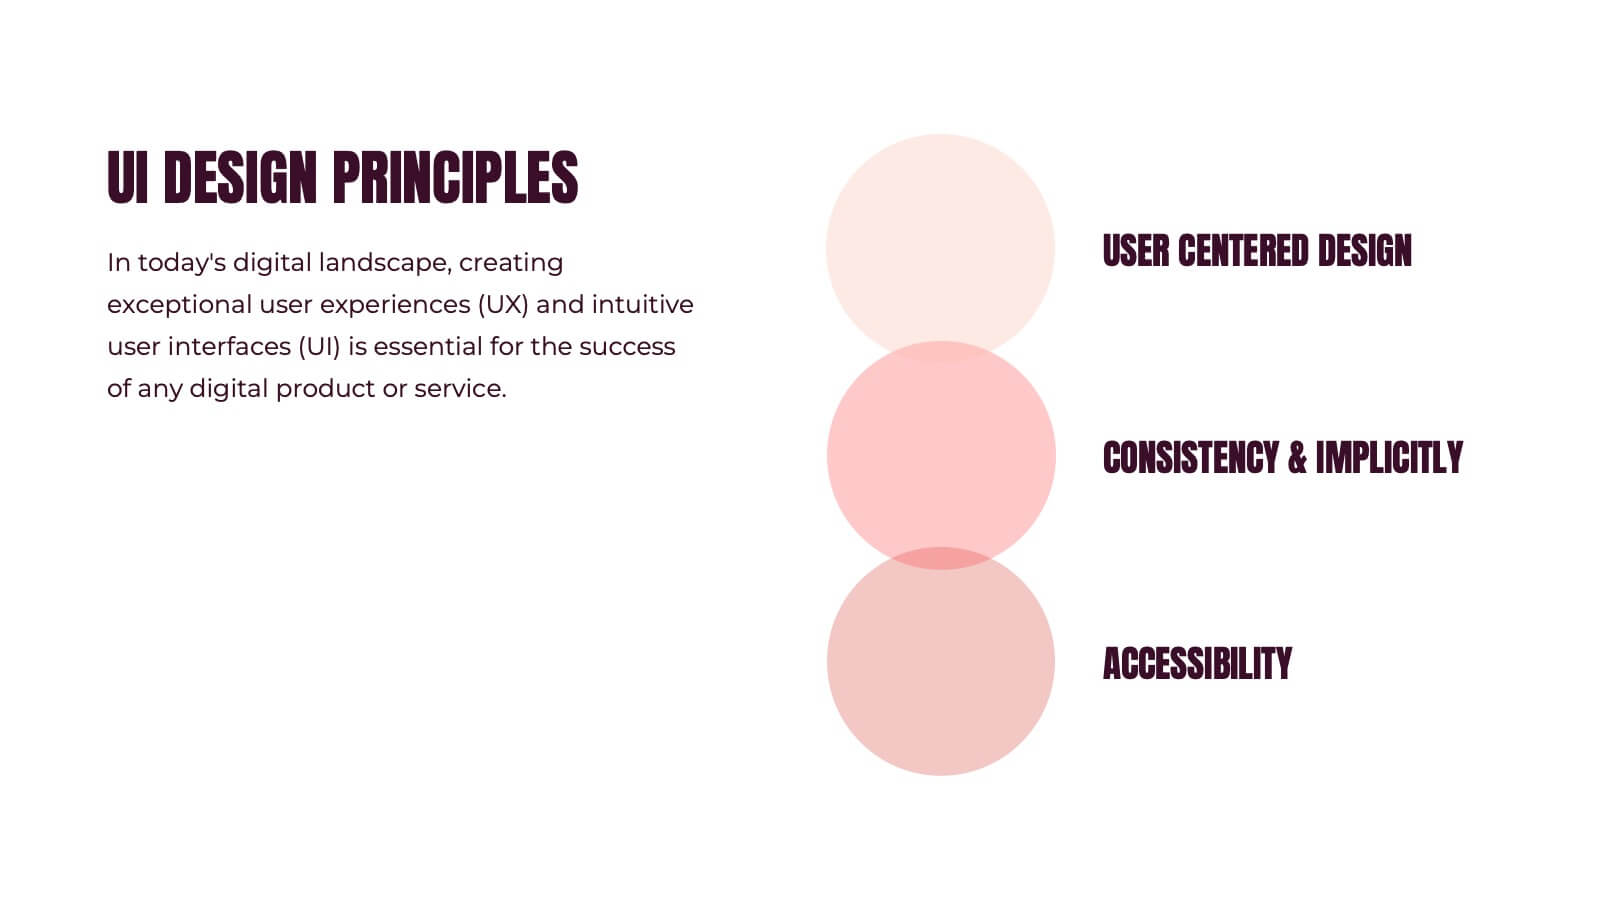
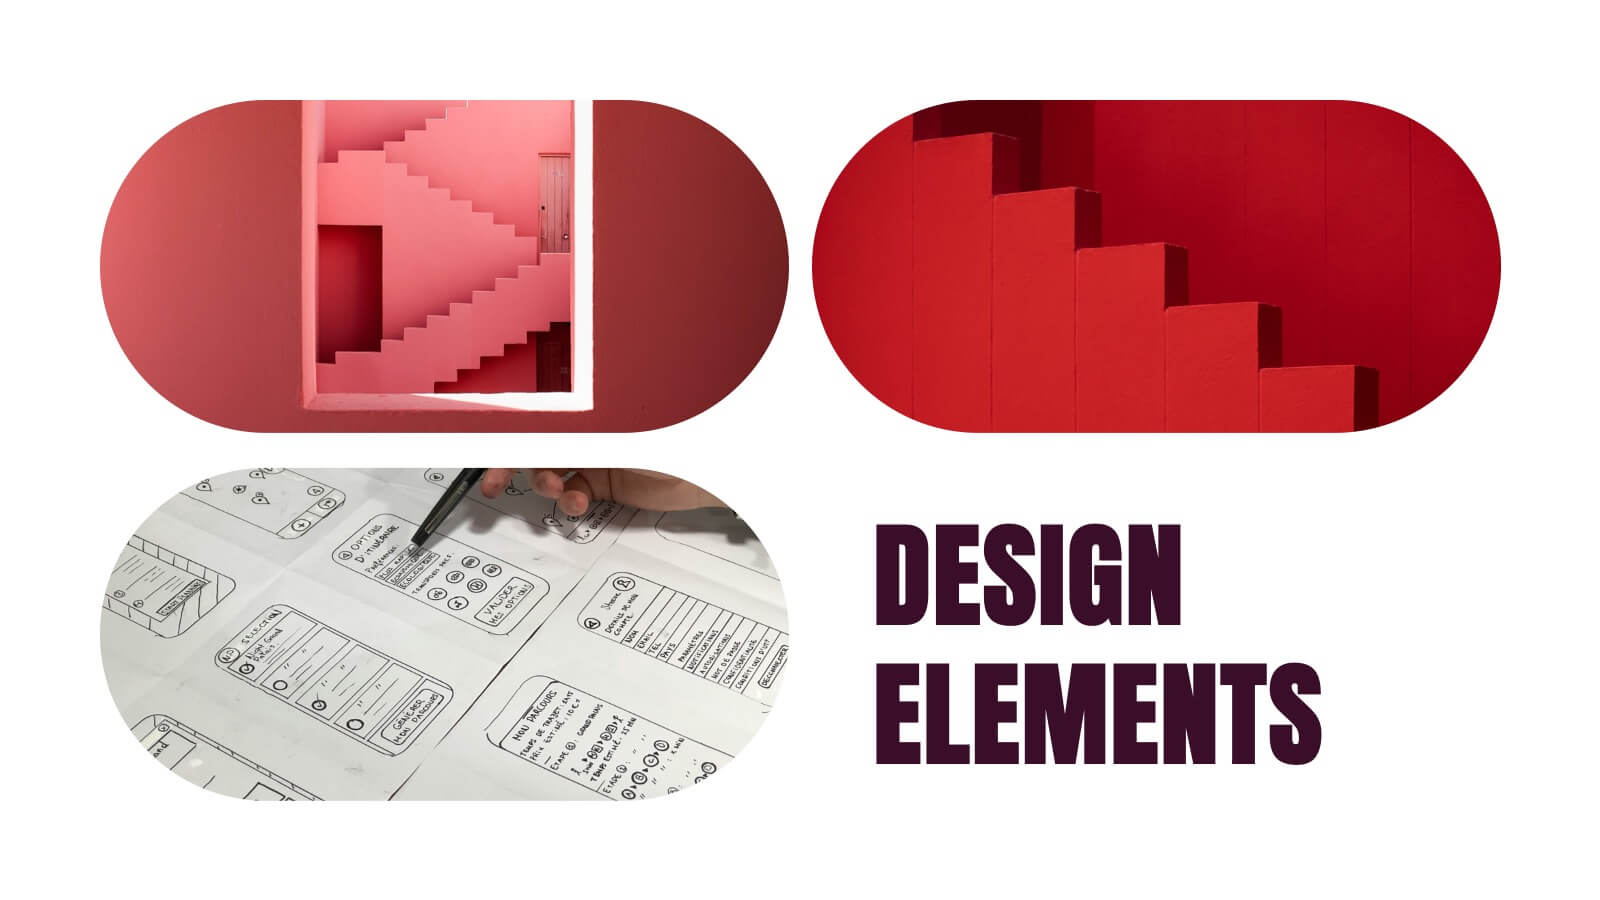
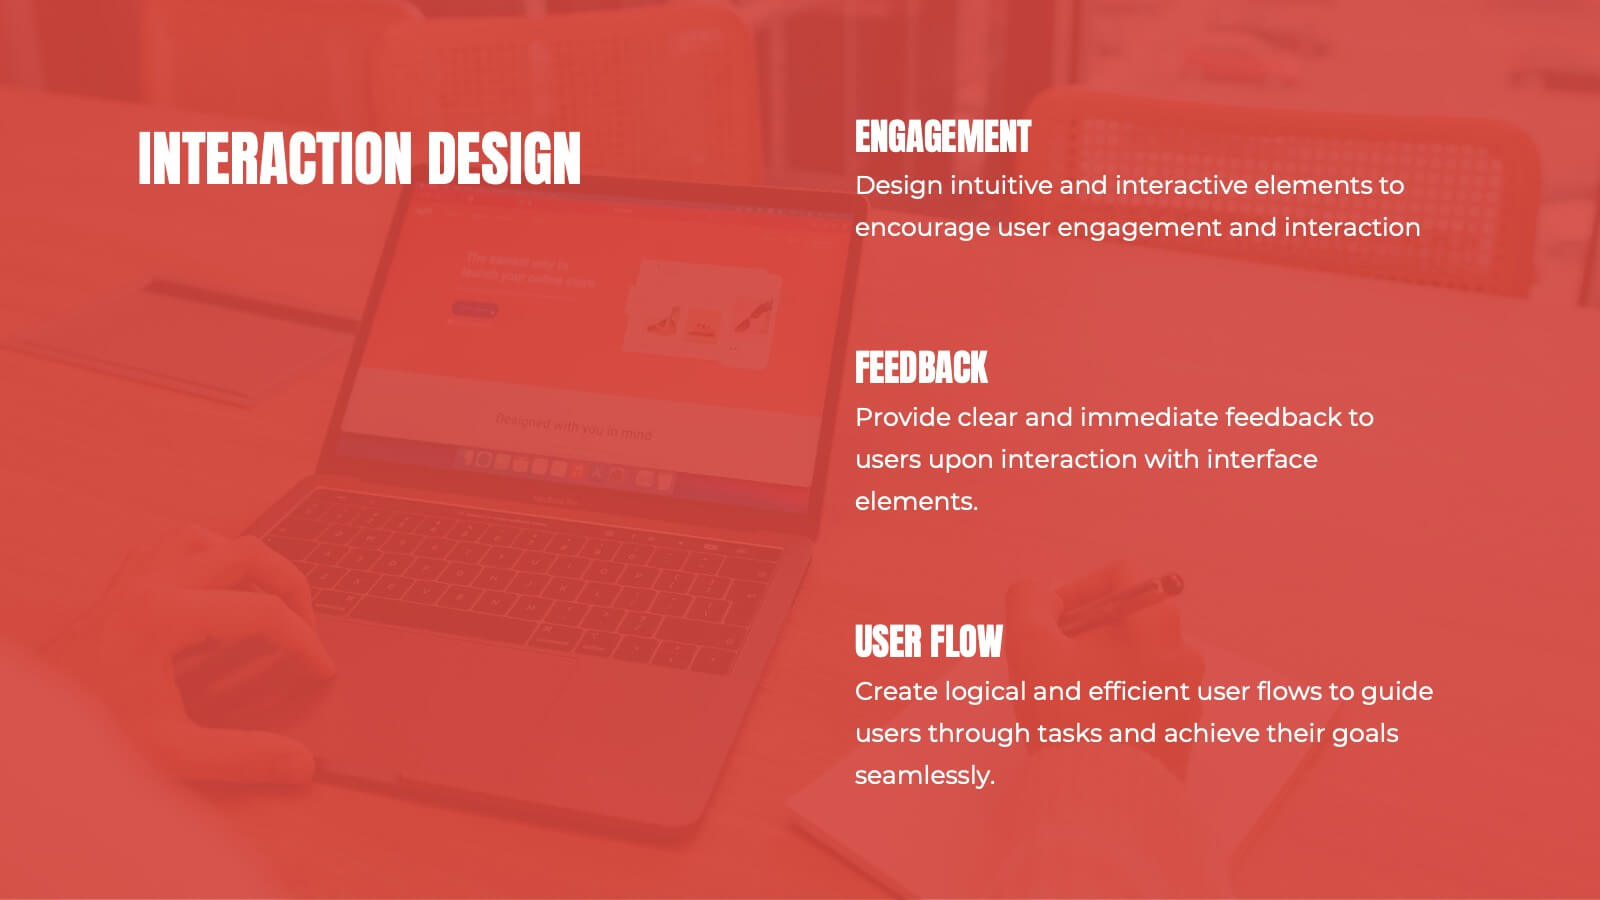
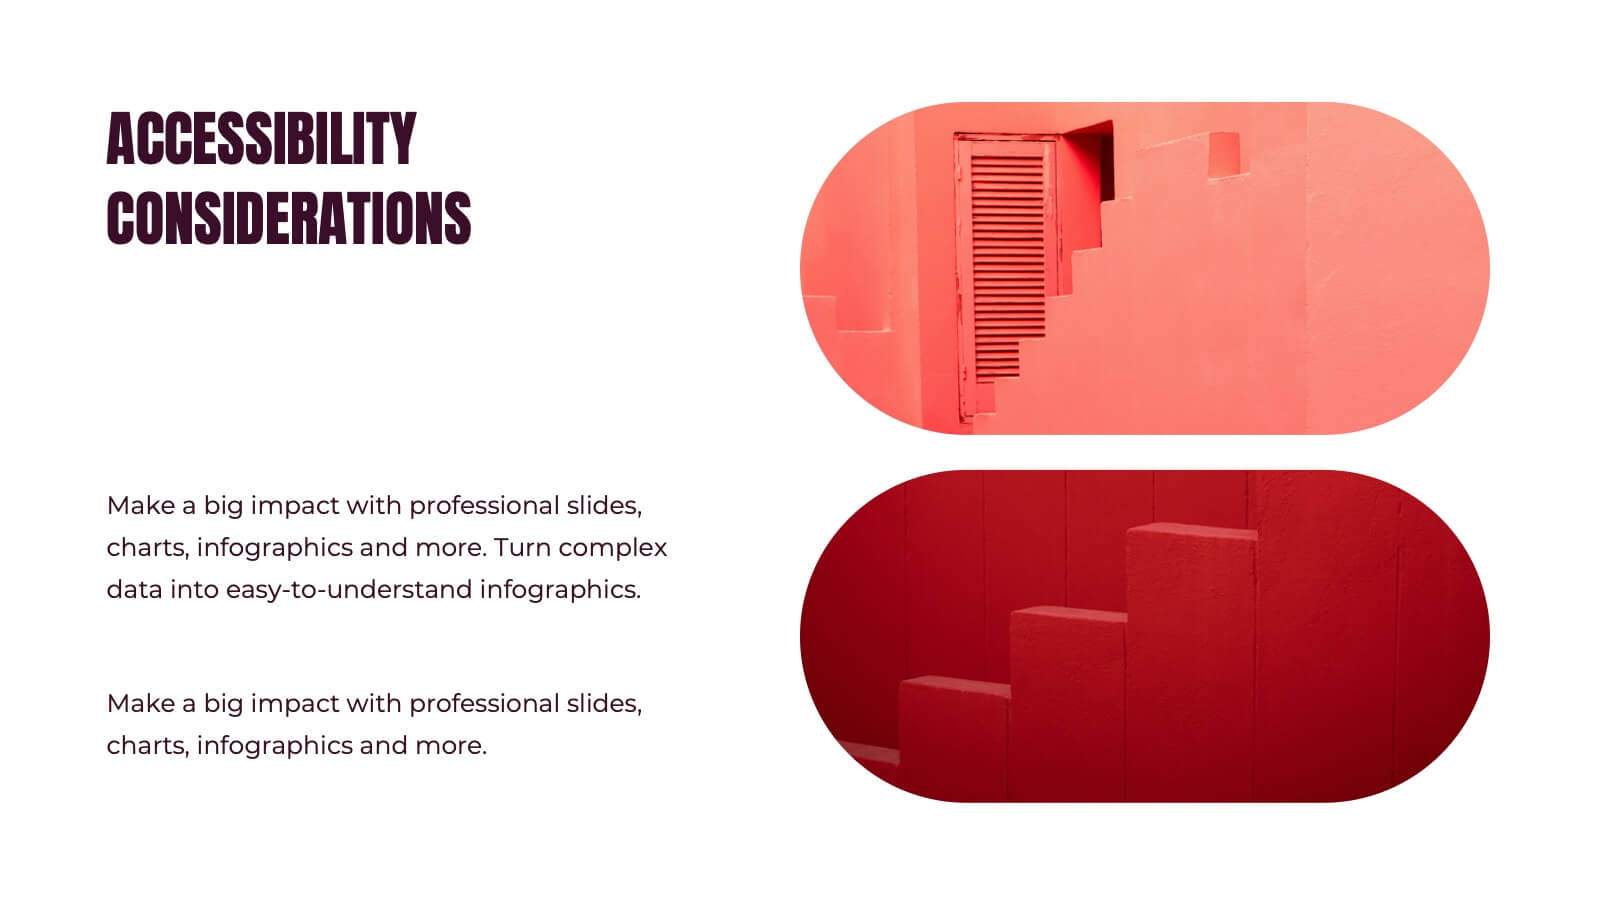
Kismet UX Design Presentation
Dive into the world of design with this stunning presentation template! Perfect for explaining user experience concepts, this template covers everything from wireframes to prototyping. It's designed to captivate your audience with visually engaging slides and clear, concise information. Compatible with PowerPoint, Keynote, and Google Slides for effortless use across platforms.


21 diapositivas
Starchime UX Case Study Presentation
Showcase your UX design process with this case study template, covering research, user journey mapping, wireframes, and usability testing. Ideal for presenting design insights and outcomes. Compatible with PowerPoint, Keynote, and Google Slides, it’s perfect for a clear, professional, and impactful UX design presentation.


7 diapositivas
Best Loyalty Program Infographic
A loyalty program is a structured marketing strategy designed to encourage customers to continue patronizing a business by offering them rewards, discounts, or other incentives based on their repeat purchases or engagement with the brand. This infographic template is a delightful and visually appealing guide to the world of rewarding loyalty. Dive into this vibrant infographic and discover how to spread happiness among your cherished customers through a top-notch loyalty program. Compatible with Powerpoint, Keynote, and Google Slides. Celebrate loyalty and reward your customers in the most delightful way.


6 diapositivas
Science Project Infographic
Science projects are hands-on activities designed to explore and investigate scientific concepts. This infographic template aims to communicate complex scientific information in a visually appealing and easy-to-understand manner. The infographic provides an overview of the project's key elements, including the question, hypothesis, materials, procedure, results, and conclusion. This serves as a creative and engaging guide to help students choose and plan their science projects for school science fairs or independent research. The infographic uses visuals, illustrations, and icons to enhance understanding and engagement.


12 diapositivas
Tourism Trends and Destination Analytics Presentation
Visualize travel patterns and insights effortlessly with this Tourism Trends and Destination Analytics Presentation. Featuring a suitcase-themed layout with icon blocks, this template is ideal for travel analysts, tourism boards, and destination marketers. Use it to highlight travel behaviors, key locations, or seasonal preferences. Fully customizable in PowerPoint, Keynote, and Google Slides.