


Características


¿Tienes alguna pregunta?
Recomendar


5 diapositivas
Water Problems Infographics
Water Problems refer to the various issues that arise due to the scarcity, pollution, or mismanagement of water resources. These vertical infographics are perfect for addressing various issues related to water management and conservation. They are effective tools for raising awareness about water-related issues and promoting sustainable water management practices. This template is completely customizable and includes various icons and images related to water such as water droplets, faucets, and ocean waves. The color scheme is predominantly blue, signifying the importance of water conservation and preservation.


21 diapositivas
Riverlyn Artist Portfolio Template Presentation
Showcase your creative journey with this dynamic portfolio template, crafted for artists and creators seeking to captivate their audience. Highlight your philosophy, style, and key projects with a visually engaging design that reflects your artistic identity. Share your creative process and collaborations to provide deeper insights into your work. This template includes sections for client testimonials, services offered, and pricing details, making it an excellent choice for both professional presentations and personal branding. Fully customizable and compatible with PowerPoint, Google Slides, and Keynote, it offers seamless adaptability to meet your unique needs. Ideal for artists aiming to leave a lasting impression!


4 diapositivas
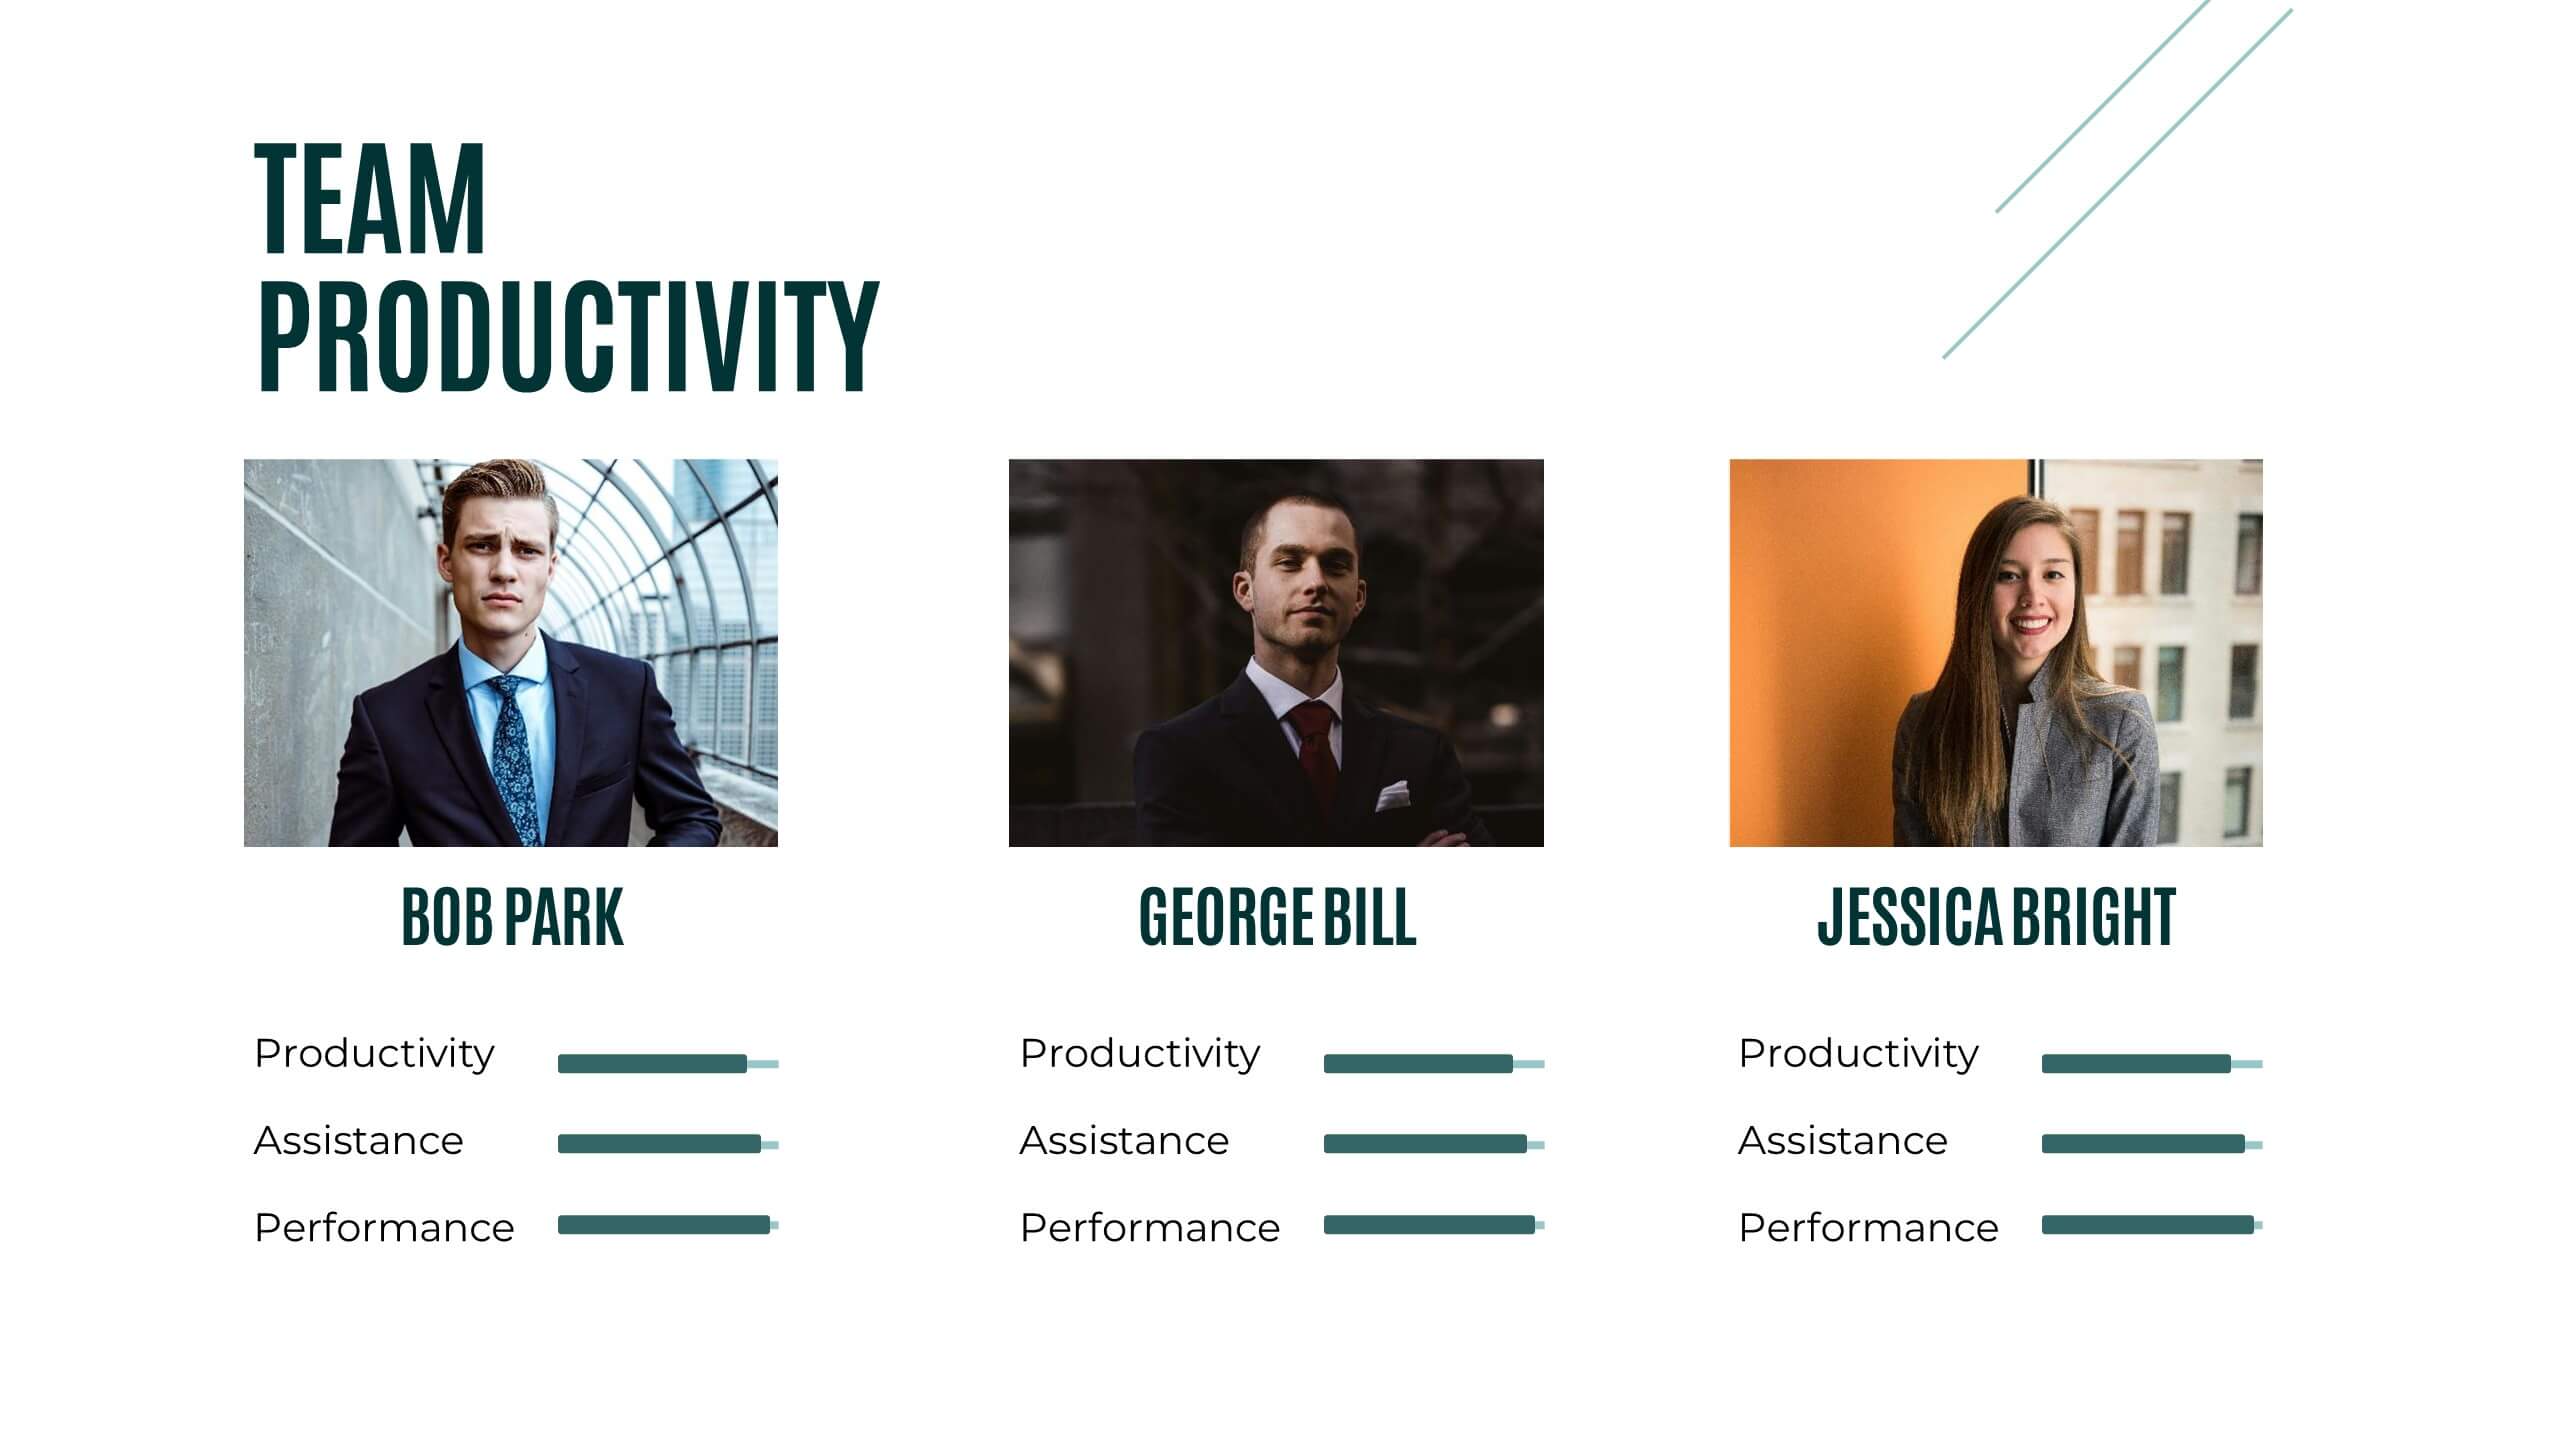
Professional Team Profiles and Roles Presentation
Showcase your team with impact using the Professional Team Profiles and Roles Presentation. Ideal for company introductions, this slide highlights key members with photo, name, title, and a brief role description. Clean, modern layout makes it easy to customize in PowerPoint, Canva, or Google Slides to match your brand.


5 diapositivas
Yoga Poses Infographics
Yoga Poses, also known as asanas, are physical postures practiced in the discipline of yoga. They are designed to promote strength, flexibility, balance, and mindfulness. These infographic templates focuses on illustrating various yoga poses and their benefits. It is designed to help individuals understand and practice different yoga poses effectively. This template features beautifully designed infographics with icons and illustrations that showcase different yoga poses. These covers a wide range of yoga, including balancing poses, Chakra yoga, standing poses, and yoga for pregnancy.


7 diapositivas
Innovation Infographics Presentation Template
Our innovation Infographic template is a trendy and professional way to present innovation to your audience in a way that keeps them engaged. This design features simple yet striking elements which will deliver your message, while the font and color scheme gives you that flexibility to personalize this template to your brand’s identity. We have designed this presentation template to help you create and deliver engaging content for your audience. It is a powerful tool that helps you build interest, generate leads and position yourself as an authority on the subject of innovation.


6 diapositivas
Strategic Planning with PESTEL Presentation
Dive into comprehensive environmental scanning with our "Strategic Planning with PESTEL" presentation template. This layout meticulously breaks down Political, Economic, Social, Technological, Environmental, and Legal factors, enabling thorough market analysis and strategy formulation. Perfect for strategists and analysts, the template supports PowerPoint, Keynote, and Google Slides, facilitating a dynamic and engaging planning session.


22 diapositivas
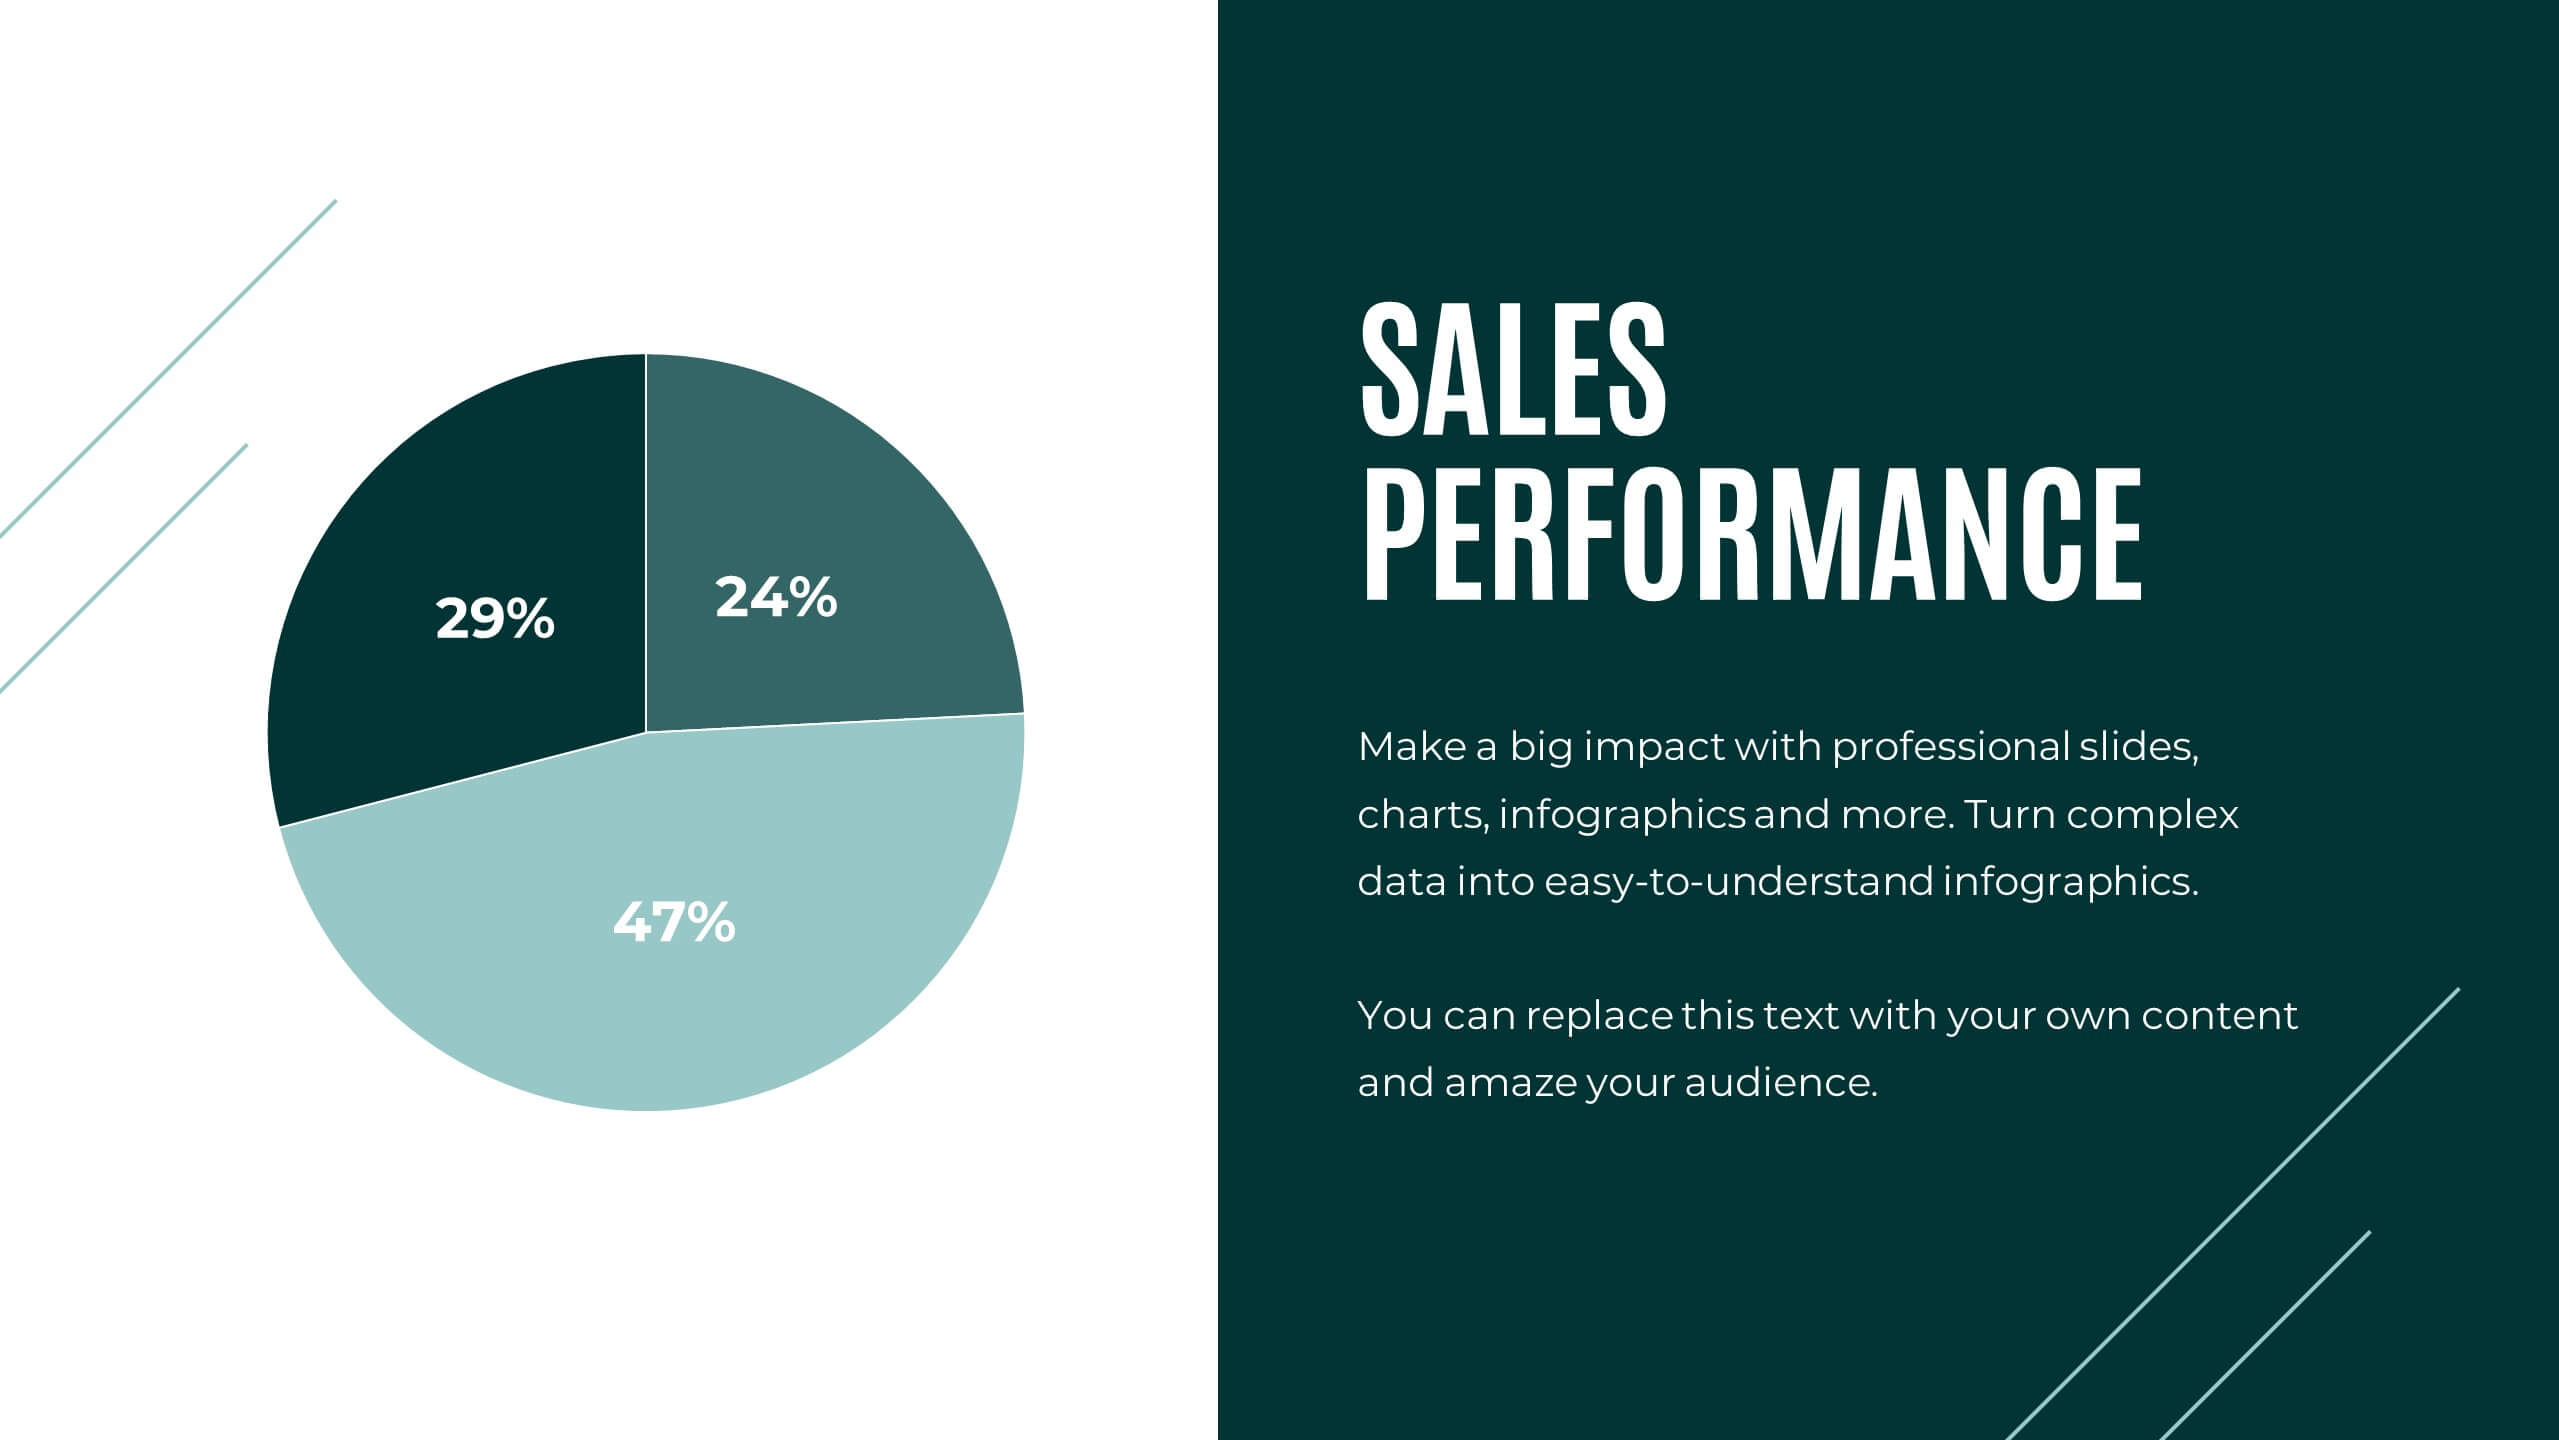
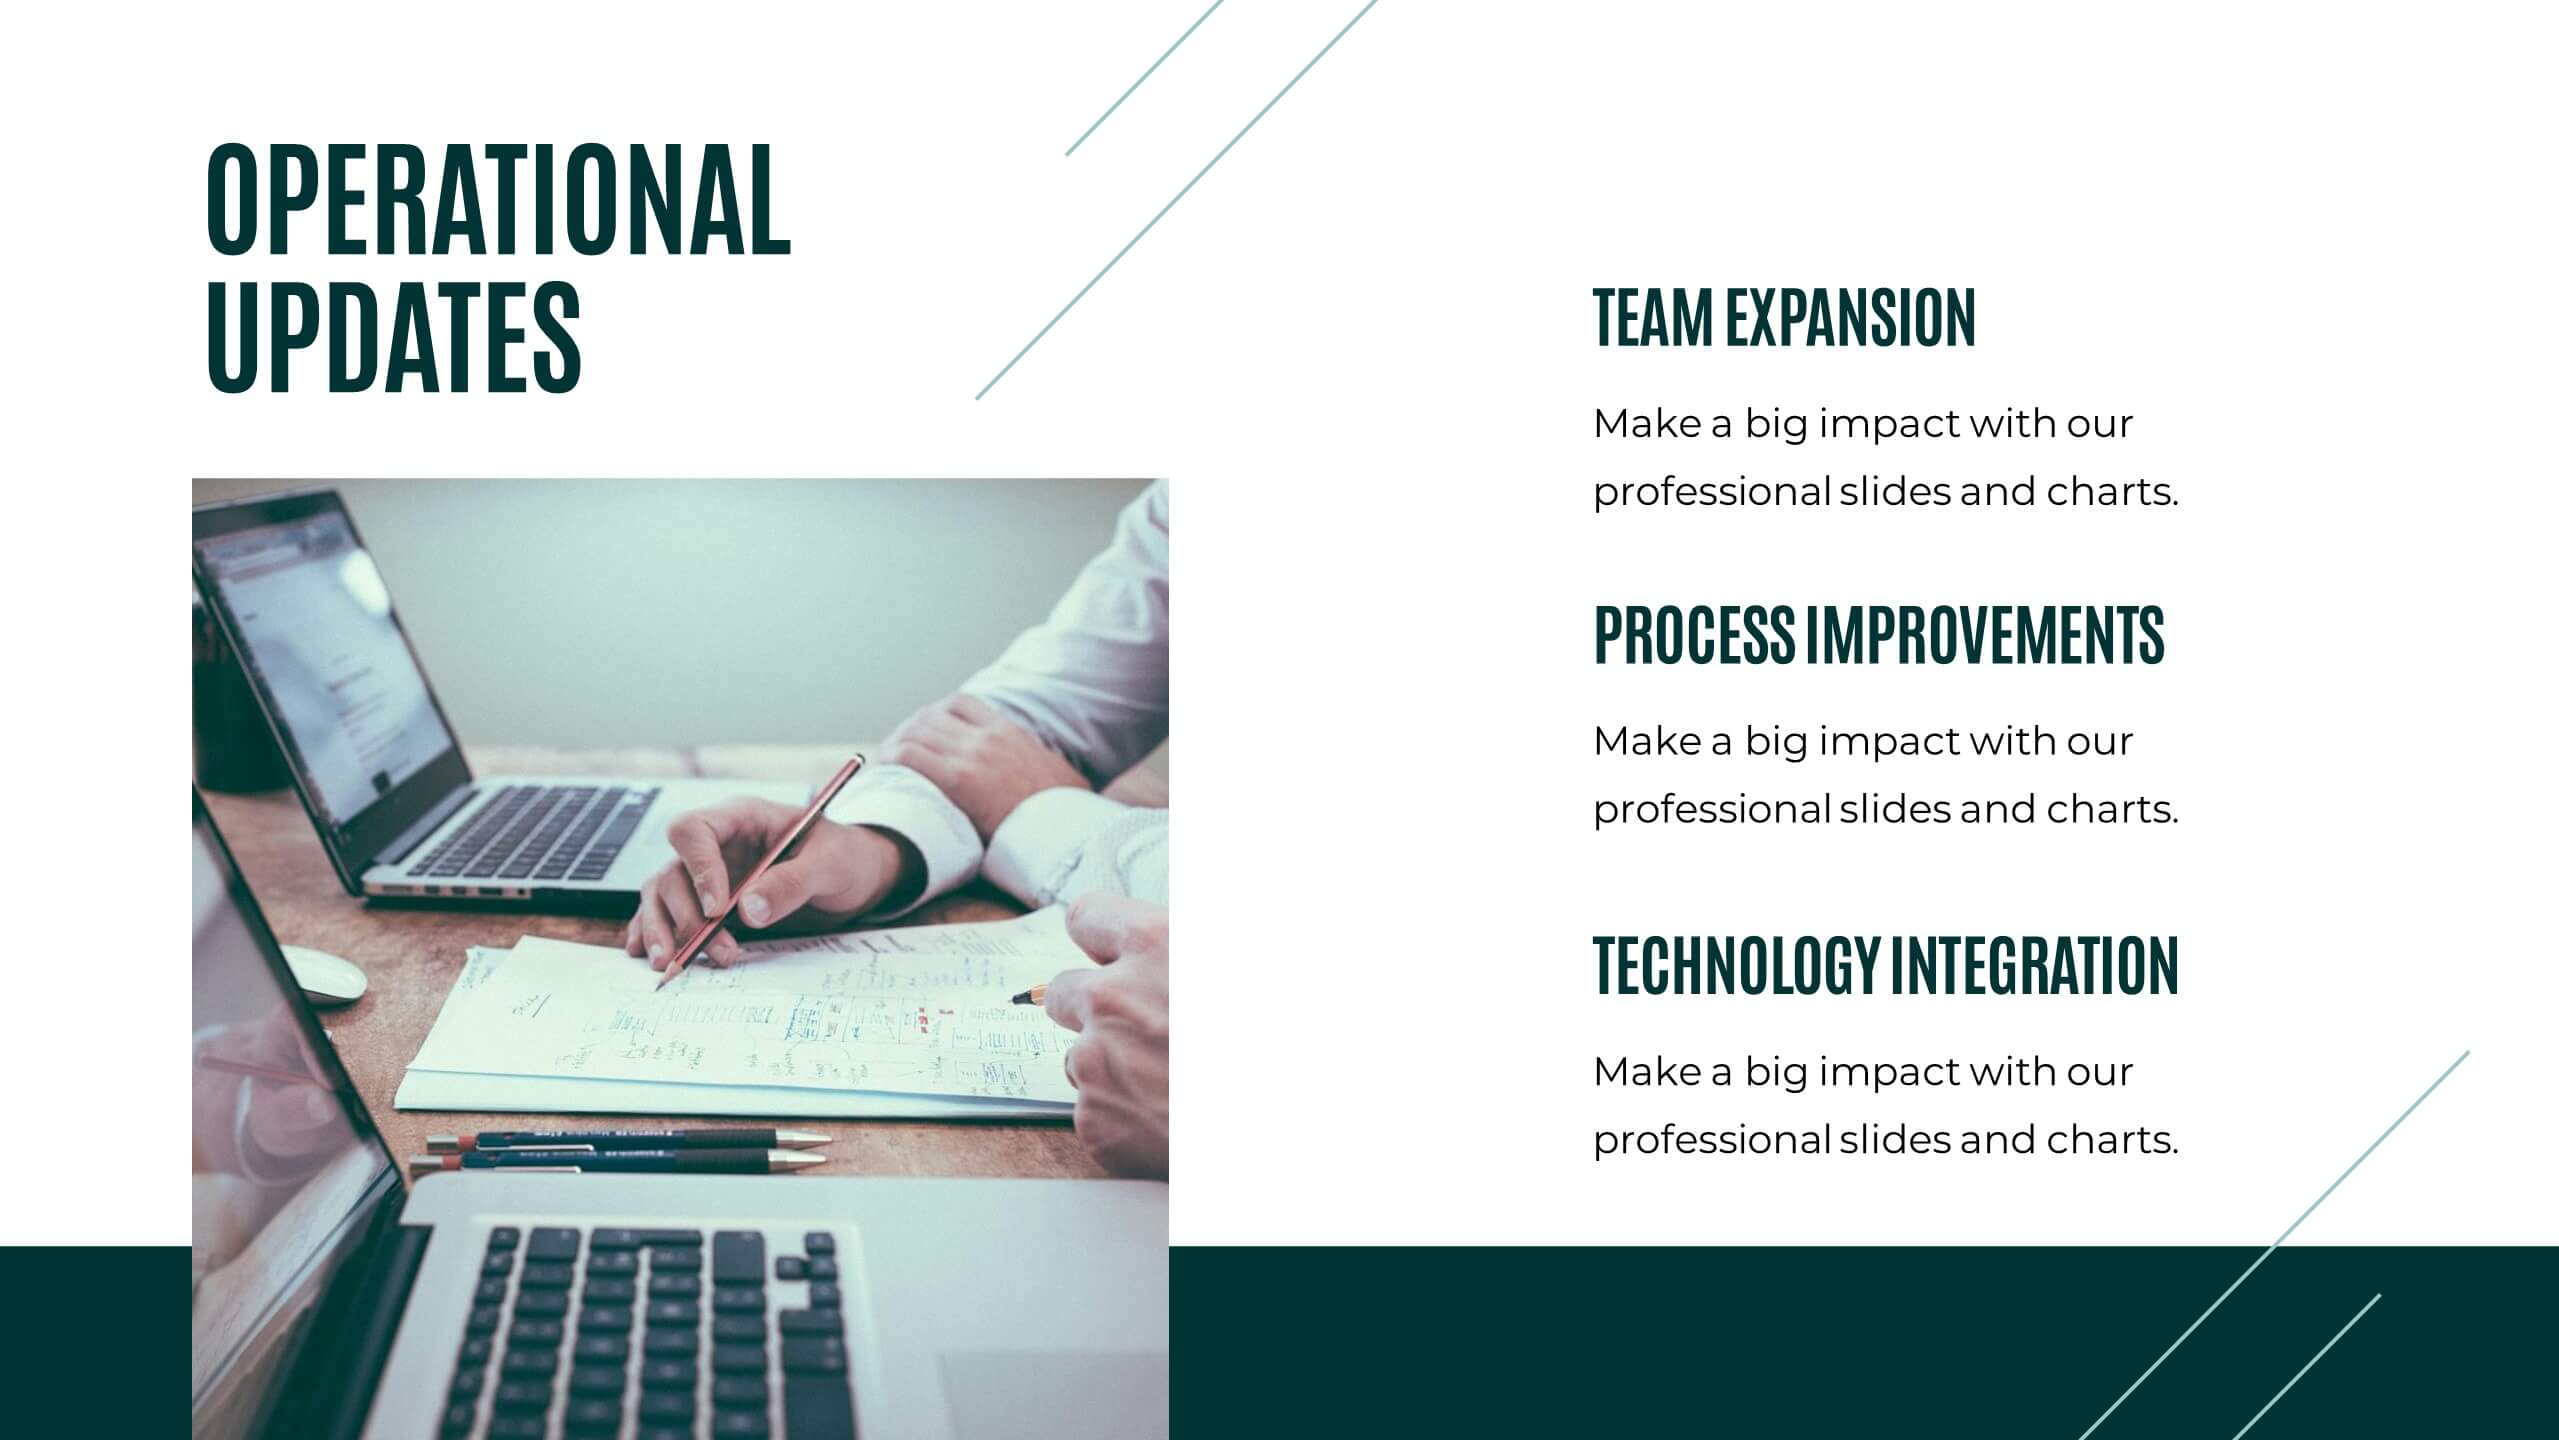
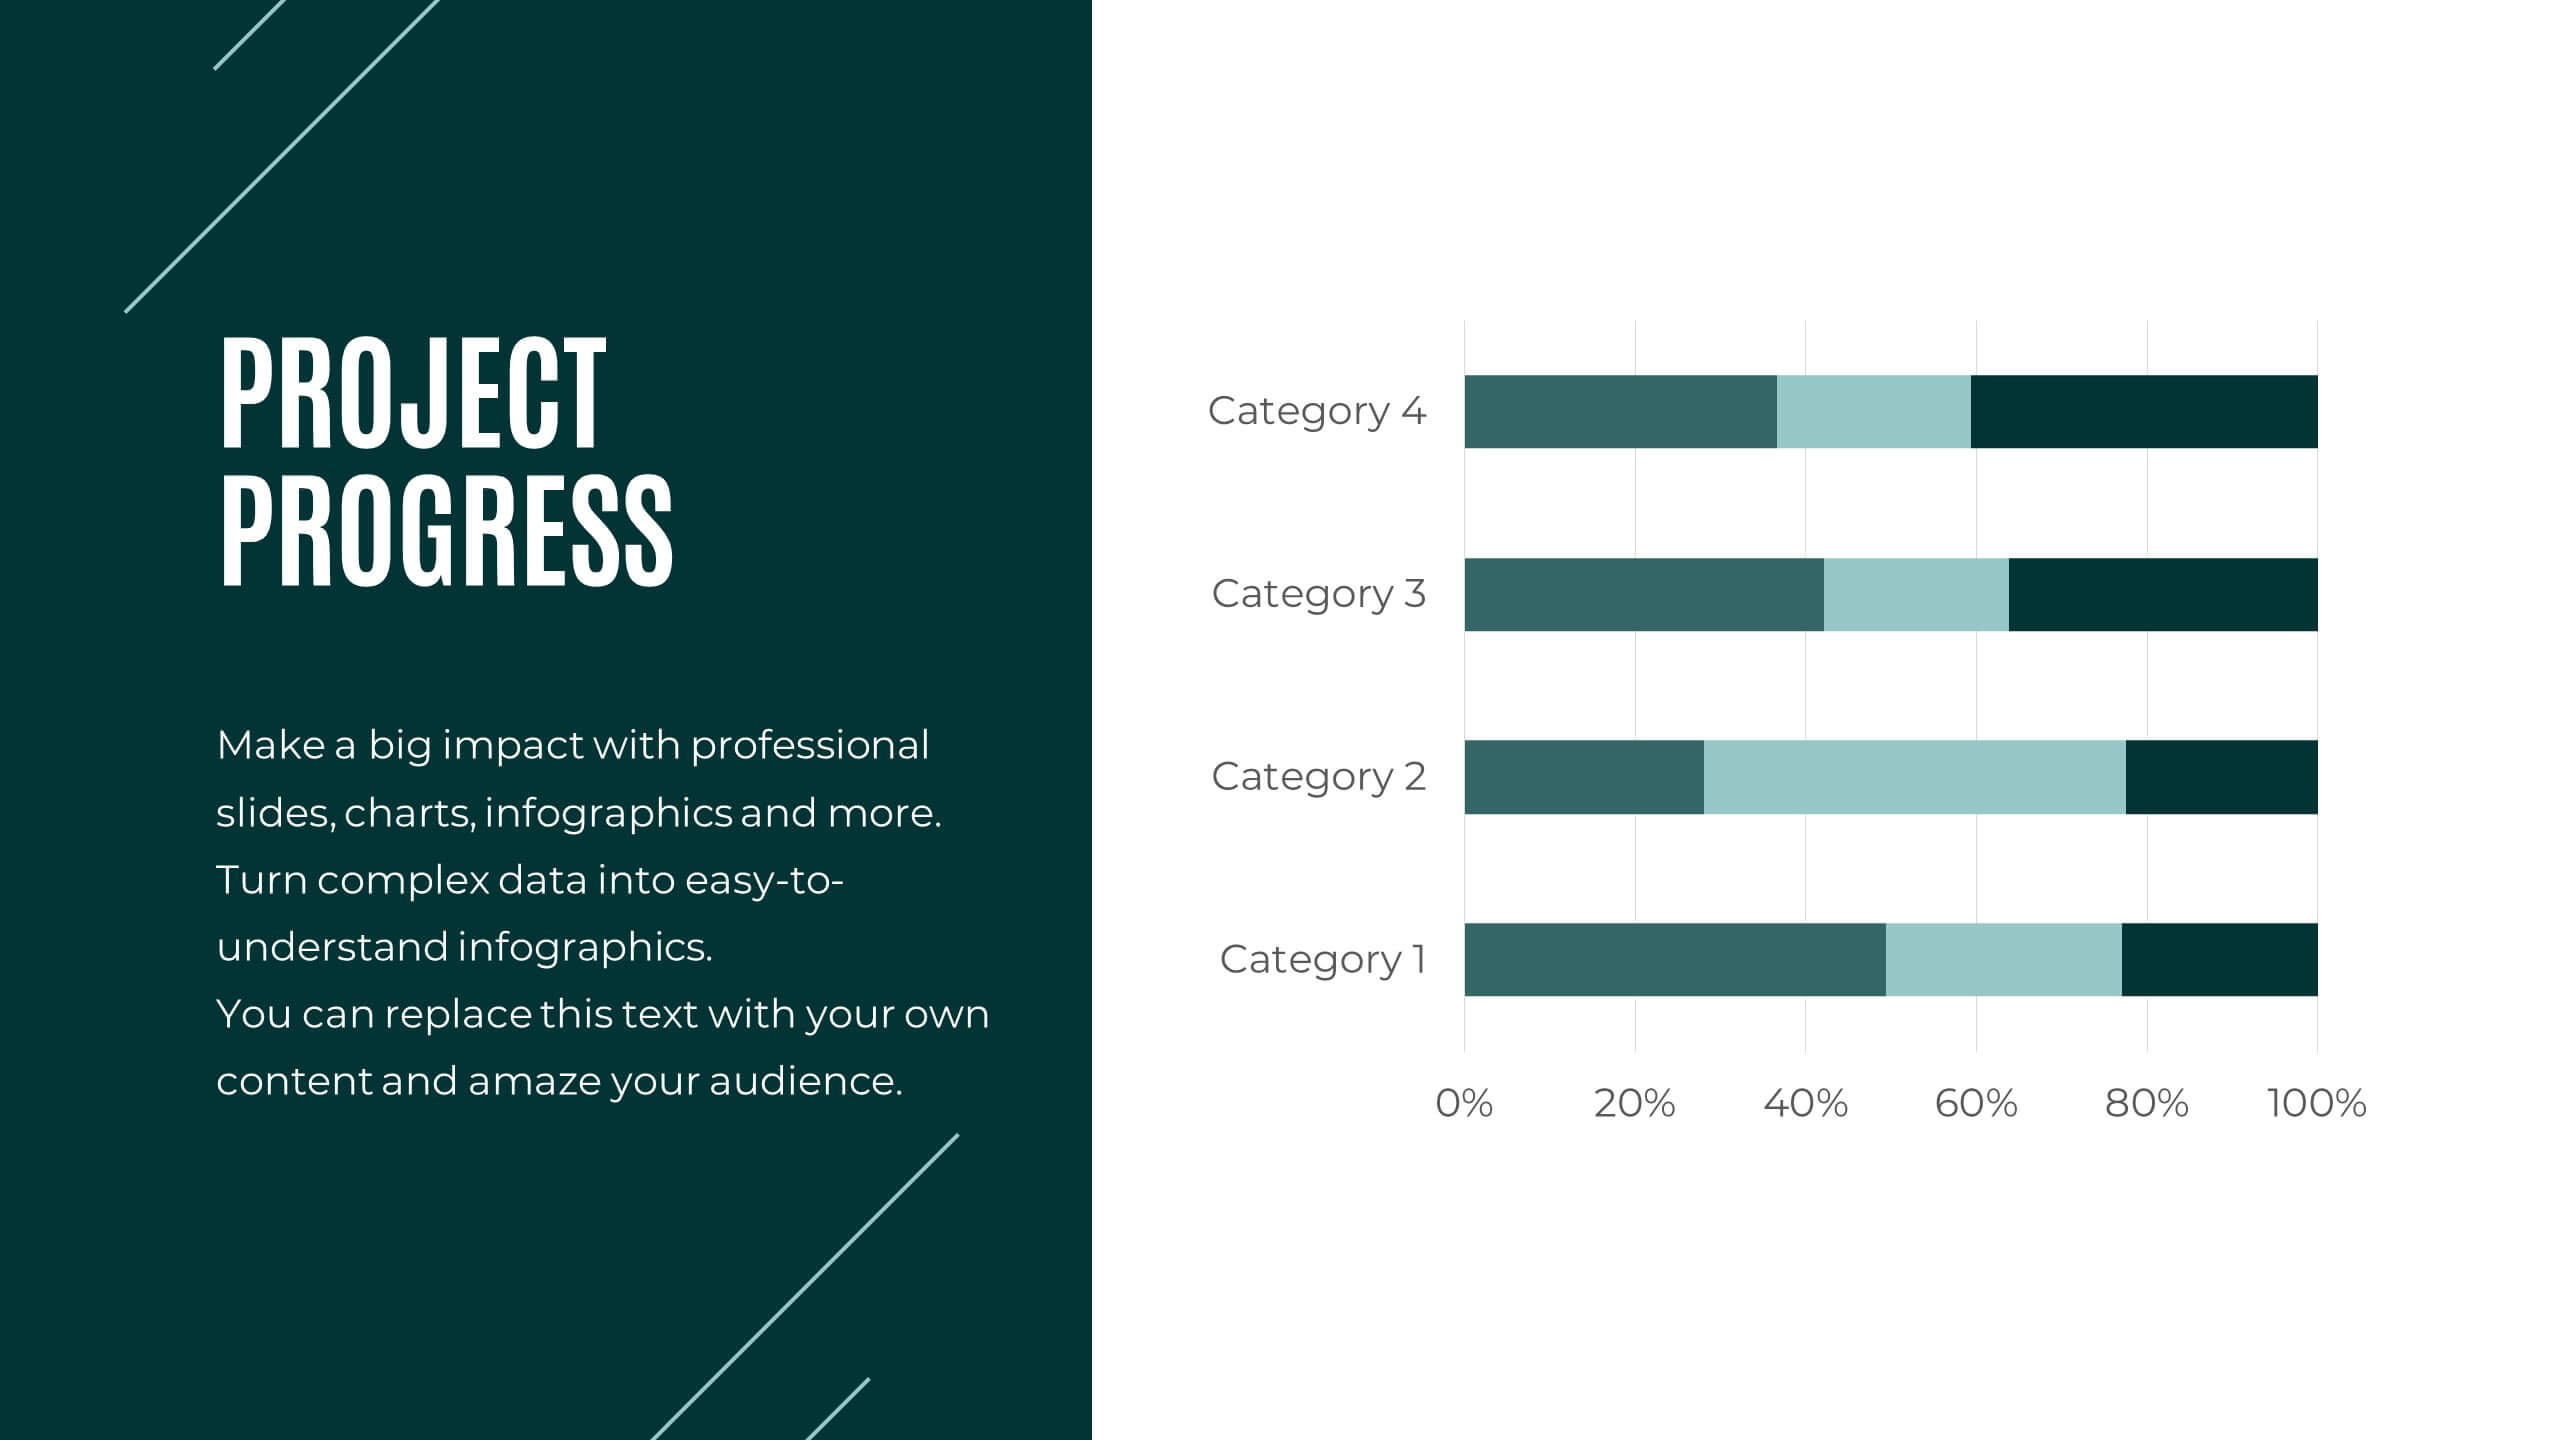
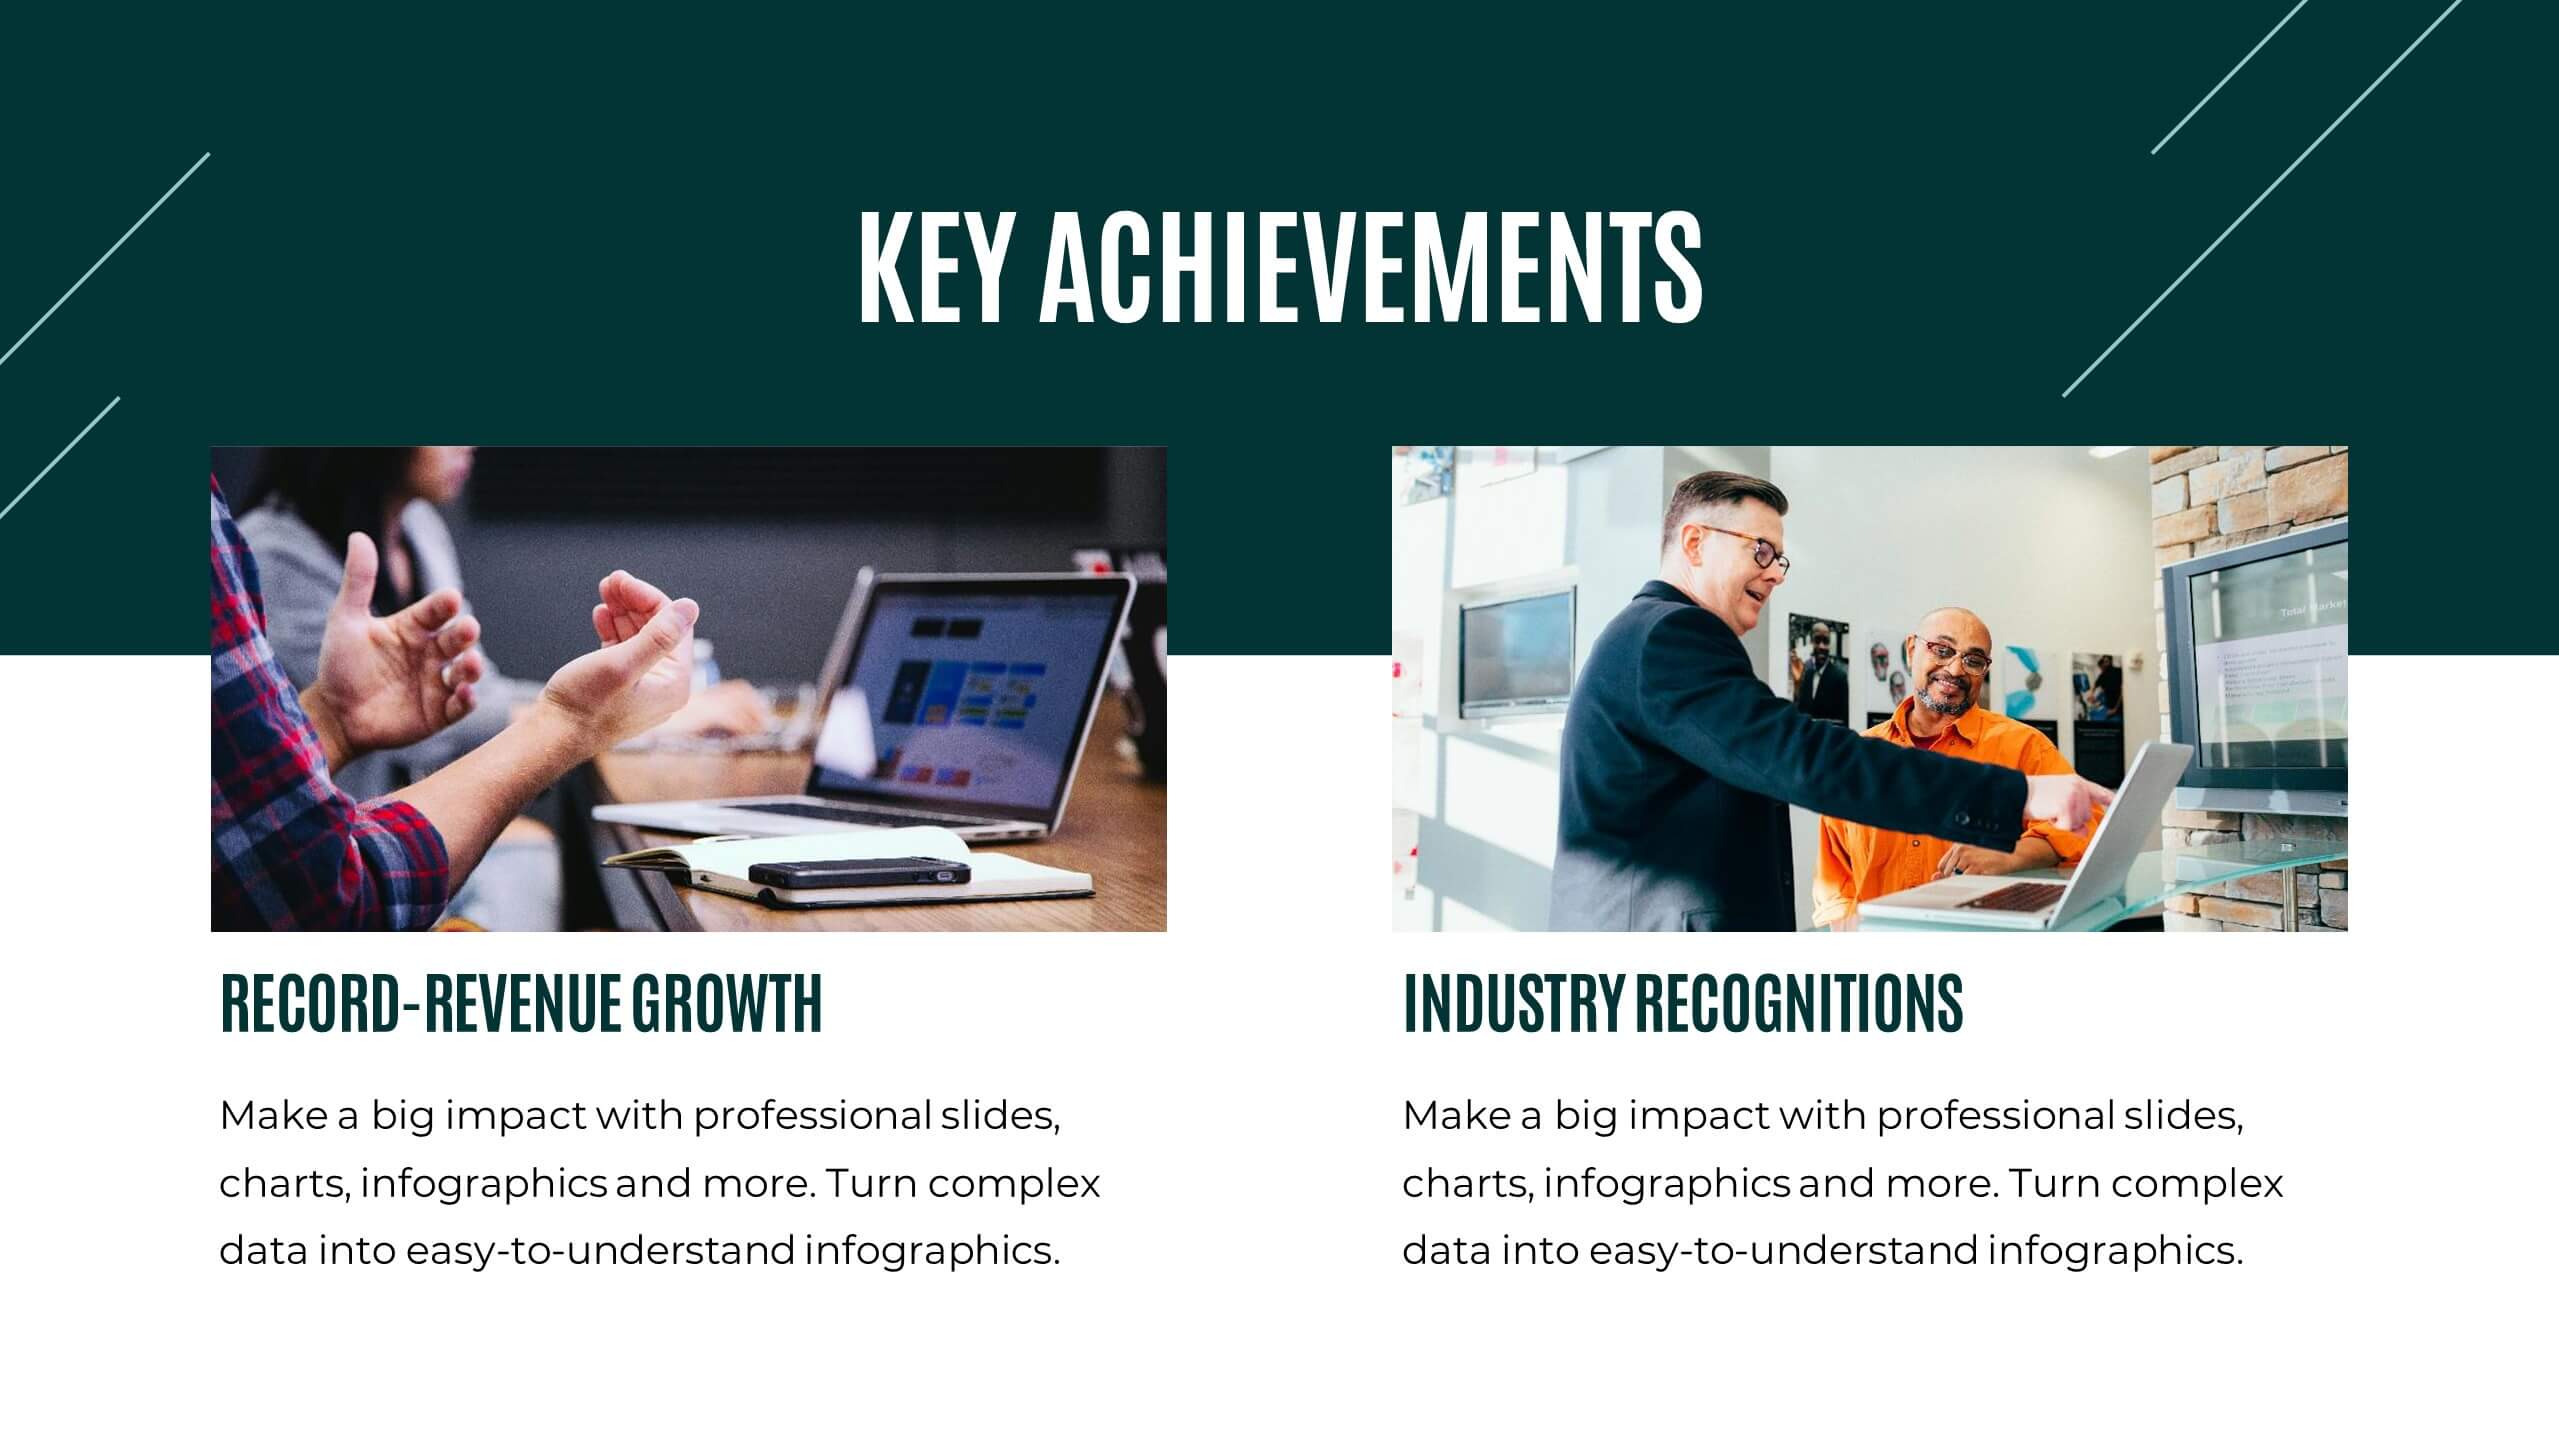
Prism Project Status Report Presentation
Deliver impactful updates with this comprehensive project status report template! Perfect for presenting key highlights, performance metrics, and strategic initiatives. Ideal for project managers aiming to keep stakeholders informed and aligned. Compatible with PowerPoint, Keynote, and Google Slides, this template ensures your reports are clear, professional, and engaging. Keep projects on track!


2 diapositivas
Client-Oriented Project Proposal Deck Presentation
Deliver polished, persuasive proposals with the Client-Oriented Project Proposal Deck Presentation. Designed to balance visual appeal and clarity, this layout is perfect for consultants, agencies, or freelancers presenting solutions to clients. Includes space for project overviews, photos, and key value points. Fully editable in PowerPoint, Keynote, and Google Slides.


5 diapositivas
Strategic HR Planning with Skills Gap Analysis
Lead with insight. The Strategic HR Planning with Skills Gap Analysis slide is your go-to tool for aligning talent strategy with organizational needs. Ideal for showcasing workforce priorities, skill readiness, and actionable development plans—fully editable in PowerPoint, Keynote, and Google Slides.


6 diapositivas
Wireless Connectivity with 5G Benefits Presentation
Unlock the power of next-gen wireless connectivity with this sleek, signal-inspired infographic. Ideal for showcasing 5G benefits, this layout visualizes five key advantages in a clear, modern design. Perfect for tech briefings, strategic updates, or educational overviews. Fully compatible with PowerPoint, Keynote, and Google Slides for easy customization.


6 diapositivas
Bubble Map Ideas Infographics
Visualize your ideas creatively with our Bubble Map Ideas infographic template. This template is fully compatible with popular presentation software like PowerPoint, Keynote, and Google Slides, allowing you to easily customize it to brainstorm and organize your concepts using a bubble map format. The Bubble Map Ideas infographic template offers a visually engaging platform to brainstorm and categorize ideas, concepts, and relationships in a structured and visually appealing manner. Whether you're a creative thinker, project manager, or educator, this template provides a user-friendly canvas to create informative presentations and visualizations of your ideas. Elevate your idea generation and organization with this SEO-optimized Bubble Map Ideas infographic template, thoughtfully designed for clarity and ease of use. Customize it to map out your ideas, prioritize them, and identify key connections, ensuring that your creative process becomes more organized and productive. Start crafting your personalized infographic today to bring your ideas to life.


7 diapositivas
Training Infographic Presentation Template
Training is the foundation of a successful business. It gives everyone a great understanding of their responsibilities and the knowledge and skills they need to do that job. Training is essential for your new employees. The purpose of this template is to promote effective communication and understanding on the importance of training. Training is an essential part of growing your company. This presentation will allow you to show how training is an opportunity to learn new skills and improve on existing ones. This template provides a fun and professional layout that your employees will love.


6 diapositivas
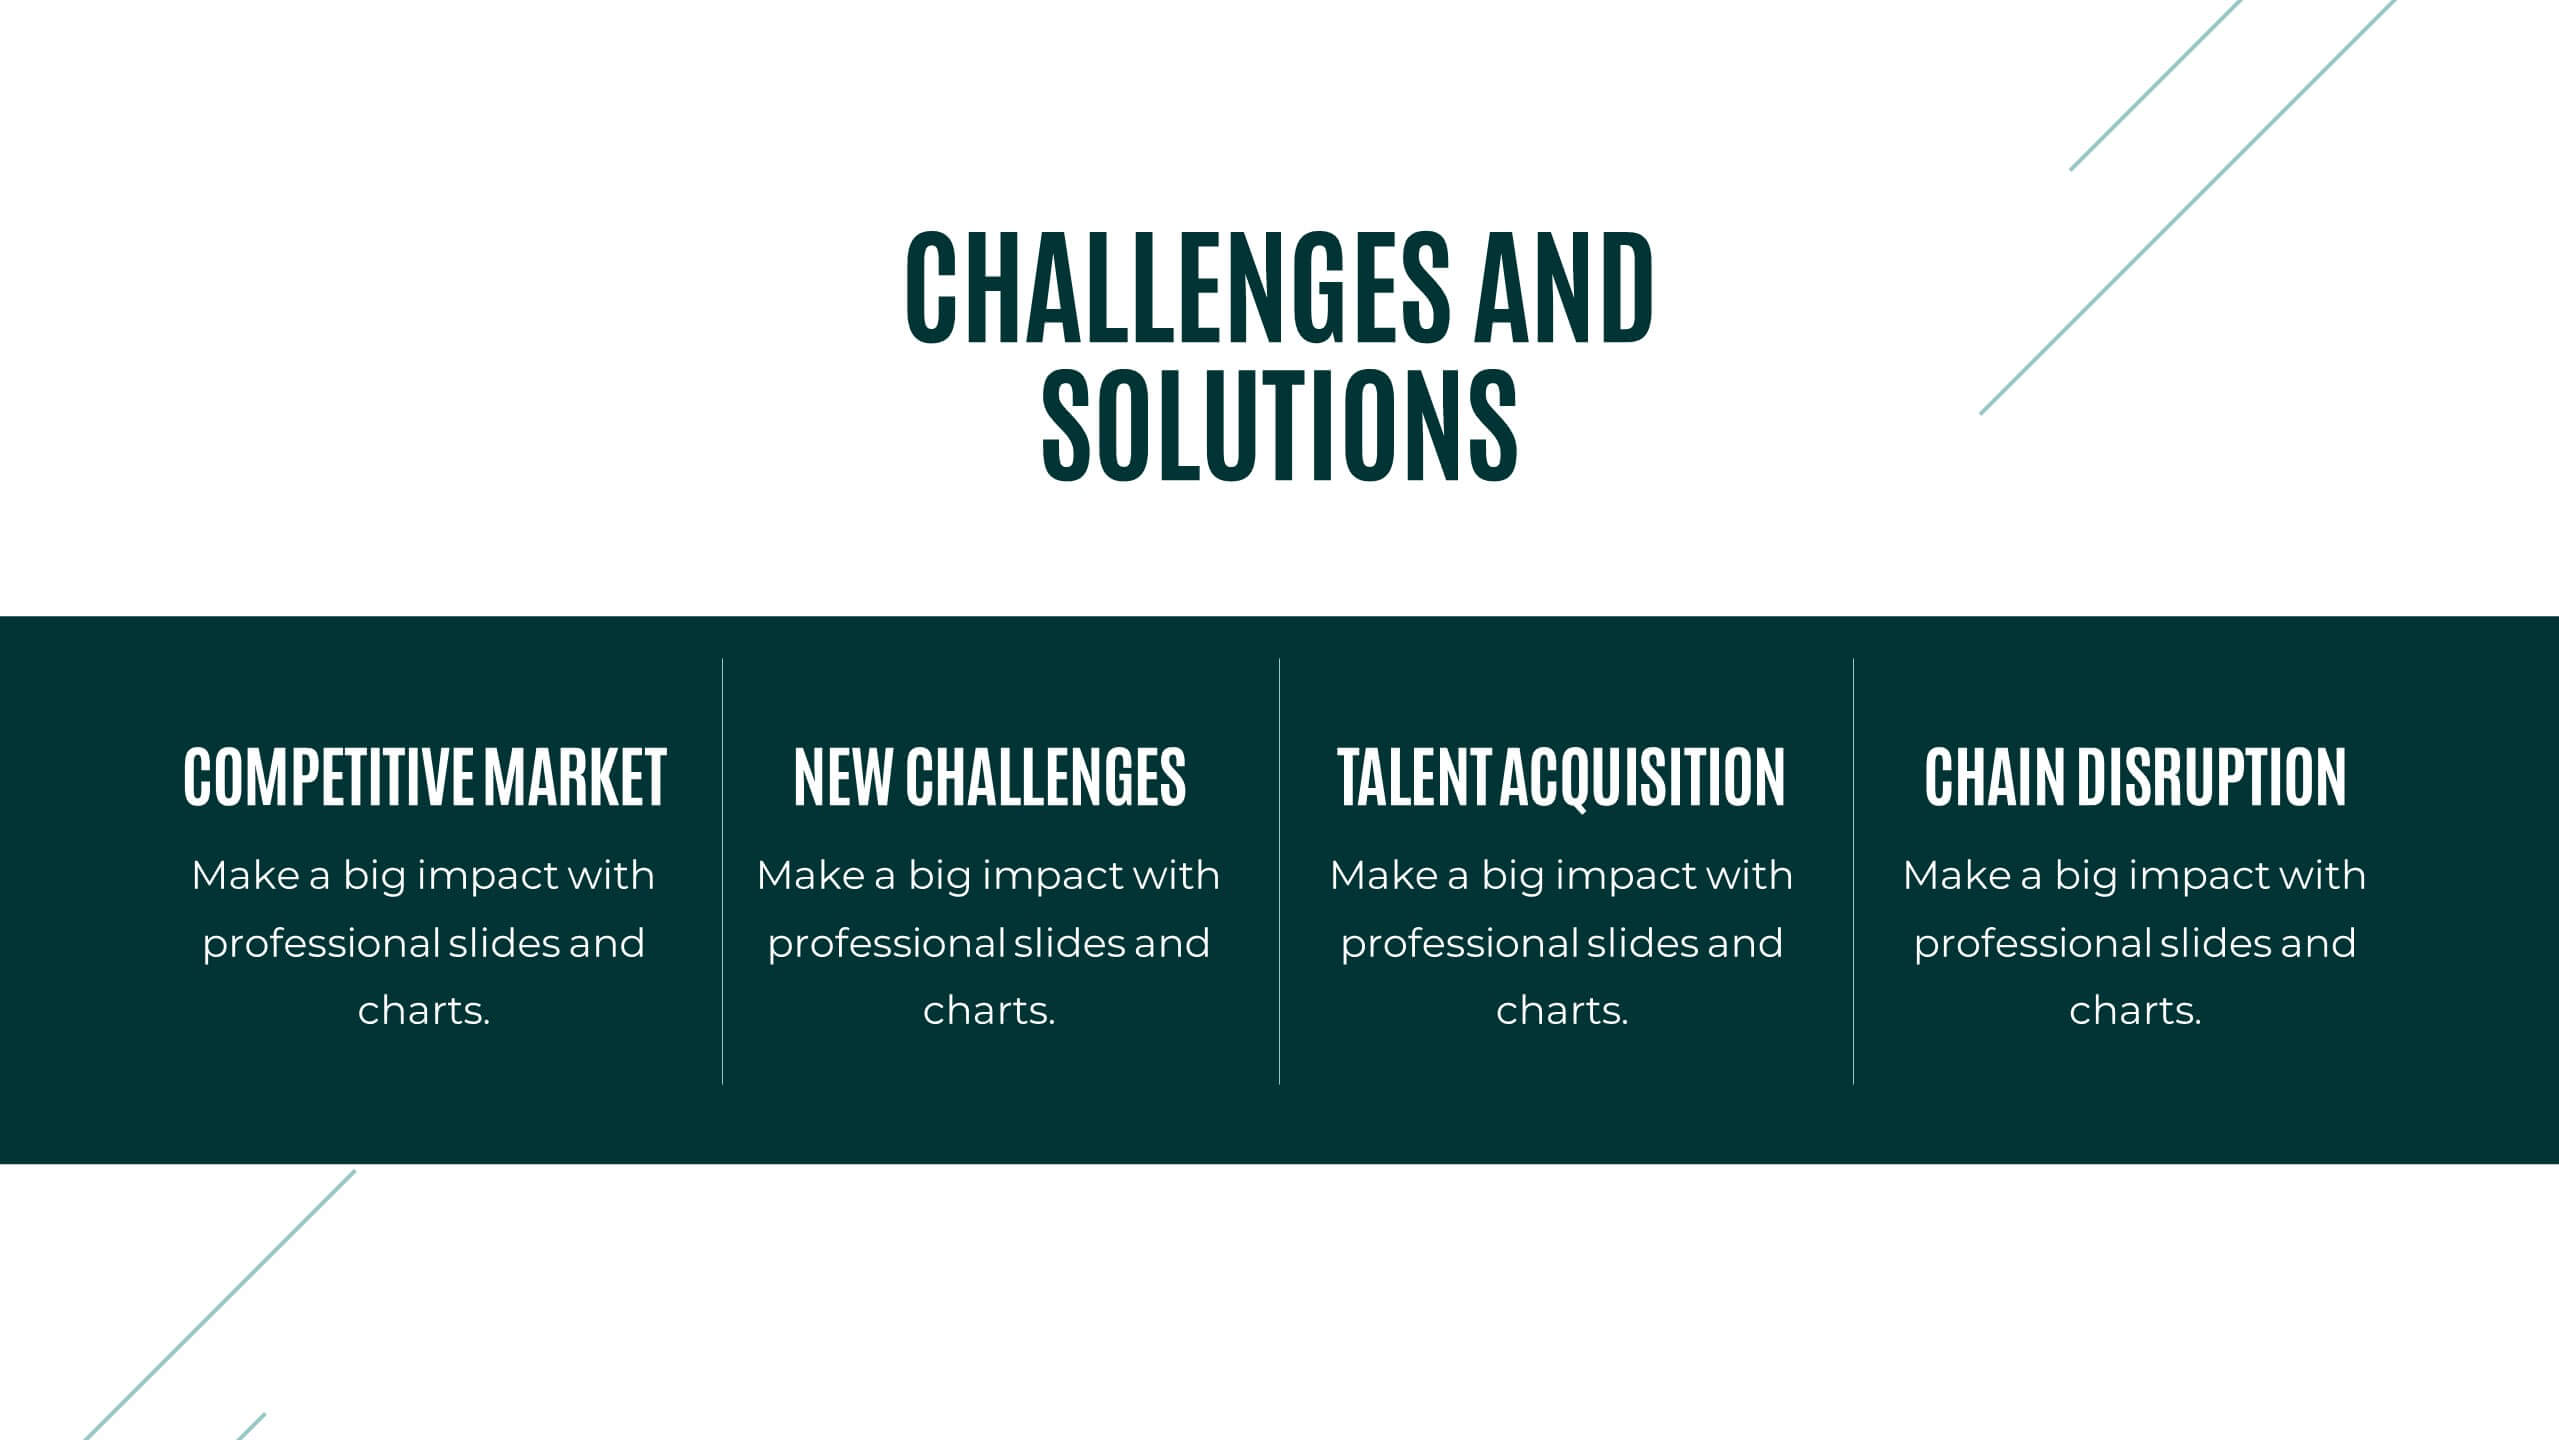
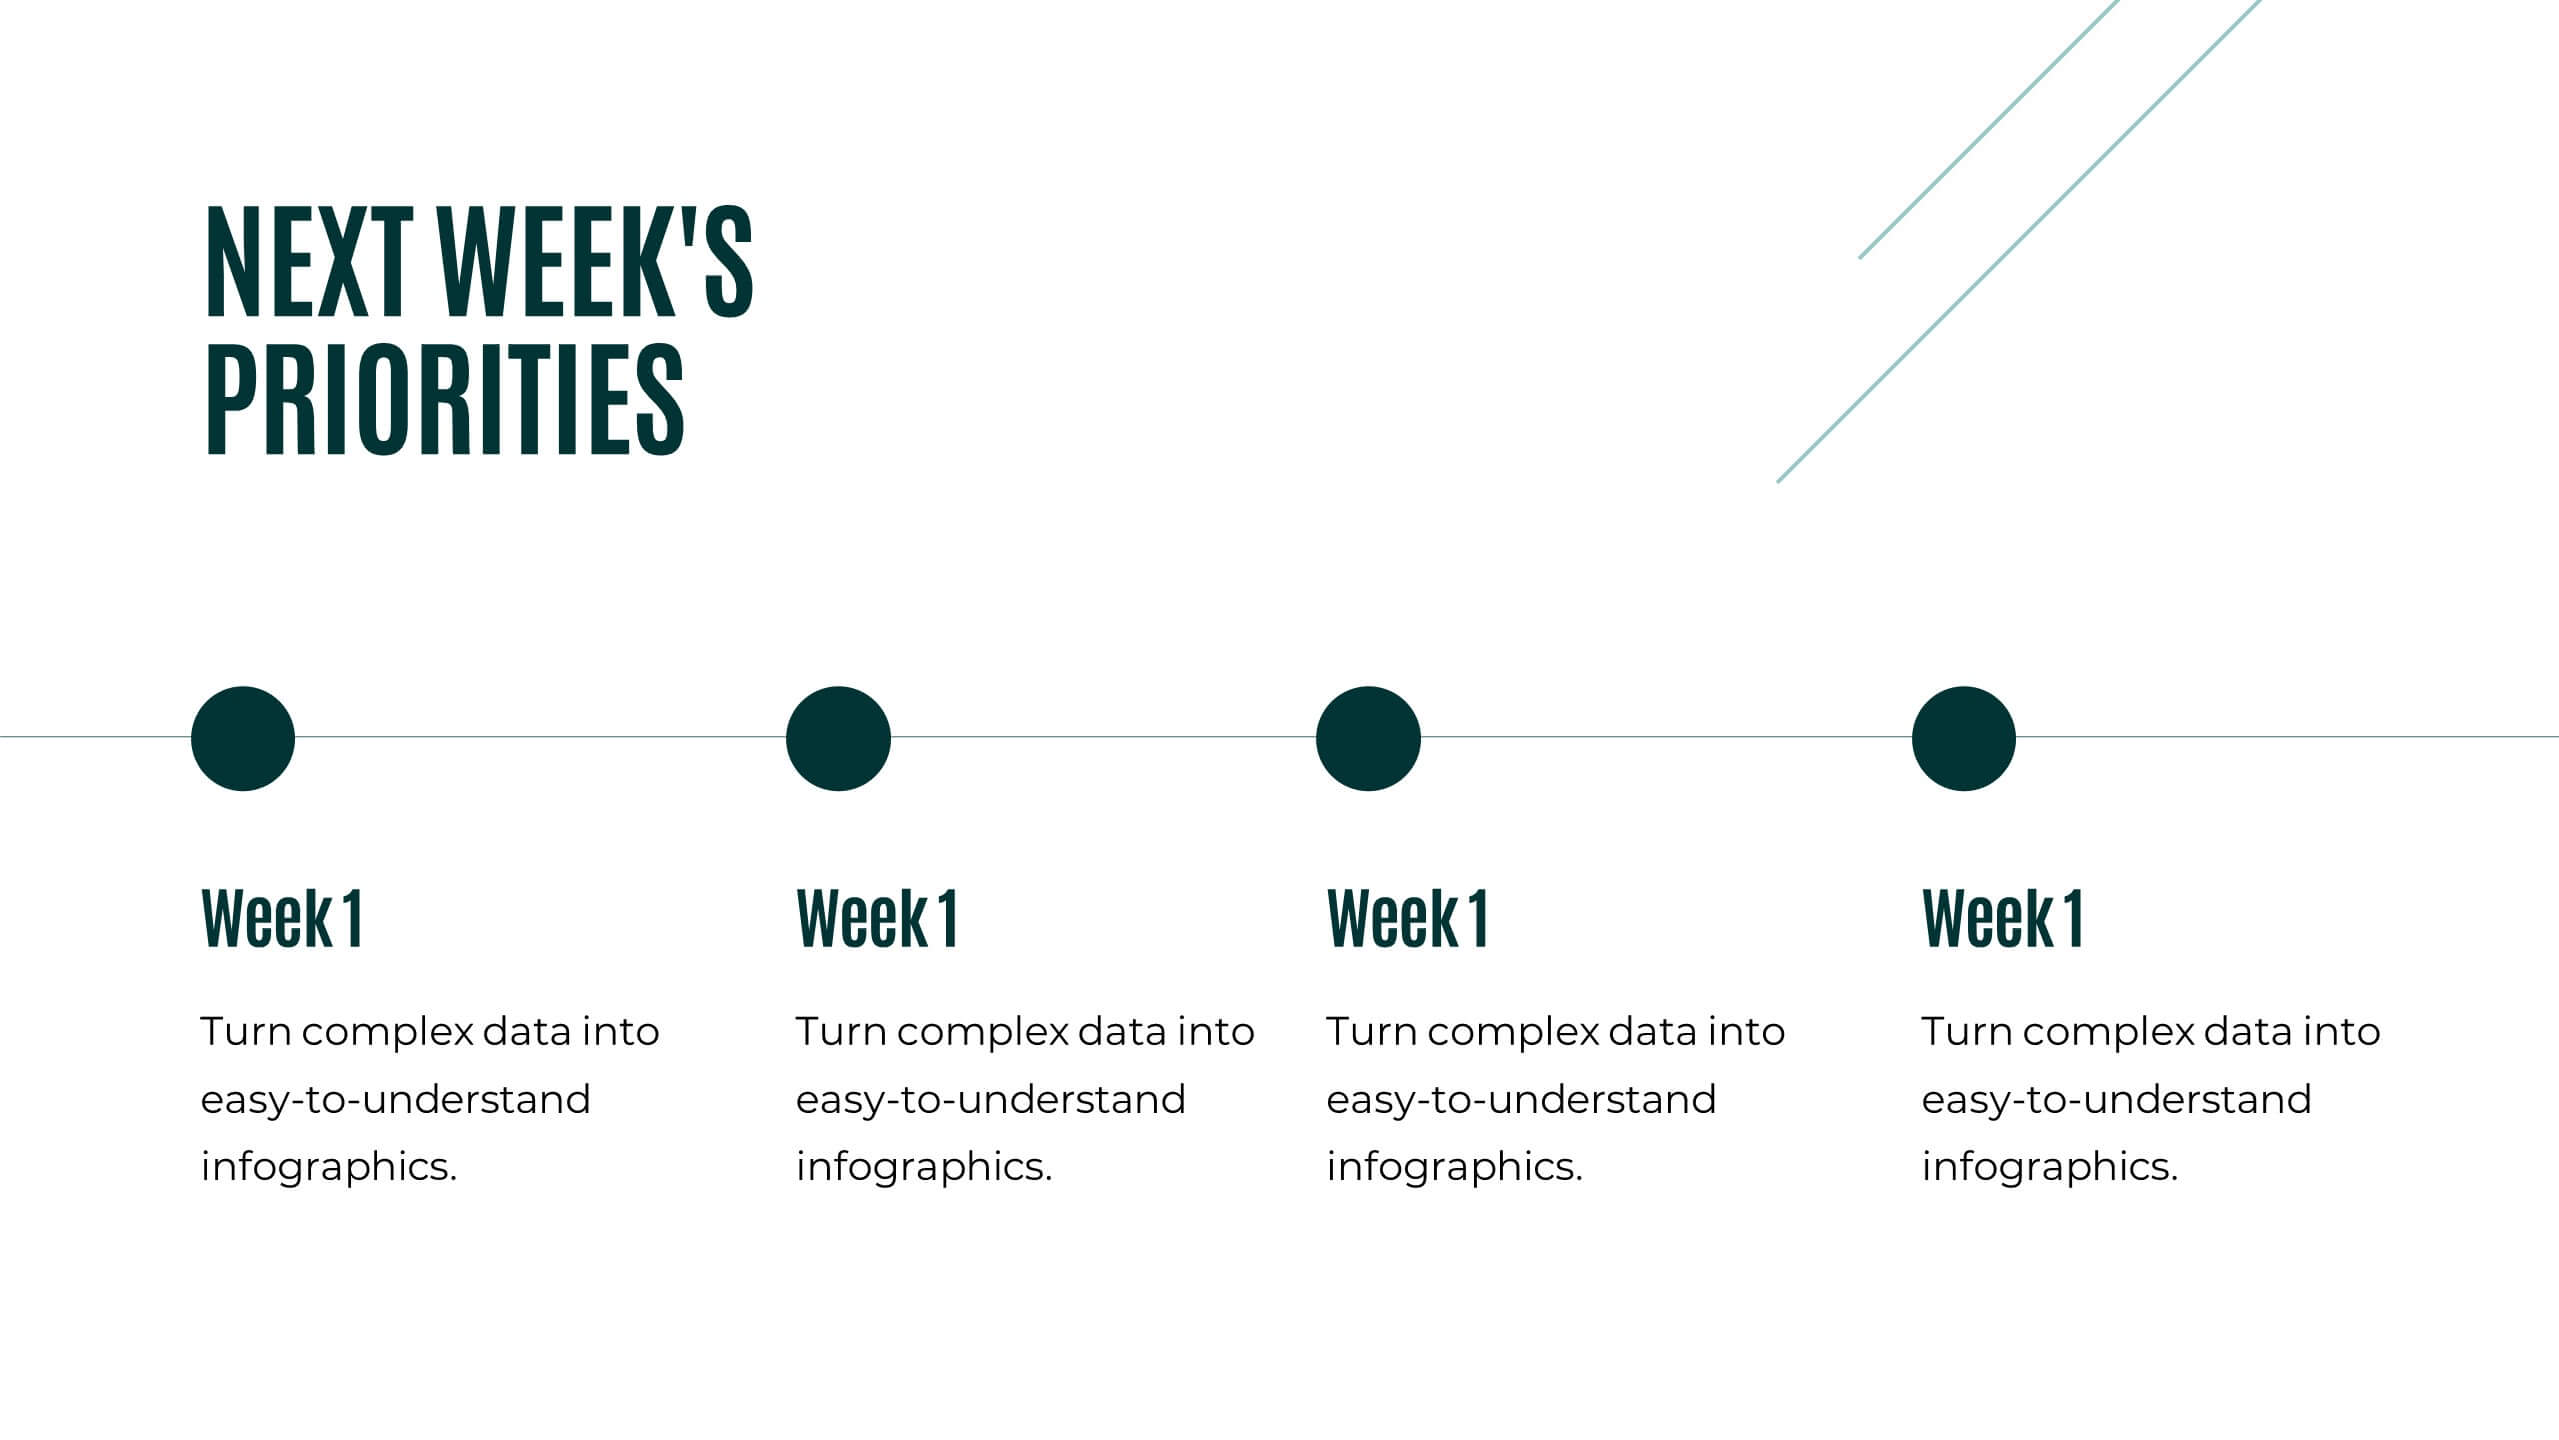
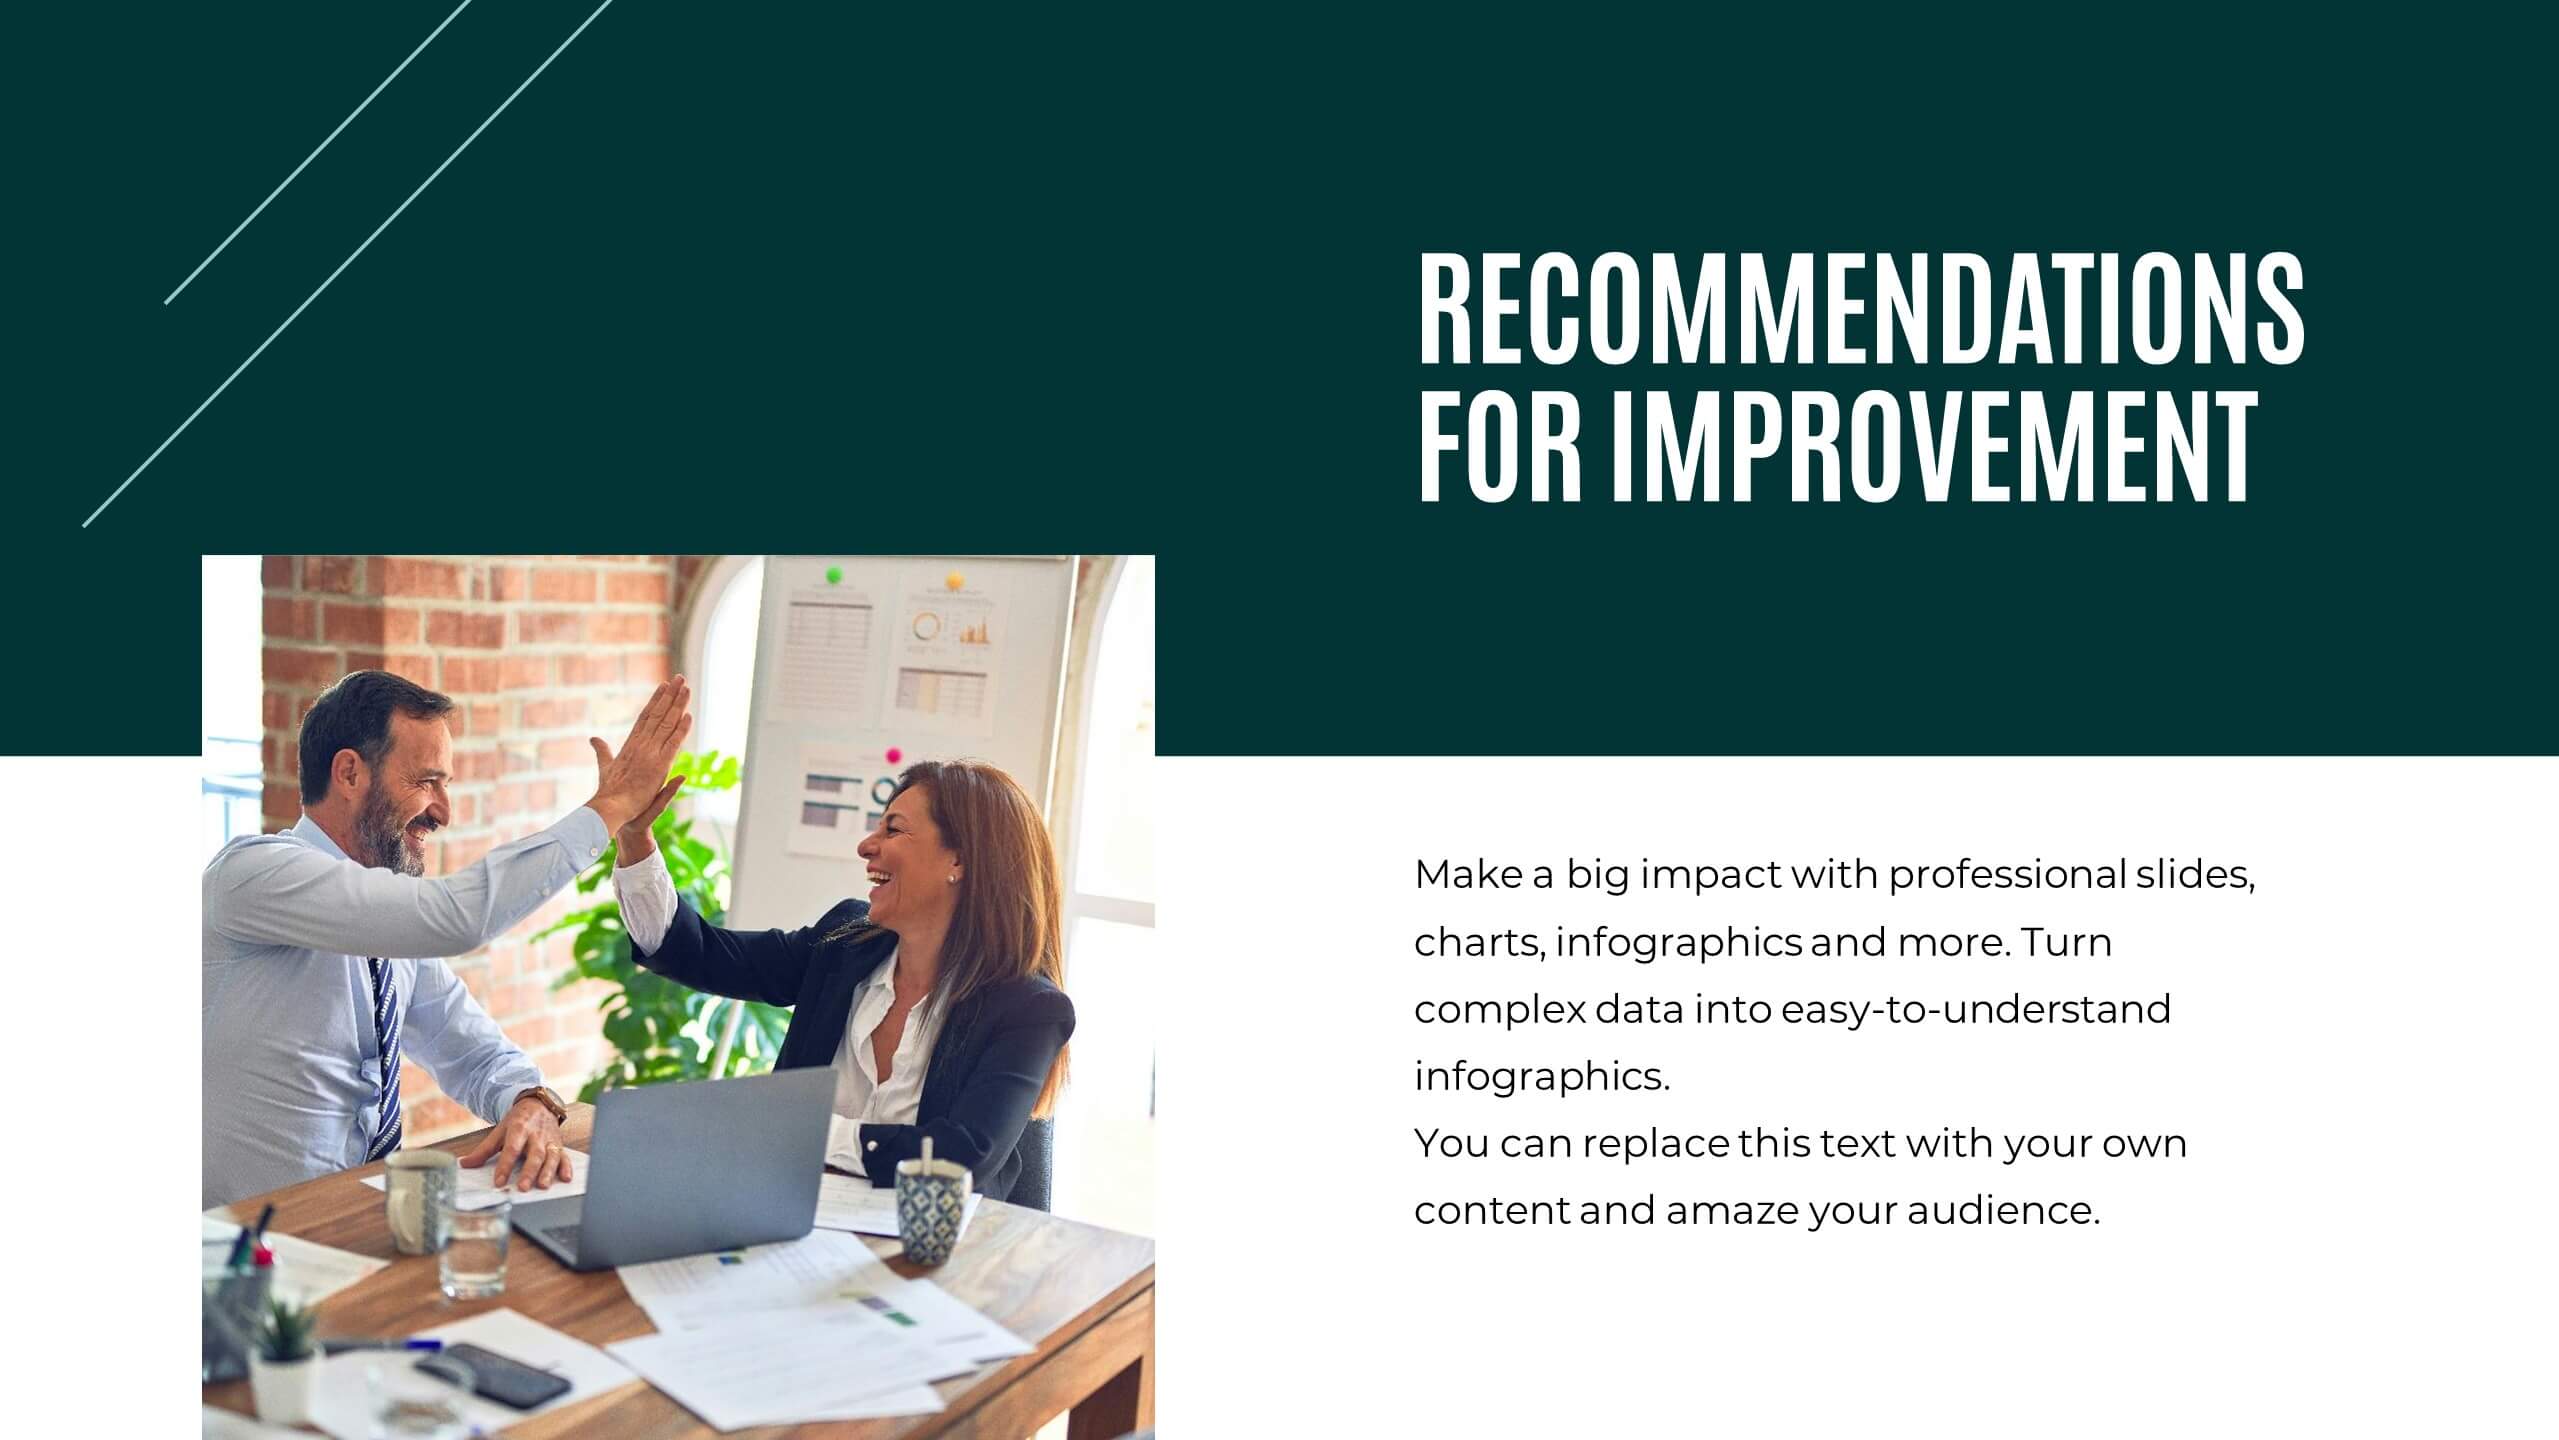
Title Hierarchy Infographic
The collection of slides is designed to efficiently convey key themes with a striking visual appeal, ensuring that crucial topics are presented with clarity and emphasis. Each slide utilizes bold typography and a unique color palette to draw attention and maintain viewer engagement. The designs incorporate dynamic shapes and minimalist layouts, enhancing the presentation's readability while emphasizing important content. This set is ideal for professionals aiming to present complex ideas in a clear and memorable way during meetings or in corporate documents. It supports various communicative goals, such as introducing concepts, outlining challenges, or promoting organizational initiatives, making it a versatile tool for enhancing message delivery in any professional setting.


7 diapositivas
Business Office Scenes Infographic Presentation
Office Scene Infographics can be a valuable tool for businesses or organizations that want to showcase their workplace culture or attract potential employees by providing a visual representation of what it's like to work at their company. This template is designed to provide a visual representation of different office scenarios and activities. The template is fully customizable and can be used for a variety of purposes, such as internal communication, training, marketing, and educational. It has a unique design, easy customization, and compatibility with Powerpoint, Keynote and Google Slides.


5 diapositivas
Regional Sales Heatmap Presentation
Showcase performance by region with this Regional Sales Heatmap Presentation. This template highlights U.S. state-by-state sales data using gradient color coding and a clear legend system. Easily customizable for quarterly reports, territory analysis, or sales strategy reviews. Compatible with PowerPoint, Keynote, and Google Slides.


4 diapositivas
Task List and To-Do Management Presentation
Boost productivity with this engaging task management template. Designed for clear visualization, it helps organize priorities, track progress, and streamline workflows efficiently. Featuring a structured layout, it's perfect for professionals managing daily to-dos, project timelines, or business strategies. Fully compatible with PowerPoint, Keynote, and Google Slides for seamless use.


6 diapositivas
Stakeholder Management Analysis Infographics
Efficiently manage stakeholders with our Stakeholder Management Analysis infographic template. This template is fully compatible with popular presentation software like PowerPoint, Keynote, and Google Slides, allowing you to easily customize it to analyze and communicate your stakeholder management strategies. The Stakeholder Management Analysis infographic template offers a visually engaging platform to assess, categorize, and prioritize stakeholders based on their influence and interest in your projects or initiatives. Whether you're a project manager, business leader, or involved in stakeholder engagement, this template provides a user-friendly canvas to create informative presentations and reports on stakeholder management. Optimize your stakeholder relationships with this SEO-optimized Stakeholder Management Analysis infographic template, thoughtfully designed for clarity and ease of use. Customize it to showcase stakeholder mapping, engagement strategies, and communication plans, helping you ensure that your stakeholders' needs and expectations are met effectively. Start crafting your personalized infographic today to excel in stakeholder management.