


Características


¿Tienes alguna pregunta?
Recomendar


4 diapositivas
Financial Report Presentation
Enhance your financial presentations with our "Financial Report Presentation" template. Designed for clarity and visual impact, this infographic features a stylized financial bag icon segmented into color-coded sections, each representing a different financial metric such as revenue, expenses, profits, and investments. This creative visual structure allows for a clear and segmented display of your company's financial health, making complex data easily understandable. Ideal for financial analysts, corporate presentations, and investor meetings, this template ensures key financial insights are communicated effectively and efficiently. Compatible with PowerPoint, Keynote, and Google Slides, it's an essential tool for delivering detailed and precise financial reports.


21 diapositivas
Zephyrkin Product Roadmap Presentation
Outline your product’s journey with this roadmap template, covering essential elements like target market, customer pain points, competitive analysis, and marketing strategy. Showcase your product's features, unique value proposition, and development process. Ideal for PowerPoint, Keynote, and Google Slides, this template supports professional product presentations.


26 diapositivas
Roaster Presentation Template
Are you interested in knowing about the best coffee in town? Roaster is a fresh and bold template perfect for marketing. This template will be sure to make your services and products stand out. The background stays in theme with coffee tone colors and many pictures. Overall Roaster can help you make any kind of presentation you need and help you create a professional online presence. This template is a great starting point for creating an impressive sales page. You'll be able to quickly add in your information and customize this template to display a captivating presentation.


7 diapositivas
Professional Project Management Infographic Presentation
Project management is the process of planning, organizing, and overseeing resources and tasks to achieve goals and objectives within a defined timeframe. This template includes a clean, eye-catching design with plenty of space to add your content. This infographic template provides a step by step explanation of project management. It's the perfect way to explain complex projects easily to clients and employees. This template is compatible with Powerpoint, keynote and google slides making it easily customizable and editable. Use this for next project management research paper, presentation, etc.


5 diapositivas
Market Segmentation by Demographics Presentation
The "Market Segmentation by Demographics" presentation template showcases a circular infographic that effectively visualizes market segments as distinct demographic groups. Each colored section of the circle corresponds to a different demographic characteristic, such as age, income, or location, and is accompanied by key insights or data points in adjacent text placeholders. This format allows for an intuitive comparison of how each segment contributes to the market, facilitating a clear understanding of the audience composition. This visual arrangement is especially useful for presentations that need to highlight demographic data succinctly to support market analysis or strategic marketing decisions.


5 diapositivas
Identifying Core Issues with Cause Mapping Presentation
Pinpoint the origin of your challenges with the Identifying Core Issues with Cause Mapping Presentation. This diagram is designed to break down problems step-by-step using a clean, logical flow format. Ideal for root cause analysis, risk reviews, and strategic audits, it helps teams visualize contributing factors and map out relationships. Fully editable in PowerPoint, Keynote, and Google Slides.

21 diapositivas
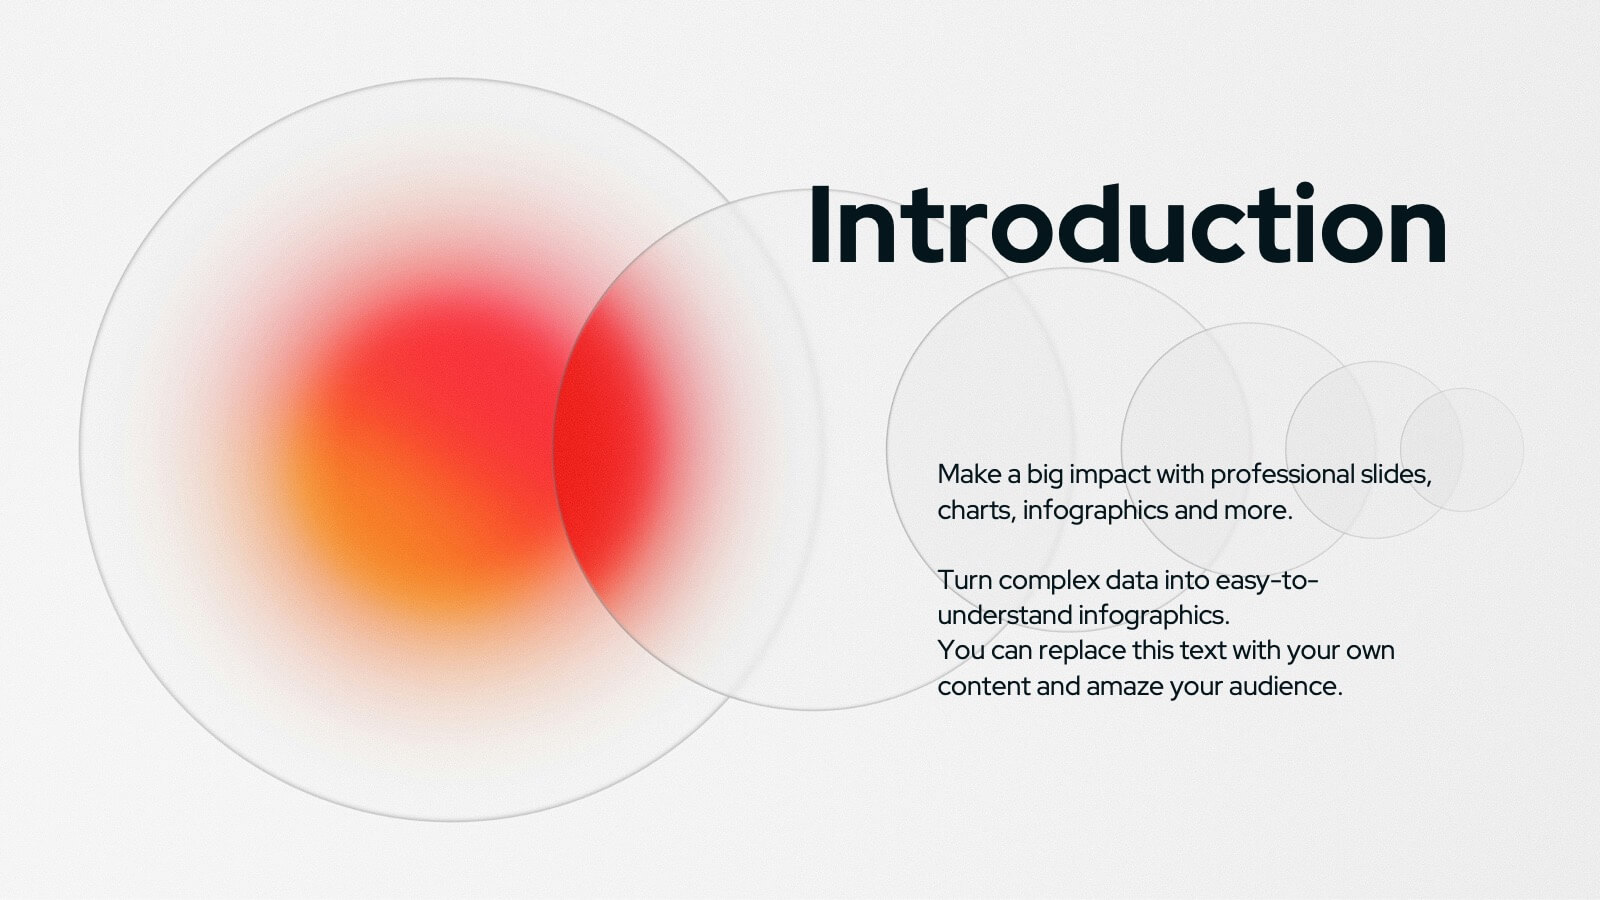
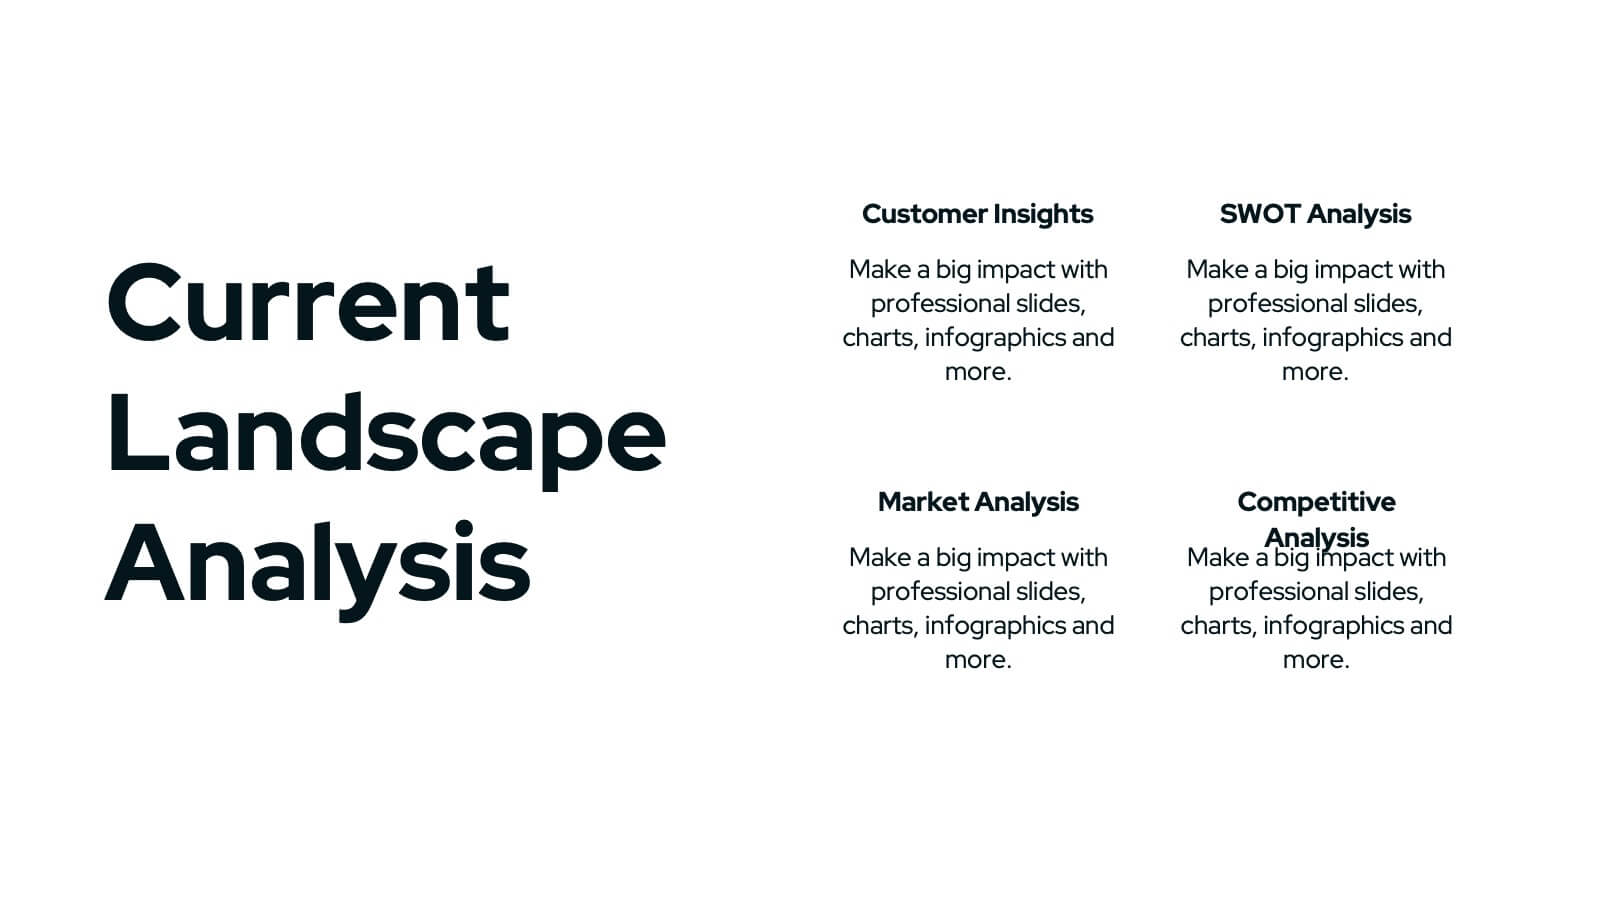
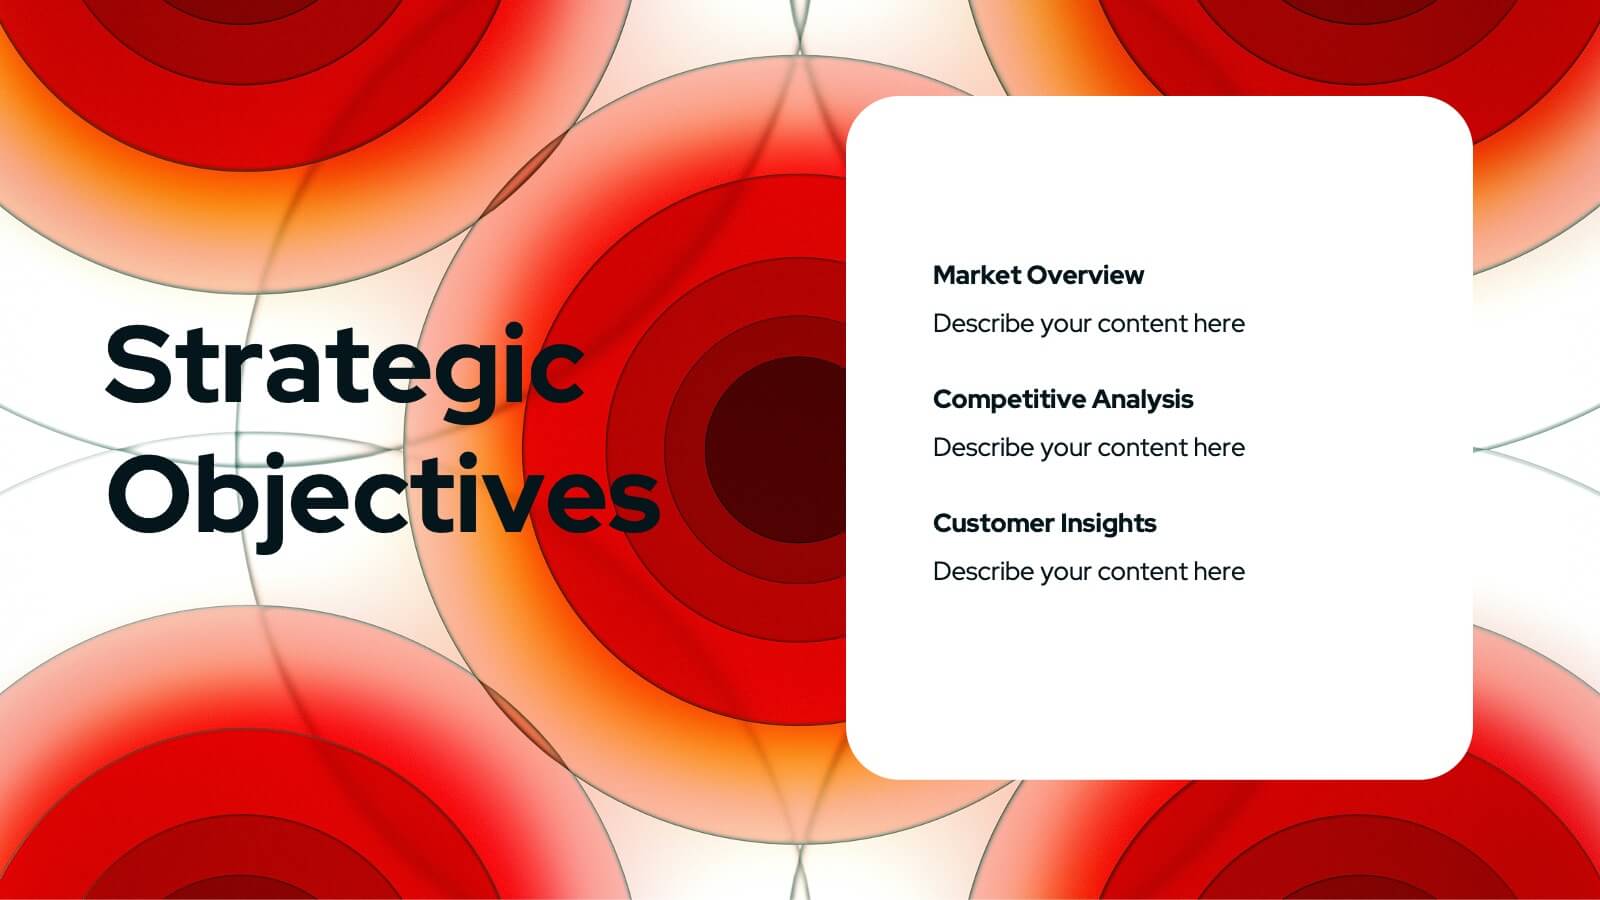
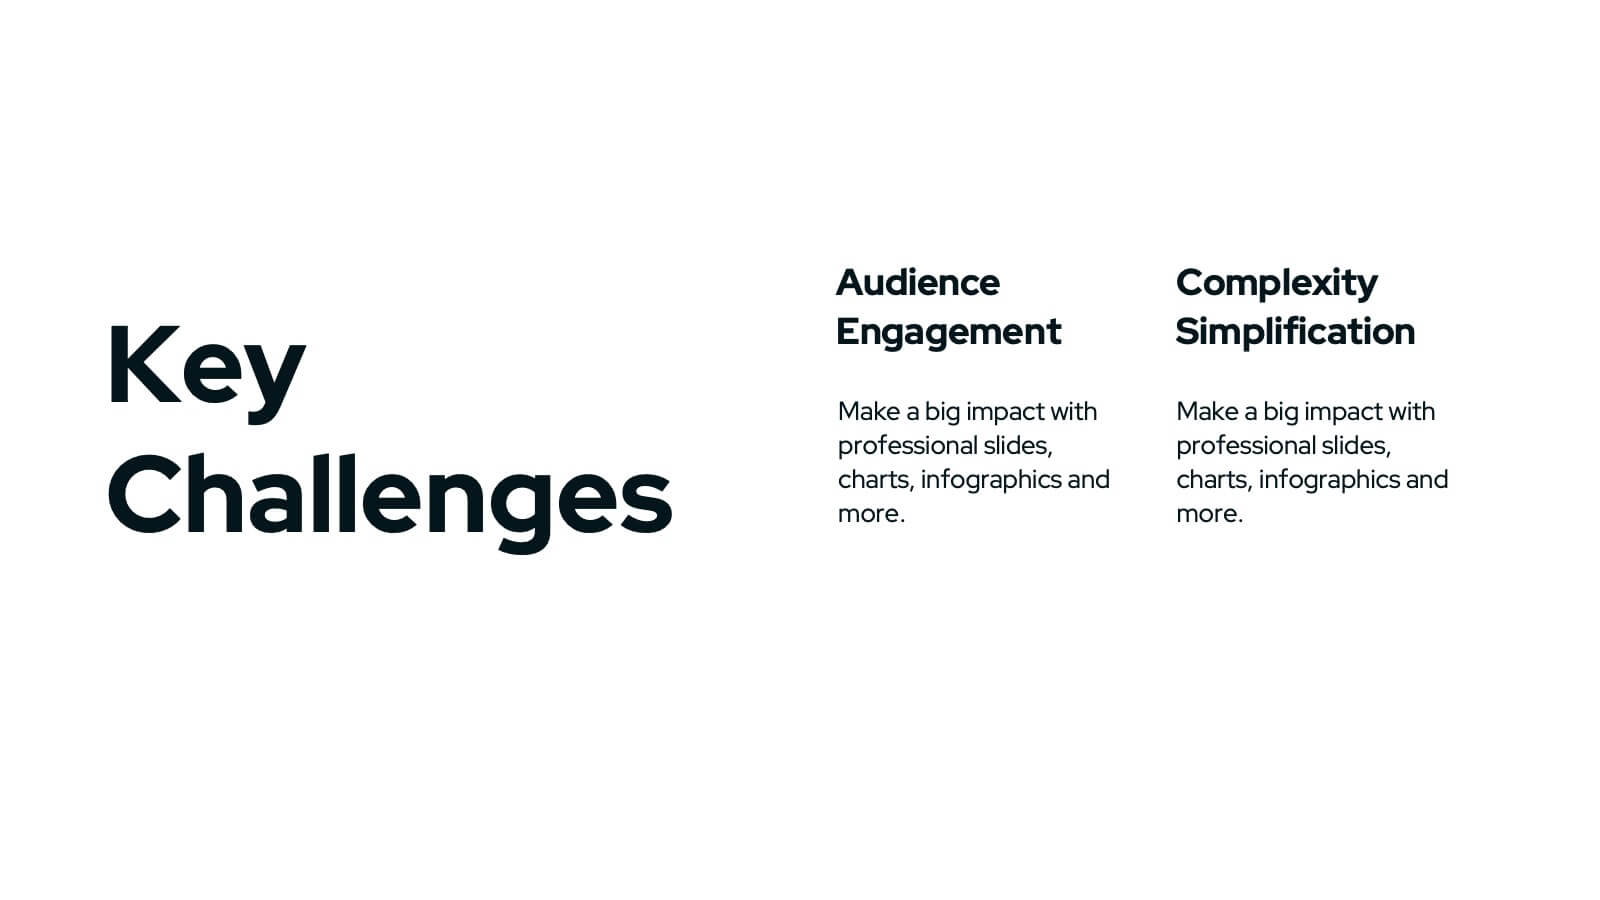
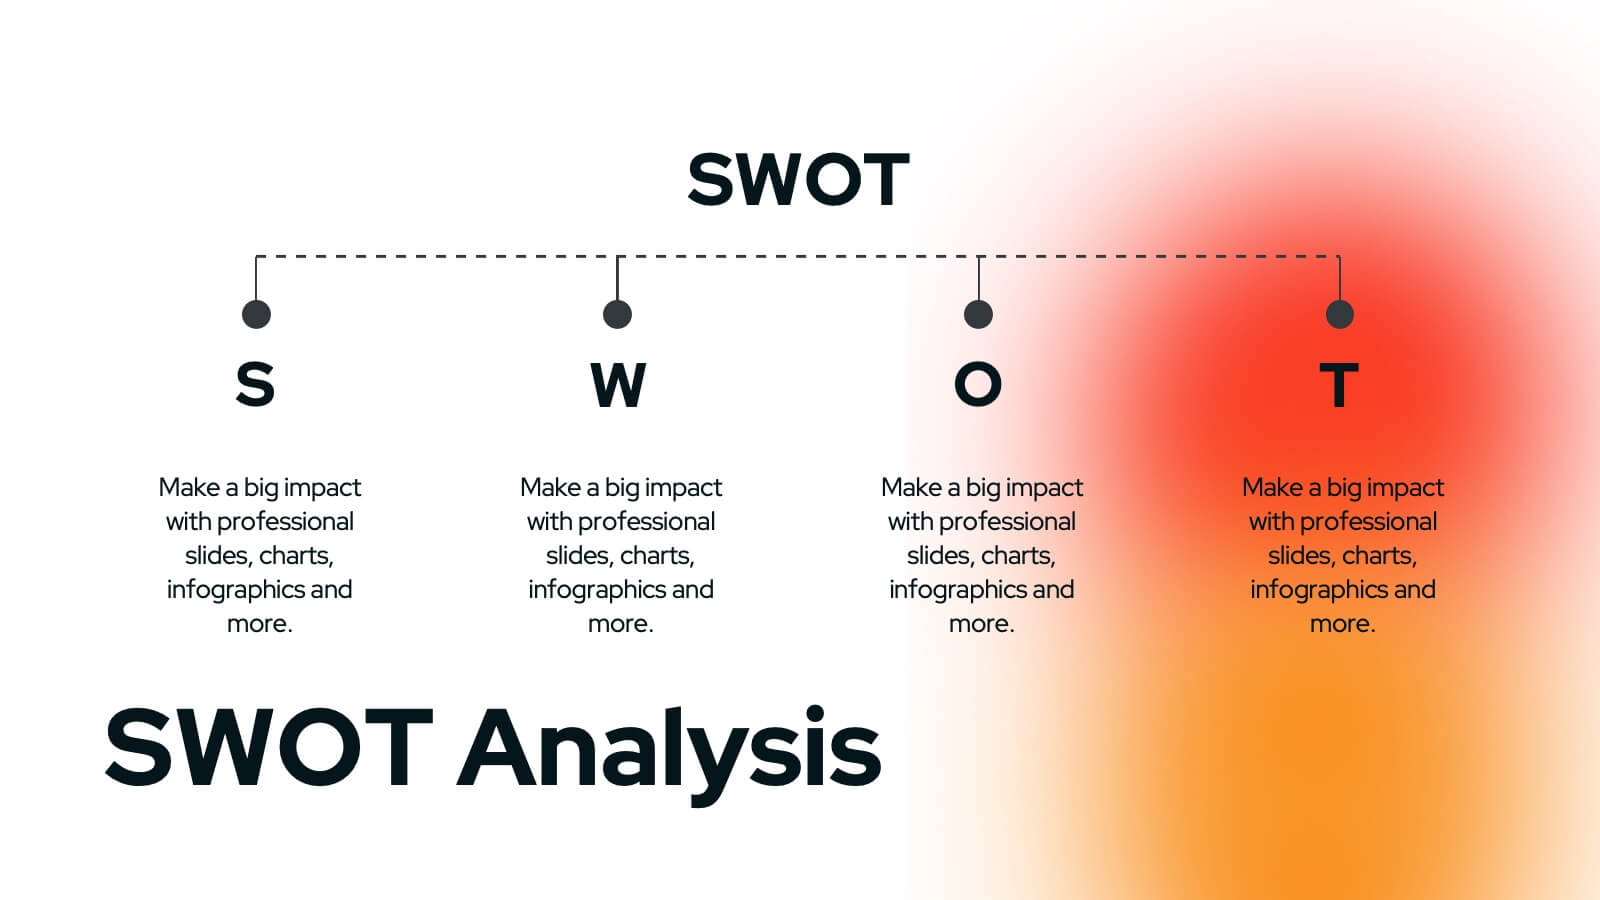
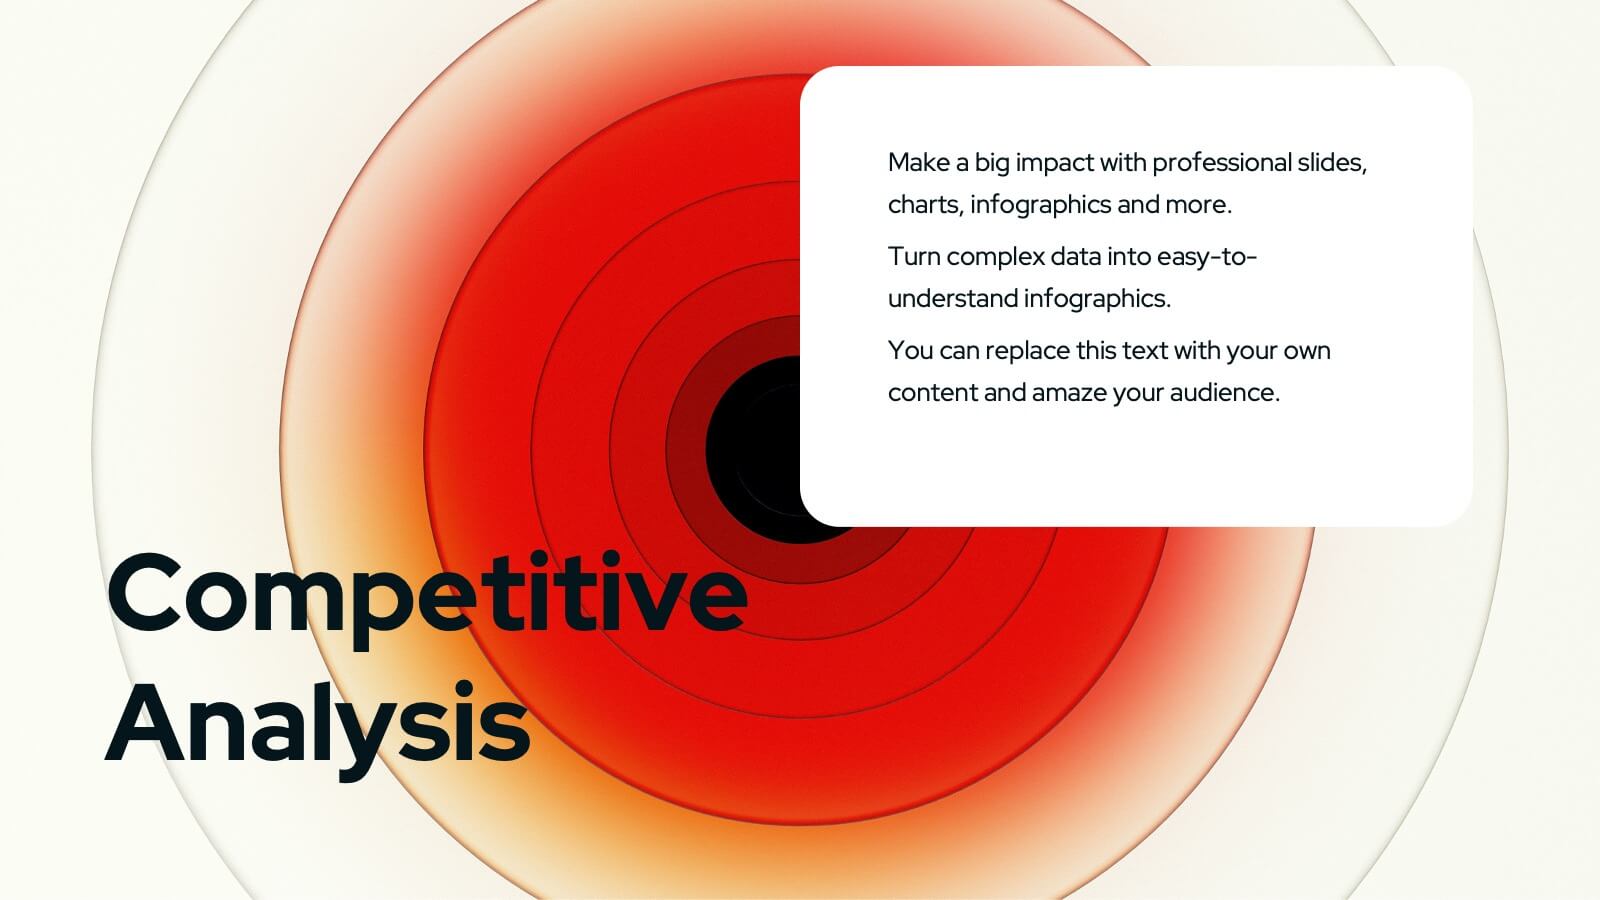
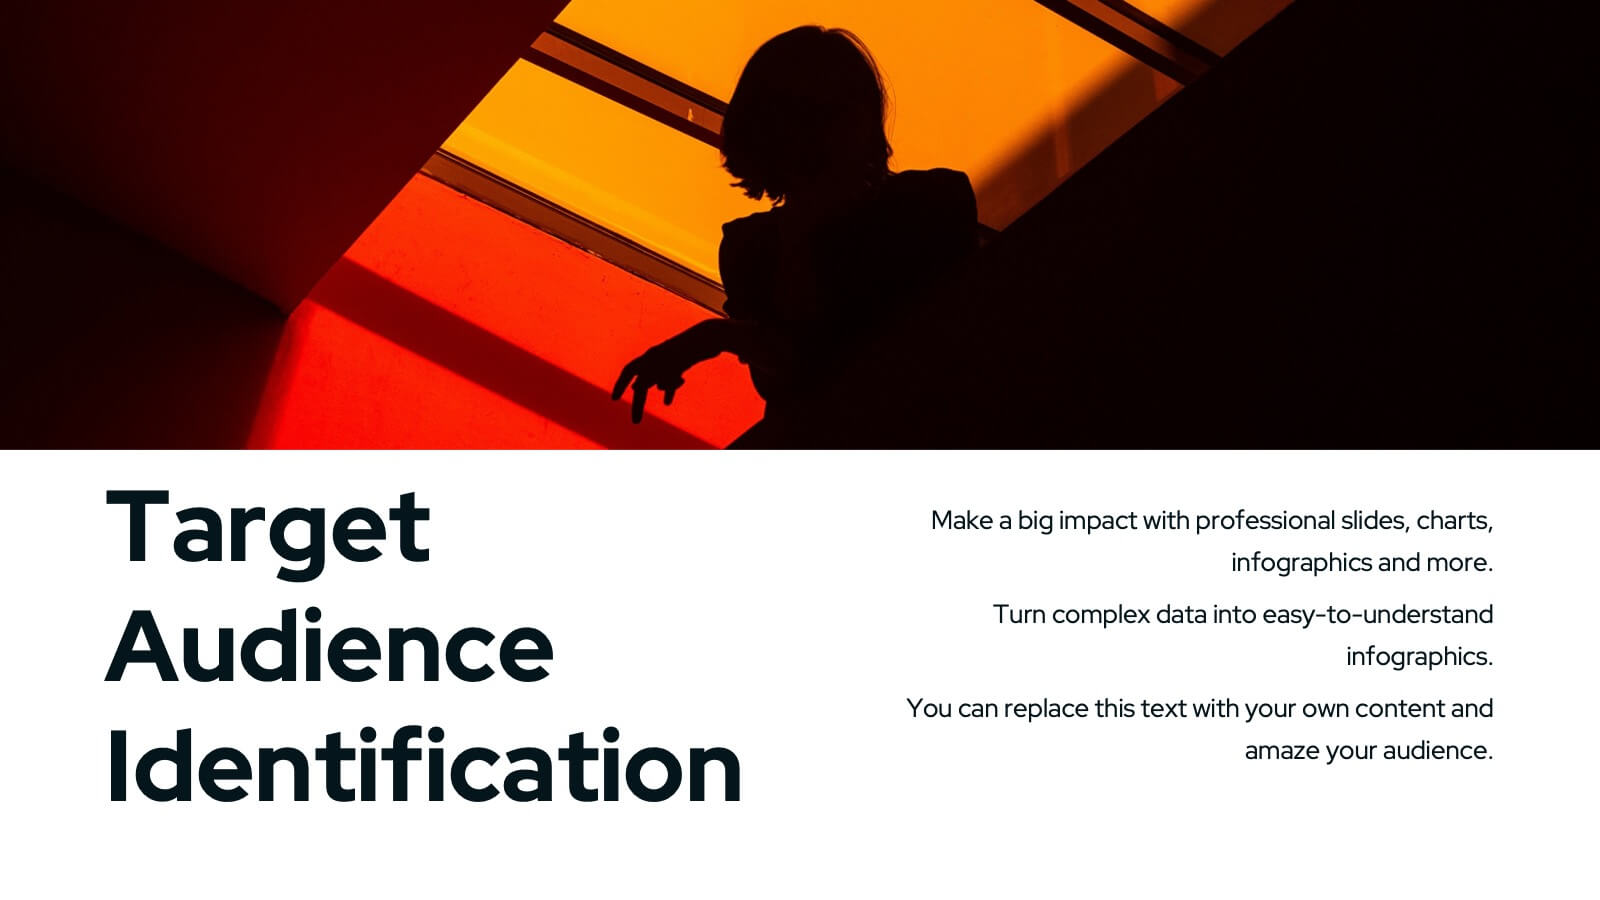
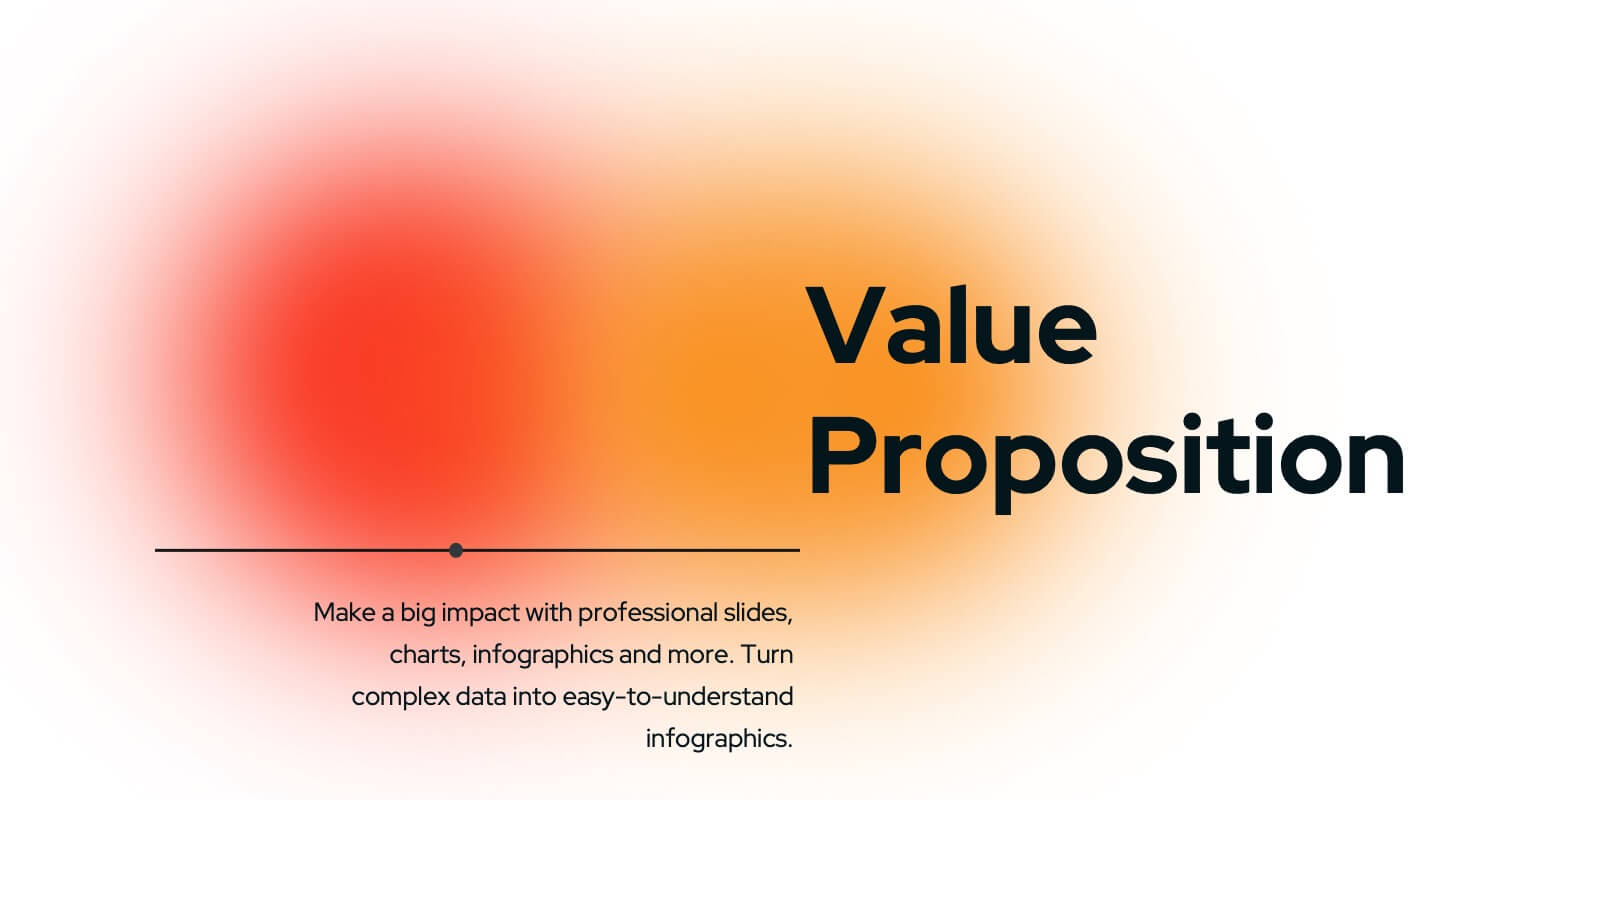
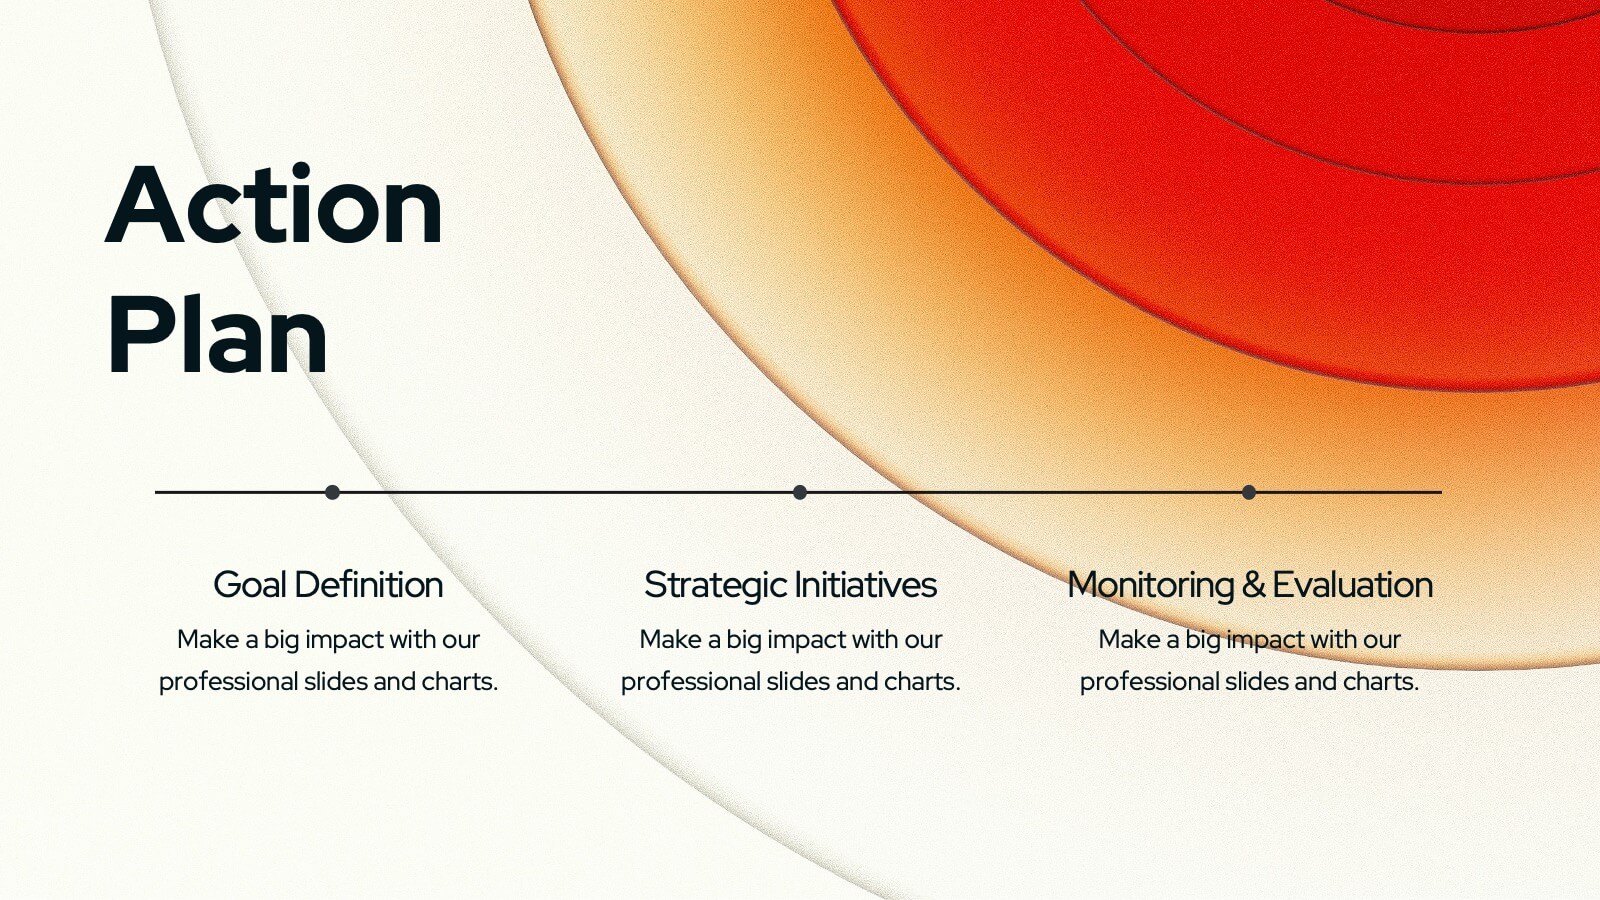
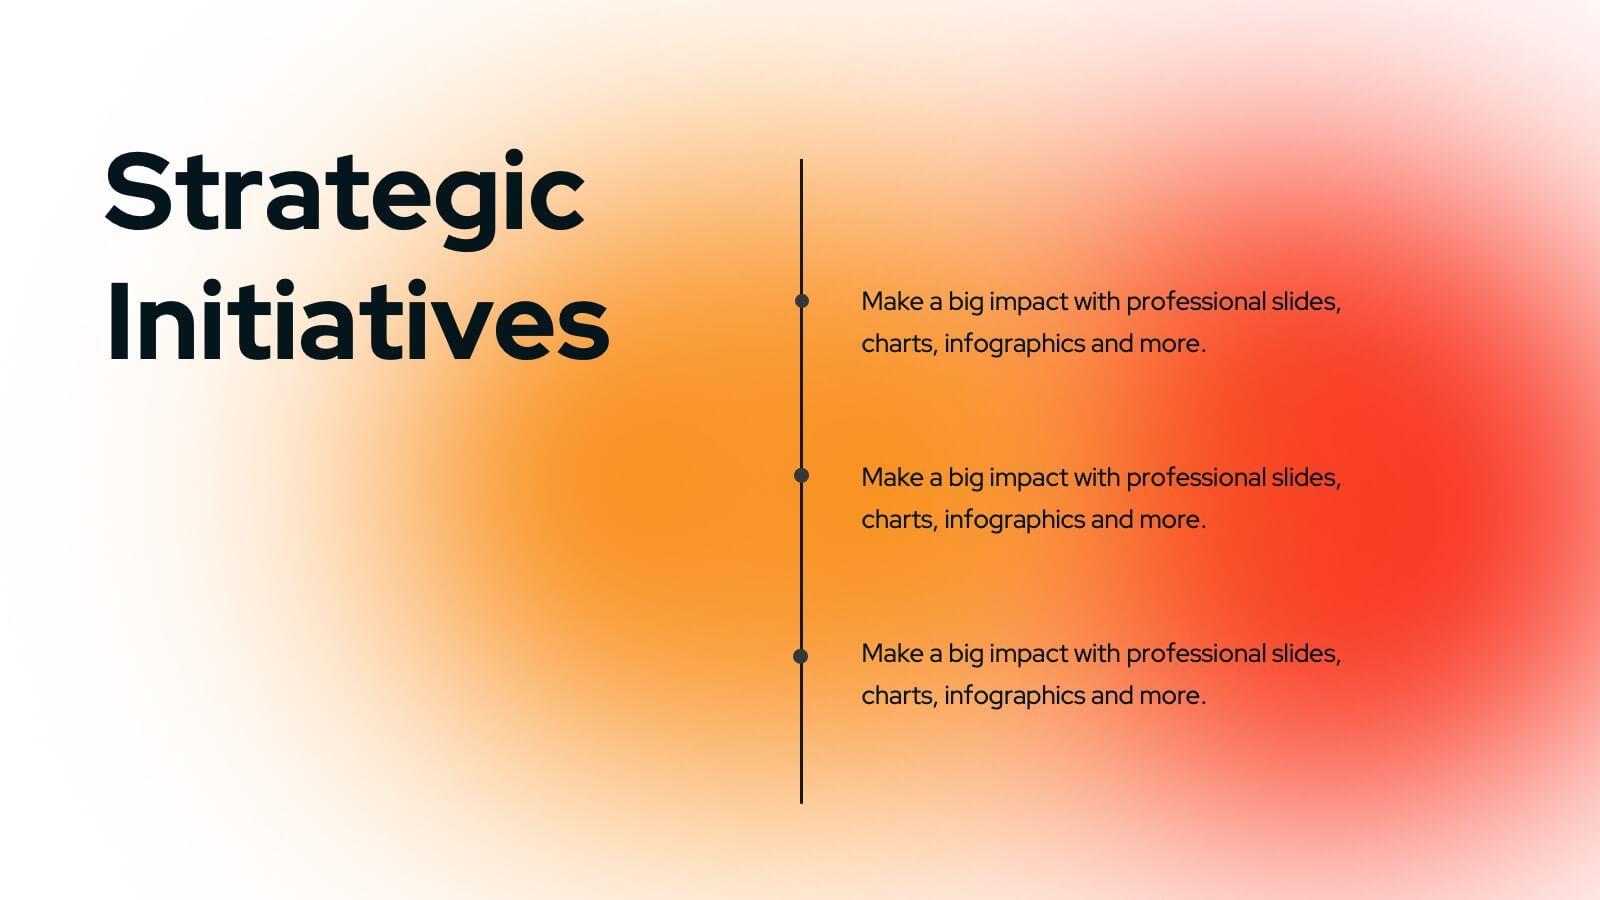
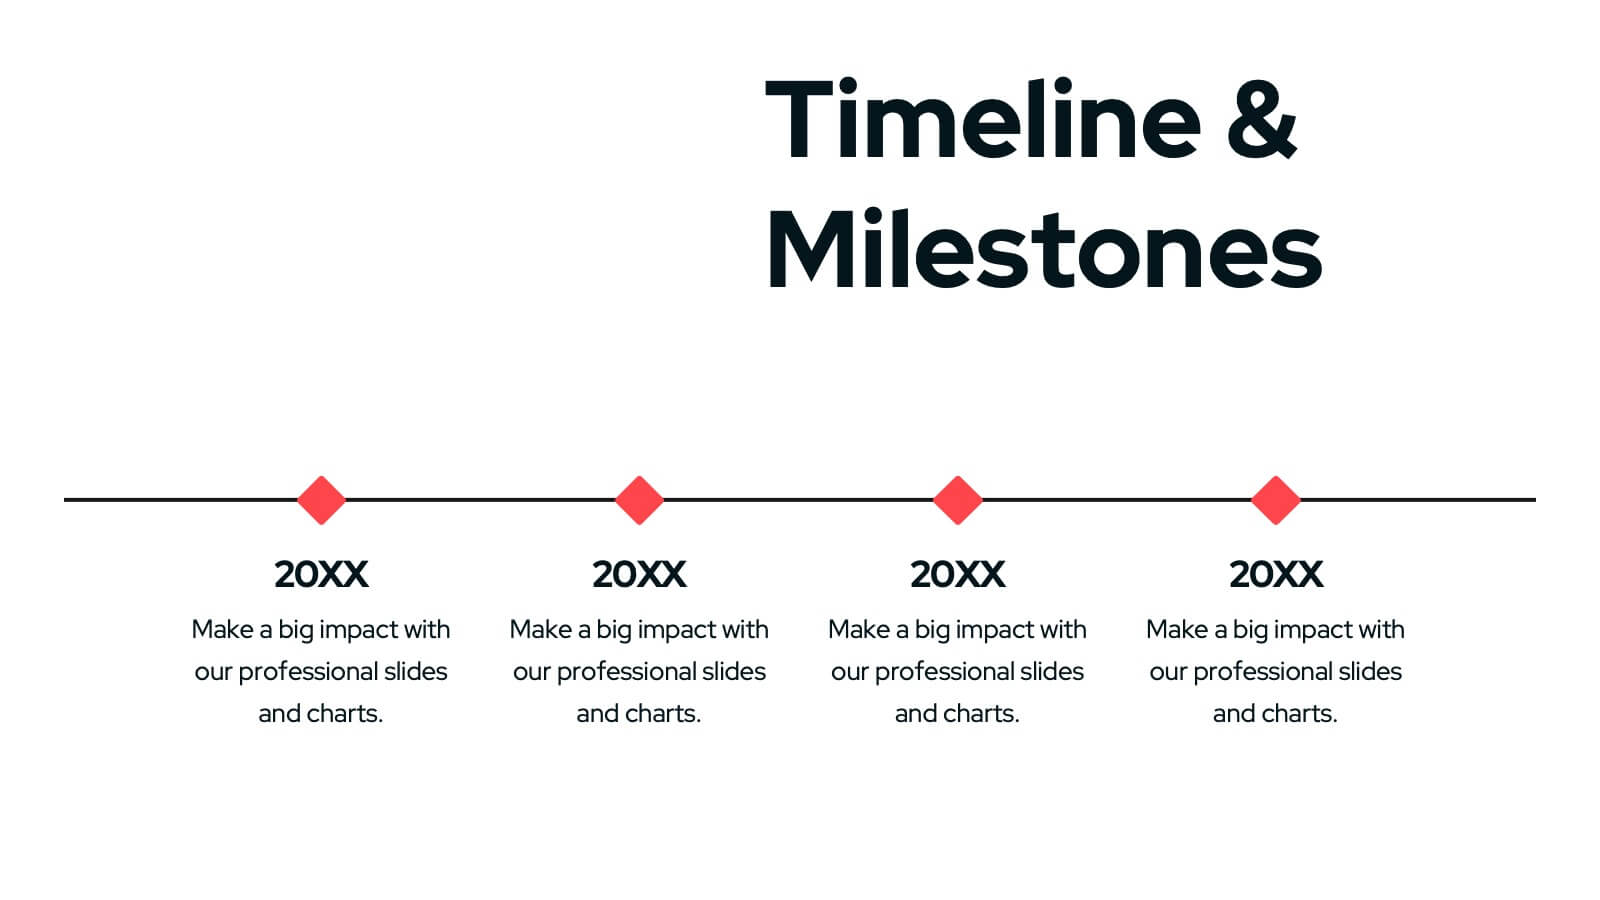
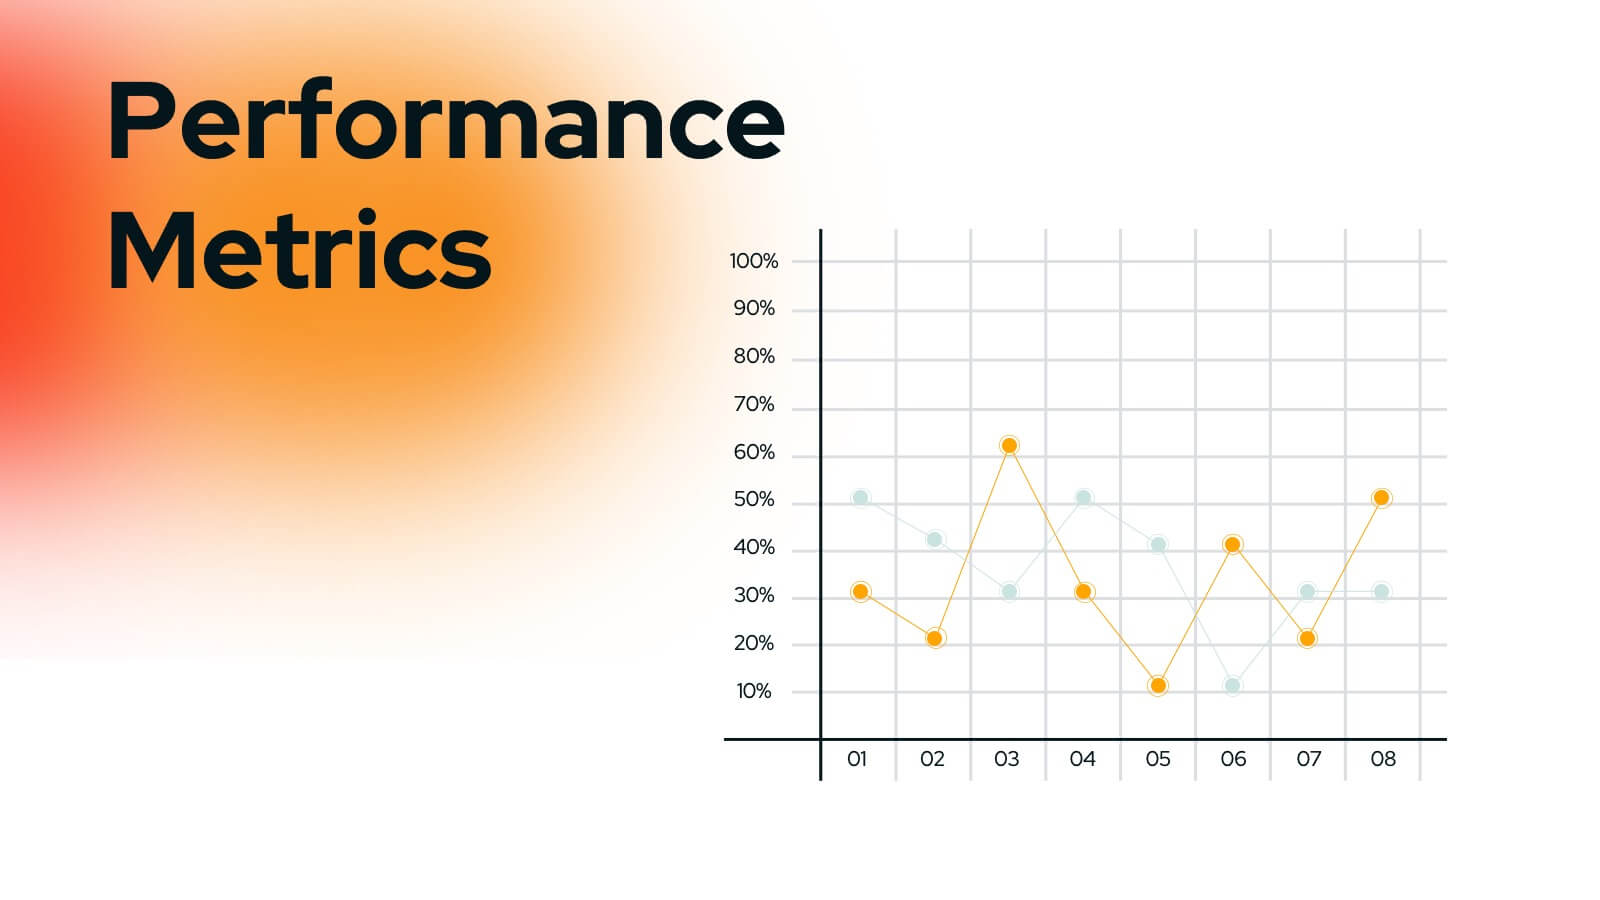
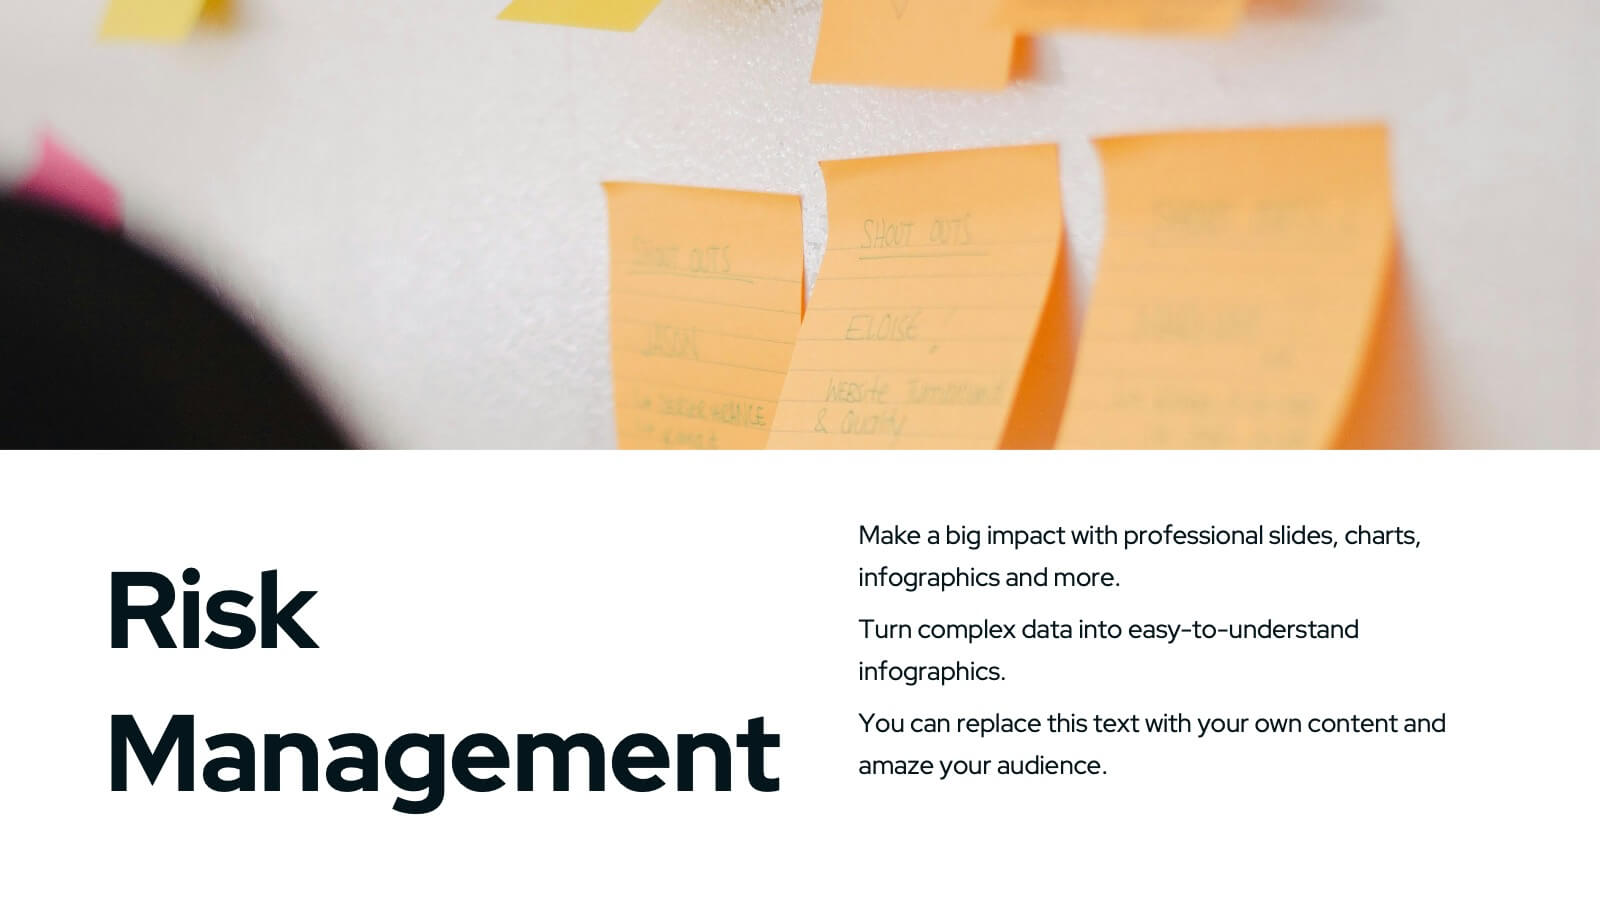
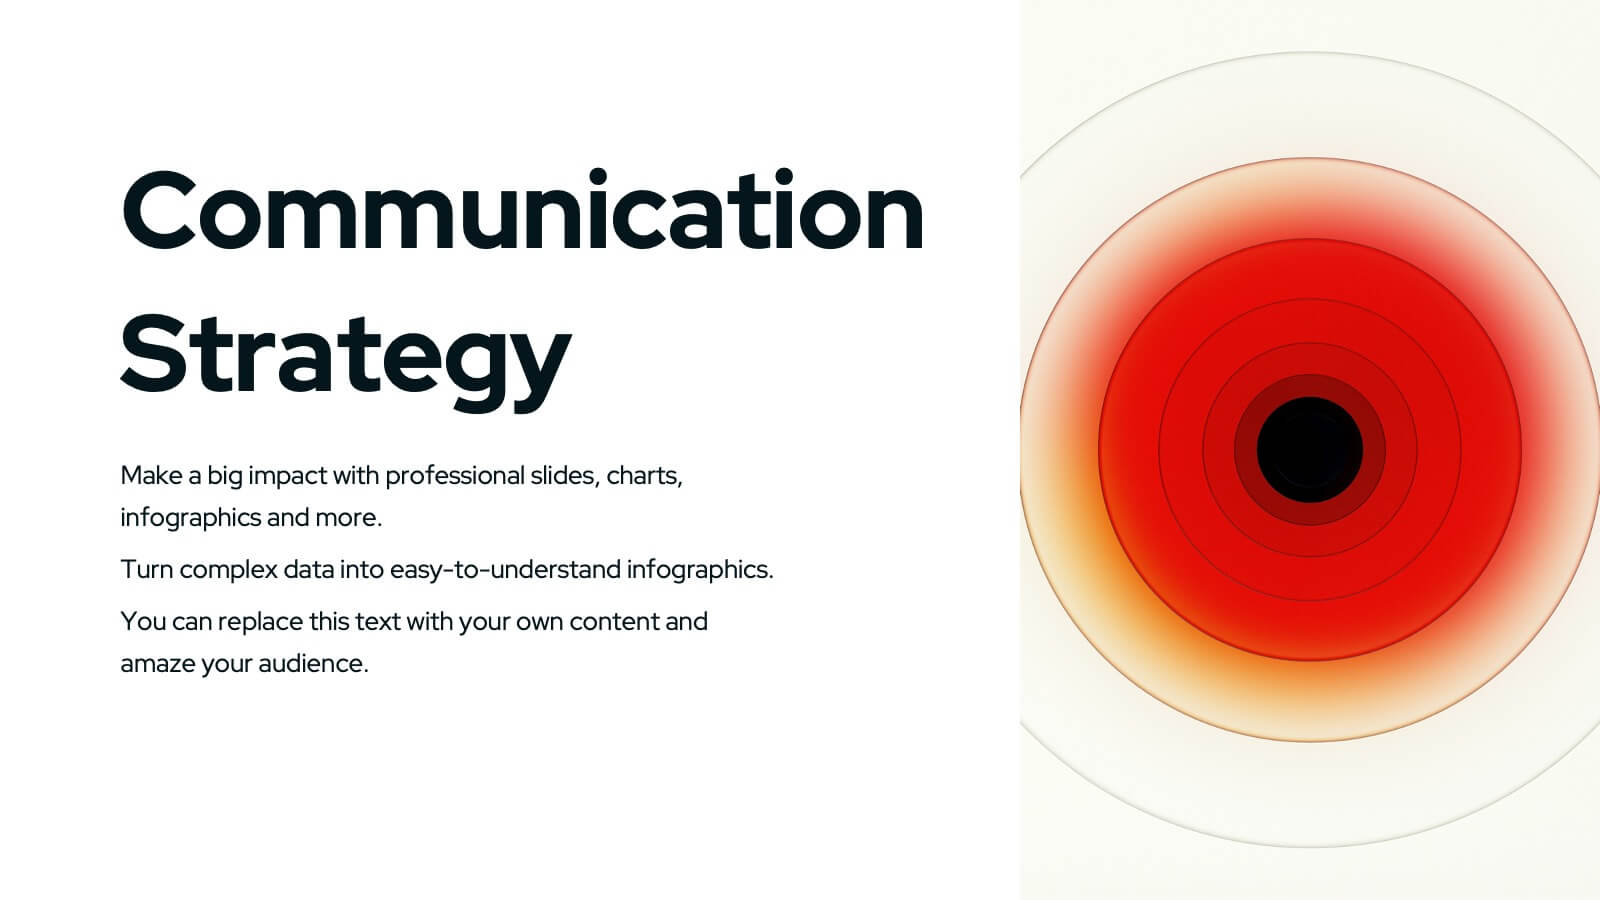
Wyrm Marketing Strategy Plan Presentation
Unleash the power of your marketing strategy with this bold and dynamic presentation template! Perfect for covering everything from landscape analysis and target audience identification to performance metrics and risk management. This template helps guide your audience through key challenges, SWOT analysis, and strategic initiatives with clarity and impact. Compatible with PowerPoint, Keynote, and Google Slides for effortless and engaging presentations.


6 diapositivas
End-to-End Value Chain Process Presentation
Visualize every link in your process with the End-to-End Value Chain Process Presentation. This modern chain diagram helps illustrate each stage of your business or production flow—from initial input to final output. It's ideal for strategy, supply chain, and operational planning. Fully editable in PowerPoint, Keynote, Canva, or Google Slides.


5 diapositivas
Healthcare and Wellness Infographics
Healthcare and wellness are interrelated concepts that focus on promoting and maintaining the physical, mental, and emotional well-being of individuals and communities. These vertical infographics are designed to showcase essential healthcare and wellness information. This infographic provides a comprehensive overview of various topics related to healthcare, promoting a better understanding of key concepts and practices that contribute to overall well-being. These infographics offers a series of health tips and guidelines covering different aspects of wellness, such as nutrition, physical activity, mental health, and stress management.


2 diapositivas
Clean Cover Page Presentation
Start your presentation with a bold first impression using this sleek and minimalistic cover design. Perfect for business proposals, reports, or client pitches, this layout draws attention with clean typography and a strong visual hierarchy. Fully editable and easy to personalize in PowerPoint, Keynote, and Google Slides for smooth customization.


5 diapositivas
Business Figures and Key Numbers Overview Presentation
Present your data with clarity using this key-themed slide layout. Ideal for outlining five important metrics, business highlights, or strategic figures. The bold numerical format and clean design make your content easy to follow. Fully customizable in Canva, perfect for professional reports, pitches, and data-driven presentations.


22 diapositivas
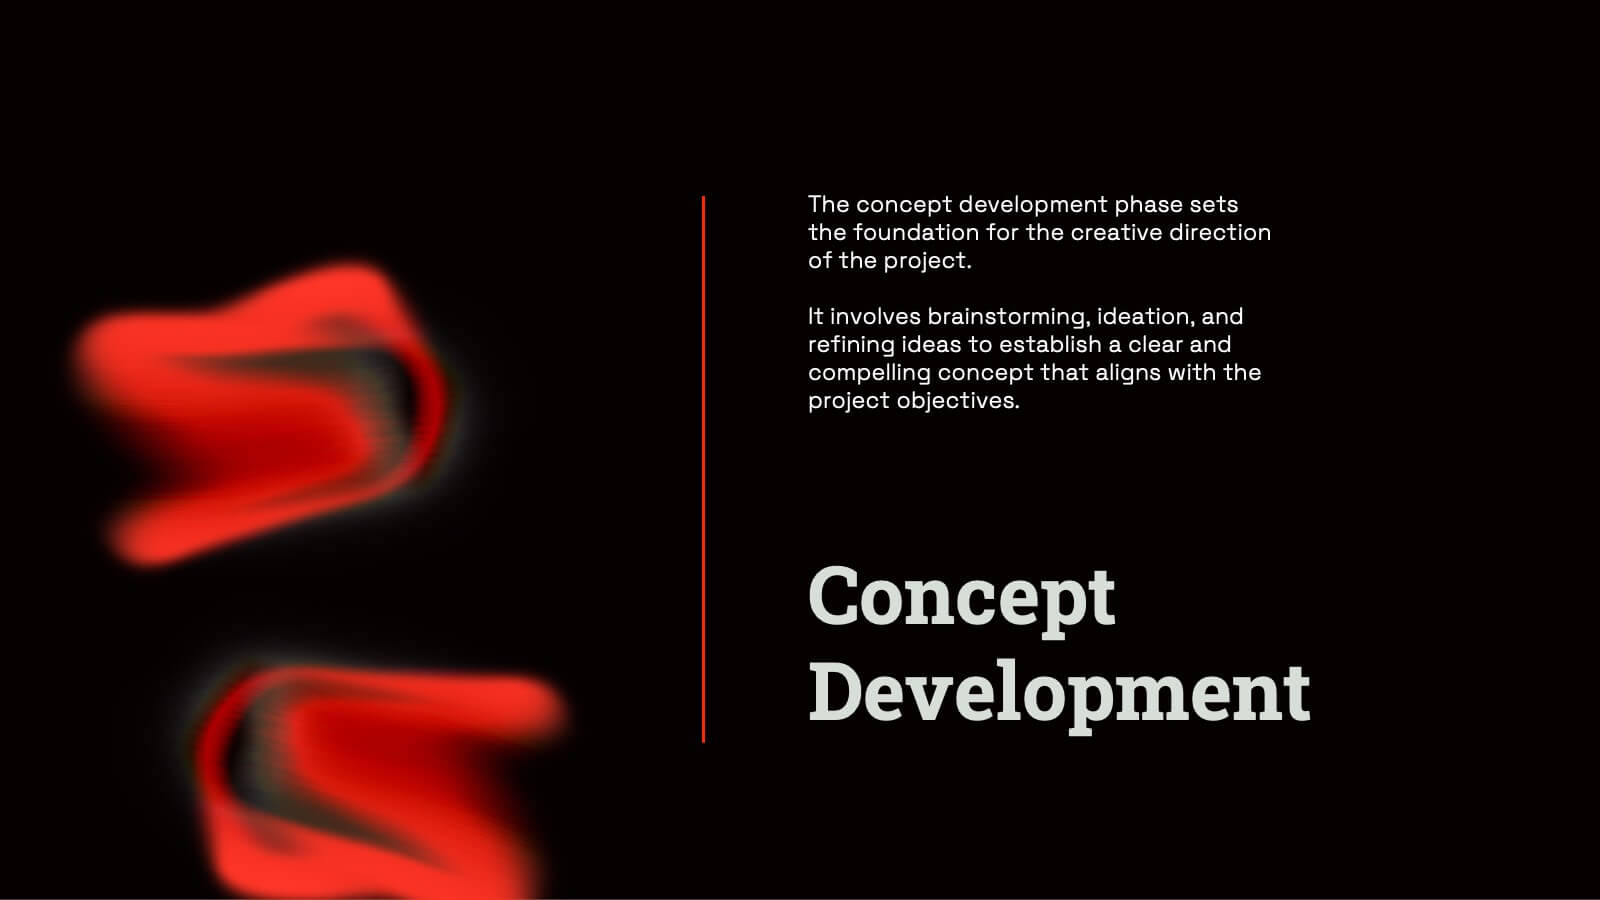
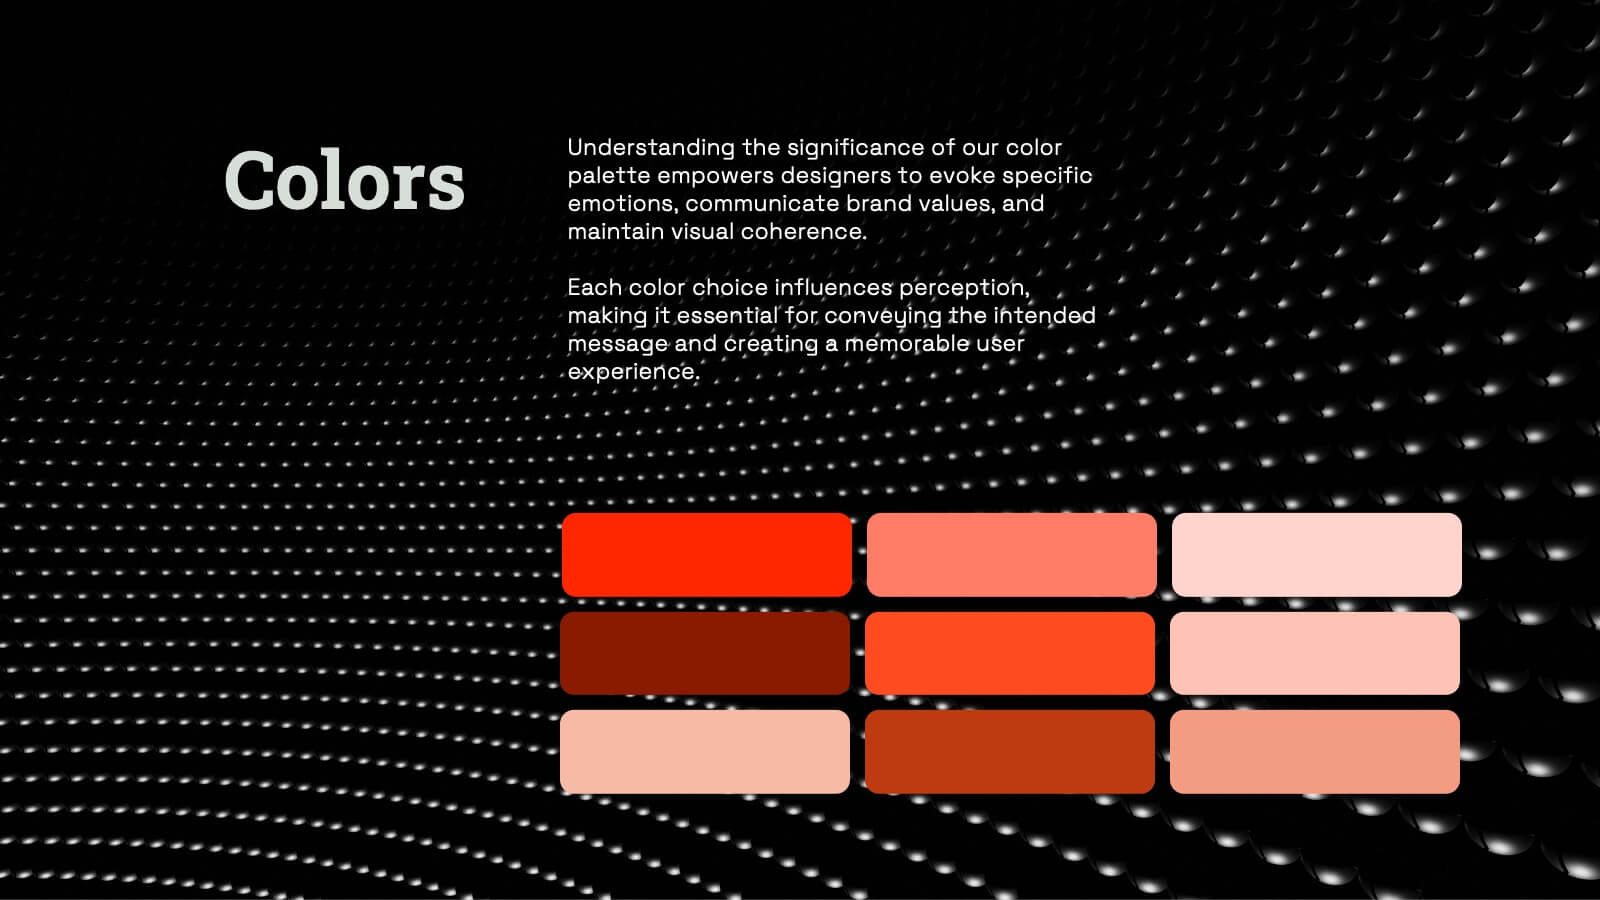
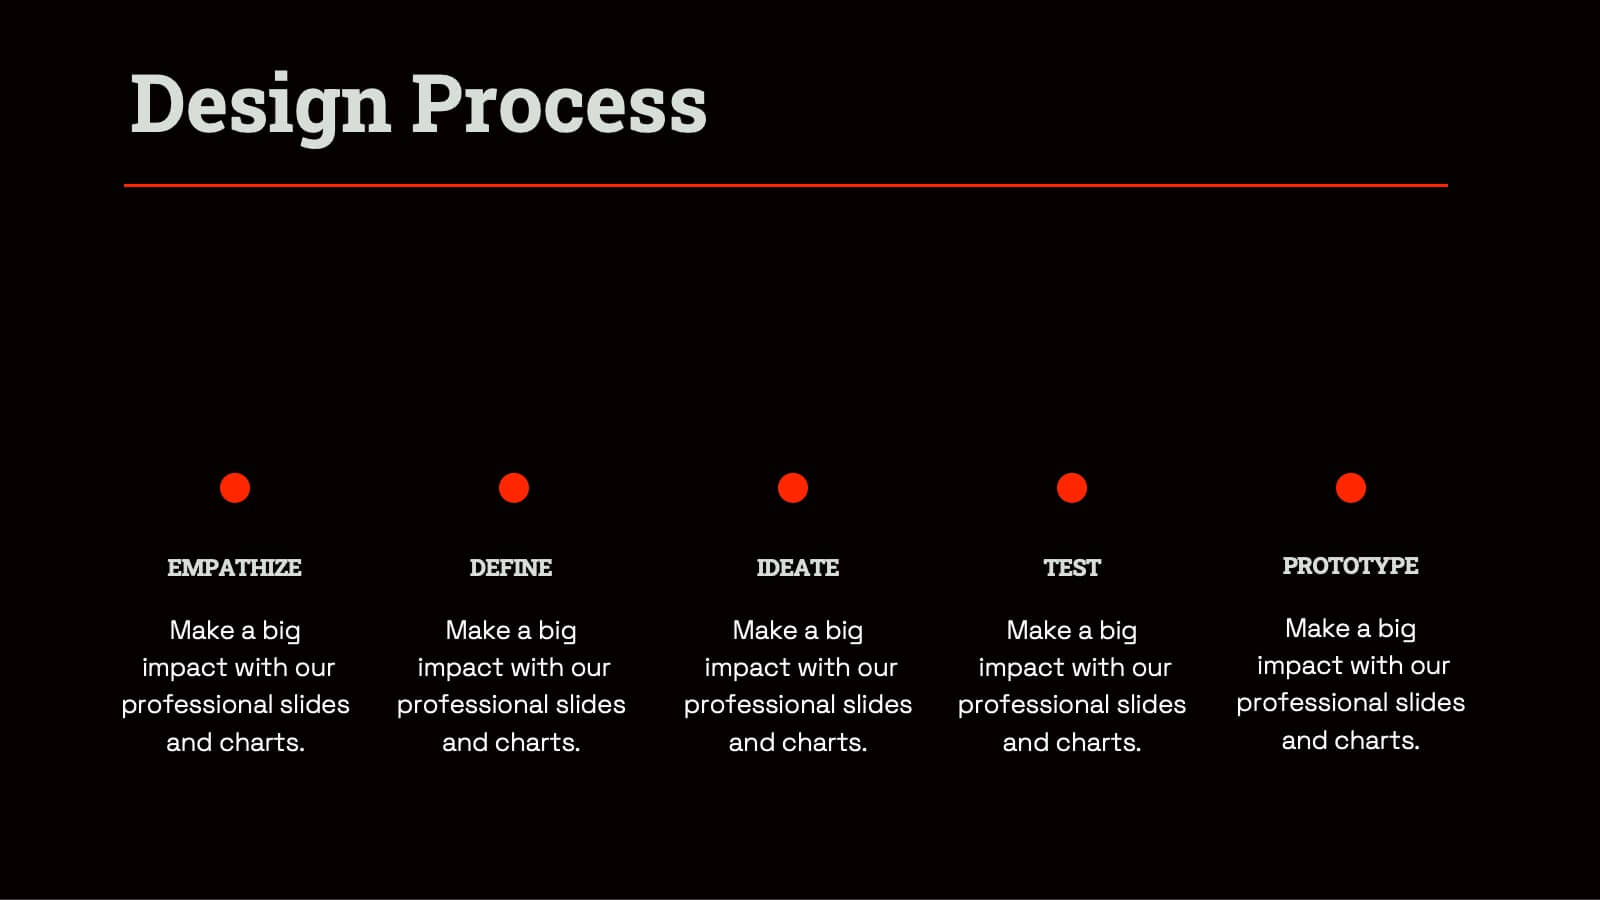
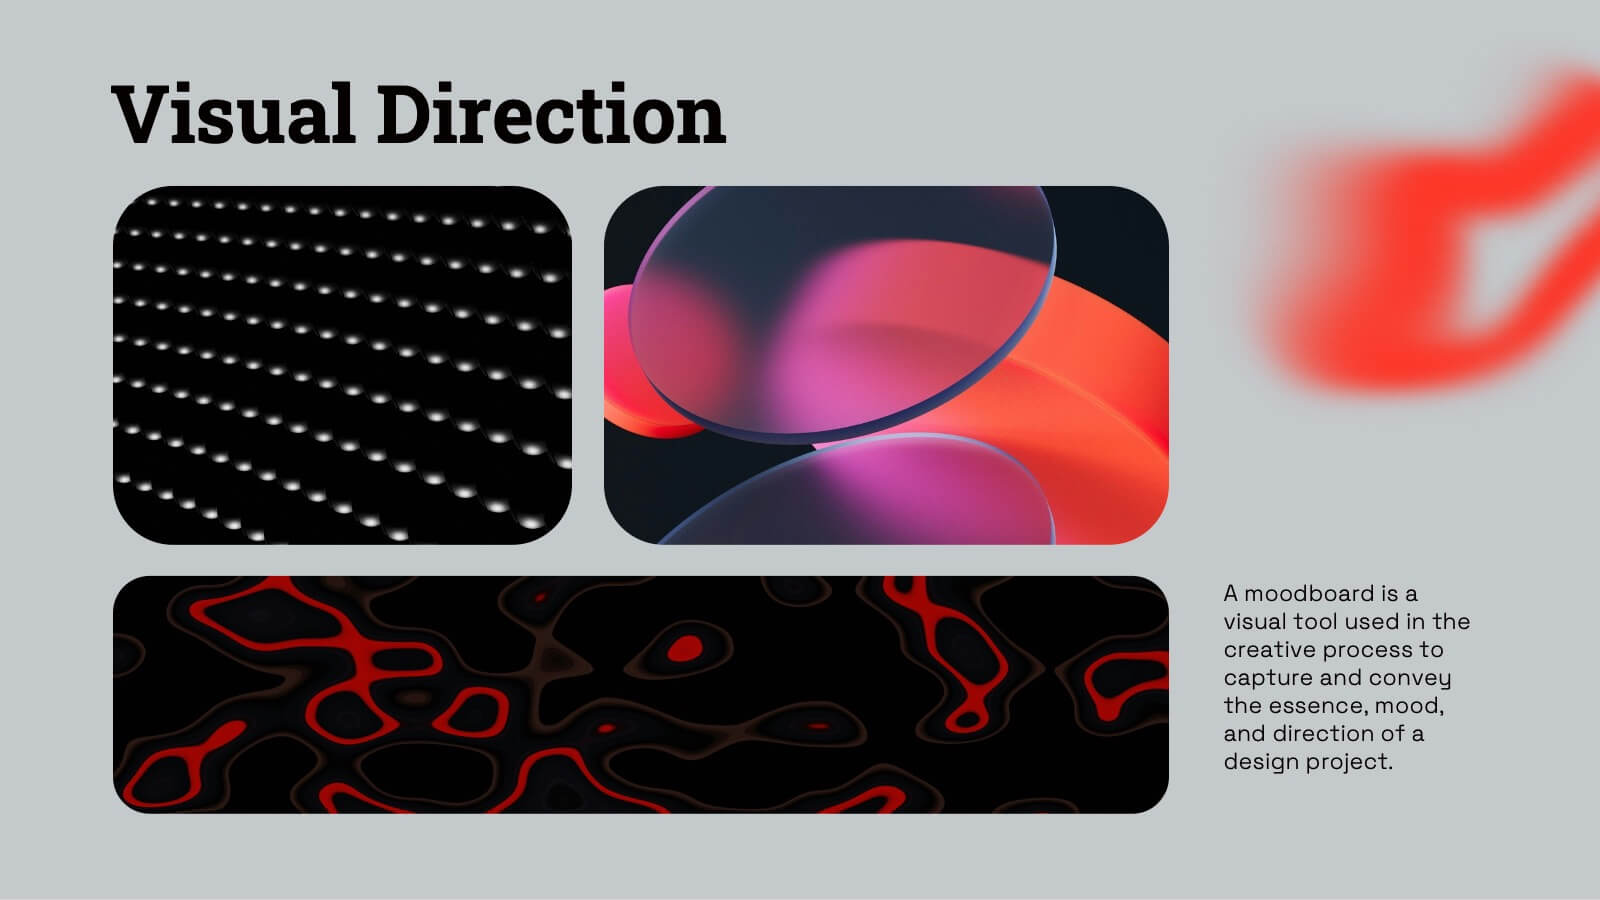
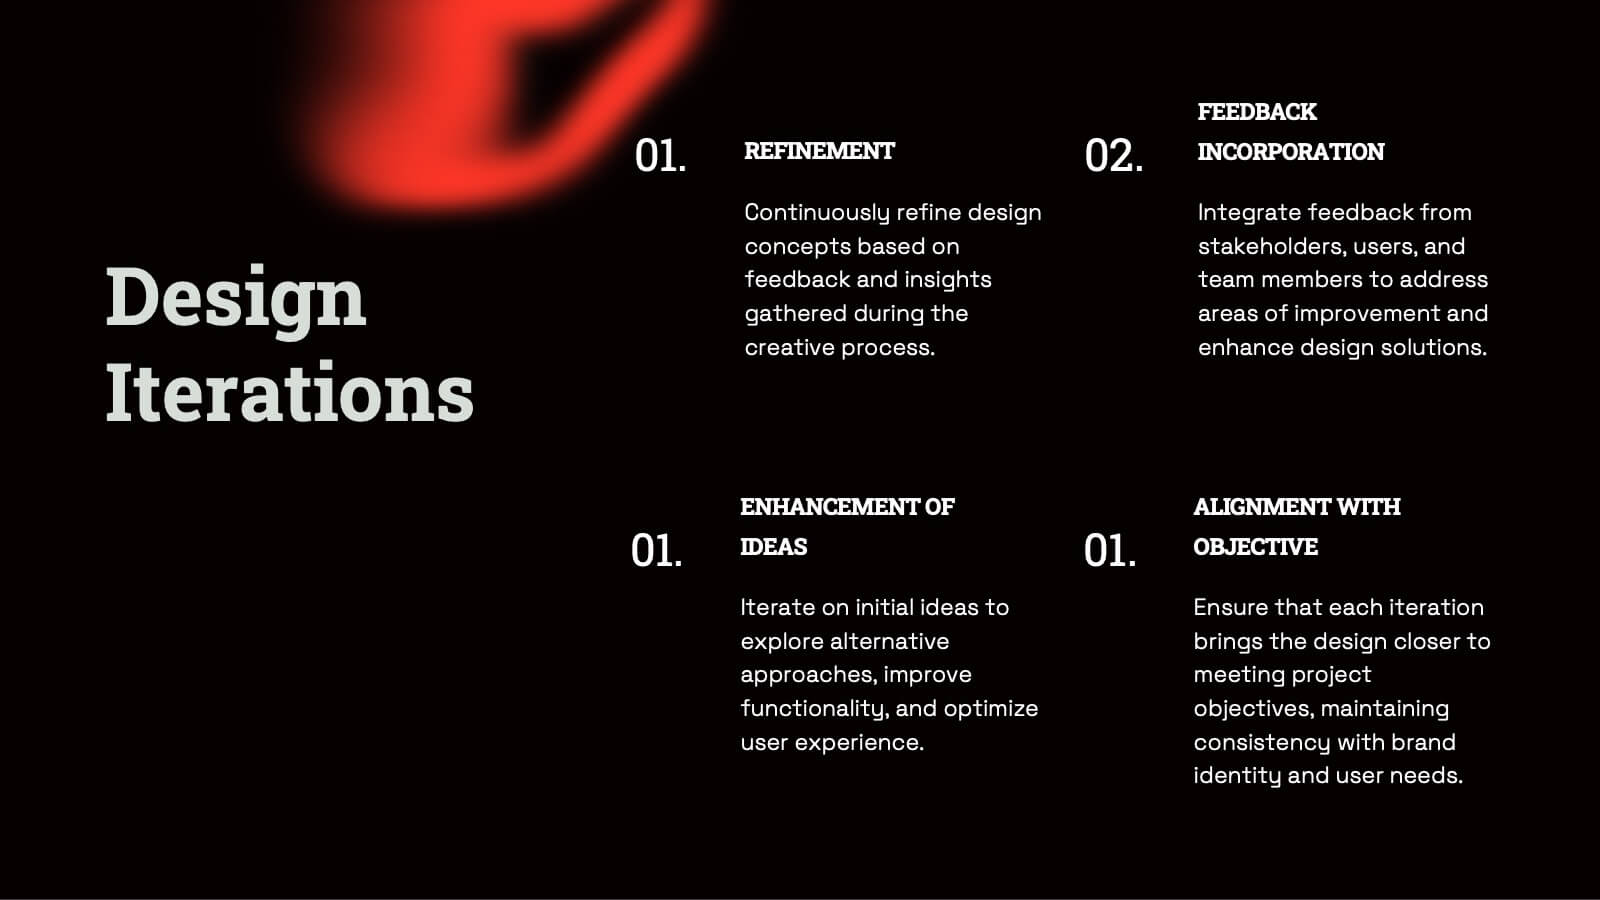
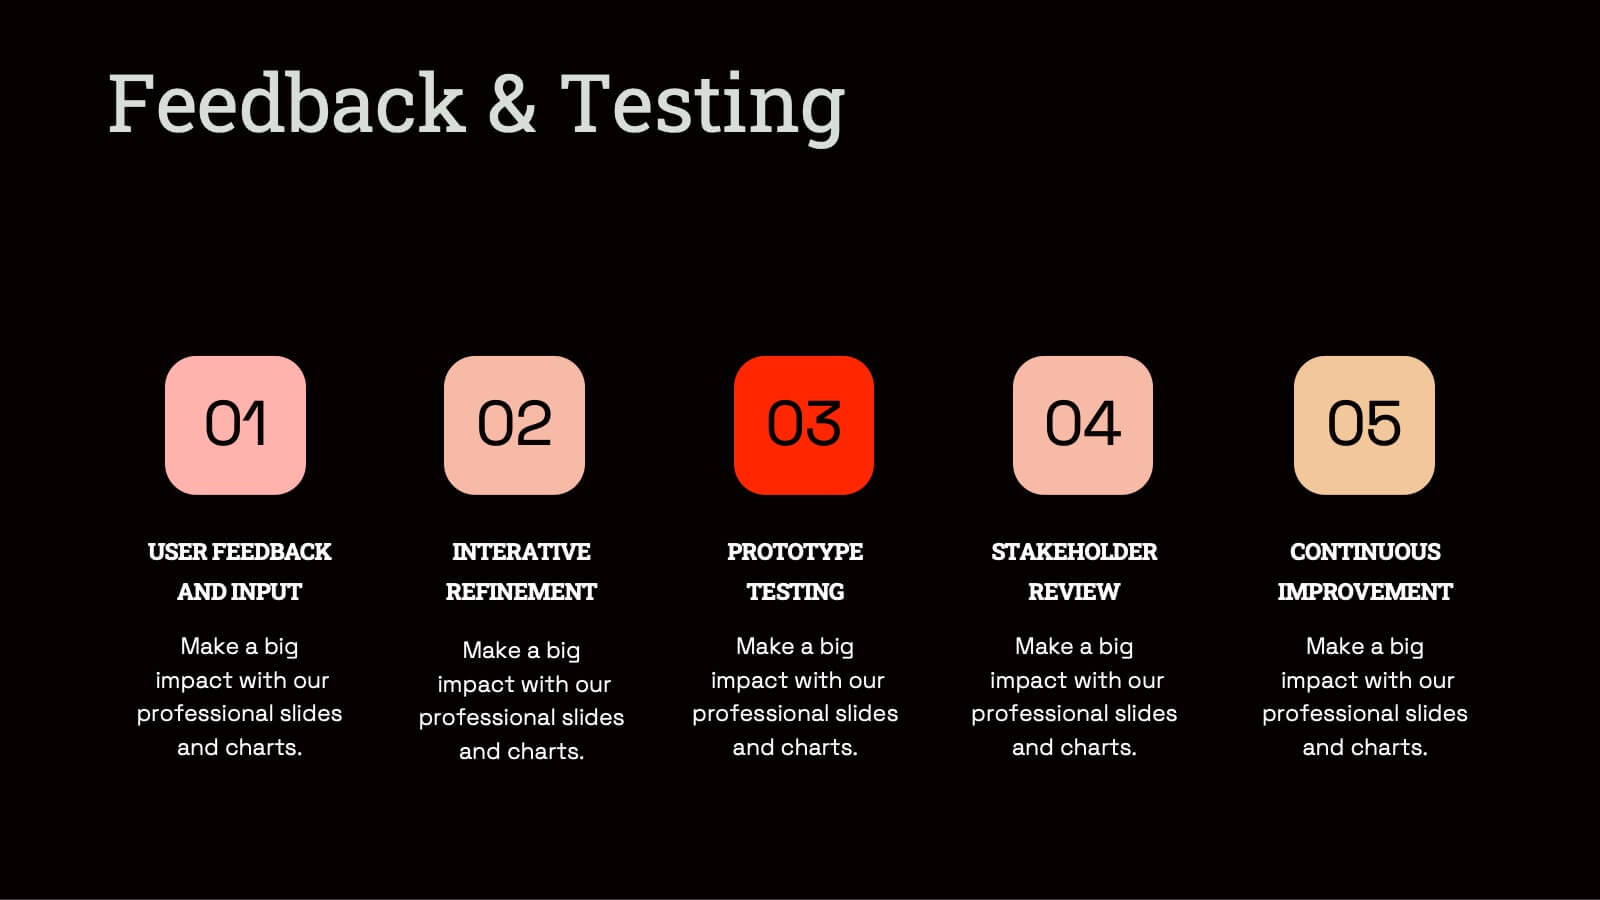
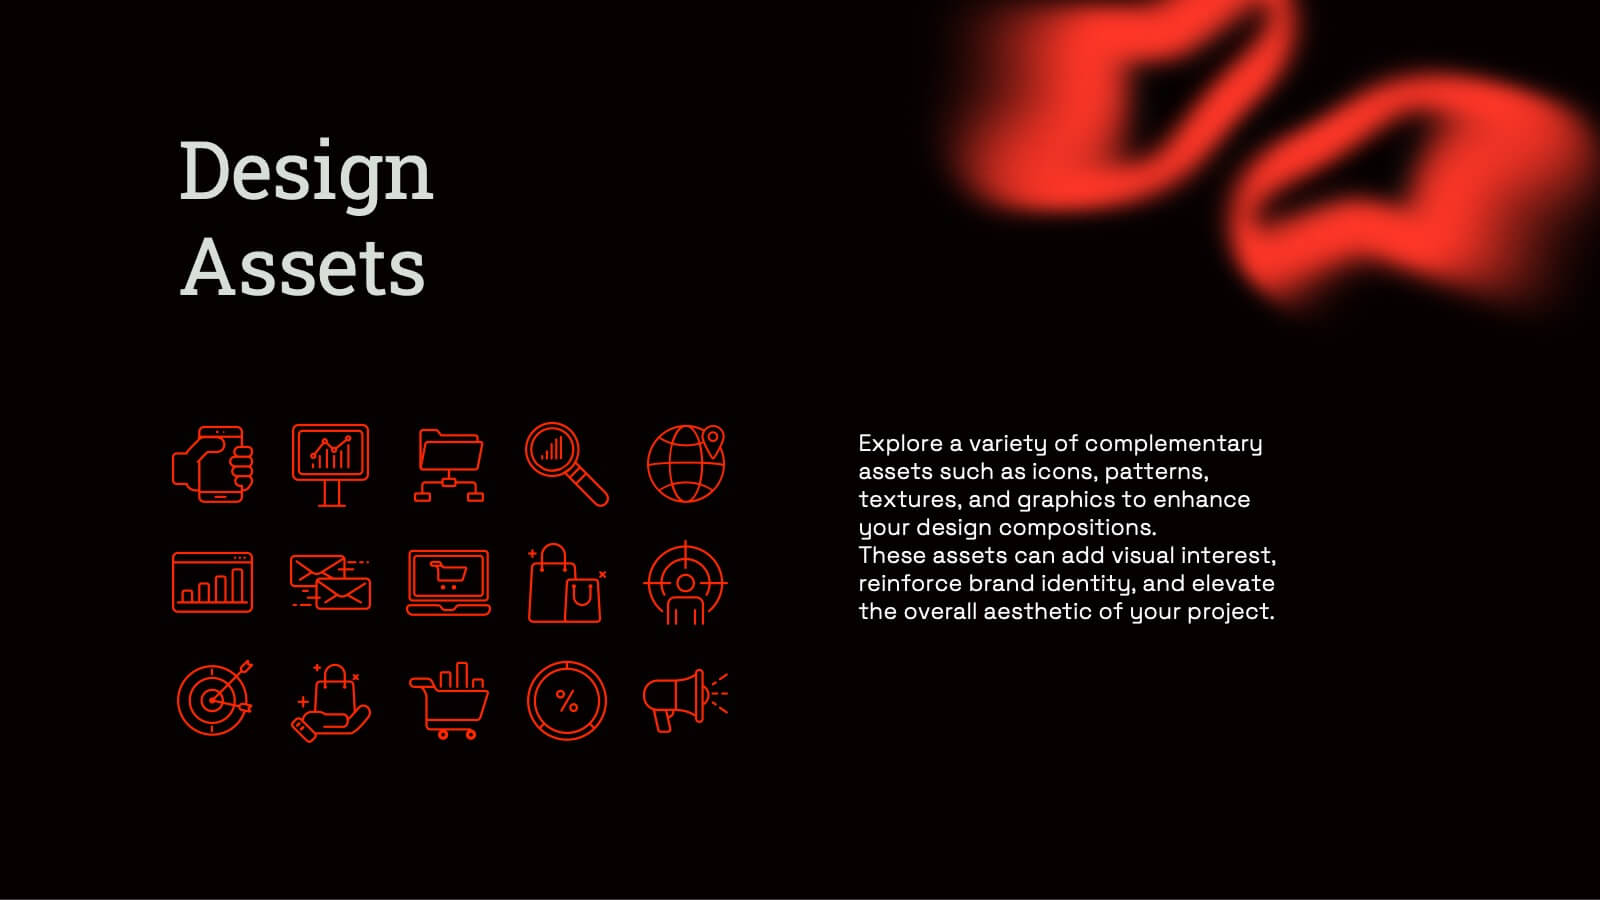
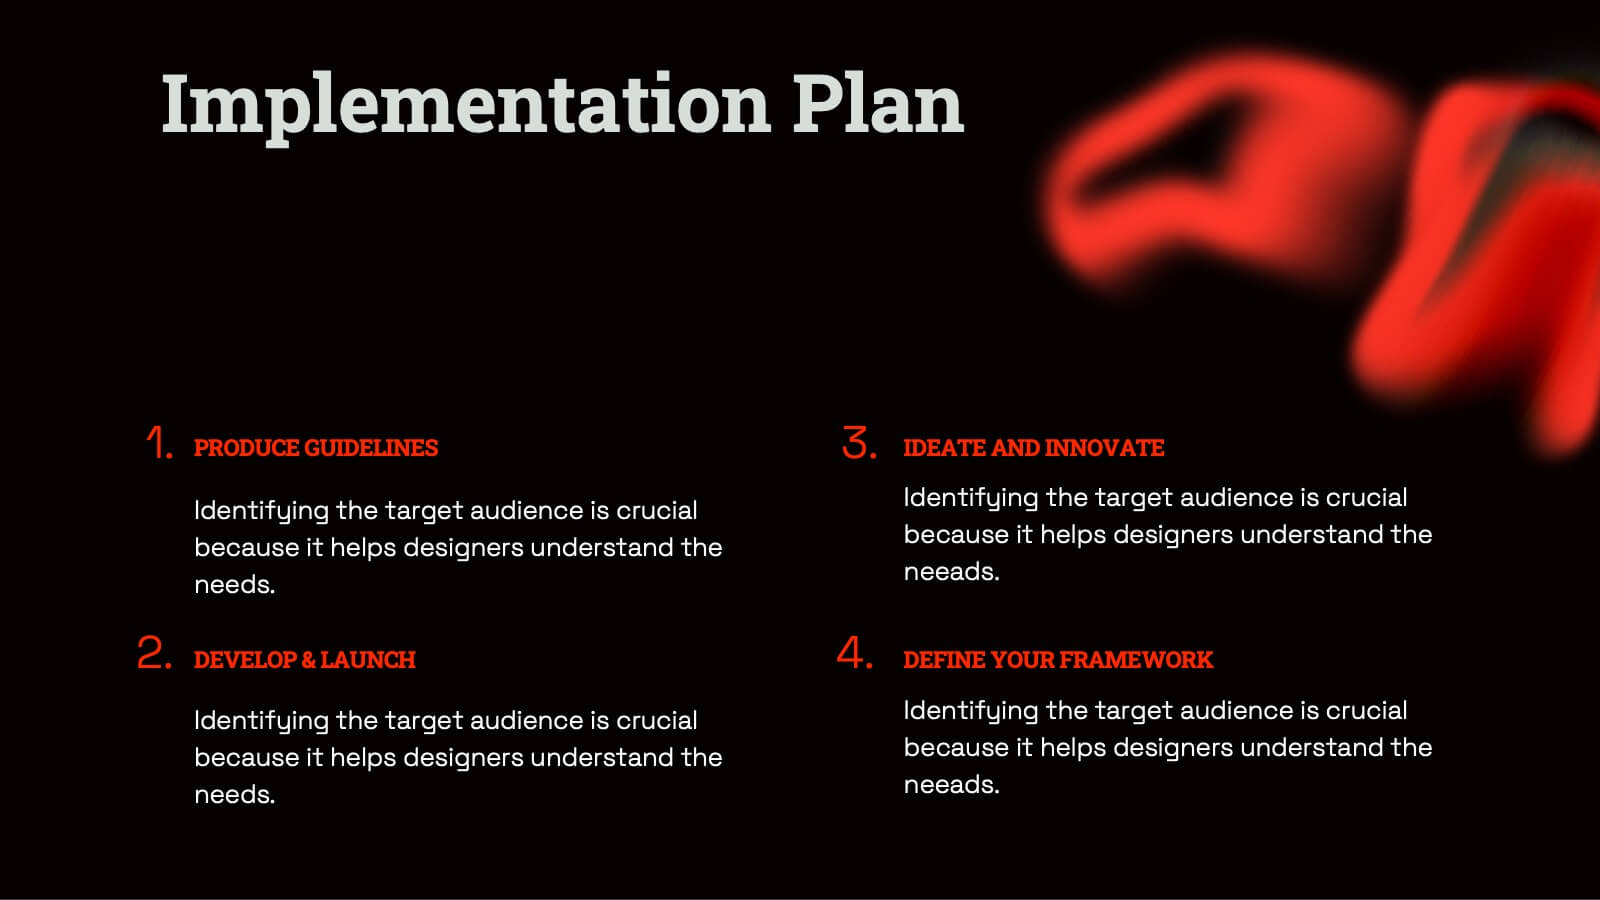
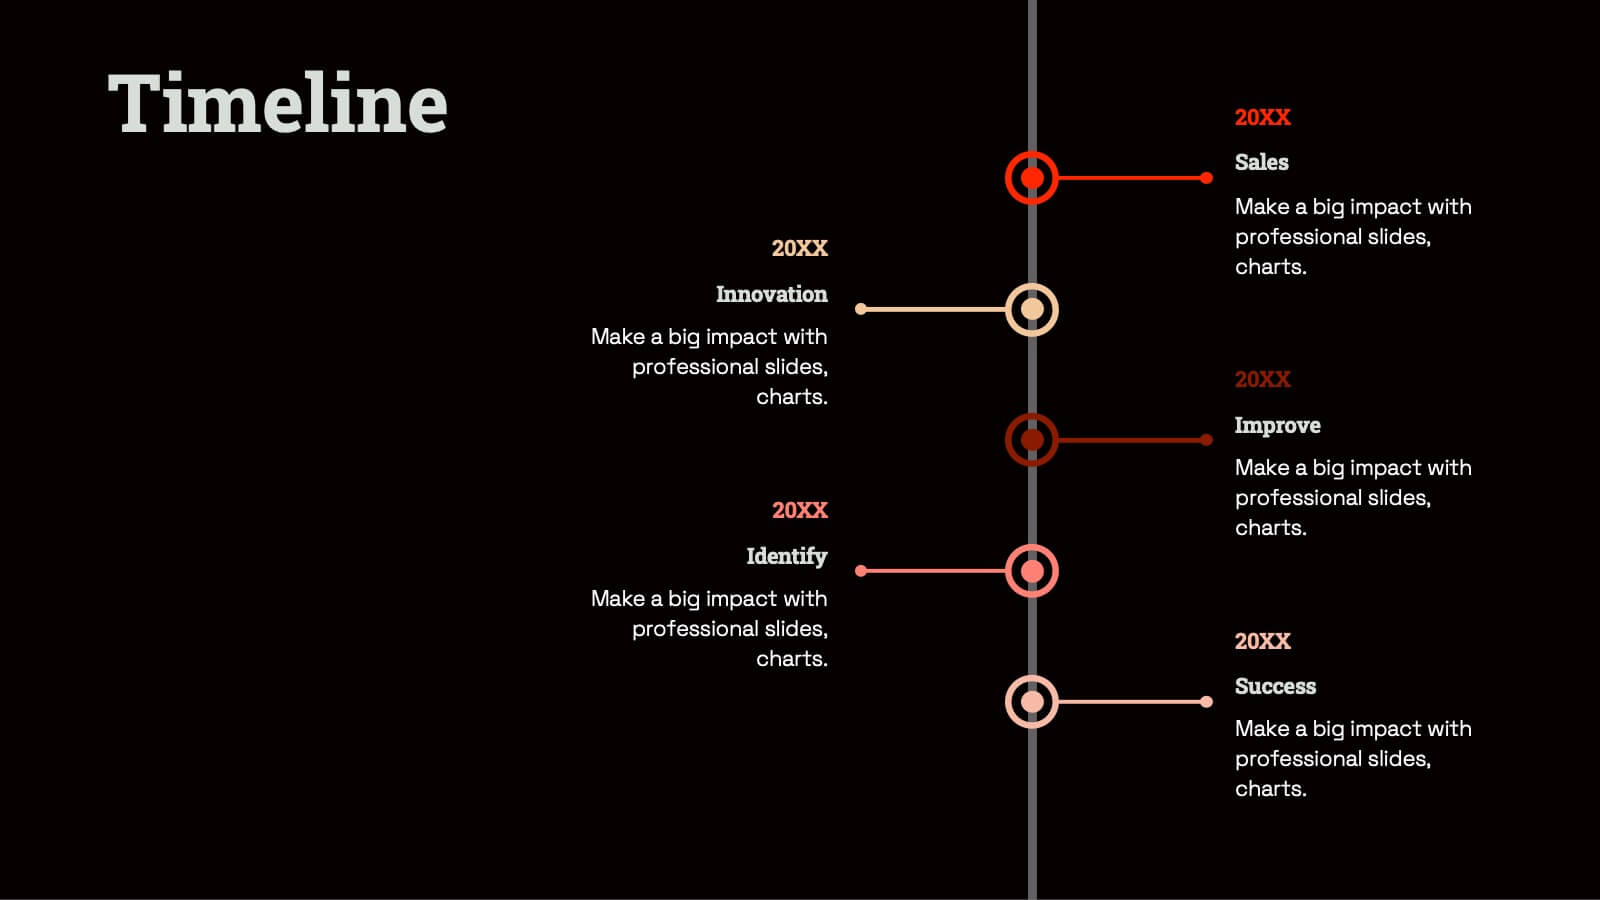
Radiant Graphic Design Project Plan Presentation
Unleash your creativity with this bold and dynamic graphic design project plan template! Perfect for showcasing design elements, textures, and typography, this template guides you through every phase, from concept development and prototyping to feedback and final presentations. Ideal for visual direction and design asset management, it’s fully compatible with PowerPoint, Keynote, and Google Slides for seamless use.


12 diapositivas
Predictive Analytics with Big Data Presentation
Unleash the power of Predictive Analytics with Big Data using this dynamic presentation template. Designed to highlight data-driven insights, AI-powered forecasting, and strategic decision-making, this template is ideal for data scientists, business analysts, and IT professionals. Fully customizable and available for PowerPoint, Keynote, and Google Slides, it ensures a visually compelling and structured presentation.


6 diapositivas
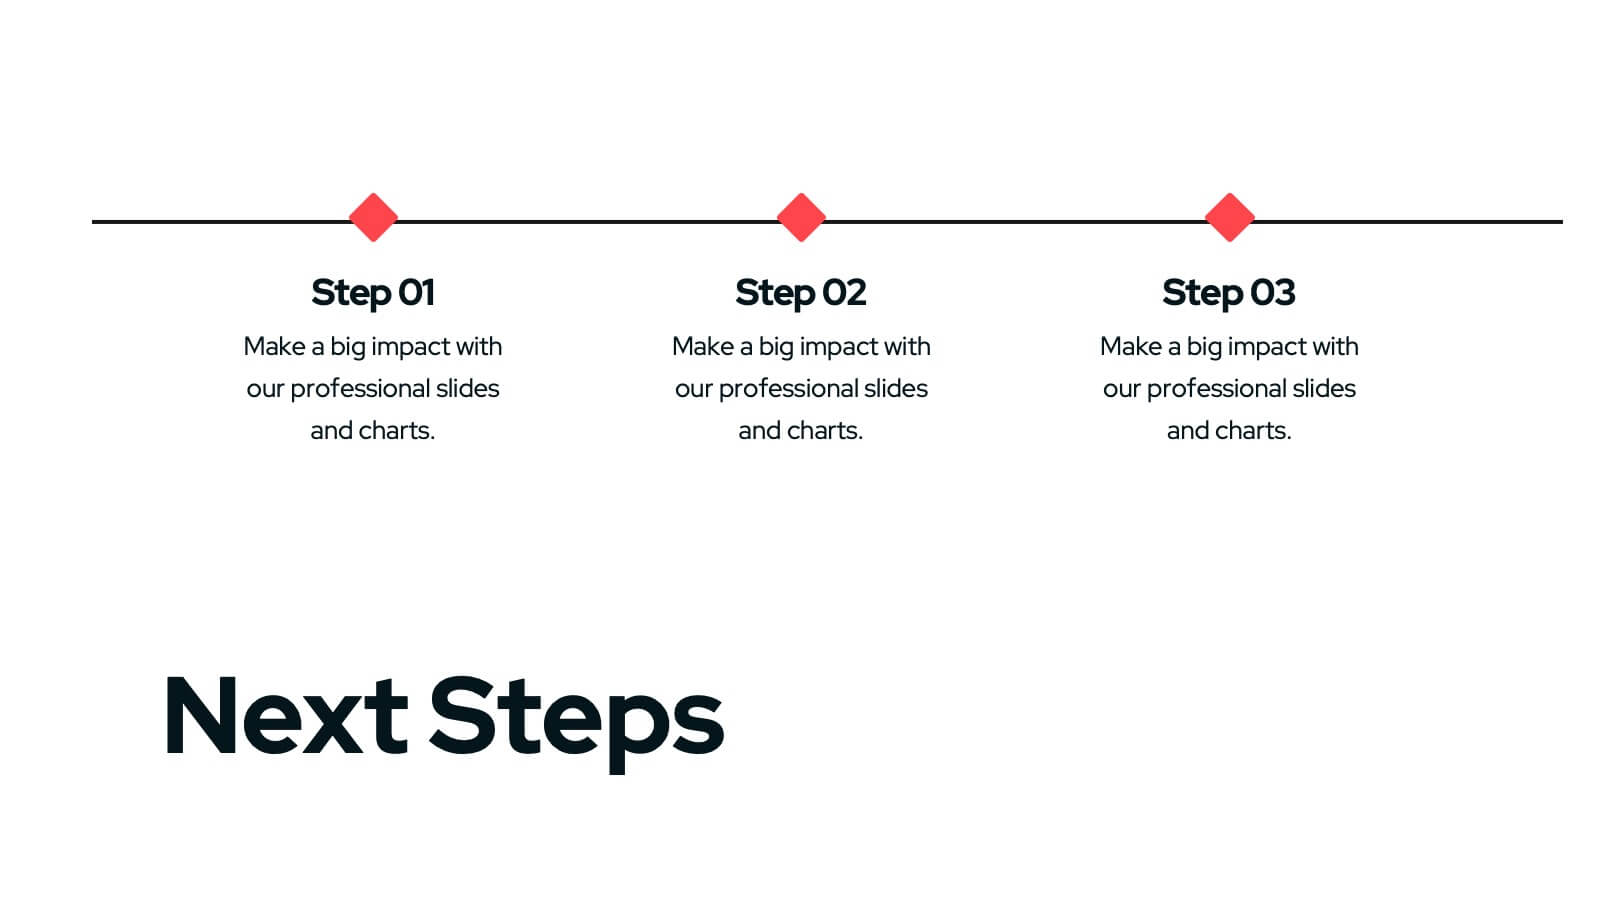
RAPID Roles and Responsibilities Slide Presentation
Make teamwork crystal clear with a structured chart that defines who does what and when. This organized layout helps map decision-making roles, streamline collaboration, and prevent confusion in complex projects. Easy to edit and ready to use, it’s fully compatible with PowerPoint, Keynote, and Google Slides for smooth customization.


7 diapositivas
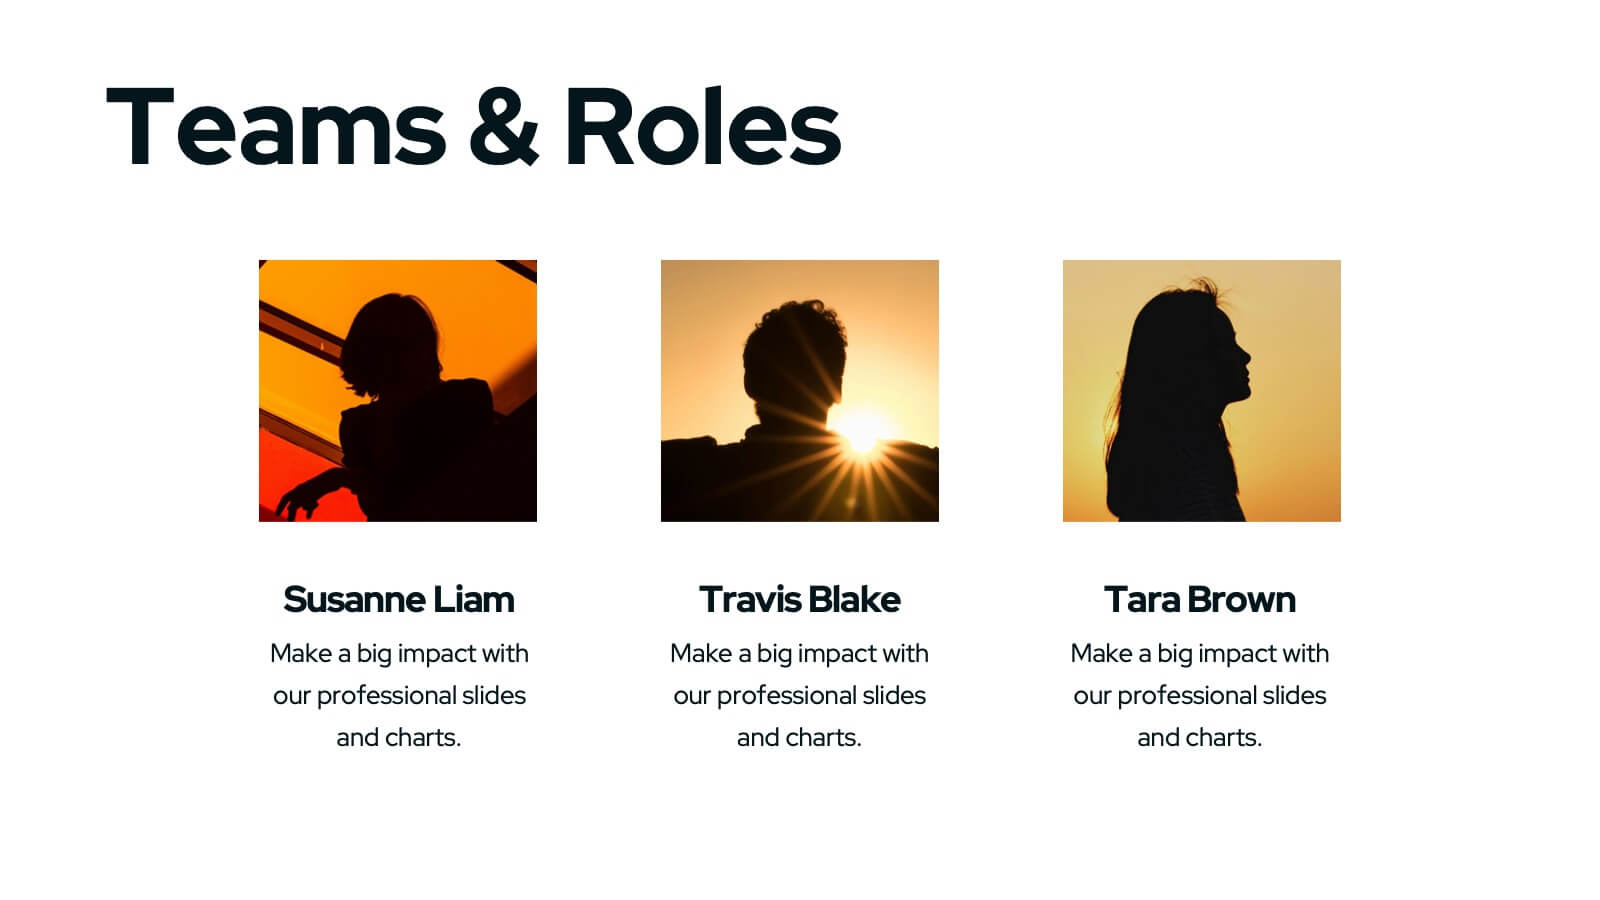
Team Member Overview Slide Presentation
Bring your team’s story to life with a clean, engaging layout that makes every role instantly clear. This presentation helps you introduce key members, outline responsibilities, and highlight individual strengths in a simple, structured way that’s easy for any audience to follow. Fully compatible with PowerPoint, Keynote, and Google Slides.


6 diapositivas
Product Pricing Table Comparison
Make your pricing pitch clear and compelling with this vibrant comparison table template designed for easy decision-making. Whether you're showcasing subscription plans, service tiers, or product bundles, this slide helps highlight key features and value differences at a glance. Fully editable in PowerPoint, Keynote, and Google Slides.


7 diapositivas
Governance Infographics Presentation Template
Our Governance Infographic is designed to present complex information in an easy-to-understand format that is accessible to a wide audience. This template gives you the opportunity to create an infographic that is easy on the eye, but thorough and detailed enough to make sure all the points are covered. This template includes 7 slides that present a comprehensive framework for monitoring and evaluating a company's governance, risk management, and compliance programs. Packed with great content, this presentation tells the story of your governance system. Get started easily by adding your text!