


Características


¿Tienes alguna pregunta?
Recomendar


4 diapositivas
Strategic Planning Spider Diagram
Visualize strategic goals with clarity using the Strategic Planning Spider Diagram Presentation. This template leverages a radial layout to assess and compare up to four focus areas, such as vision alignment, resource allocation, stakeholder engagement, and performance metrics. The spider chart structure helps you map gaps or growth across each strategic axis. Ideal for planning sessions, board reviews, or team briefings. Fully customizable in PowerPoint, Keynote, and Google Slides.


5 diapositivas
Empathy to Ideation Process Framework Presentation
Visualize the journey from understanding user needs to generating innovative ideas with the Empathy to Ideation Process Framework Presentation. This slide features a side-profile silhouette and five clear, horizontal stages, each representing a key step in design thinking. Ideal for innovation workshops, UX strategy sessions, or educational use. Fully editable in Canva, PowerPoint, Google Slides, and Keynote.


7 diapositivas
Process Table Infographic
Unveil the intricacies of any process with our process table slide infographic. Situated on a clean white base, the design flourishes with a spectrum of green for growth, purple for innovation, blue for consistency, and orange. With its detailed infographics, symbolizing icons, and flexible image placeholders, this template offers a structured representation of step-by-step processes, from initiation to completion. Perfectly calibrated for Powerpoint, Keynote, or Google Slides. An indispensable tool for business analysts, operations managers, educators, or anyone looking to streamline and visualize processes.


7 diapositivas
Team Meeting Infographic Presentation
Are you looking for a fun and engaging way to present your next business meeting? Look no further than our new team meeting infographics template! With our template, you can add a touch of creativity to your presentation with a colorful illustration infographics. Whether you're student making a business presentation or a manager looking to engage your workers in your next meeting. With these simple easy to use infographics, you'll be able to create a top-quality presentation in no time with great engaging visuals. So why wait? Take your team meetings to the next level with our amazing template today!


26 diapositivas
Corporate and Investment Company Profile Presentation
A corporate and investment company profile is a comprehensive document that provides detailed information about a company engaged in corporate and investment services. This presentation template is an effective way to introduce your company's services, capabilities, and track record to your audience. This template can be used to reflect your company's professionalism, expertise, and value proposition. This presentation is fully customizable and compatible with Powerpoint, Keynote, and Google Slides. This allows you to incorporate your company logo, brand colors, and relevant images that reflect your corporate identity.


7 diapositivas
Business Decision-Making Questions Presentation
Streamline your decision-making process with this engaging and structured presentation slide. Featuring a lightbulb and question mark design, this template effectively illustrates problem-solving and strategic choices in a professional and visually appealing way. Ideal for business strategy, consulting, and brainstorming sessions, it is fully editable, allowing you to customize text, colors, and layout to fit your needs. Compatible with PowerPoint, Keynote, and Google Slides for seamless use.


5 diapositivas
Real-Life Case Study Analysis Presentation
Turn data and insights into compelling stories that capture real business impact. This clean, professional layout is perfect for analyzing real-world examples, comparing strategies, and presenting key takeaways. Easy to customize and visually balanced, it’s fully compatible with PowerPoint, Keynote, and Google Slides for seamless use across platforms.


5 diapositivas
Aviation Industry Market Analysis
Break down key metrics in the aviation sector with this sleek, aircraft-themed layout. Ideal for highlighting five data points or insights, each icon aligns with a section of the airplane to reinforce structure and clarity. Perfect for presentations on industry trends, airline strategies, or market performance. Fully editable in PowerPoint, Keynote, and Google Slides.


5 diapositivas
Green Business Sustainability Strategy
Showcase your eco-conscious roadmap with this Green Business Sustainability Strategy presentation. Featuring a 5-step, curved timeline design with nature-inspired icons, it’s perfect for environmental initiatives, CSR planning, or ESG strategy. Easily adaptable in PowerPoint, Keynote, or Google Slides for a polished, professional message.


20 diapositivas
Nightshade Design Portfolio Presentation
The Design Portfolio Presentation Template offers 20 slides to showcase your creative work, including design briefs, elements, processes, and feedback. Perfect for professionals to highlight projects with a modern, vibrant layout. Fully editable and compatible with PowerPoint, Keynote, and Google Slides.

20 diapositivas
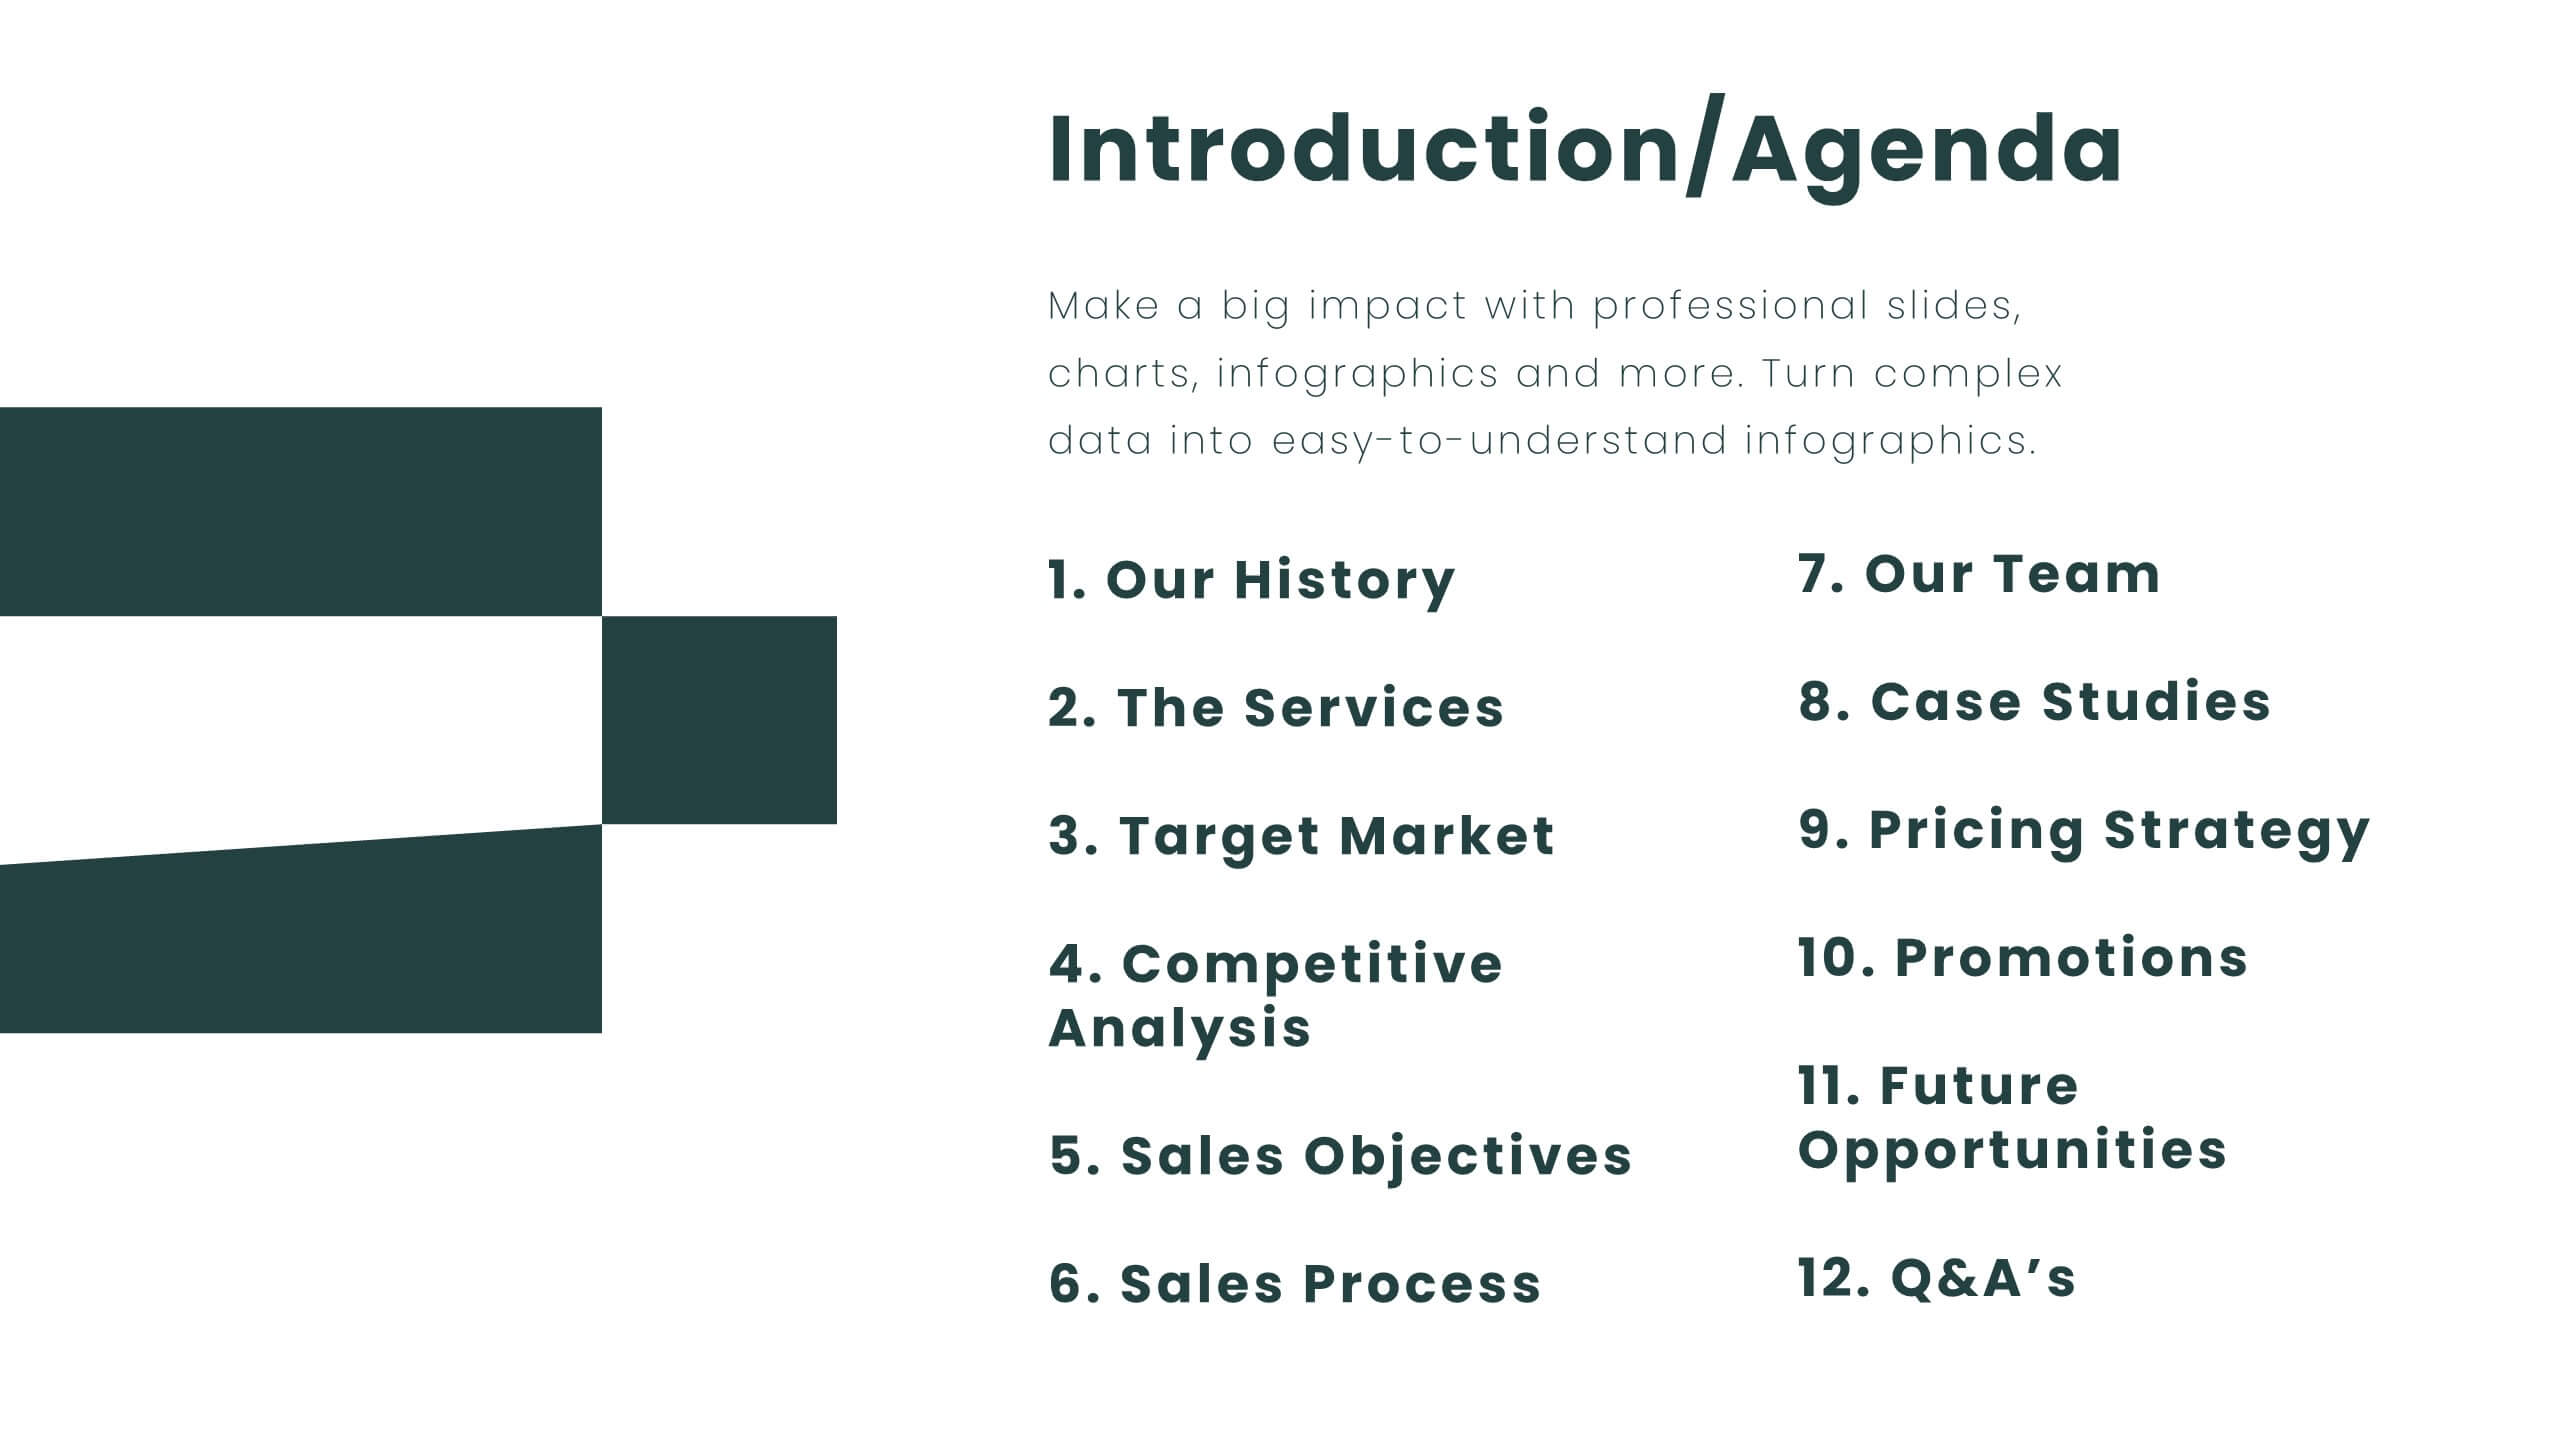
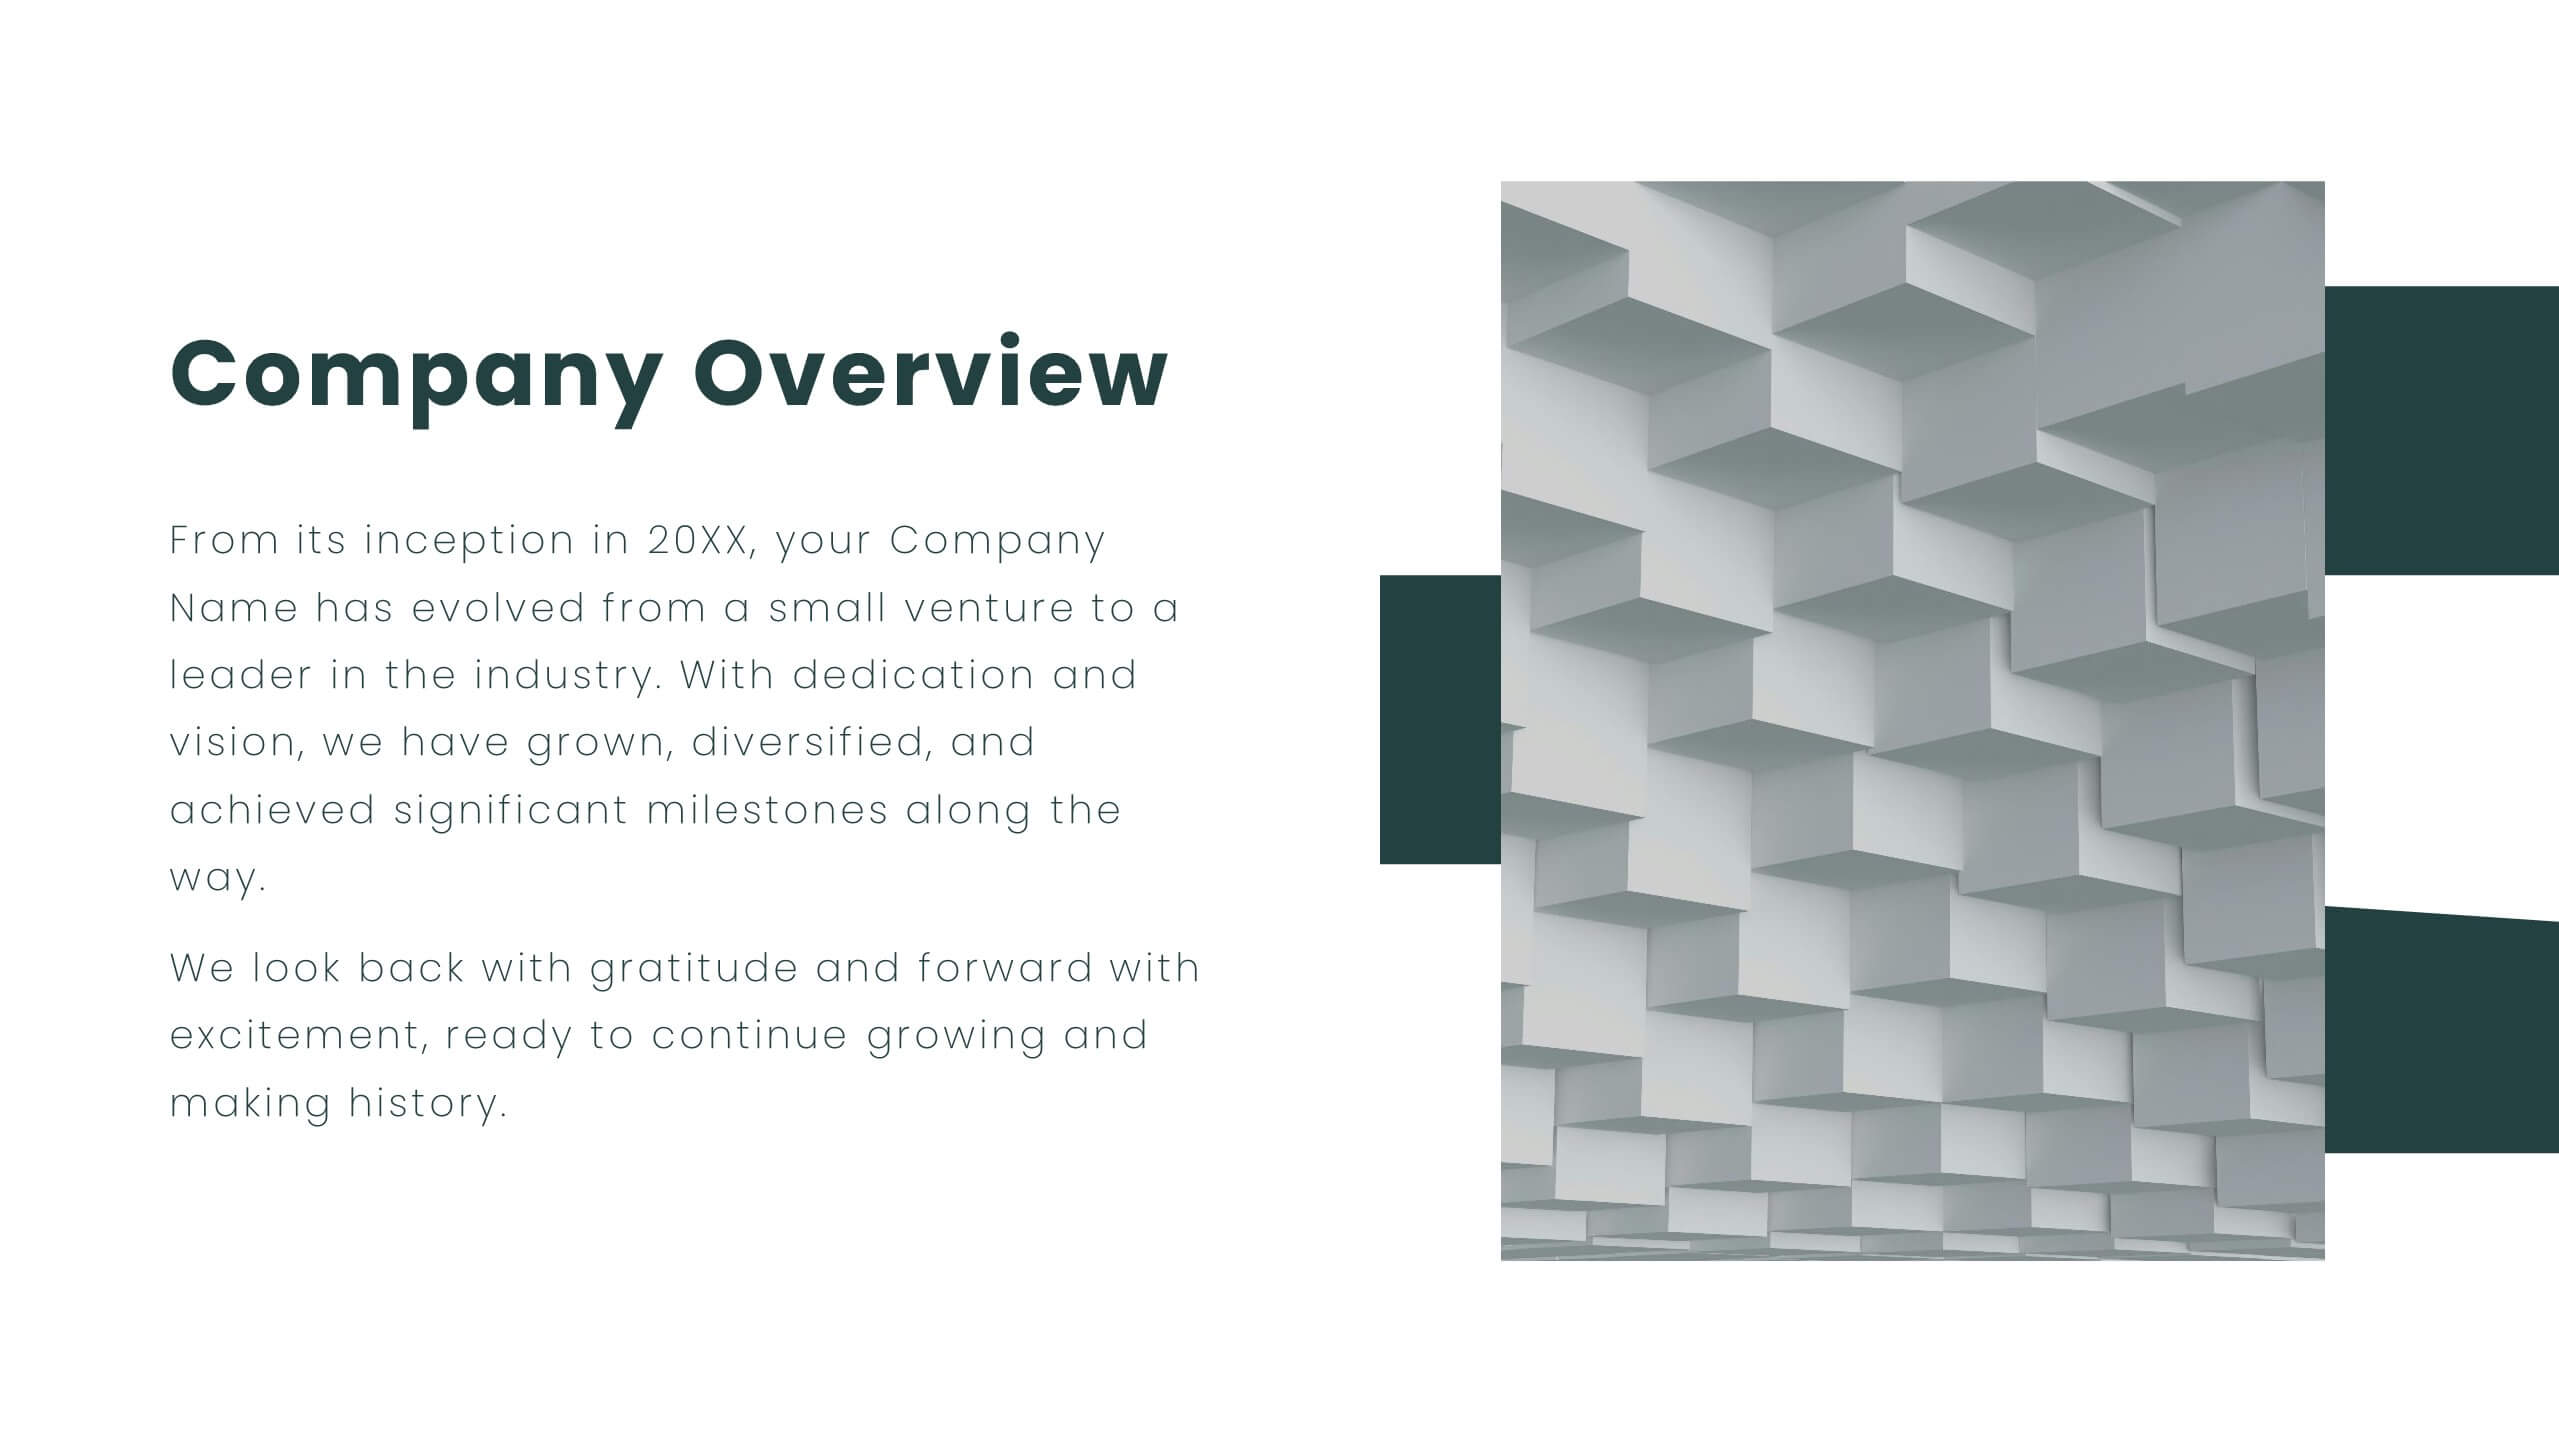
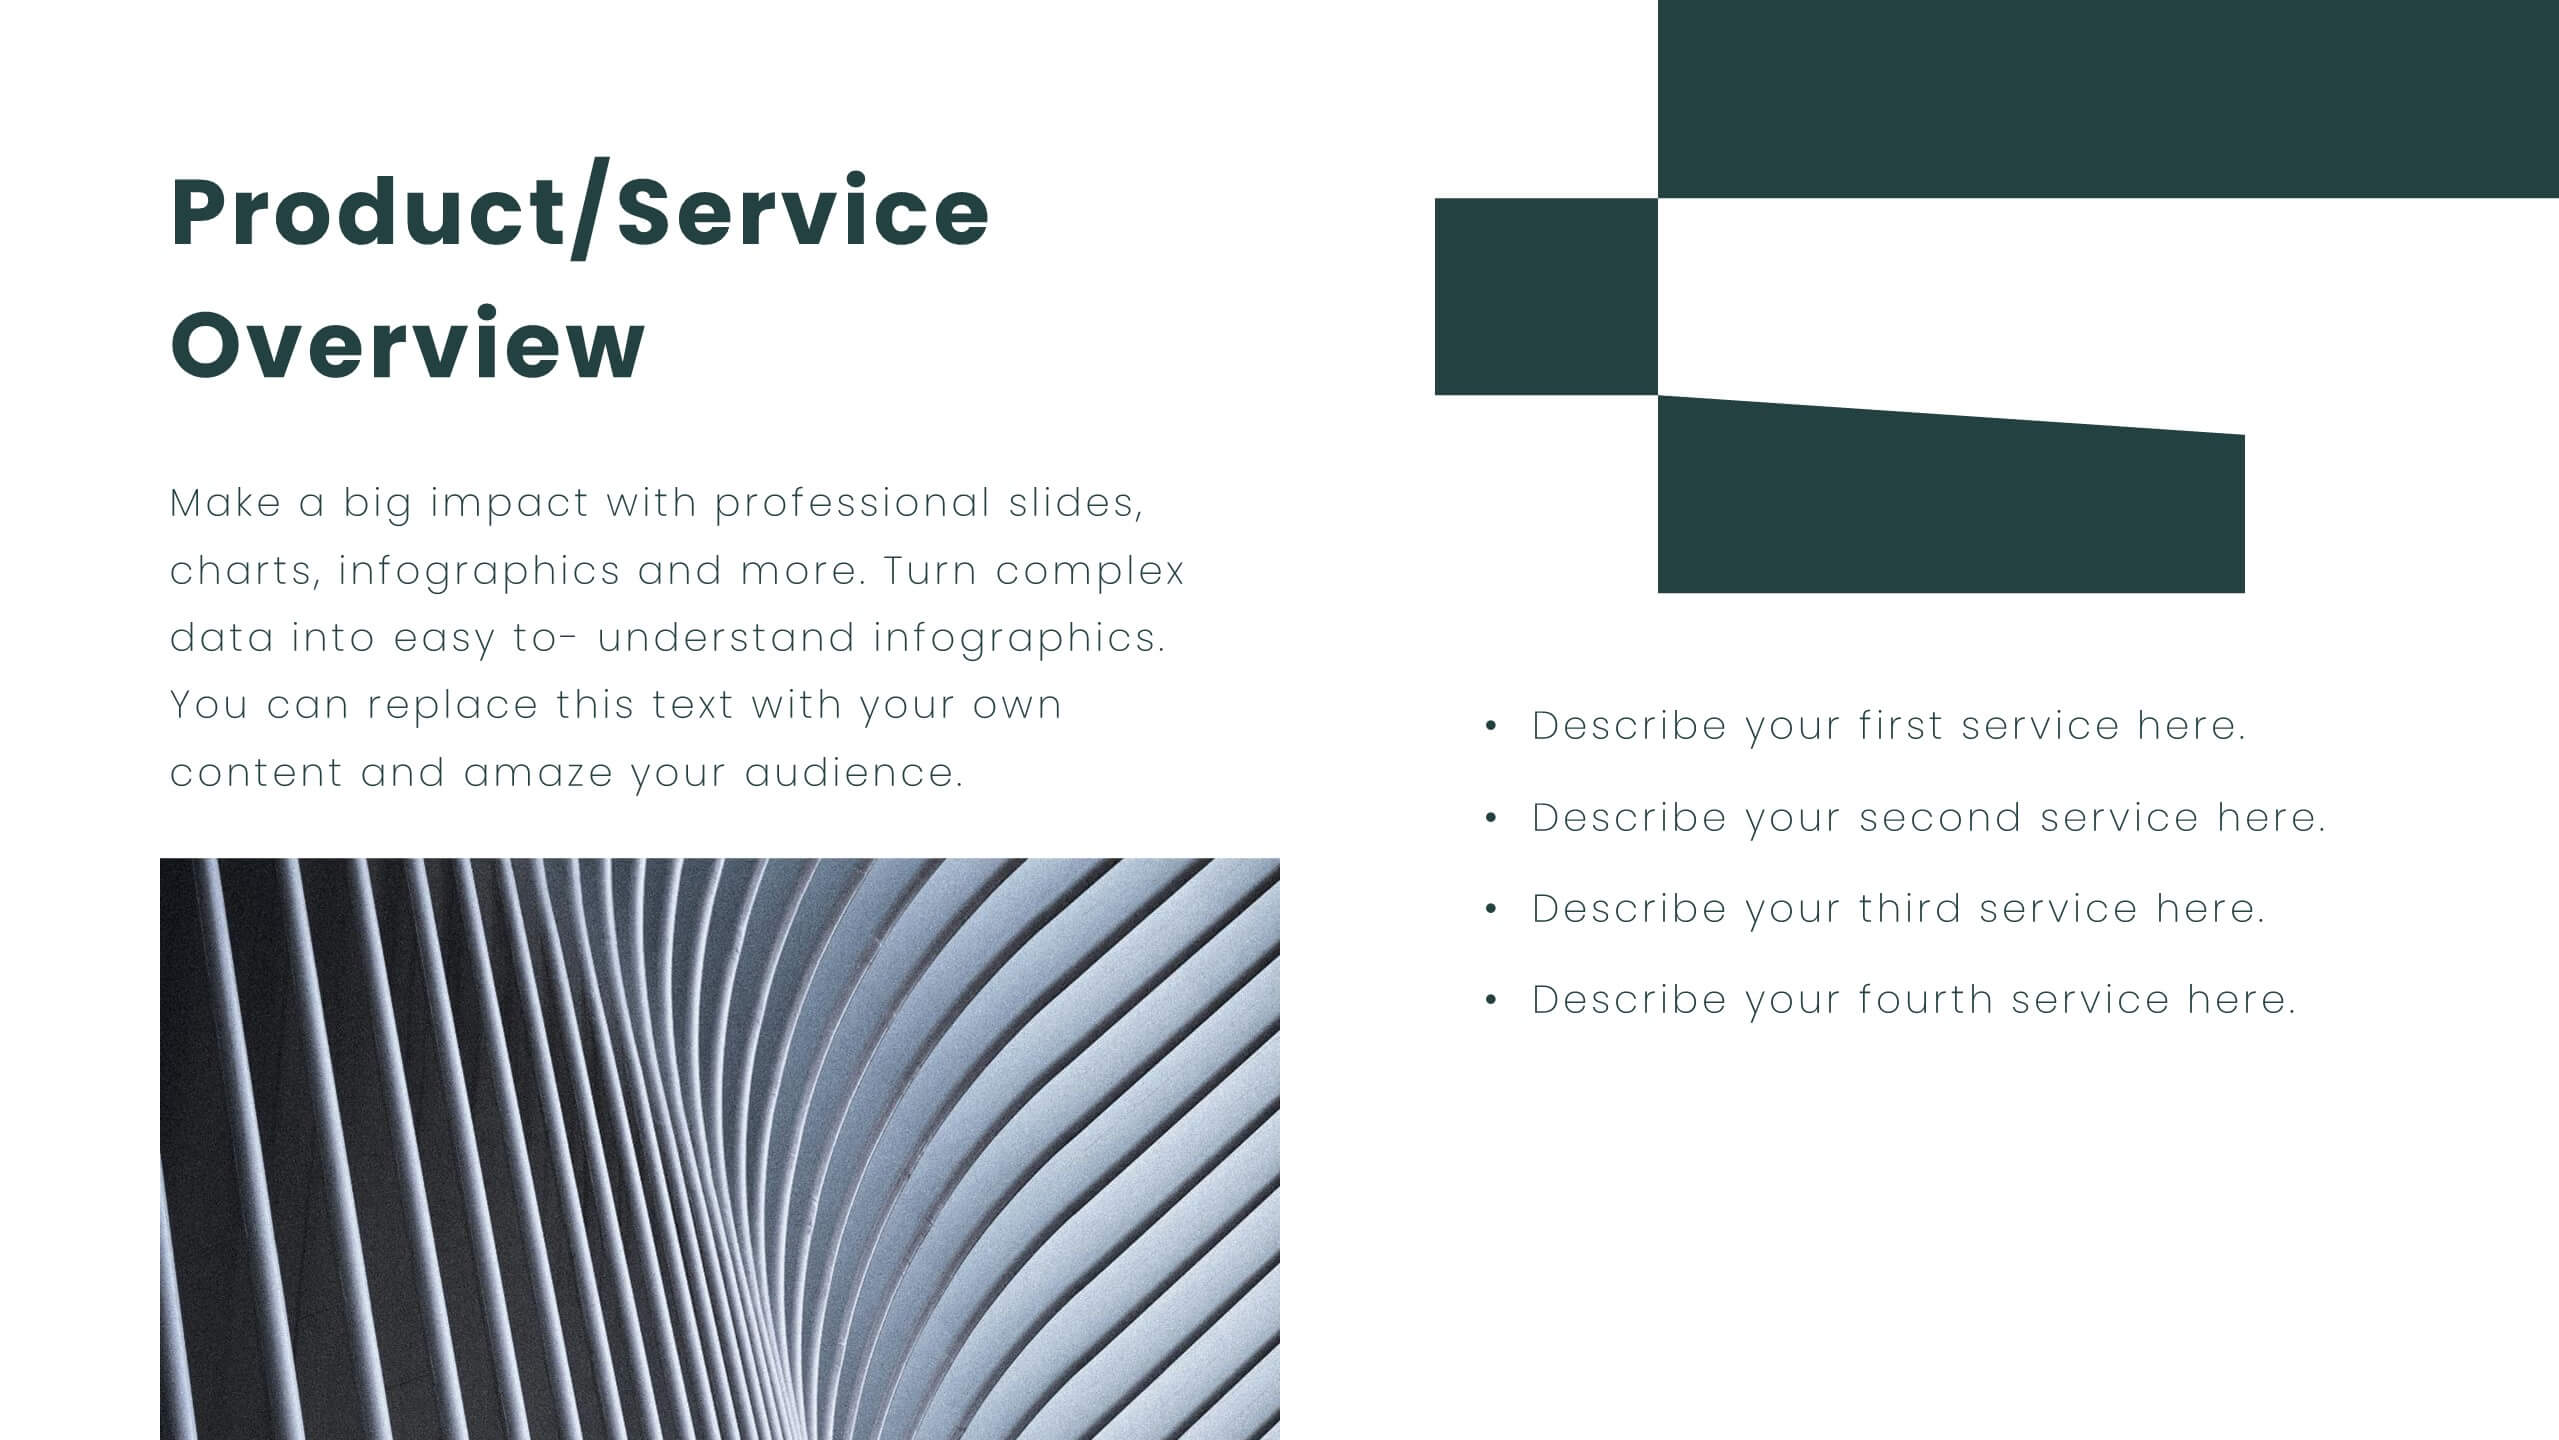
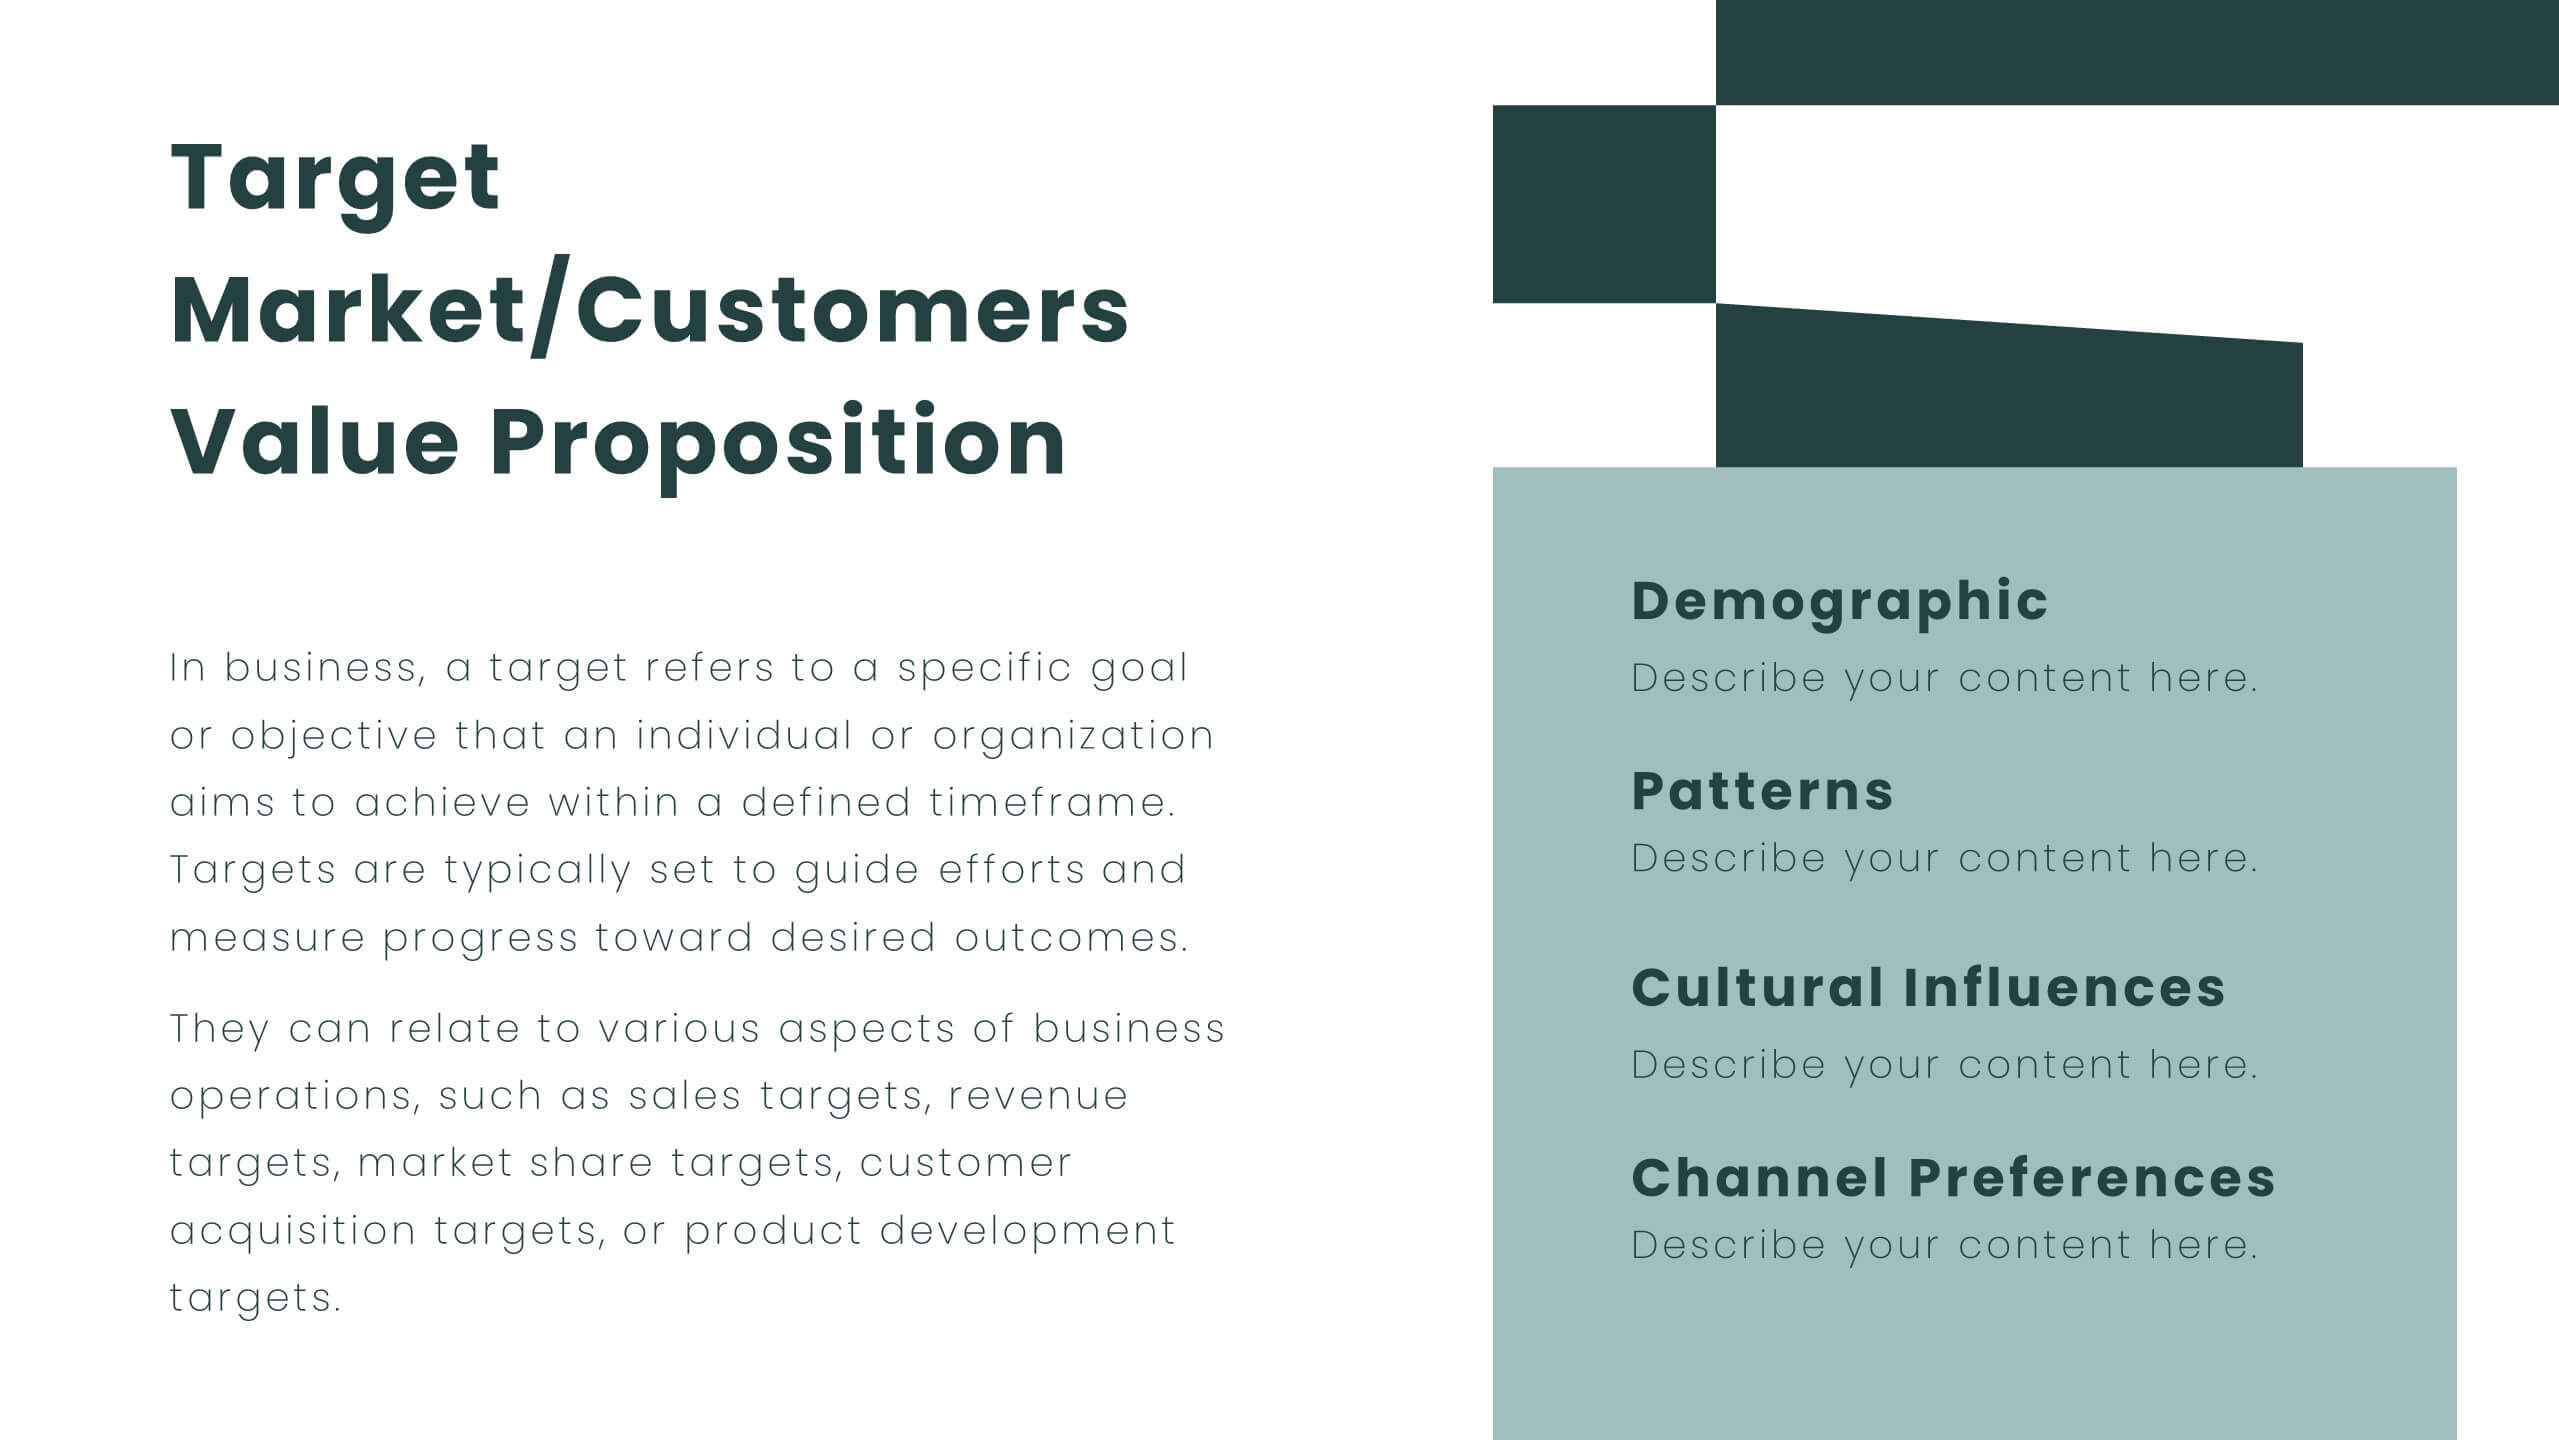
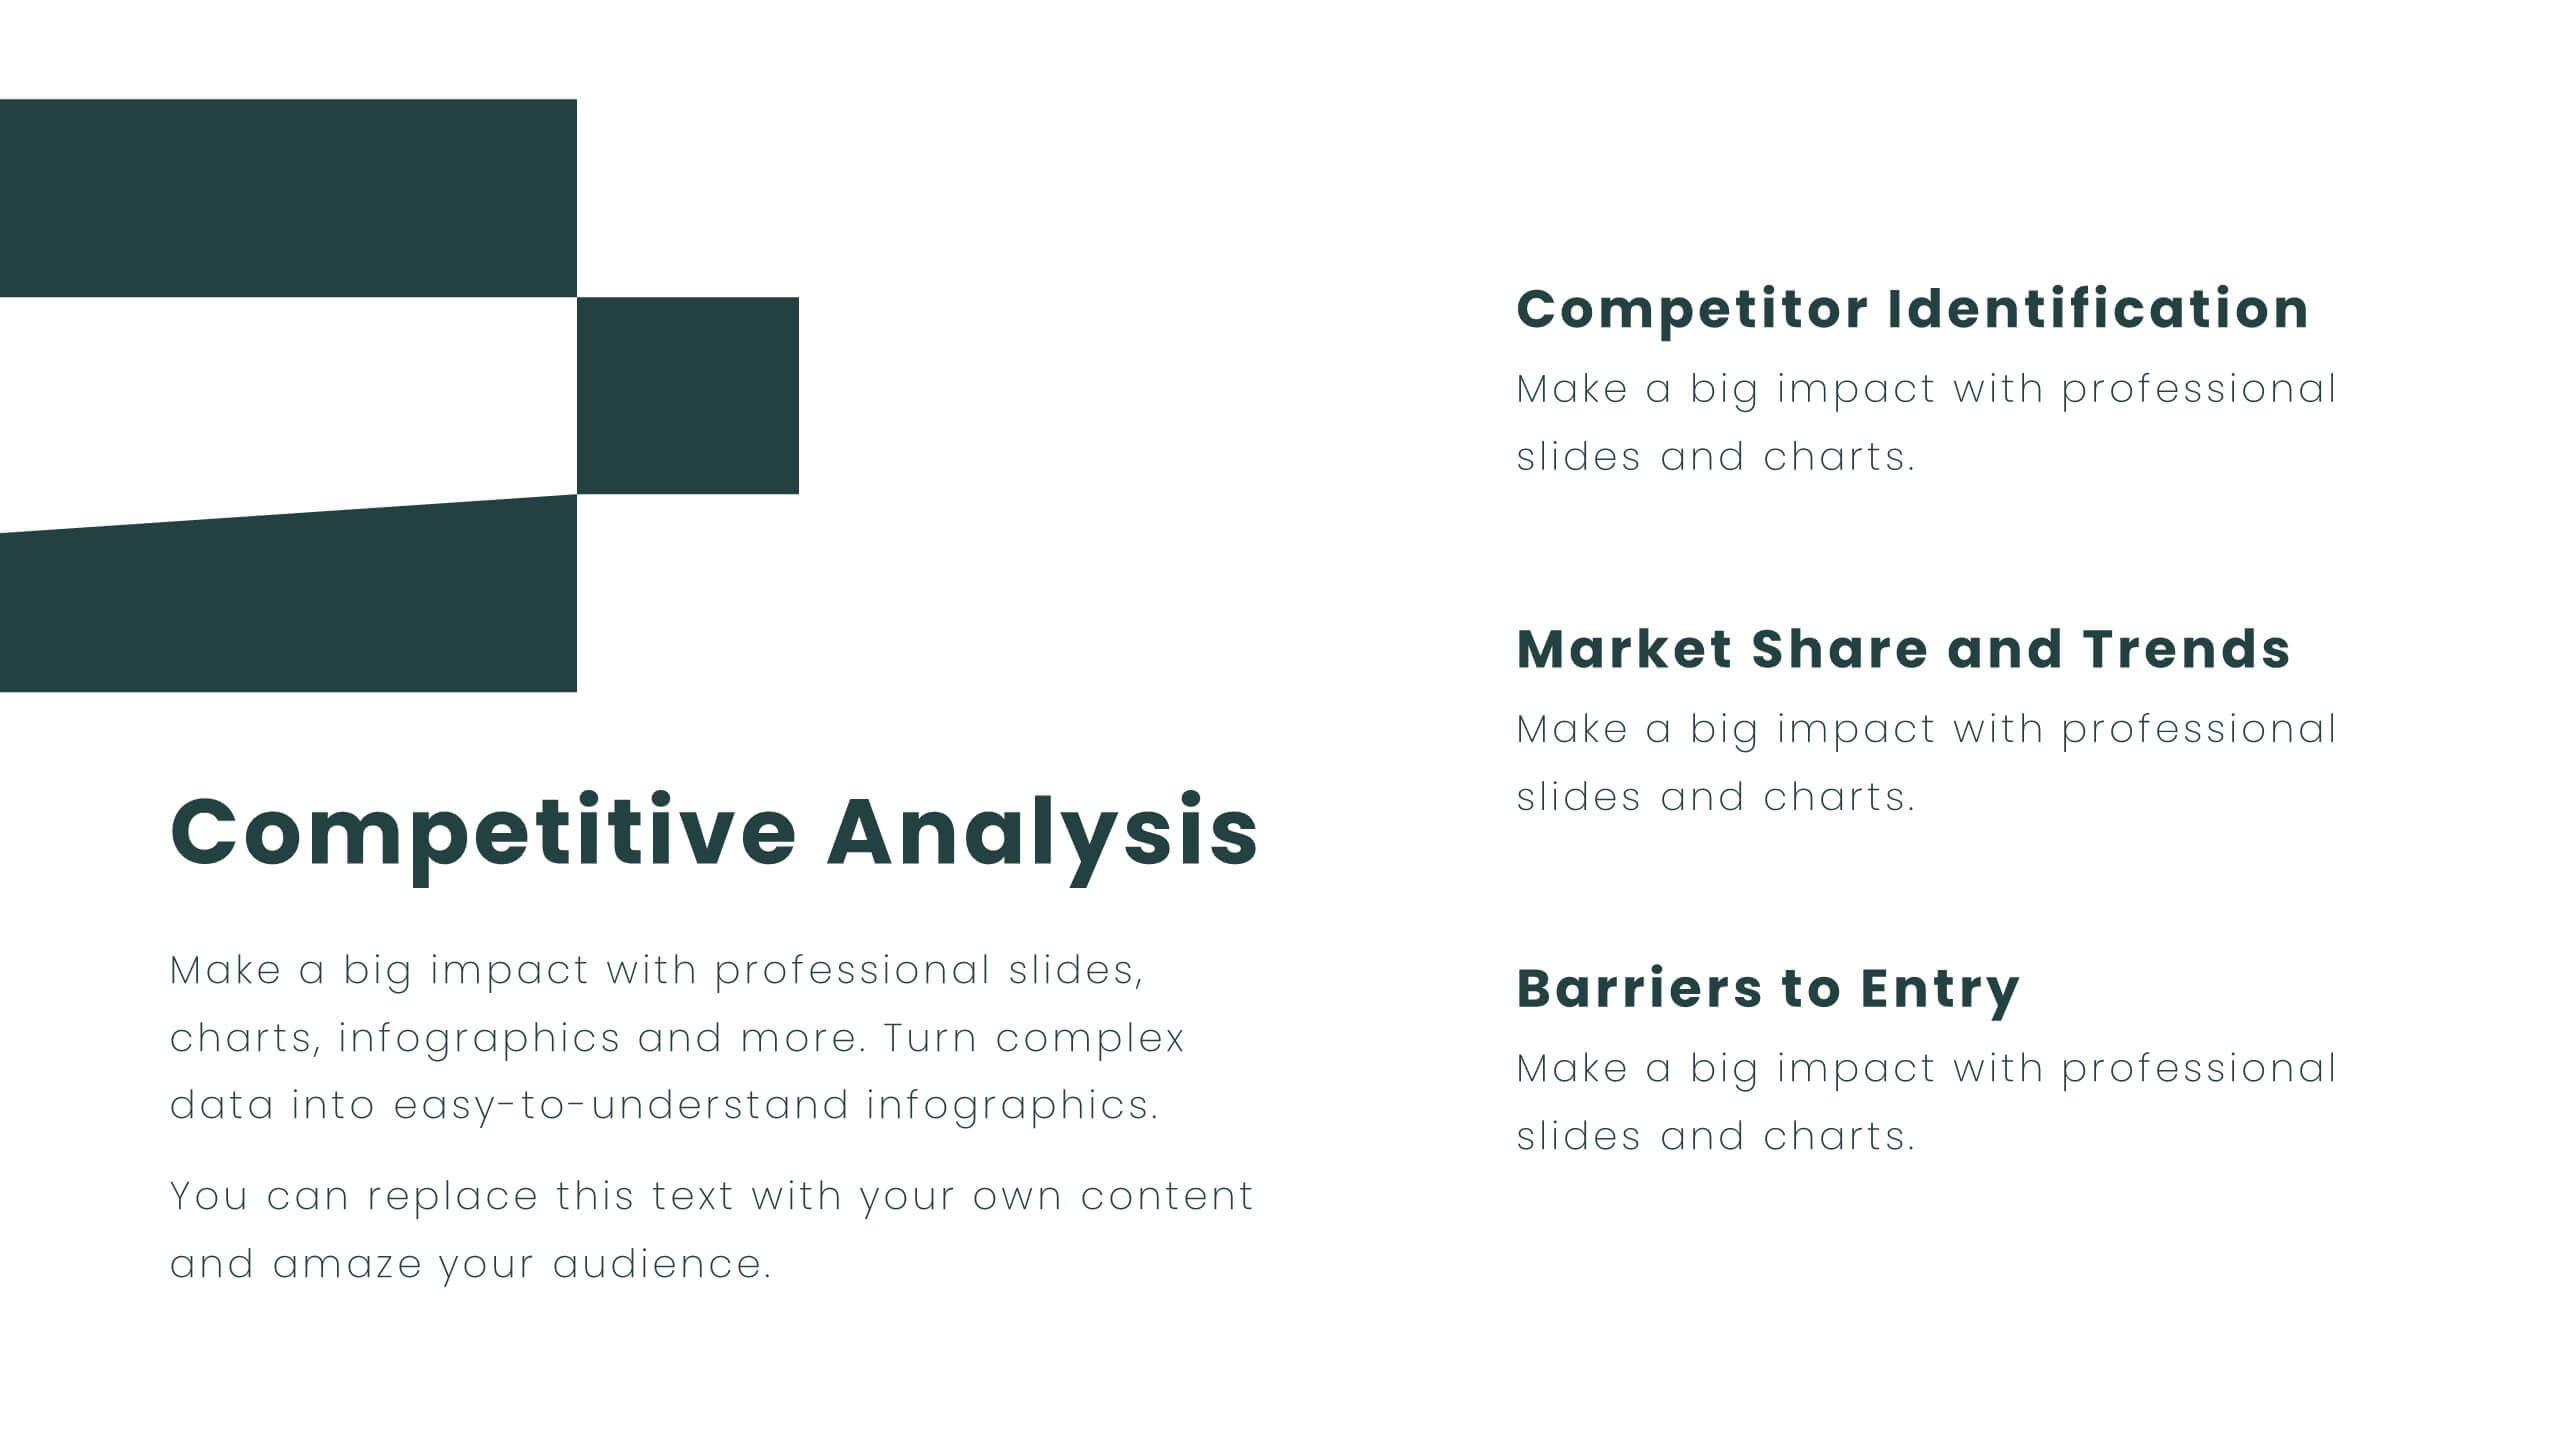
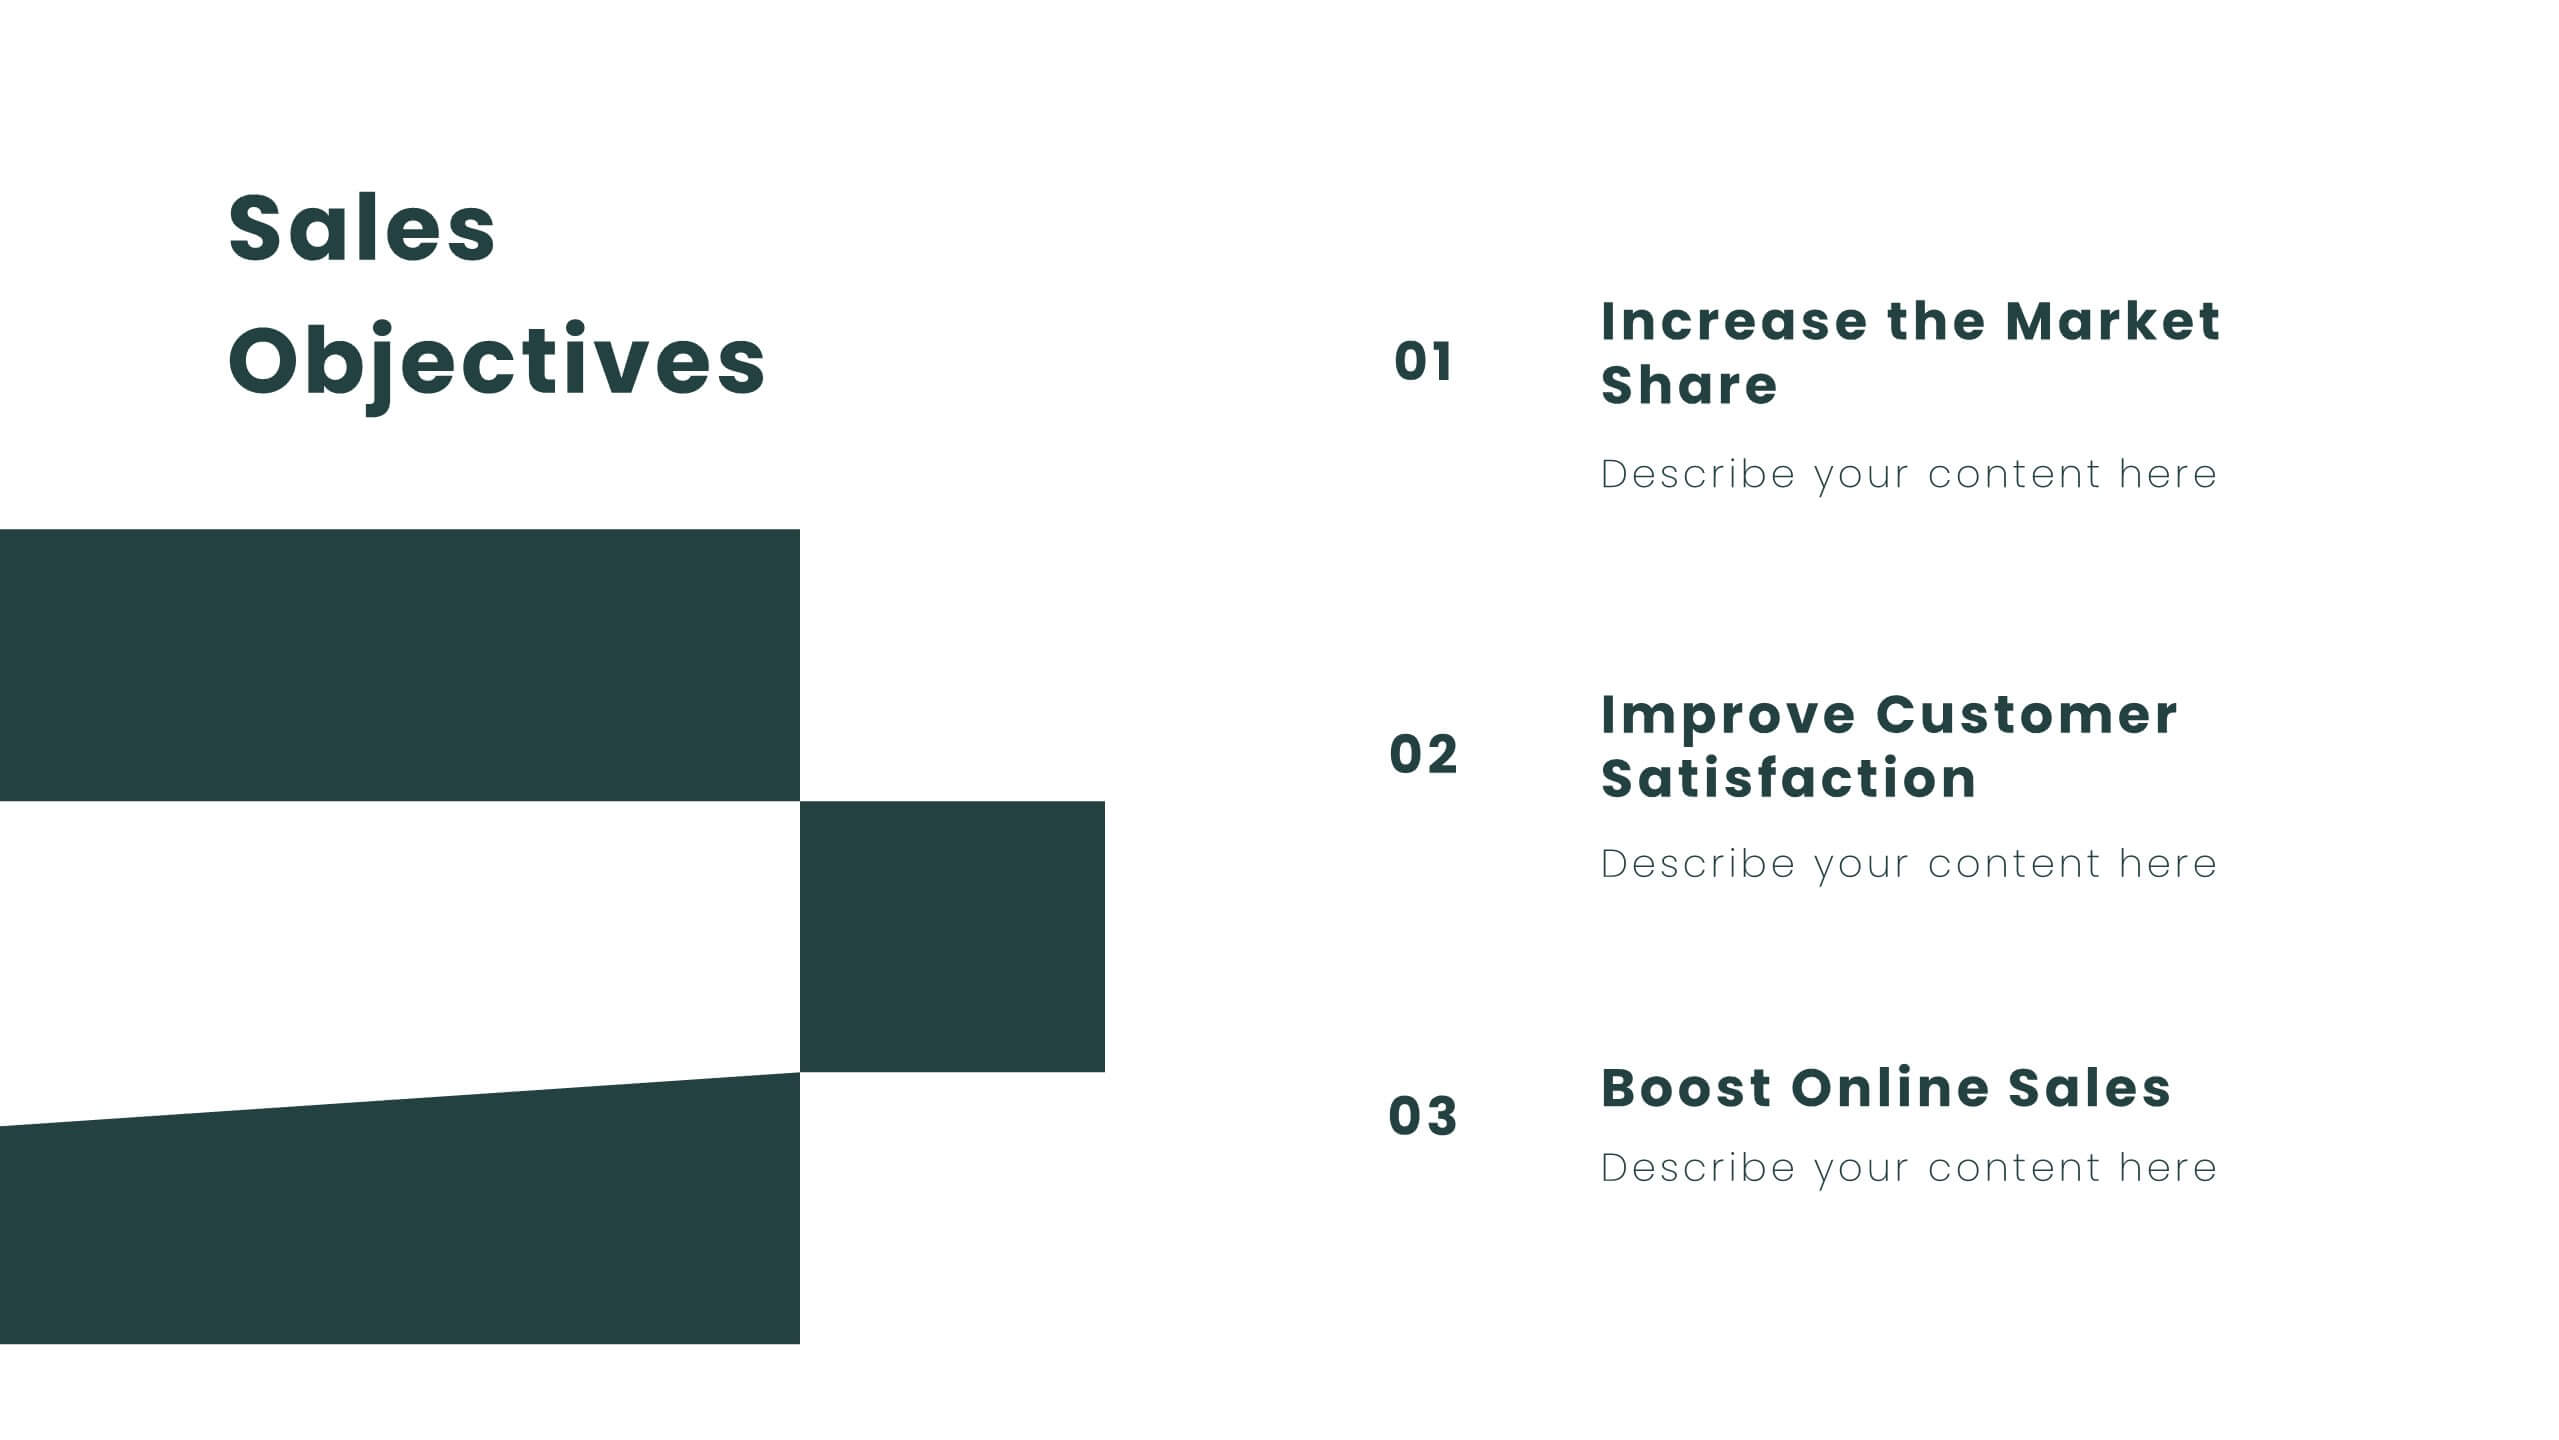
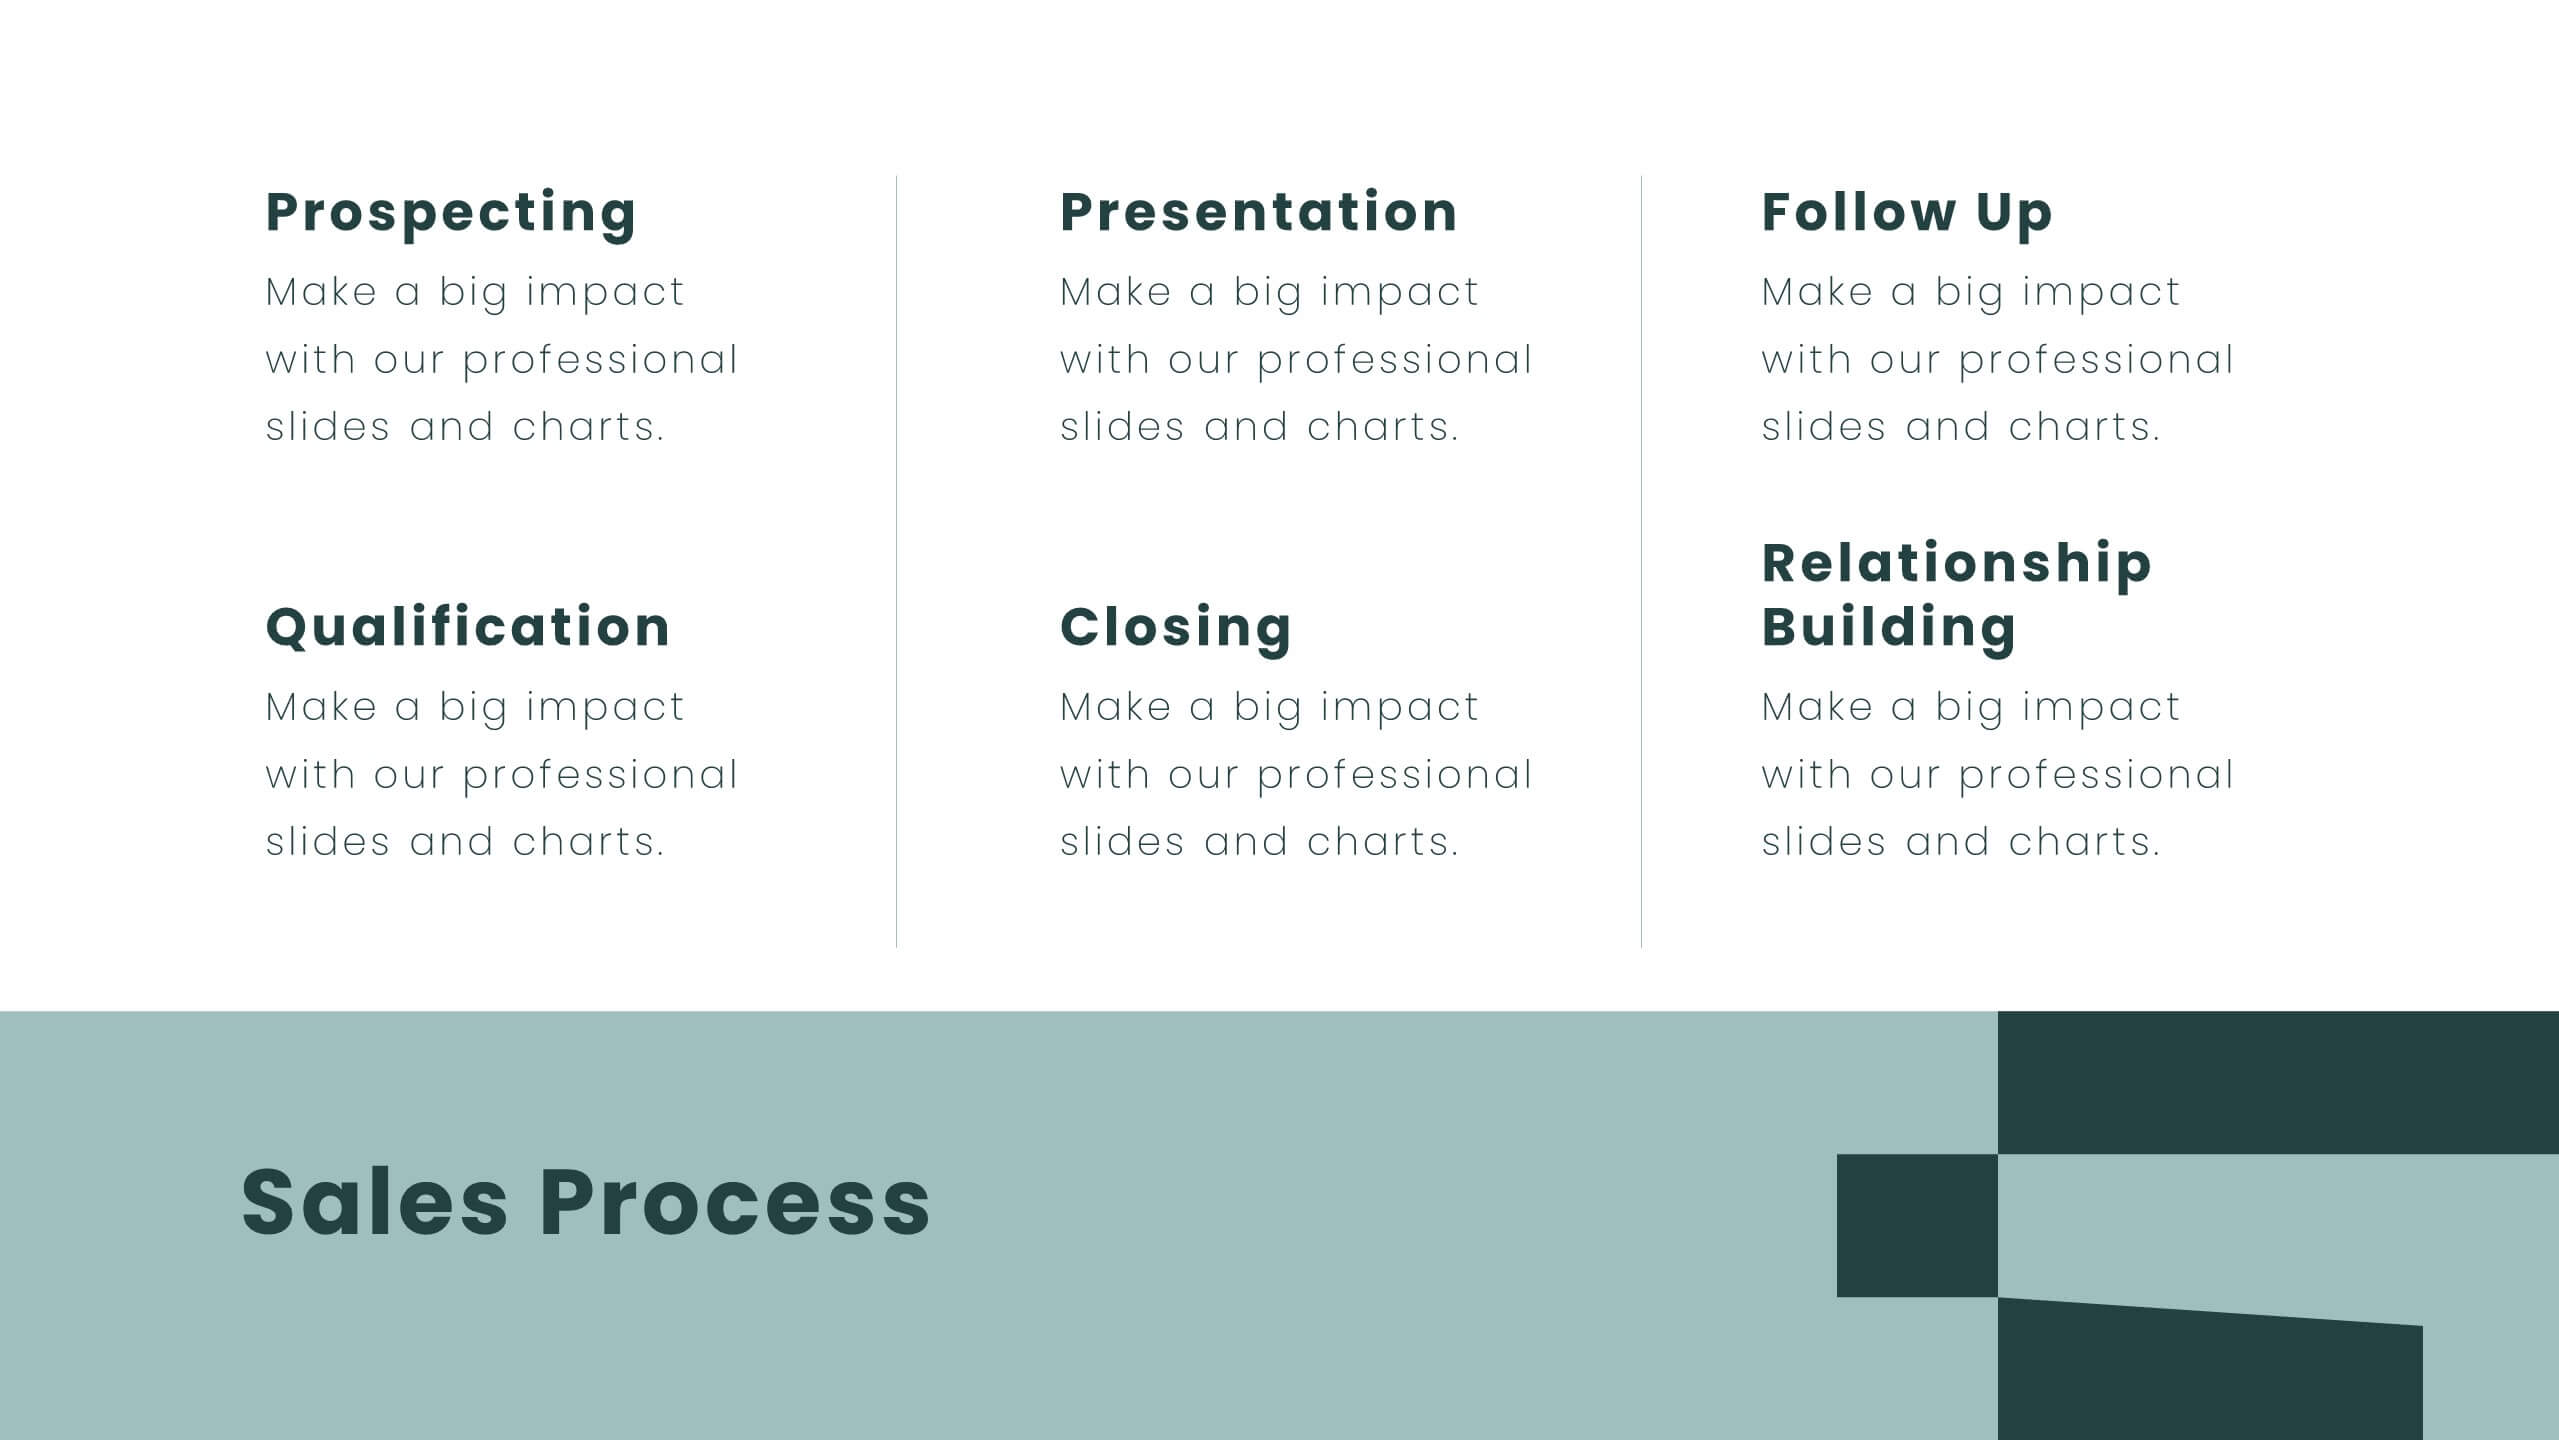
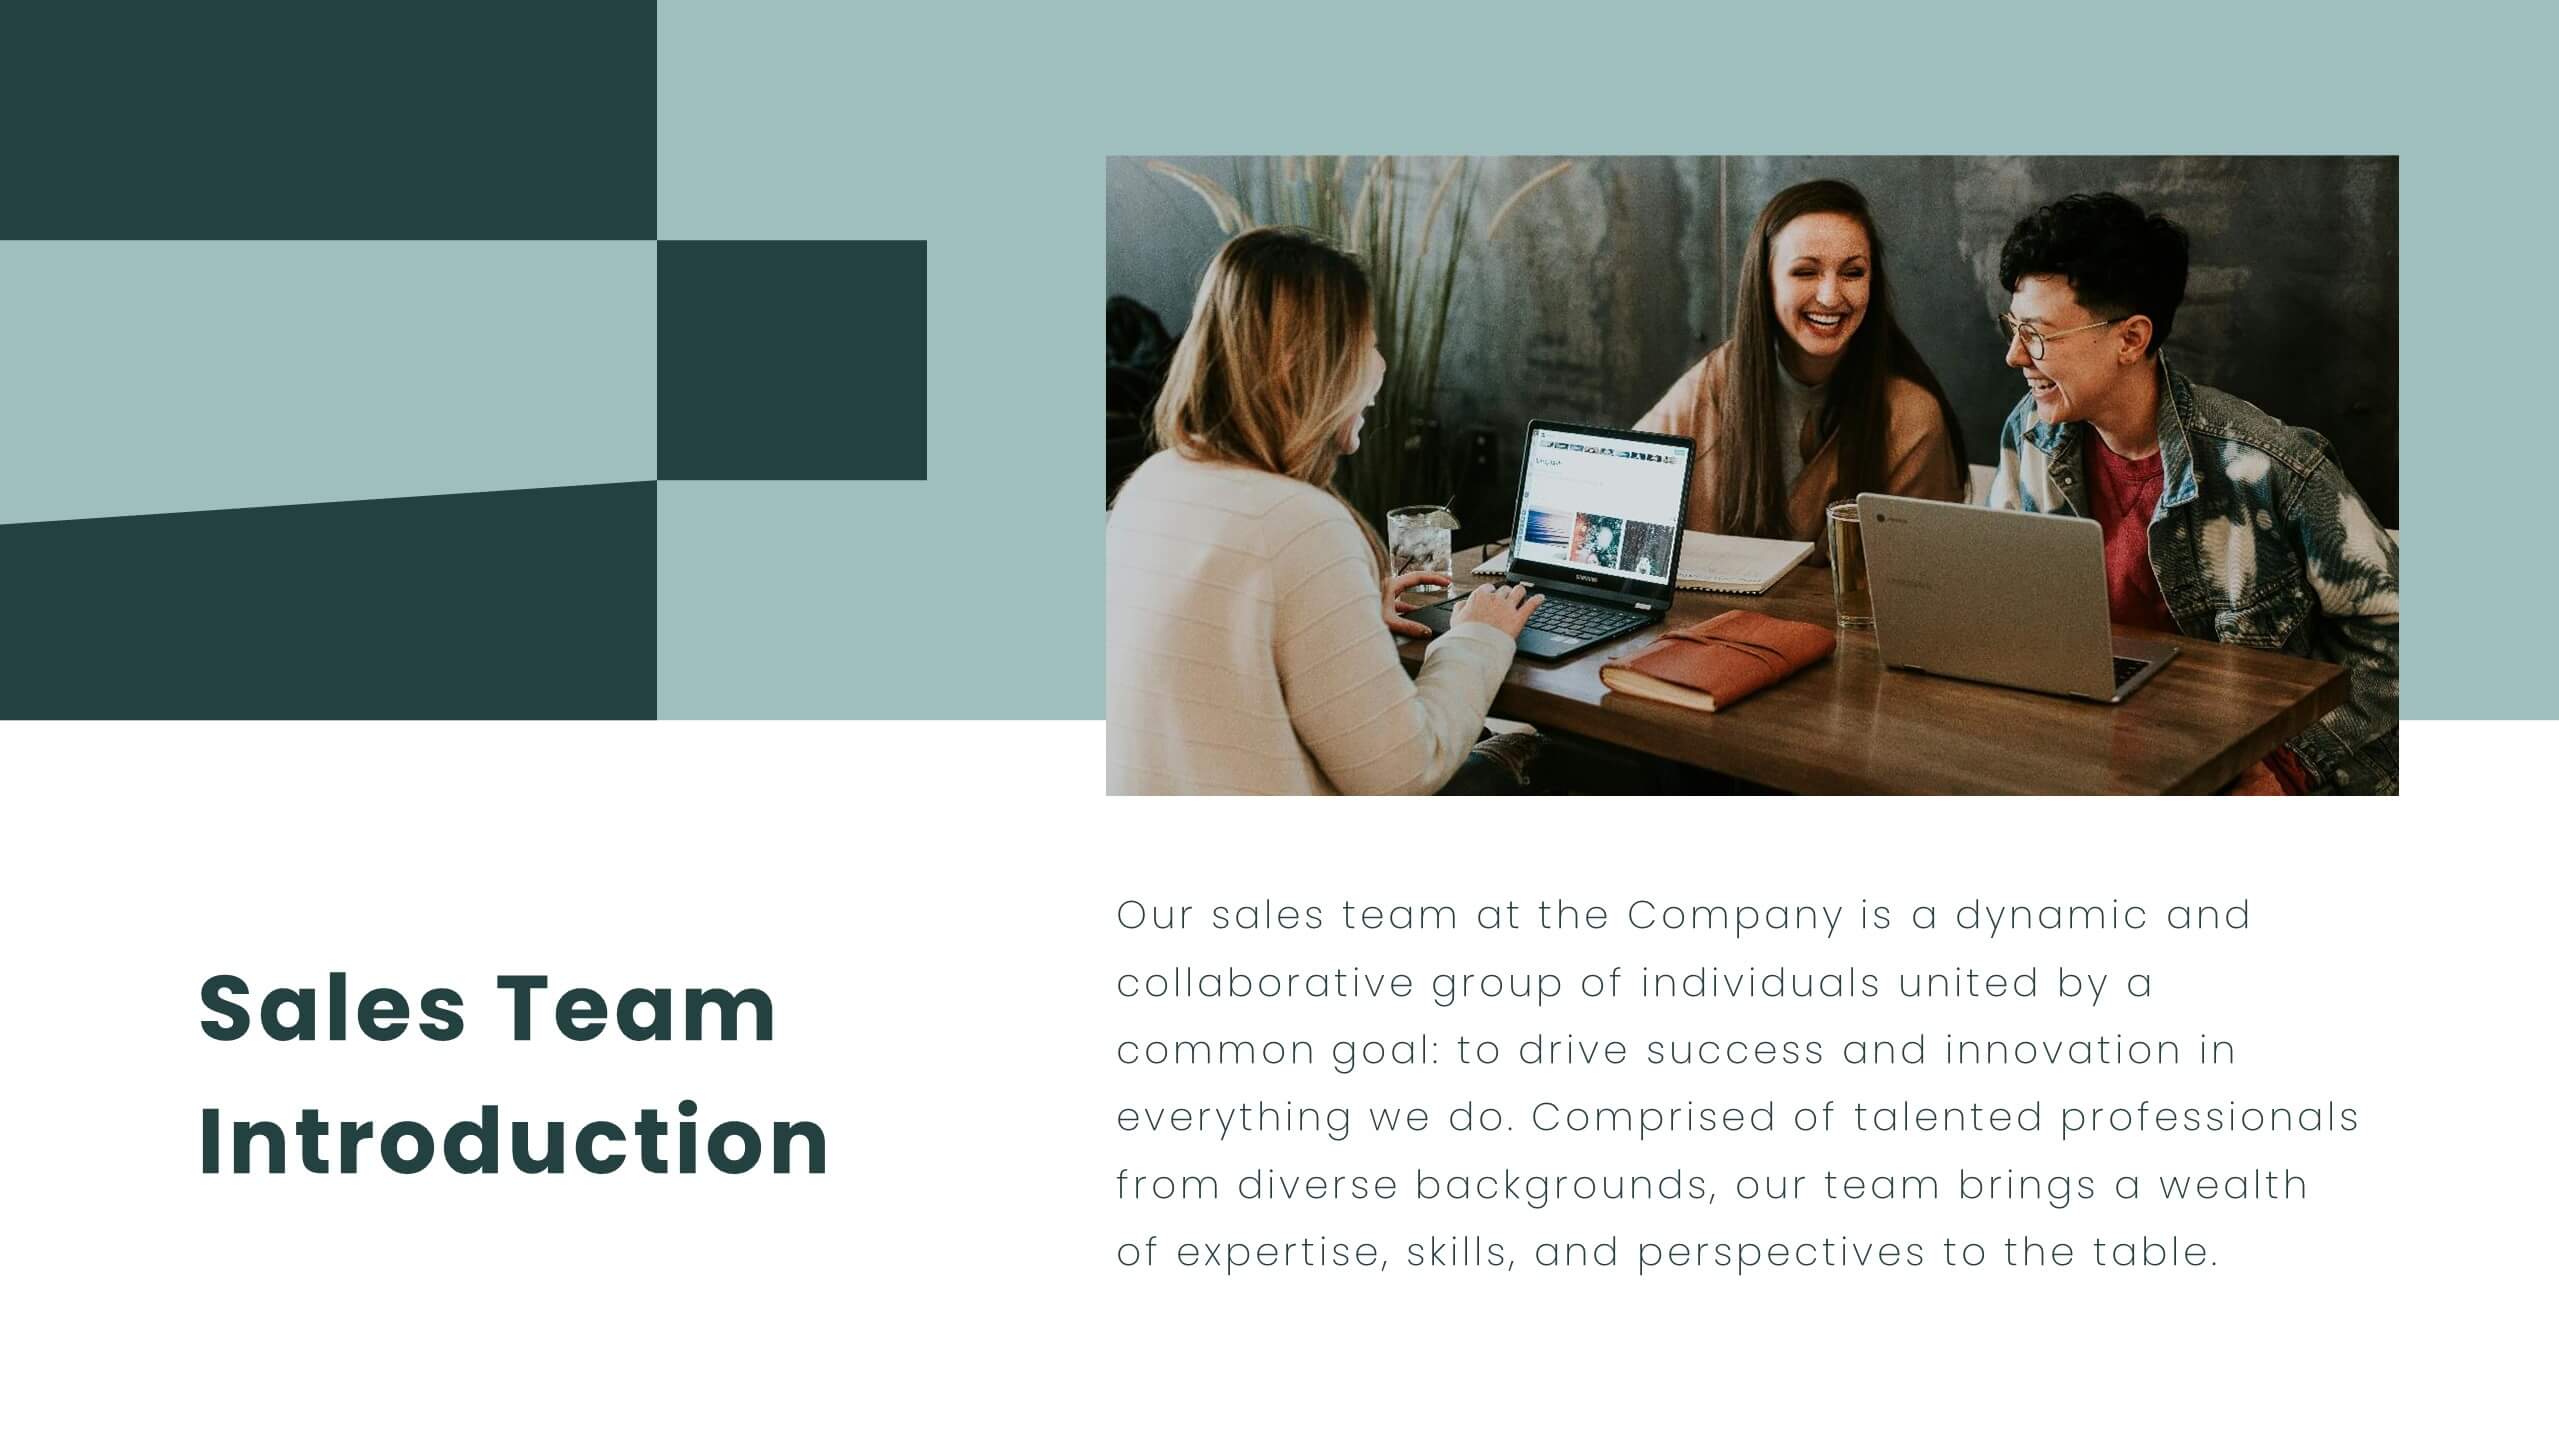
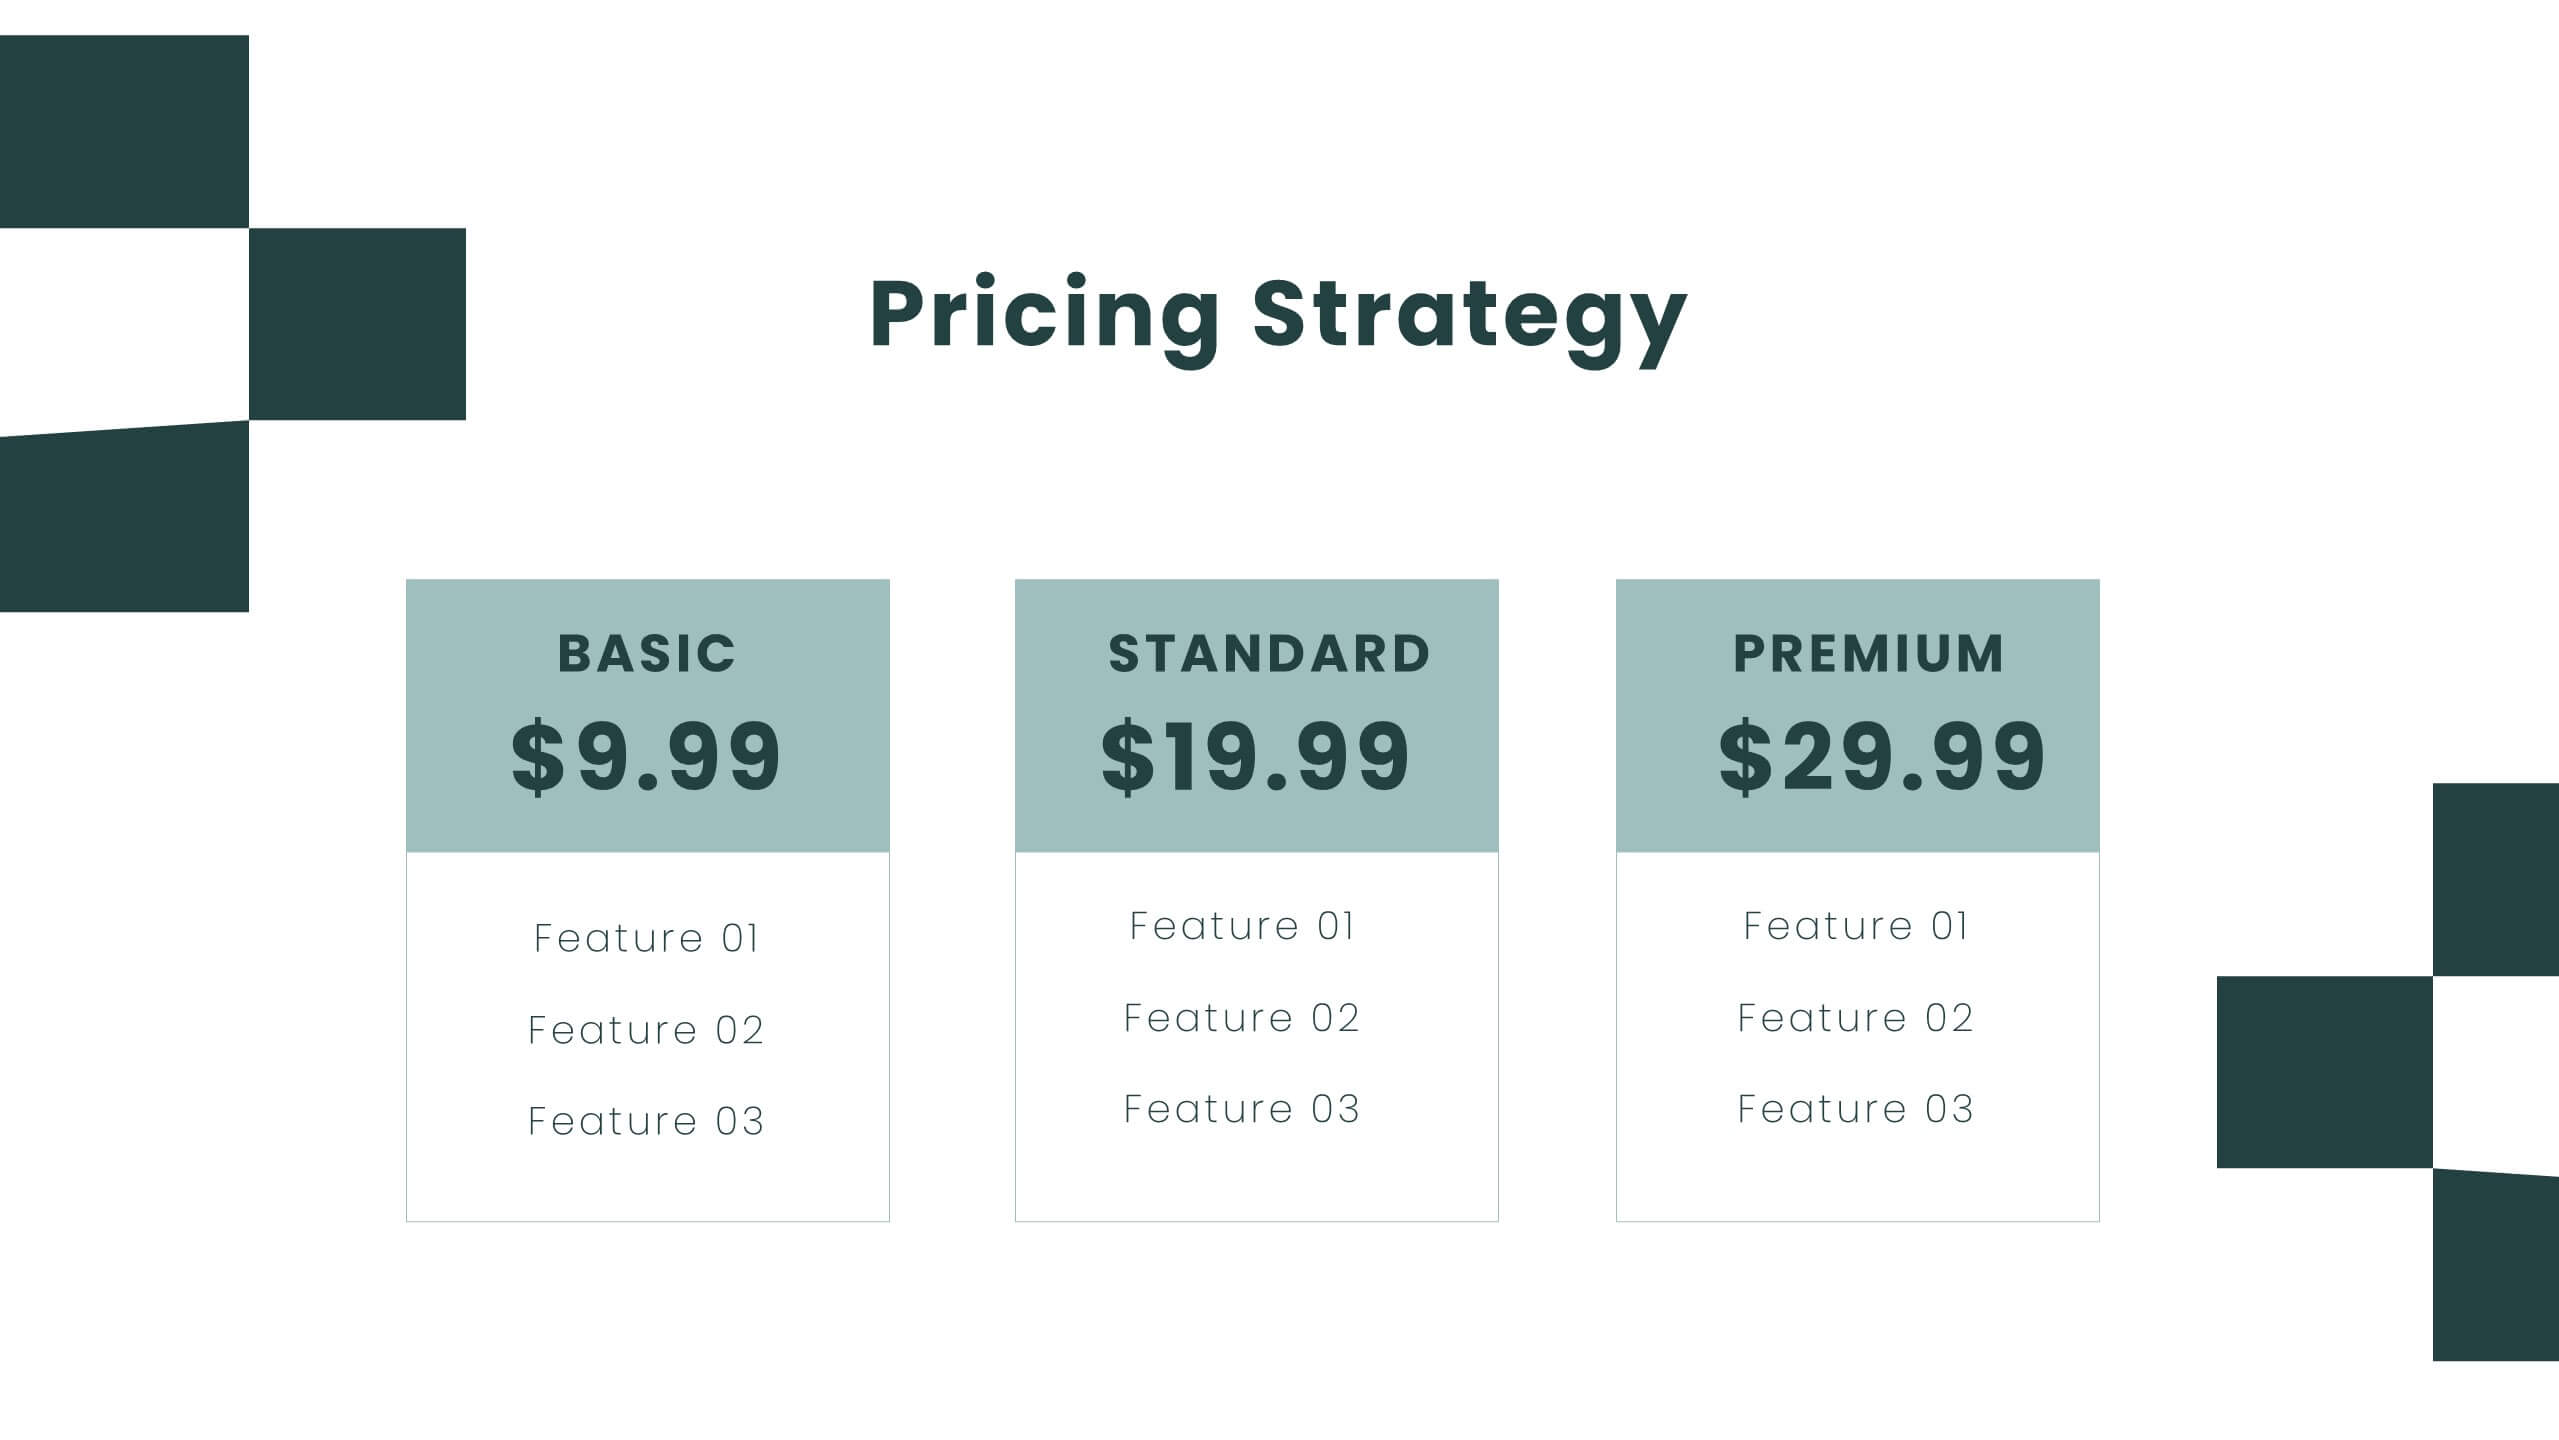
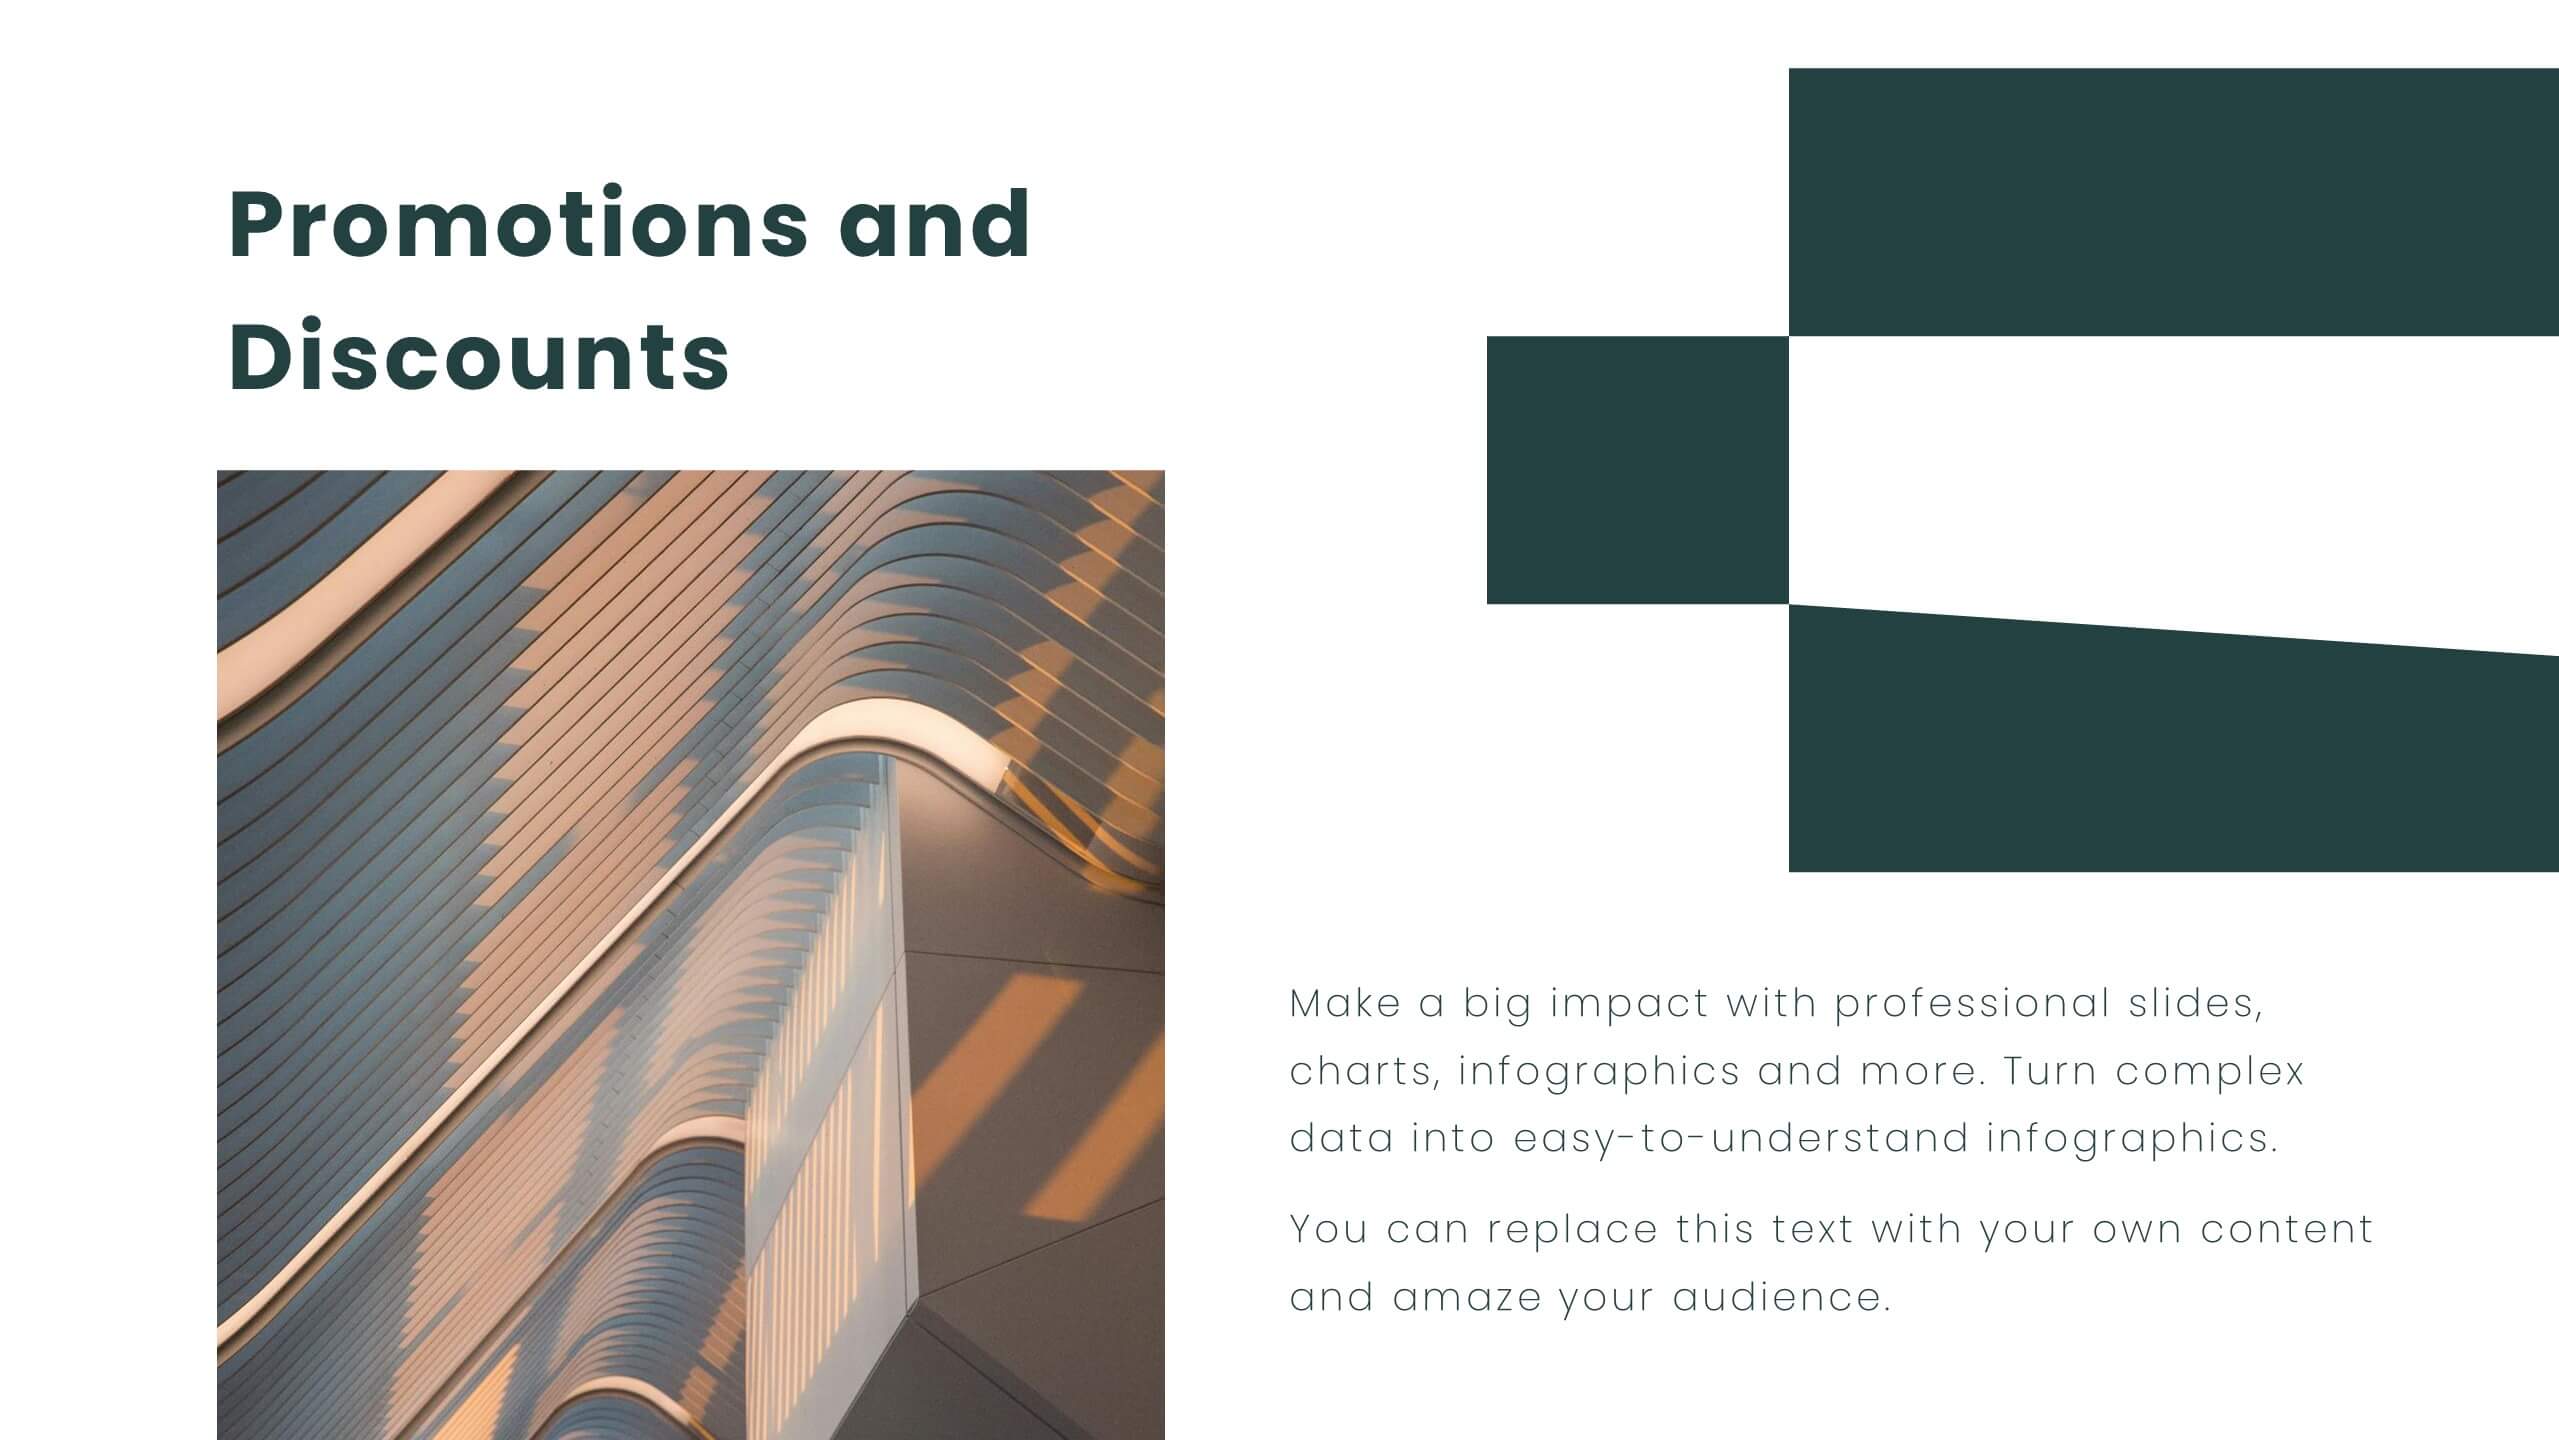
Radiant Sales Proposal Presentation
Elevate your pitch with this polished sales proposal template! Perfect for presenting company overviews, product/service details, and pricing strategies, it includes slides for competitive analysis and customer testimonials. Impress your audience with clear visuals and structured content. Compatible with PowerPoint, Keynote, and Google Slides for seamless presentations on any platform.


10 diapositivas
Logistics and Procurement Supply Chain
Streamline your supply chain narrative with this clean, visual timeline layout. Perfect for operations managers, logistics planners, or procurement leads, this slide breaks down each stage of the supply chain process with color-coded segments and intuitive icons. Fully editable in PowerPoint, Keynote, and Google Slides.


4 diapositivas
Financial Budget Forecasting Presentation
Predict and manage your financial future with our 'Financial Budget Forecasting' template, perfect for visualizing quarterly budget allocations and expectations. This versatile tool aids in creating clear, concise, and visually engaging financial presentations, and is compatible with PowerPoint, Keynote, and Google Slides, making it a must-have for finance professionals and budget planners.


7 diapositivas
Schedule Infographics Presentation Template
Featuring our Schedule Infographic template, this is a great tool for business owners, students and others who need to create an impactful presentation. Using this template will ensure that your main point is emphasized and can be easily understood by all of your viewers. This template includes different colors and fonts that can be easily edited and changed. This will help you visualize your existing data and create a presentation that includes all of your points. Use this template to make a professional and smart looking schedule, and present your plan to others in an easy to understand way.


5 diapositivas
Scaling Operations and Team Expansion Presentation
Illustrate your company’s growth journey with the Scaling Operations and Team Expansion Presentation. This dynamic layout uses a circular sequence to showcase five key phases of business scaling, from small teams to full-scale departments. Perfect for strategy sessions, investor updates, and team meetings. Fully editable in Canva, PowerPoint, Keynote, and Google Slides.


5 diapositivas
Timeline Road Infographics
Timelines are important tools for organizing and presenting information chronologically. This timeline infographic is designed to help ensure that all your tasks are completed on time, and that the project stays on track. This is perfect for identifying potential issues that may arise during a project, so that they can be addressed before they become major problems. This template consists of a road or a horizontal line, with markers or milestones placed at specific intervals. Each marker represents a significant event or achievement, and is accompanied by a short description, date or time frame.


7 diapositivas
Lifecycle Stages in Customer Experience Presentation
Showcase the full customer journey with this Lifecycle Stages in Customer Experience presentation. Featuring a sleek infinity loop layout, this slide is ideal for visualizing cyclical engagement stages—like acquisition, onboarding, retention, and advocacy. Clean design and labeled touchpoints help convey insights clearly. Fully compatible with PowerPoint, Canva, and Google Slides.