


Características


¿Tienes alguna pregunta?
Recomendar


21 diapositivas
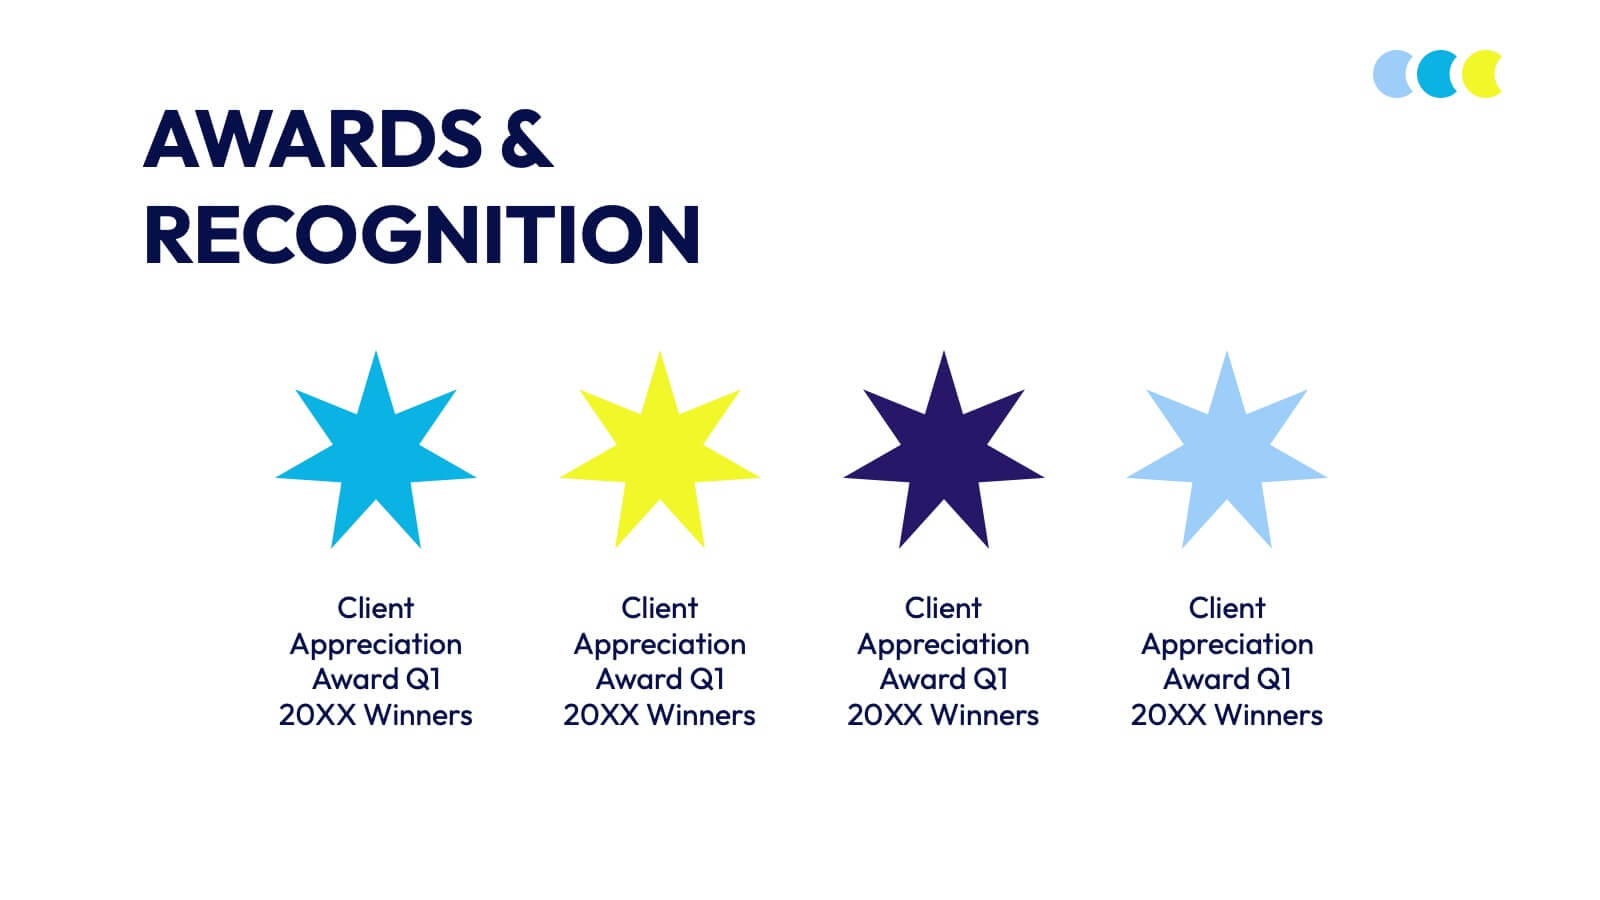
Fablelight Digital Agency Strategy Plan Presentation
This sleek and modern presentation template is designed to effectively communicate a strategic plan for any professional agency. It includes sections for mission and vision, team structure, services offered, and a detailed creative process. Dive into market analysis, industry trends, and case studies to showcase expertise and success stories. Strategy development, campaign execution, and measurement analytics are highlighted to demonstrate goal-oriented planning. Client testimonials, partnerships, social impact initiatives, and awards provide credibility and enhance trust. Fully customizable and compatible with PowerPoint, Keynote, and Google Slides.


6 diapositivas
Network Security Infographics
Strengthen your understanding of Network Security with our customizable infographic template. This template is fully compatible with popular presentation software like PowerPoint, Keynote, and Google Slides, allowing you to easily customize it to illustrate and communicate various aspects of network security. The Network Security infographic template offers a visually engaging platform to explore and explain the importance of protecting digital information, securing networks, and preventing cyber threats. Whether you're an IT professional, business owner, or simply interested in cybersecurity, this template provides a user-friendly canvas to create informative presentations and educational materials. Enhance your knowledge of Network Security with this SEO-optimized infographic template, thoughtfully designed for clarity and ease of use. Customize it to highlight key concepts, security measures, best practices, and the evolving landscape of cybersecurity, ensuring that your audience gains valuable insights into this critical field. Start crafting your personalized infographic today to fortify your understanding of Network Security.


7 diapositivas
Target Market Infographic Presentation Template
A target market Infographic is a visual representation of a specific group of consumers that a business has determined to be the focus of its marketing efforts. This infographic is designed to understand the demographics, behaviors, and motivations of the potential consumers. This infographic can be used to show the size and growth potential of the target market, and how it compares to other market segments. This template is designed to display your information in the form of charts, graphs, or other data visualizations, and is accompanied by written descriptions of your data and insights.


26 diapositivas
Raoul Presentation Template
Are you looking for business presentation template with a powerful framework that allows you to present and promote your latest ideas? Raoul is a sleek and clean, bold business presentation template. It's perfect for sharing your ideas, brand identity and how you want to be perceived with the world, in an appealing way. Raoul is great presentation for big or small businesses, company owners, reporters or managers. This template is all about simplicity and style. You will gain authority and convince others with this masterfully crafted professional presentation design.


5 diapositivas
Business Ethics and Governance
Illustrate ethical processes and compliance values with this curved roadmap presentation. Designed around five connected stages—Process, Compliance, Technology, Oversight, and People—this layout helps visualize corporate governance and operational integrity. Each segment is color-coded and paired with icons for easy comprehension. Fully editable in PowerPoint, Keynote, and Google Slides.


7 diapositivas
Six Sigma Training Infographic
Six Sigma is a data-driven methodology and approach for eliminating defects and improving processes in any business. This is a bold, transformative tool designed to equip individuals and organizations with the prowess of Six Sigma methodology. This template is the roadmap to excellence, paving the way for achieving remarkable improvements and efficiency. Fully customizable and compatible with Powerpoint, Keynote, and Google Slides. Unleash the power of Six Sigma through our Six Sigma Training Infographic. Let this be your guide to mastering the art of perfection, driving transformative change, and marching boldly towards operational excellence.


5 diapositivas
Real-Time KPI's Monitoring Dashboard Presentation
Track performance at a glance with this Real-Time KPI Monitoring Dashboard Presentation. Featuring clean bar visuals, circular gauges, and a numeric display, this layout is ideal for presenting five key metrics and their progress. Perfect for executive updates, marketing reports, or business reviews. Fully editable in PowerPoint, Keynote, Google Slides, and Canva.


4 diapositivas
Budget Projection with Predictive Analysis Presentation
Visualize future financial outcomes with clarity using the Budget Projection with Predictive Analysis Presentation. This modern funnel-style layout helps break down key stages of budget forecasting, making it easy to communicate progressions and data-driven insights. Perfect for financial planning, reporting, or strategic reviews. Fully editable in PowerPoint, Google Slides, Keynote, and Canva.


7 diapositivas
Porter's Five Forces Diagram
Porter's Five Forces is a strategic framework developed by Michael Porter that helps analyze the competitive environment of an industry. The five forces are represented in a diagram to understand the competitive dynamics and attractiveness of an industry or market. In this infographic template, the forces are represented as five segments of a circle or a graphical illustration with arrows and descriptions. Compatible with Powerpoint, Keynote, and Google Slides. This template is a powerful, bold, and insightful tool that dissects competitive forces, revealing strategic insights for businesses.


5 diapositivas
Economic Analysis of Europe Map Presentation
Visualize key economic indicators across European regions with this impactful map-based presentation. Use shaded country highlights and accompanying bar charts to present comparative data, performance trends, and regional growth. Ideal for economic reports, investor updates, or strategic planning. Fully editable and works seamlessly with PowerPoint, Keynote, and Google Slides.


6 diapositivas
Health Insurance Infographic
Health insurance is a type of insurance coverage that helps individuals and families manage the costs of medical expenses. This informative infographic template provides an overview of health insurance and its key aspects. This template is designed to help individuals, employers, and healthcare professionals understand the importance of health insurance and make informed decisions regarding coverage options. This template presents essential information in a visually engaging and easy-to-understand format, helping individuals and employers navigate the complex world of health insurance.


7 diapositivas
Startup Infographic Presentation Template
A Startup Infographic is a visual representation of information related to starting a new business, including important data, statistics, and information about the process of launching a startup company. The aim of our startup infographic is for you to present information in an easily digestible and visually appealing manner. Help to communicate complex concepts to an audience and the steps involved in starting a new business. Use this template to make presentations that’ll blow your audience away. This layout is flexible, adaptable and compatible with Powerpoint, Keynote, and Google Slides.


7 diapositivas
Success Team Work Infographic
Teamwork is the collaborative effort of a group of individuals, each contributing their diverse skills, knowledge, and experiences to achieve a common goal or complete a shared task. Our success teamwork infographic is an inspiring visual tool designed to showcase the art of collaborative achievement. Celebrate the collective triumphs of teamwork and highlight how unity and synergy lead to unparalleled success. Compatible with Powerpoint, Keynote, and Google Slides. This template encourages a culture of collaboration and showcases the magic that happens when individuals unite for a common purpose.


6 diapositivas
Progressive Work From Home Infographics
The "Progressive Work From Home" infographic template is an essential tool for today's evolving workplace. Compatible with PowerPoint, Keynote, and Google Slides, this template is designed for managers, team leaders, and organizations embracing the remote work model. This innovative template features essential elements of remote working, including tools for virtual collaboration, productivity metrics, and strategies for maintaining team cohesion. It's crafted to help you effectively communicate the benefits and best practices of remote work, making it invaluable for presentations aimed at optimizing work-from-home policies and procedures. The design is sleek and modern, with a color scheme that is both professional and uplifting. It embodies the flexibility and efficiency of remote work, making your presentation not just informative but also inspiring. Whether you're discussing remote work strategies with your team, presenting to management, or conducting a workshop, this template will ensure your message is clear, concise, and impactful.


6 diapositivas
International Law Infographics
Our International Law infographic is a versatile and informative tool for professionals and educators to incorporate into presentations on Powerpoint, Keynote, and Google Slides. It's specially crafted to elucidate the complexities of international law, making it an indispensable aid for lawyers, law students, and legal analysts. The infographic is thoughtfully designed to summarize the principles, mechanisms, and impact of international law on global relations. It provides a visual breakdown of treaties, jurisdiction, and the functions of international legal bodies. The layout is intended to guide the audience through the intricacies of international legal processes in a straightforward and comprehensible manner. Utilizing this infographic will enhance your ability to communicate the nuances of international legal frameworks effectively. It's particularly useful for lectures, seminars, or presentations that require a concise yet thorough explanation of international legal concepts. By presenting this graphic, you can foster a better understanding of how legal norms are applied across borders, promoting a more informed discussion on the subject.


6 diapositivas
Deluxe Loyalty Program Infographics
Explore the Deluxe Loyalty Program with our customizable infographic template. This template is fully compatible with popular presentation software like PowerPoint, Keynote, and Google Slides, allowing you to easily customize it to showcase the features, benefits, and advantages of the Deluxe Loyalty Program. The Deluxe Loyalty Program infographic template offers a visually engaging platform to highlight the rewards, incentives, and exclusive offers available to members of the program. Whether you're a business owner, marketer, or customer relations specialist, this template provides a user-friendly canvas to create informative presentations and promotional materials for your loyalty program. Optimize your loyalty program's visibility and appeal with this SEO-optimized infographic template, thoughtfully designed for clarity and ease of use. Customize it to showcase program tiers, benefits, points accumulation, and member testimonials, ensuring that your audience understands the value of participating in the Deluxe Loyalty Program. Start crafting your personalized infographic today to promote customer loyalty and engagement effectively.


21 diapositivas
Dreameon Agency Portfolio Presentation
Showcase your agency's expertise with this sleek and modern portfolio presentation template. Designed to highlight your achievements, creative processes, and client success stories, this template offers a comprehensive layout that communicates professionalism and innovation. From introducing your team and services to detailing case studies and market analysis, each slide is meticulously crafted to leave a lasting impression. Display your strategy development, social media impact, and measurement analytics effectively, ensuring a cohesive narrative that resonates with your audience. Easily customizable and compatible with PowerPoint, Google Slides, and Keynote, this template is perfect for agencies looking to pitch their capabilities, attract new clients, or present project achievements with confidence.