


Características


¿Tienes alguna pregunta?
Recomendar


6 diapositivas
1-Page Executive Summary Slide Presentation
Bring clarity to complex updates in a single, colorful layout designed to keep your audience engaged from start to finish. This clean and modern slide breaks down key messages into six distinct points, making it easy to showcase progress, milestones, or strategies. Fully compatible with PowerPoint, Keynote, and Google Slides.


26 diapositivas
Fundraising Event Presentation
Inspire generosity and support for your cause with our Fundraising Event presentation template, ideal for PowerPoint, Keynote, and Google Slides. This template is crafted with non-profit organizations, charity foundations, and event coordinators in mind, featuring a heartwarming design that encourages giving and communal effort. The slides are tailored to highlight the importance of philanthropy, with 'big image slides' to tell the stories of those you're helping, 'process infographics' to explain how donations are used, and 'chart slides' to show the impact of collected funds. The soothing color palette and thoughtful graphics create an atmosphere of hope and solidarity. Our Fundraising Event template is more than just a collection of slides; it's a powerful storytelling tool that can galvanize audiences into action. Download it now to create a moving presentation that not only shares the vision of your event but also rallies the community around your noble cause.


22 diapositivas
Galvonic Research Proposal Presentation
Present research insights professionally with this comprehensive proposal template. Covering objectives, methodology, findings, and implications, it provides a clear structure for academic or market research projects. Compatible with PowerPoint, Keynote, and Google Slides, it’s ideal for presenting detailed analysis, conclusions, and future directions.


4 diapositivas
Corporate Growth and Strategy Map Presentation
Visualize your business development path with this layered strategy map. Ideal for showcasing organizational goals, strategic initiatives, and cascading growth stages. Each level is clearly structured for easy customization, making it perfect for leadership planning, corporate roadmaps, or strategic reviews in PowerPoint, Keynote, or Google Slides.


6 diapositivas
Editable Gantt Timelines Presentation
Bring your project plans to life with a clean, colorful timeline that makes progress easy to track and goals simple to communicate. This presentation helps teams visualize schedules across quarters, highlight tasks, and manage deadlines with clarity. Fully compatible with PowerPoint, Keynote, and Google Slides.


22 diapositivas
Virtus Qualitative Research Findings Presentation
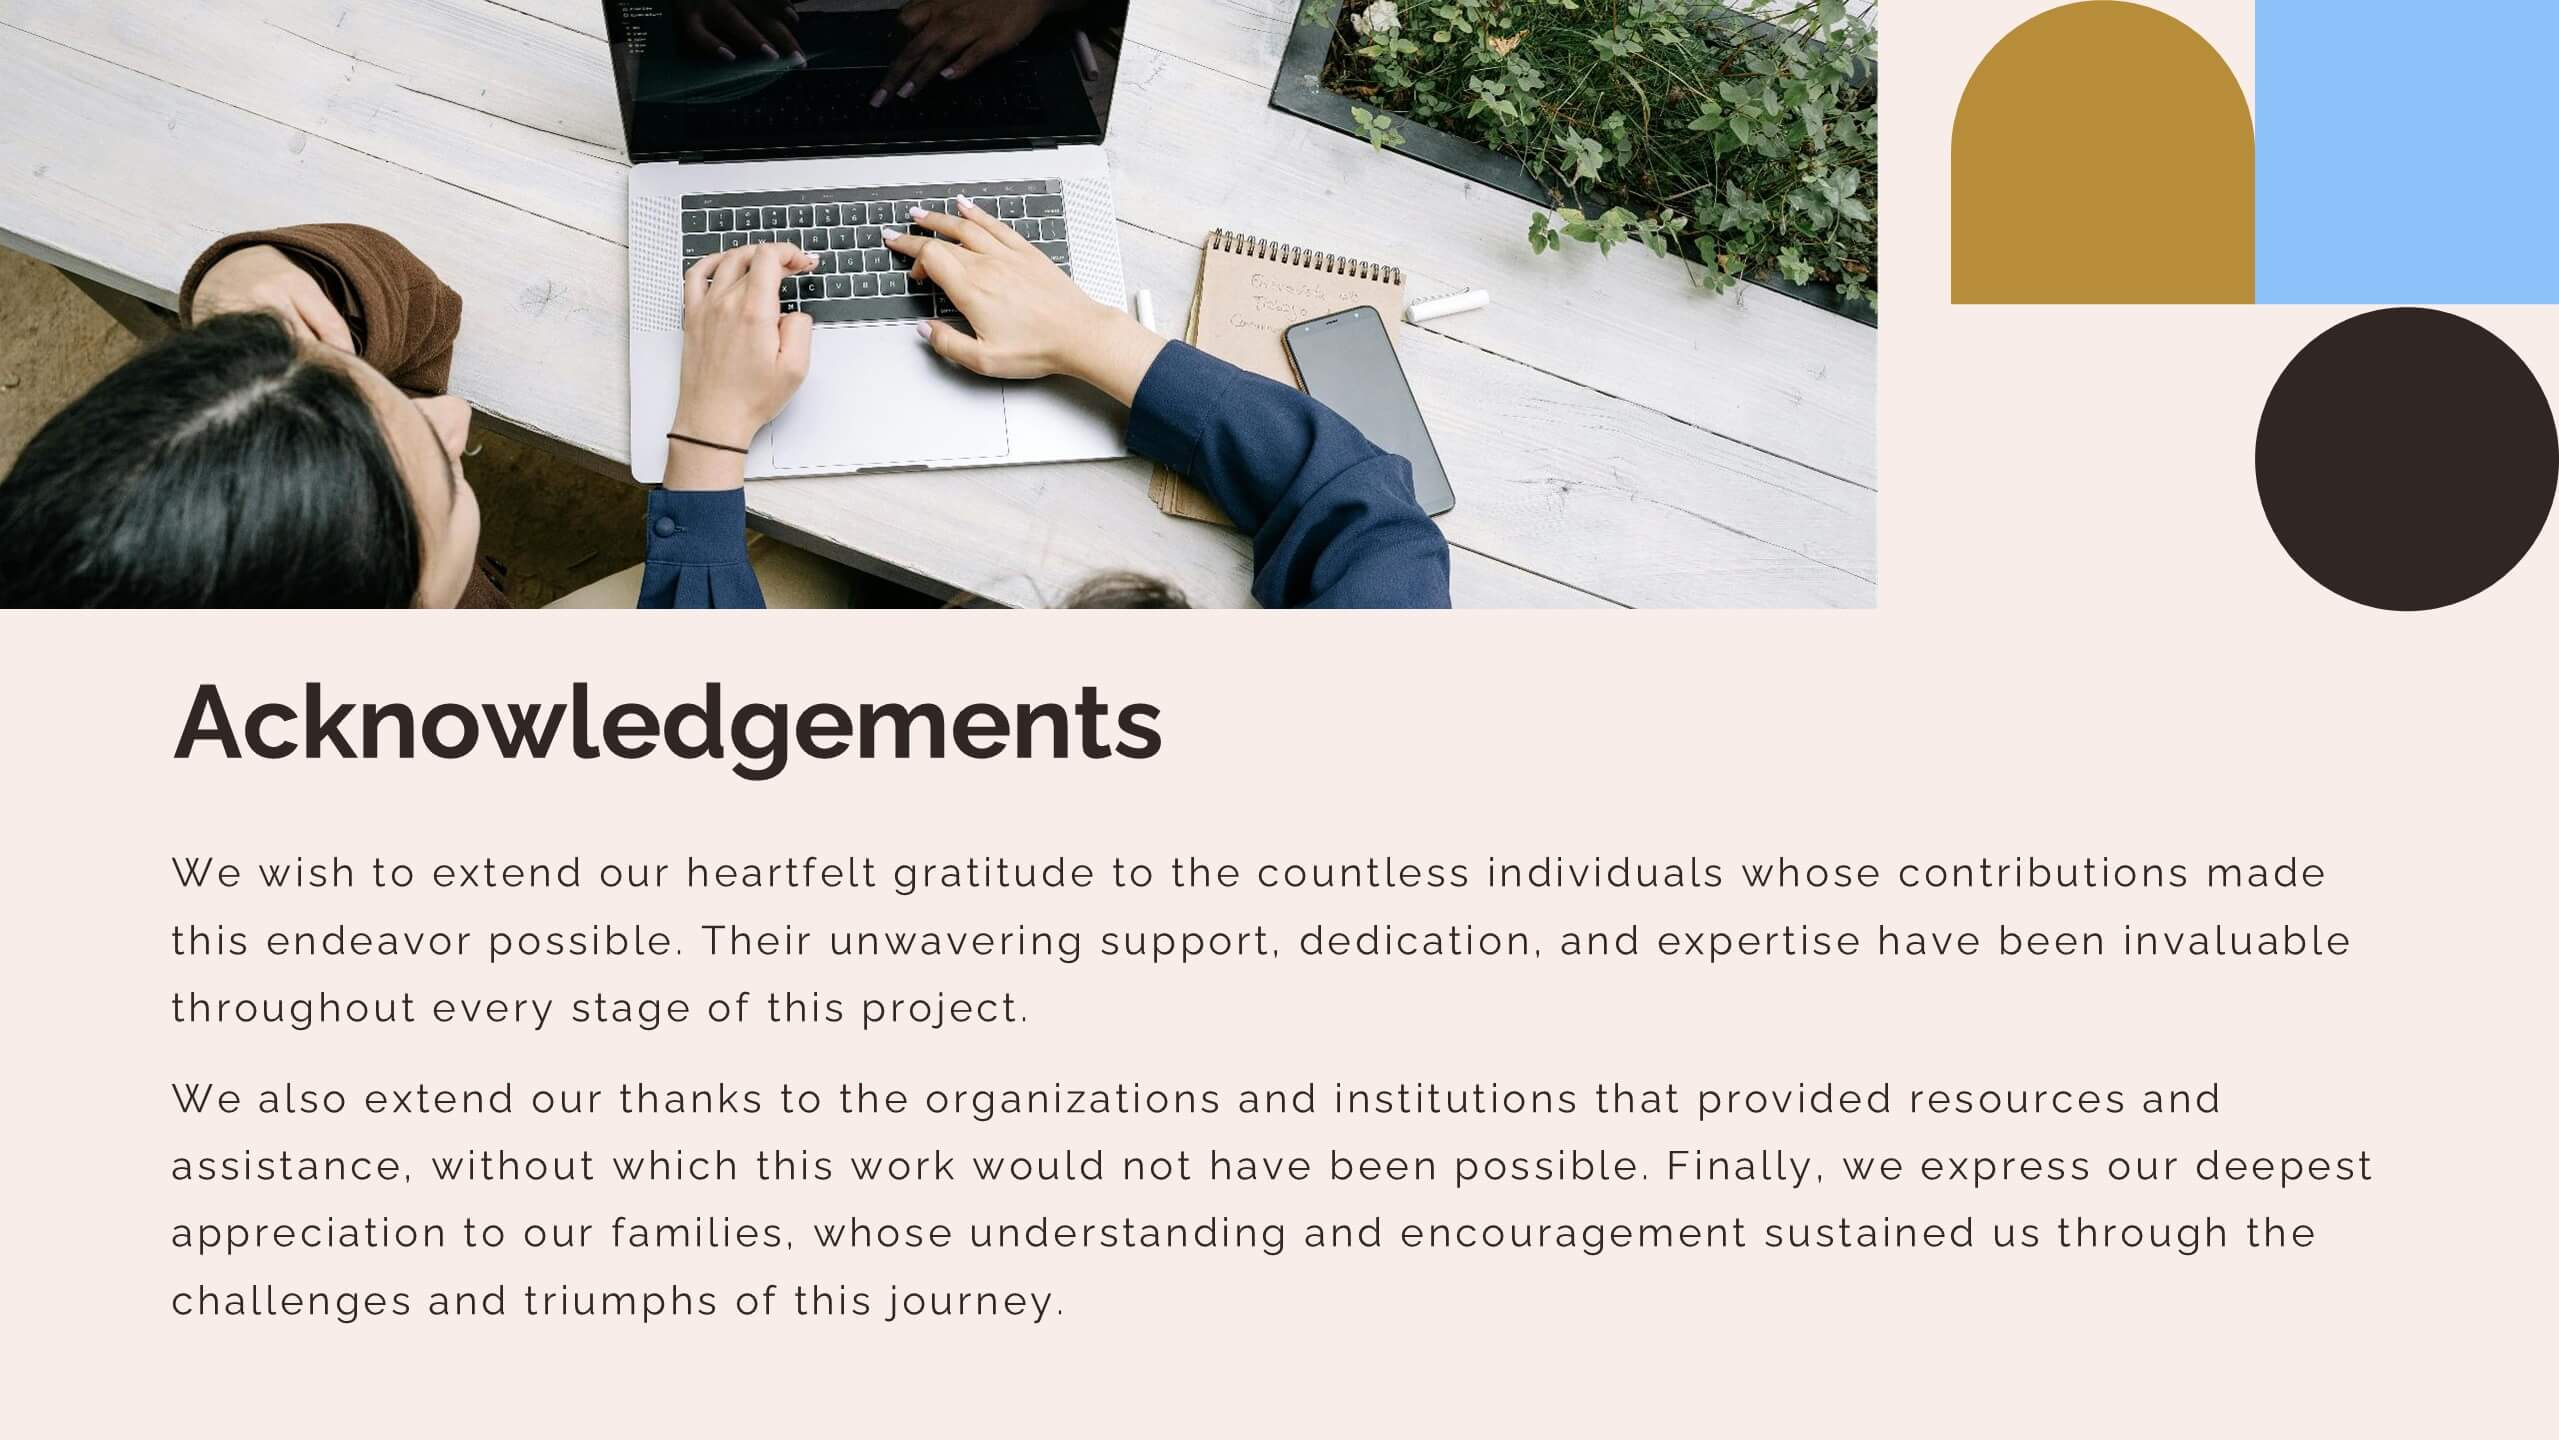
This qualitative research findings template features a modern design with geometric shapes and a professional palette of blue, gold, and black. It’s structured to showcase research details effectively, covering objectives, methodology, findings, limitations, and future directions. Compatible with PowerPoint, Keynote, and Google Slides for seamless presentations.


7 diapositivas
Customer Success Journey Infographic
A customer journey infographic is a visual representation of your customer's experience with your company. It can help you gain insight into where they're struggling and how they feel about your product or service. This infographic template will help you understand the top factors that influence your customers' decisions, including the most common problems they face. With this template you'll also learn how their behaviors change over time—and how to structure marketing campaigns that stay with them throughout their journey. Fully customizable and compatible with Powerpoint, Keynote, and Google Slides.


3 diapositivas
Linear Business Process Flow Presentation
Give your workflow a smooth, streamlined story with a layout that makes every step feel clear and intentional. This presentation outlines processes in a clean, linear format ideal for planning, operations, or strategy mapping. Fully compatible with PowerPoint, Keynote, and Google Slides.


6 diapositivas
Decision Analysis Infographics
Enhance your decision-making skills with our Decision Analysis infographic template. This template is fully compatible with popular presentation software like PowerPoint, Keynote, and Google Slides, allowing you to easily customize it to illustrate and communicate various aspects of decision analysis. The Decision Analysis infographic template offers a visually engaging platform to explore and explain the principles, methodologies, and tools used in making informed decisions. Whether you're a business leader, analyst, project manager, or simply interested in effective decision-making, this template provides a user-friendly canvas to create informative presentations and educational materials. Optimize your decision analysis processes with this SEO-optimized Decision Analysis infographic template, thoughtfully designed for clarity and ease of use. Customize it to showcase decision trees, risk assessment techniques, decision matrices, and the importance of data-driven choices, ensuring that your audience gains valuable insights into this critical skill. Start crafting your personalized infographic today to become a more proficient decision analyst.


10 diapositivas
Financial Investment Portfolio Presentation
The "Financial Investment Portfolio" templates use a visually appealing mix of arrow and coin icons to represent different aspects of financial portfolios. Each slide varies slightly in color palette and layout but maintains a consistent theme that effectively uses symbols to emphasize key financial concepts or data points. These designs are excellent for presentations aimed at illustrating investment strategies, portfolio distributions, or financial growth, providing both clarity and aesthetic appeal to the information presented.


5 diapositivas
Manufacturing in the US Infographics
Delve into the industrial heartbeat of America with the manufacturing in the US infographics. Rendered in patriotic hues of red, blue, and white, this vertical, creative, and informative template is a powerhouse of insight, perfect for industry analysts, educational purposes, or corporate presentations aiming to explore the intricacies of U.S. manufacturing. The infographic doesn’t just present data; it tells the story of American industry, with engaging graphics, intuitive icons, and dedicated spaces for real imagery that bring facts to life. This tool is invaluable for anyone needing to communicate the vast scope of U.S. manufacturing prowess effectively and compellingly.


7 diapositivas
E-Learning Tools Infographic Presentation
E-learning refers to any type of learning that occurs through electronic devices, and offers numerous benefits, including flexibility, cost-effectiveness, continuous learning, and environmental friendliness. This E-Learning Template is designed to make your online training and educational material more engaging and effective. The template is fully customizable and compatible with presentation software such as Powerpoint, Keynote, and Google Slides. This template is a powerful tool for anyone who wants to create engaging and effective online training and educational material!


5 diapositivas
Information Technology Uses Infographics
Navigate the digital era with our information technology uses infographics, a synthesis of design and functionality. Presented in the trustworthy shades of blue and the vibrant hues of green, this template captures the essence of IT applications across spectrums. Whether you're an educator or tech enthusiast, these vertical, creatively designed infographics serve as a conduit to explain the intricacies of contemporary tech use. Compatible with Powerpoint, Keynote, and Google Slides. Complete with expressive icons and customizable image placeholders, this visual aid is crafted for clarity, making complex IT concepts engaging for audiences.


7 diapositivas
Company Title Infographic
This collection of slides is designed to vividly present company profiles and services, utilizing a dynamic color palette of blue, yellow, and white to create an engaging viewer experience. Each slide is meticulously crafted to cater to specific content, enhancing the presentation's overall effectiveness and appeal. Starting with the "Empathy Map" slide, it offers a detailed insight into customer perceptions and experiences, essential for tailoring services to meet client needs. The "SEO Report" slide focuses on showcasing quantifiable data, critical for evaluating marketing success. A dedicated "Portfolio" slide highlights past achievements, pivotal for attracting potential clients and investors by demonstrating proven capability and success. Further slides like "What We Do" and "Objectives" provide clear, straightforward layouts that detail the company’s primary activities and strategic goals, respectively. The "Projects" slide offers a glimpse into current and prospective projects, illustrating ongoing development and future aspirations. Ideal for stakeholder briefings, marketing pitches, or internal reviews, these templates support companies in communicating a cohesive and comprehensive narrative of their operational scope and strategic direction.


5 diapositivas
Geometric Design Elements
Make your message stand out with this bold, 3D geometric infographic layout. Ideal for visualizing layered concepts, structural data, or multi-dimensional strategies. Each triangular section is color-coded and fully editable to align with your brand or topic. Compatible with PowerPoint, Keynote, and Google Slides.


5 diapositivas
Experience-Based Smile Scorecard Presentation
Measure sentiment with ease using this Experience-Based Smile Scorecard slide. Designed with a vertical battery-style layout, each tier represents a distinct emotional level—from dissatisfied to happy. Ideal for visualizing user experiences, customer feedback, or service quality. Fully editable and compatible with PowerPoint, Canva, and Google Slides.


4 diapositivas
Customer Type Identification Strategy Deck Presentation
Visualize your customer segmentation strategy with this layered targeting slide. Perfect for identifying different customer types based on behavior or loyalty levels, this layout uses a human silhouette and concentric zones to highlight proximity to the core user. Fully editable and compatible with PowerPoint, Keynote, and Google Slides.