


Características


¿Tienes alguna pregunta?
Recomendar


4 diapositivas
E-Learning Course Design Overview Presentation
Spark curiosity from the very first slide with a clean, modern layout that explains how effective online learning experiences are planned and delivered. This presentation walks through key elements of course structure, content flow, and learner engagement in a simple, visual way. Fully compatible with PowerPoint, Keynote, and Google Slides.


7 diapositivas
Office Scenes Interview Infographic
Office Scenes refer to various activities, situations, or interactions that occur within a typical office environment. Embark on a visual journey through the dynamic world of interviews and office scenes with our office scenes interview infographic template. This visually appealing and informative template is tailored to give insights into the art of interviews, providing valuable tips and tricks for success within the corporate sphere. Compatible with Powerpoint, Keynote, and Google Slides. This template presents an enticing introduction to the world of interviews, setting the stage for a journey towards success and career growth.


6 diapositivas
Customer Journey Map Presentation
Visualize the customer experience step-by-step with the Customer Journey Map Presentation. This sleek infographic helps you outline key touchpoints from awareness to post-purchase, making it ideal for marketing strategies, service design, or UX presentations. Fully editable and compatible with PowerPoint, Keynote, and Google Slides.


6 diapositivas
Scalable Data Systems and Analytics Presentation
Break down your cloud data architecture with clarity and flow using this visual diagram template. It helps illustrate how your scalable data systems interact—from ingestion to processing and analytics. Perfect for IT teams and tech presentations. Easily editable and compatible with PowerPoint, Keynote, and Google Slides.


5 diapositivas
Wedding Ceremony Program Infographics
Wedding Ceremony infographics are visual representations that provide essential information and details about a wedding ceremony. These vertical infographics feature eye catching designs that will help you present a unique and memorable wedding ceremony program. This template is perfect for couples, wedding planners, or event organizers looking to present the order of events and important details in a visually engaging way. These infographics are designed using elegant and romantic elements, such as delicate illustrations, floral motifs, and soft color palettes, creating a charming and visually cohesive look.


5 diapositivas
Marketing Concepts Infographics
Marketing Concepts refer to the various strategies and philosophies that guide the marketing efforts of businesses and organizations. Our marketing concept infographics are visual representations of the different marketing concepts and strategies that businesses use to promote their products or services. These infographics can cover a wide range of marketing topics, including target audience, product positioning, branding, advertising, and video marketing. The purpose of these infographics is to provide a easy-to-understand overview of key marketing concepts that businesses can use to drive sales and increase brand awareness.


22 diapositivas
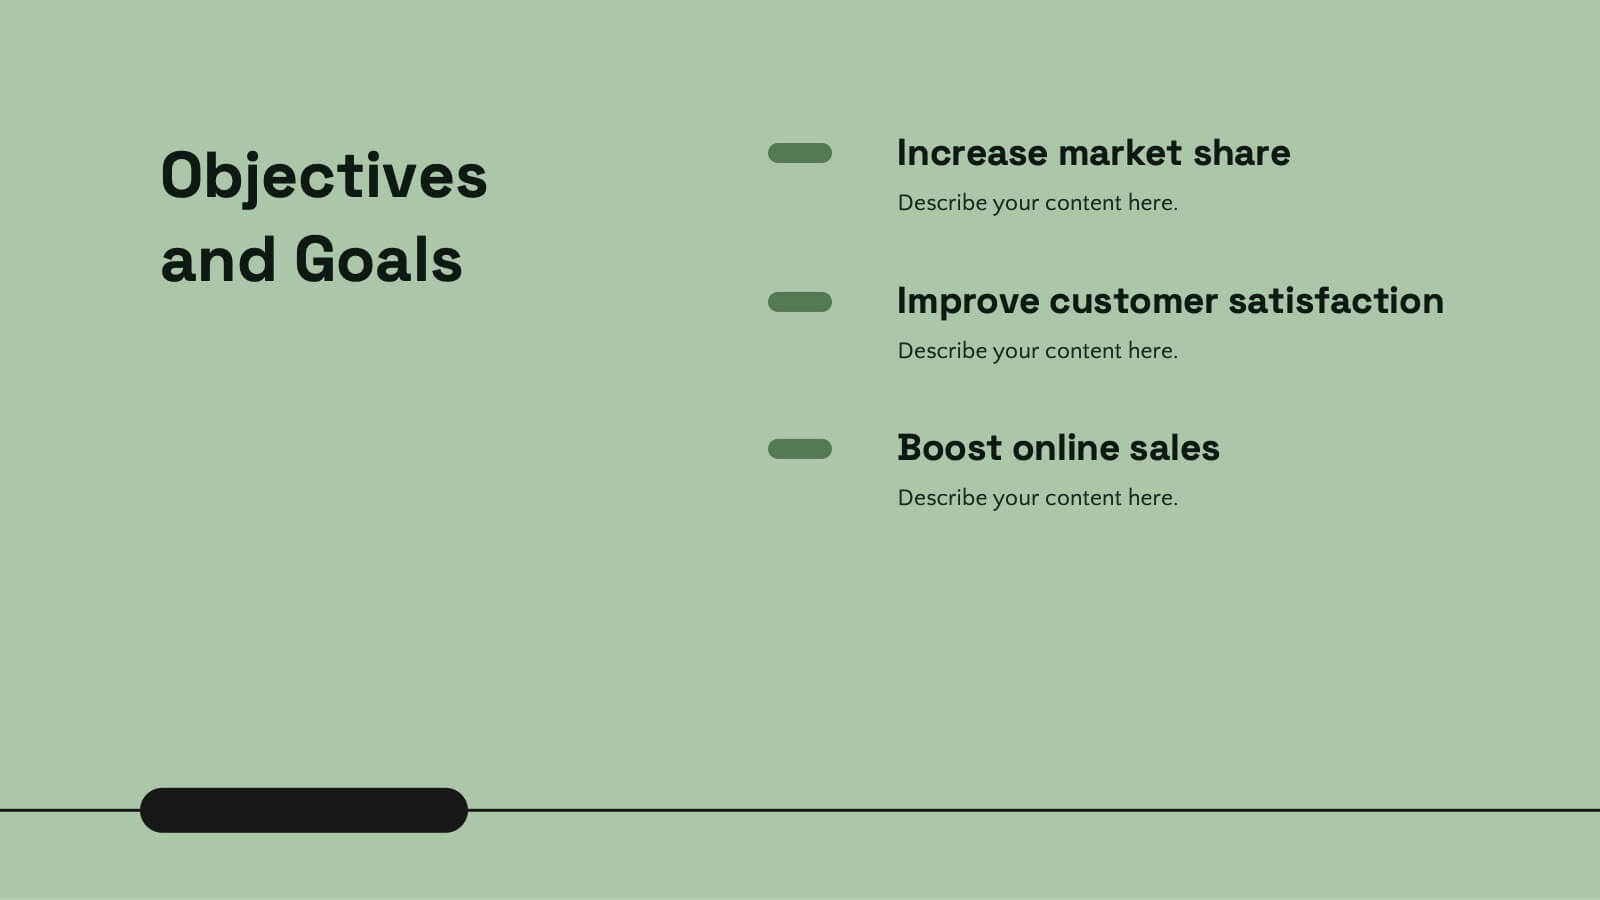
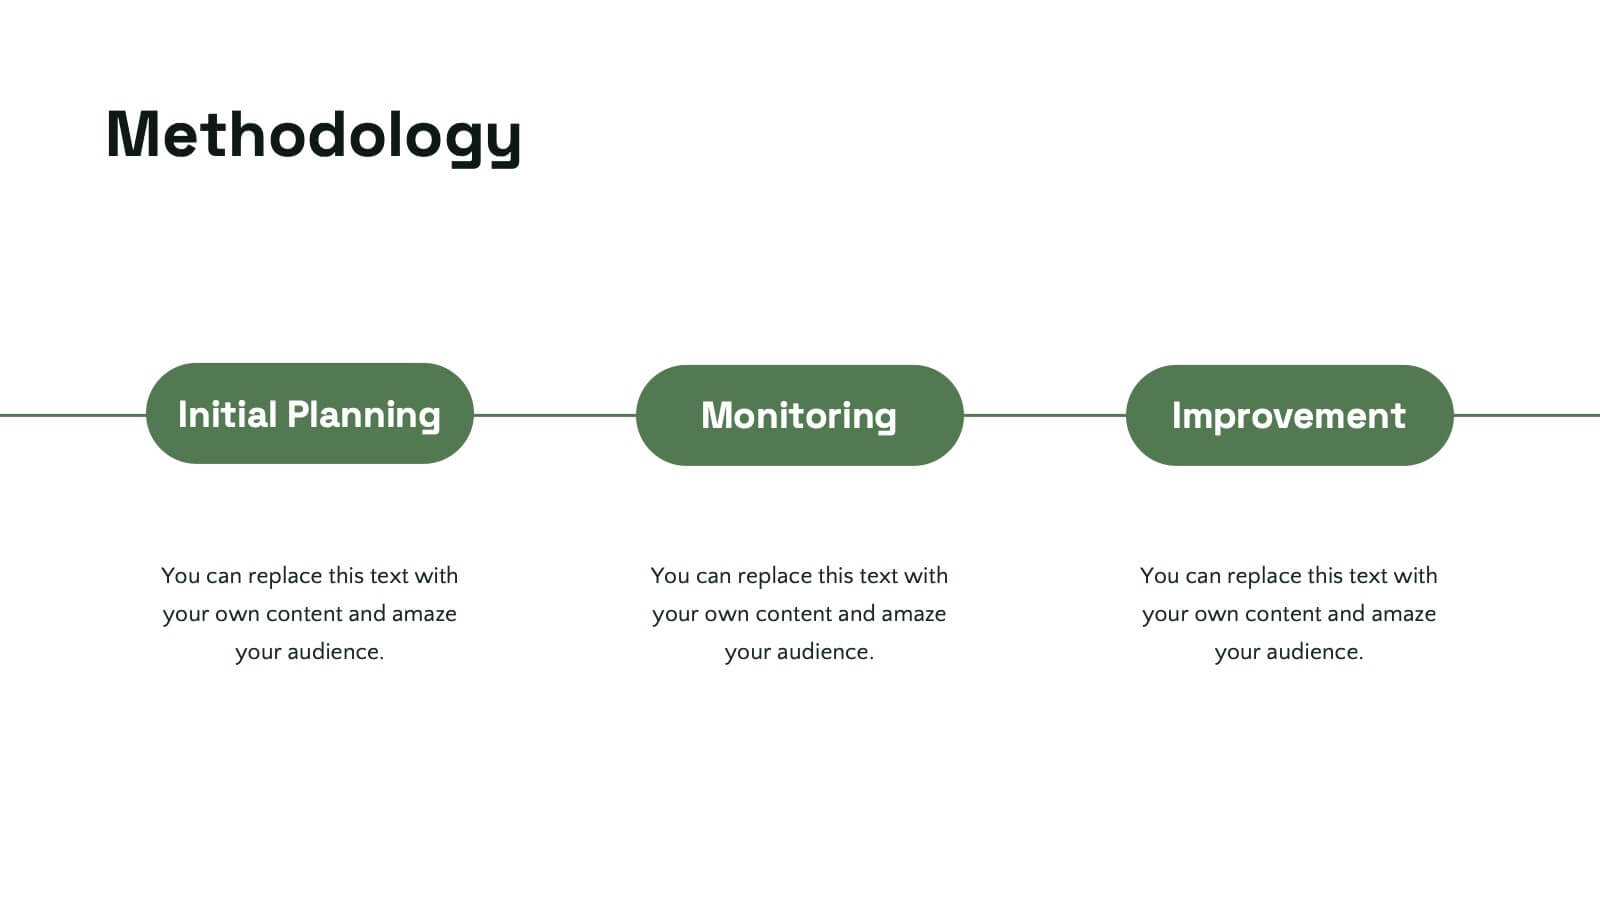
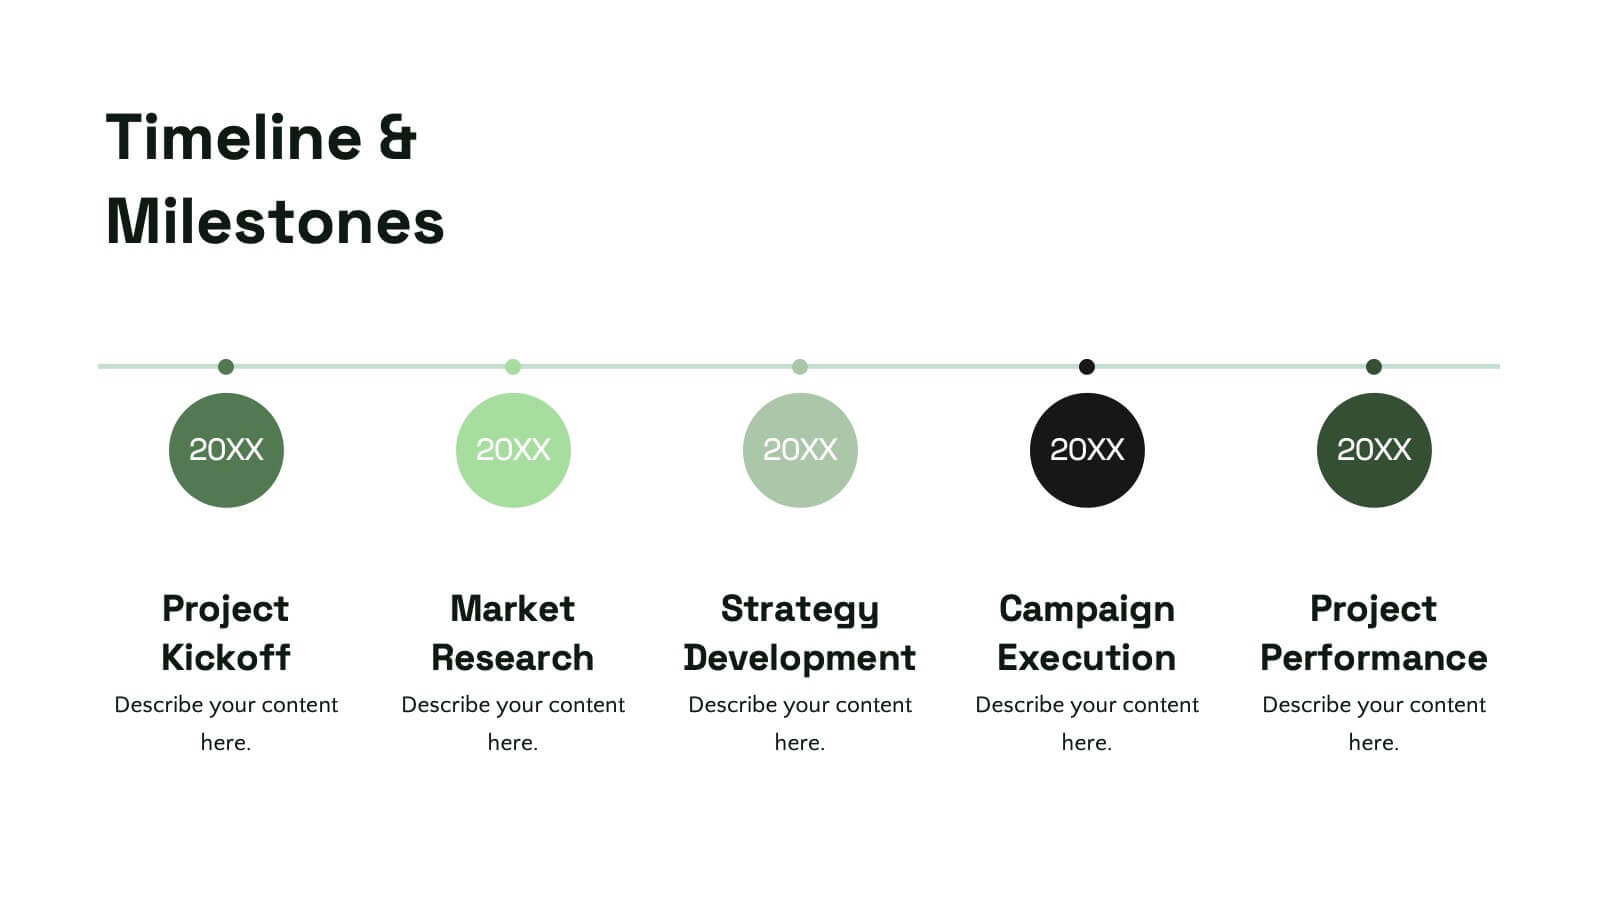
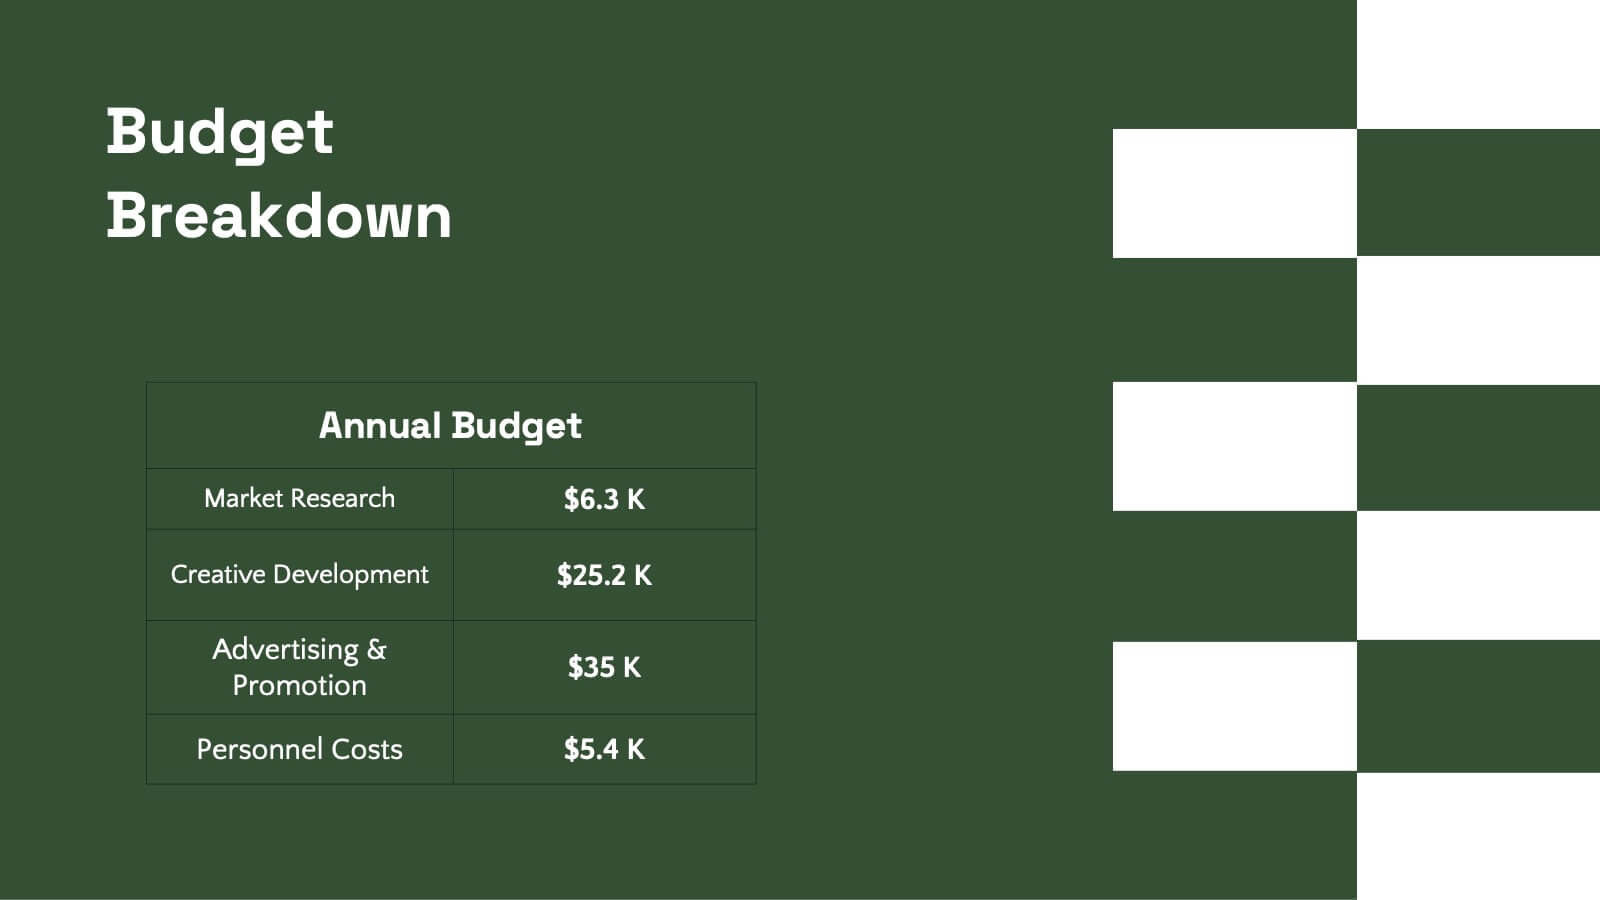
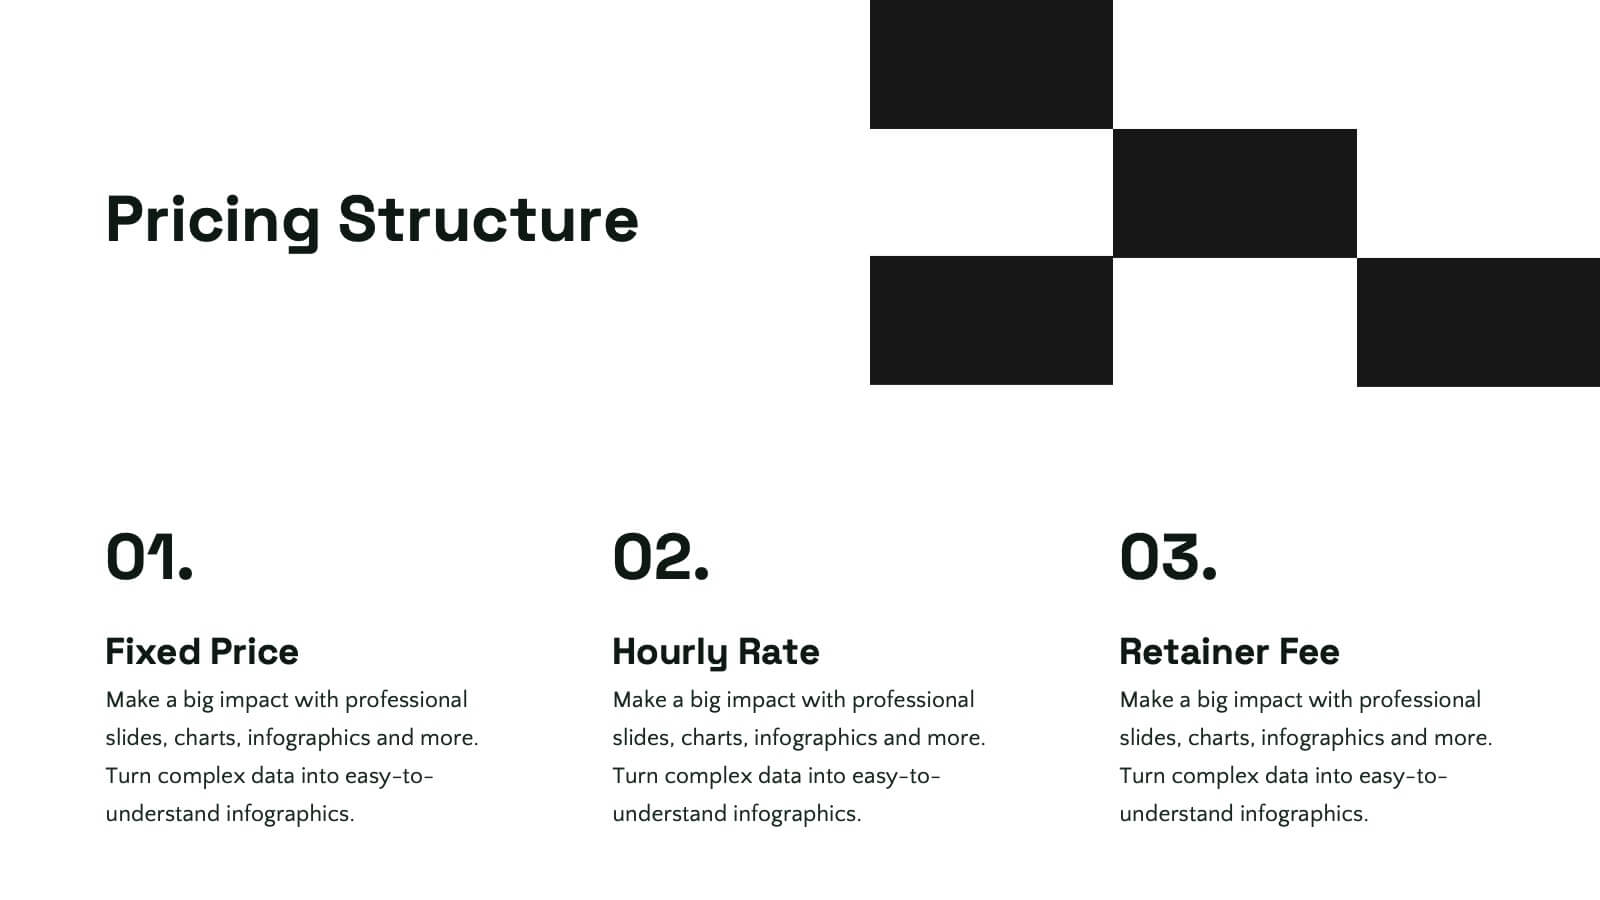
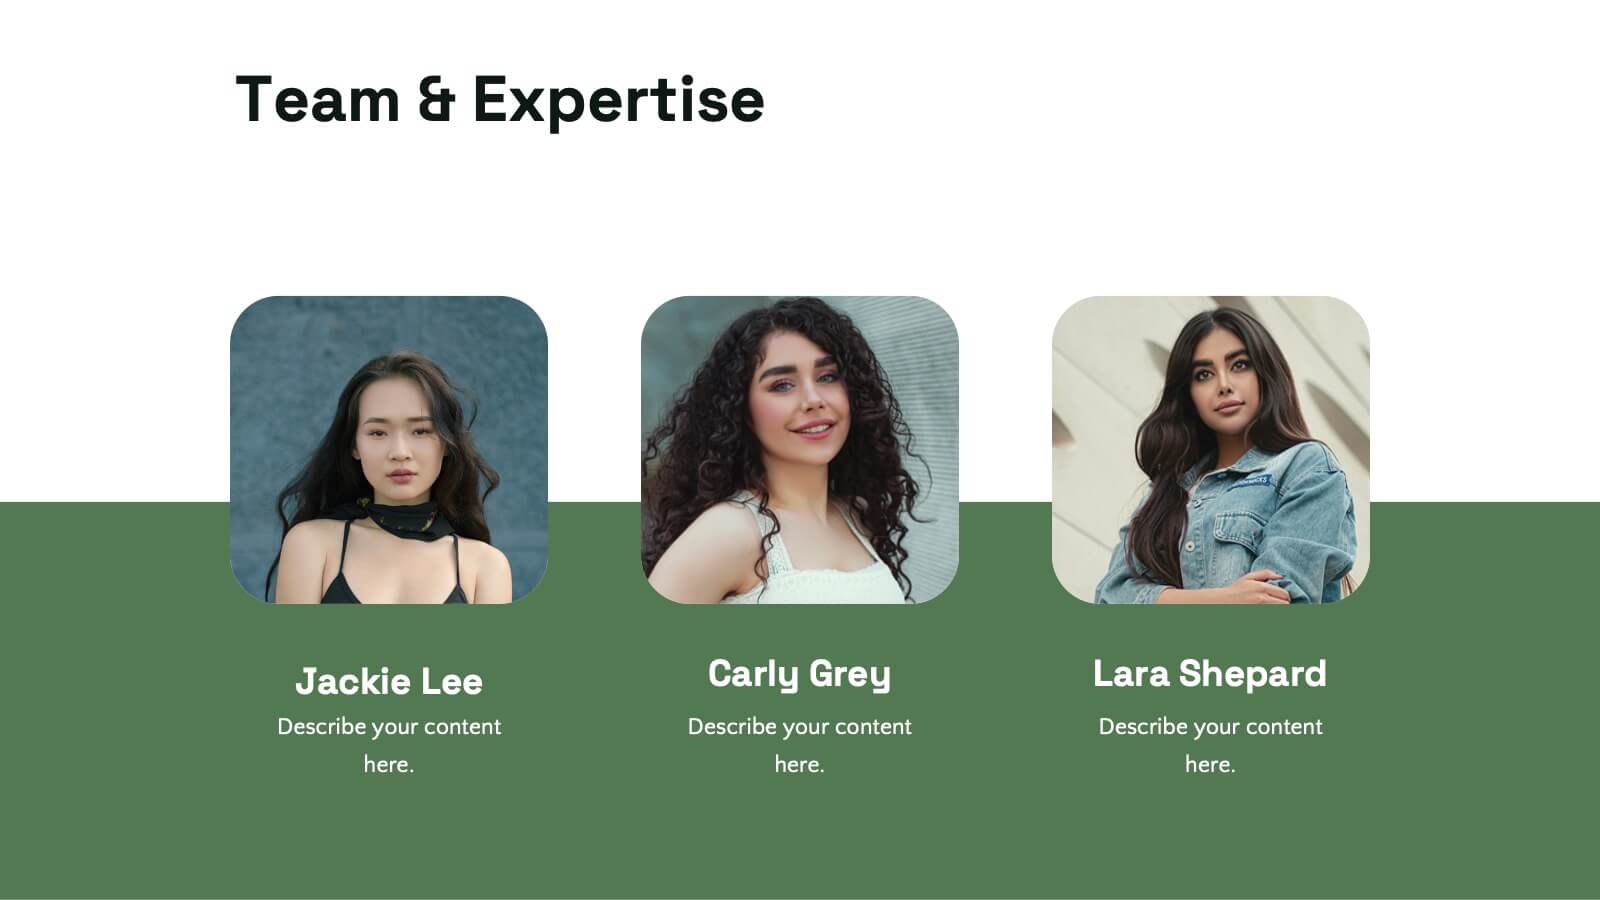
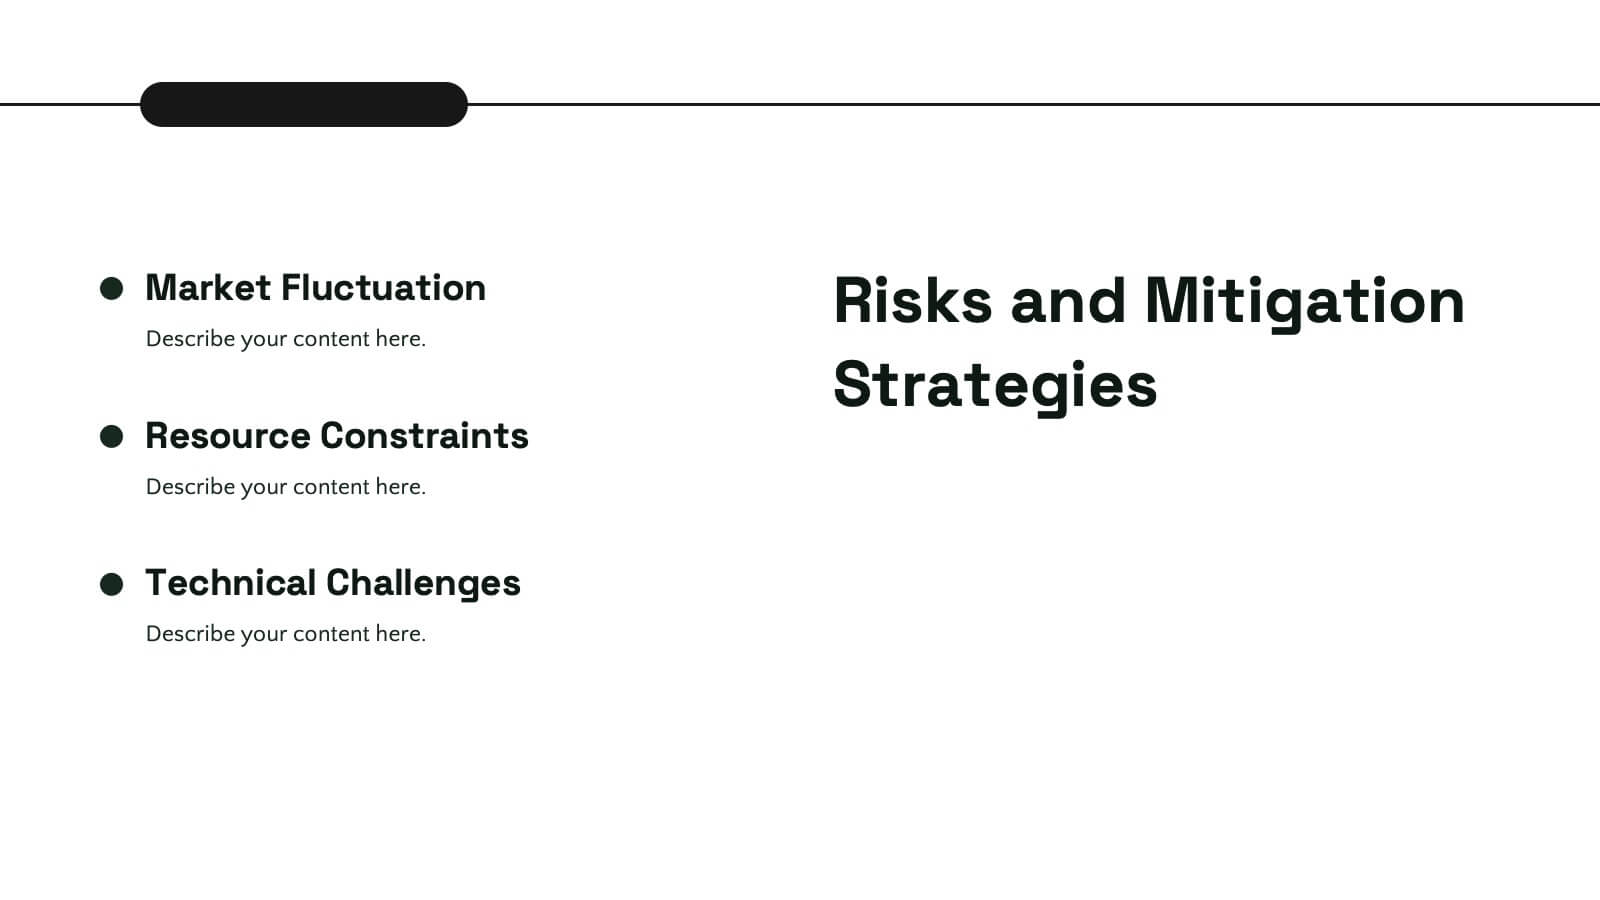
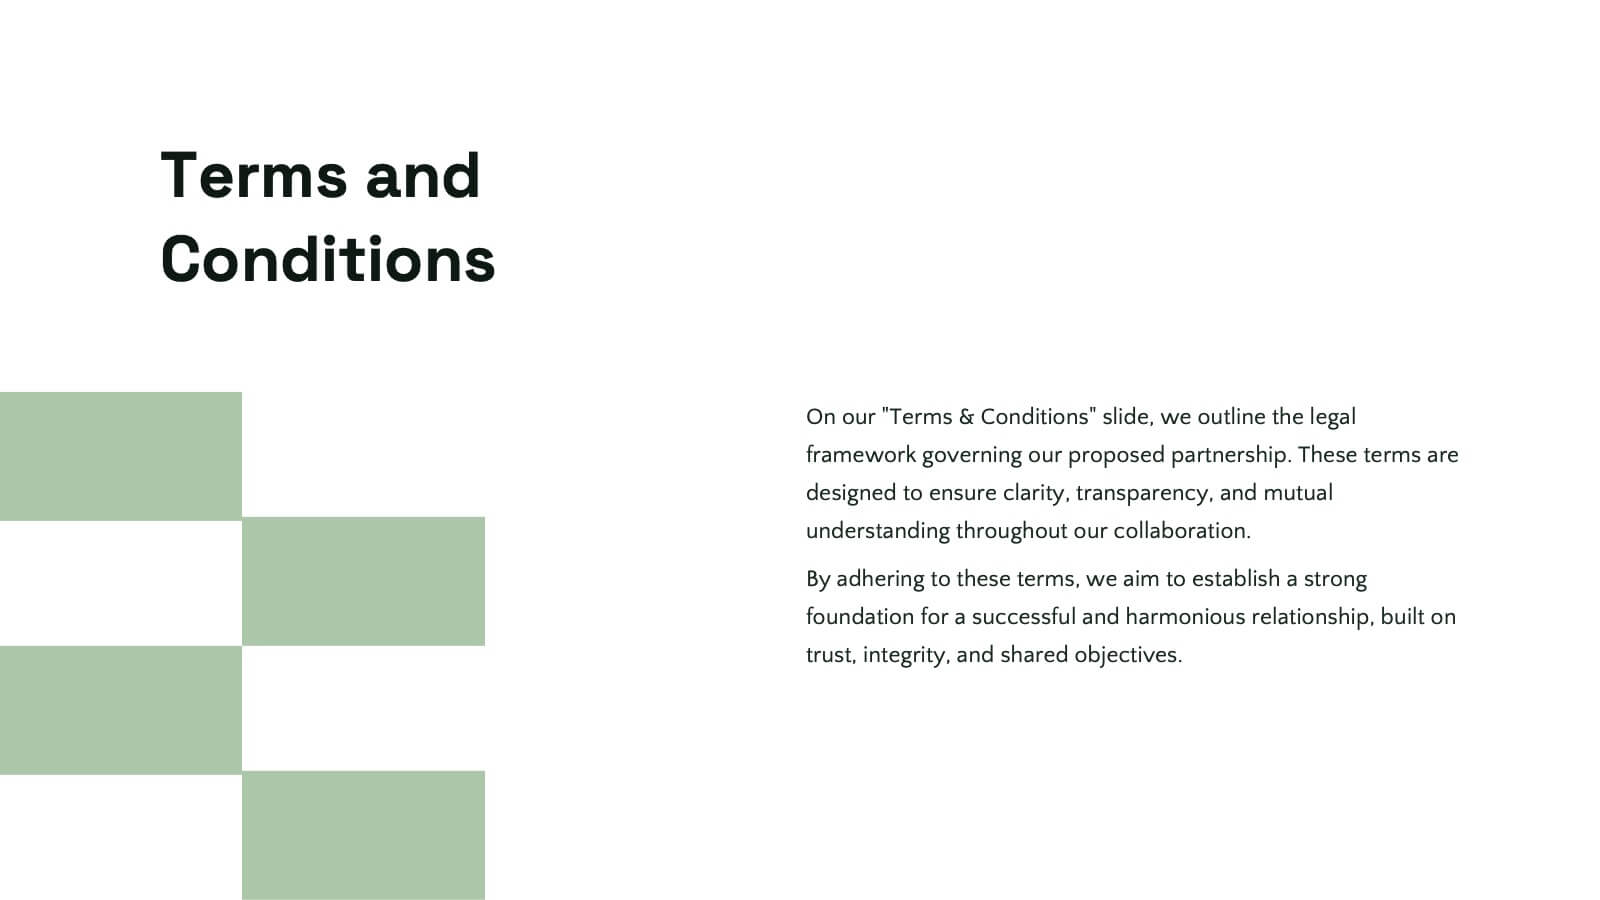
Etherwind Advertising Agency Proposal Presentation
This Advertising Agency Proposal Presentation Template offers a sleek and professional layout, perfect for showcasing your agency's capabilities, services, and success stories. Covering essential sections such as market analysis, strategy development, campaign execution, and client testimonials, it ensures a compelling pitch to potential clients. Designed for easy customization in PowerPoint, Keynote, and Google Slides, making it a versatile choice for agencies looking to impress their audience.


8 diapositivas
Benefits Table Template
Optimize your presentation of complex options with our "Benefits Table Template." Designed to clearly distinguish between different plans, this template enables you to showcase Plan A, Plan B, and Plan C with ease. Each column is distinctively colored and detailed to ensure your audience can grasp the variances in benefits at a glance. Ideal for comparing packages, costs, or strategic choices in a corporate setting, this template helps clarify decision-making processes. Compatible with PowerPoint, Keynote, and Google Slides, it is an invaluable tool for business analysts, sales teams, and marketers aiming to communicate effectively with their stakeholders.


5 diapositivas
Target Audience Demographics
Present gender-based audience insights with this clean, dual-bar infographic slide. Ideal for showing comparative statistics between men and women across five demographic categories. Use this layout to support marketing analysis, campaign targeting, or consumer behavior reports. Editable in PowerPoint, Keynote, and Google Slides.


19 diapositivas
Prism Design Strategy Proposal Presentation
Bring your design strategy to life with this modern and stylish presentation template! Perfect for showcasing your design concepts, processes, and elements, this template ensures that your ideas are communicated effectively. With a sleek layout for design briefs, mood boards, prototypes, and project timelines, it's the ideal tool for creative professionals. Customize it easily in PowerPoint, Keynote, or Google Slides to make a lasting impression on your audience.


21 diapositivas
Sonata Product Roadmap Presentation
Navigate the future of your product with a structured and compelling roadmap presentation template. Designed for product managers, entrepreneurs, and teams, this layout provides a clear framework to outline product goals, strategies, and timelines effectively. The template includes sections for product overviews, customer pain points, unique value propositions, competitive analysis, pricing strategies, and user experience mapping. It also features slides for stakeholder communication, marketing rollouts, and technical specifications to ensure every aspect of your product journey is covered. Fully compatible with PowerPoint, Google Slides, and Keynote, this template is easy to customize with your brand’s colors, fonts, and visuals. Present your product's roadmap confidently, engaging stakeholders and aligning your team towards success.
19 diapositivas
Tidal Design Proposal Presentation
Elevate your pitch with this sleek design proposal template! Perfect for presenting project details, objectives, methodology, and milestones, it ensures your ideas stand out. Impress stakeholders with clear, structured slides and professional aesthetics. Compatible with PowerPoint, Keynote, and Google Slides for a seamless presentation experience across all platforms.


7 diapositivas
Loyalty Program Infographic Presentation Template
Loyalty programs are effective marketing tools that encourage consistent customers and offer an incentive for people to make more purchases from you. This template is perfect for you and your customers it helps present all your information in one presentation. This template is made to be displayed to your customers and workplace. You can use this to show your customers how they are given points or rewards every time they purchase from your store. The fun colorful illustrations used in this template are designed to help your customers understand how the program works and get them excited about it.


10 diapositivas
Business Growth and Market Statistics Presentation
Showcase key business growth trends and market insights with the "Business Growth and Market Statistics" presentation templates. These visuals are crafted to enhance clarity in communicating growth drivers, market dynamics, and performance metrics effectively. Ideal for corporate presentations, they're compatible with PowerPoint, Keynote, and Google Slides, ensuring a professional look across all platforms.


5 diapositivas
Artificial Intelligence Tools Infographics
Artificial Intelligence has advanced rapidly in recent years, leading to the development of various tools and technologies that leverage AI algorithms and techniques. These vertical infographics highlight various tools and technologies used in the field of AI. This template provides an engaging way to showcase different AI tools and their functionalities. This features a sleek and contemporary design that captures attention. The combination of vibrant colors, high-quality icons, and visuals adds a modern touch to the infographics. The template offers multiple slides that provide an overview of AI and its technologies.


7 diapositivas
Performance Summary Infographic
Boost your reporting capabilities with our Infographic Templates, designed to deliver exceptional clarity and impact. This series is perfectly suited for professionals seeking to present performance data compellingly and concisely. With a variety of designs including radial graphs, tiered lists, and comparative bars, these templates allow for an informative and aesthetically pleasing showcase of critical metrics. Each template is customizable, letting you adjust the color schemes and text to fit your corporate style, enhancing both visual appeal and brand consistency. Whether used in PowerPoint, Google Slides, or Keynote, these tools are vital for anyone looking to articulate achievements, assess comparative results, and plan based on solid data insights. They are indispensable for consultants, managers, and team leaders who require clear, persuasive presentation resources to drive decisions and highlight successes.


7 diapositivas
Technology Innovations Infographic
Technology innovations refer to significant and novel advancements, improvements, or creations in processes, products, services, or systems that introduce new features, functionalities, or approaches. Get ready to ignite the tech world with our technology infographic. This infographic will journey your audience into the cutting-edge world of technology. Prepare your viewers for a mind-blowing showcase of innovation and progress. Compatible with Powerpoint, Keynote, and Google Slides. Inspire action and invite readers to step boldly into a new era of technological innovations.