


Características


¿Tienes alguna pregunta?
Recomendar


7 diapositivas
Team Collaboration Strategy Presentation
Enhance teamwork and synergy with the Team Collaboration Strategy presentation template. Designed to visualize key collaboration efforts, this template helps businesses, project managers, and HR teams define roles, optimize workflow, and foster communication. Featuring a puzzle-piece structure, this fully customizable design is compatible with PowerPoint, Keynote, and Google Slides.


6 diapositivas
Three-Point Framework Triangle Diagram Presentation
Break down complex strategies with the Three-Point Framework Triangle Diagram template. This visually structured design helps you present key business components in a clear, logical format, making it ideal for decision-making, planning, and analysis. Fully customizable and easy to use, it's compatible with PowerPoint, Keynote, and Google Slides for seamless integration.


6 diapositivas
Customer Conversion Funnel
Visualize every stage of your customer journey with the Customer Conversion Funnel Presentation. This layered funnel diagram breaks down the conversion process into five clear levels—from awareness to action—making it easy to explain how leads are captured and converted. Ideal for digital marketers, sales teams, and consultants presenting campaign performance, lead nurturing, or CRM workflows. Compatible with PowerPoint, Keynote, and Google Slides.


7 diapositivas
Competitive Analysis Using Strategy Wheel
Highlight your competitive edge with this dynamic strategy wheel diagram. Designed to visually compare up to six business components, this slide is ideal for showcasing strengths, weaknesses, or market positioning. Perfect for strategic planning sessions, it’s fully editable in PowerPoint, Keynote, and Google Slides.


6 diapositivas
Supply Chain and Logistics Strategy Presentation
Streamline complex logistics workflows with this bold, dual-loop arrow layout. Ideal for showcasing the full cycle of sourcing, distribution, warehousing, and returns, this diagram lets you visualize forward and reverse logistics processes side by side. Customizable icons, clear progression, and ample space for key data make this a must-have for operations managers, procurement teams, and logistics planners. Fully compatible with PowerPoint, Keynote, and Google Slides.


4 diapositivas
Business Development Roadmap Presentation
Visualize your growth journey with this Business Development Roadmap Presentation. Featuring a winding road design with four milestones, it’s perfect for showcasing project phases, strategic goals, or quarterly plans. Each checkpoint is color-coded and icon-based for easy comprehension. Fully editable in PowerPoint, Keynote, and Google Slides.


12 diapositivas
Customer Satisfaction Smile Rating Presentation
Measure customer happiness with this engaging customer satisfaction smile rating template! Featuring a visual scale from dissatisfaction to delight, this design helps businesses track feedback and identify improvement areas. Ideal for reports, surveys, and performance reviews. Fully customizable and compatible with PowerPoint, Keynote, and Google Slides.
20 diapositivas
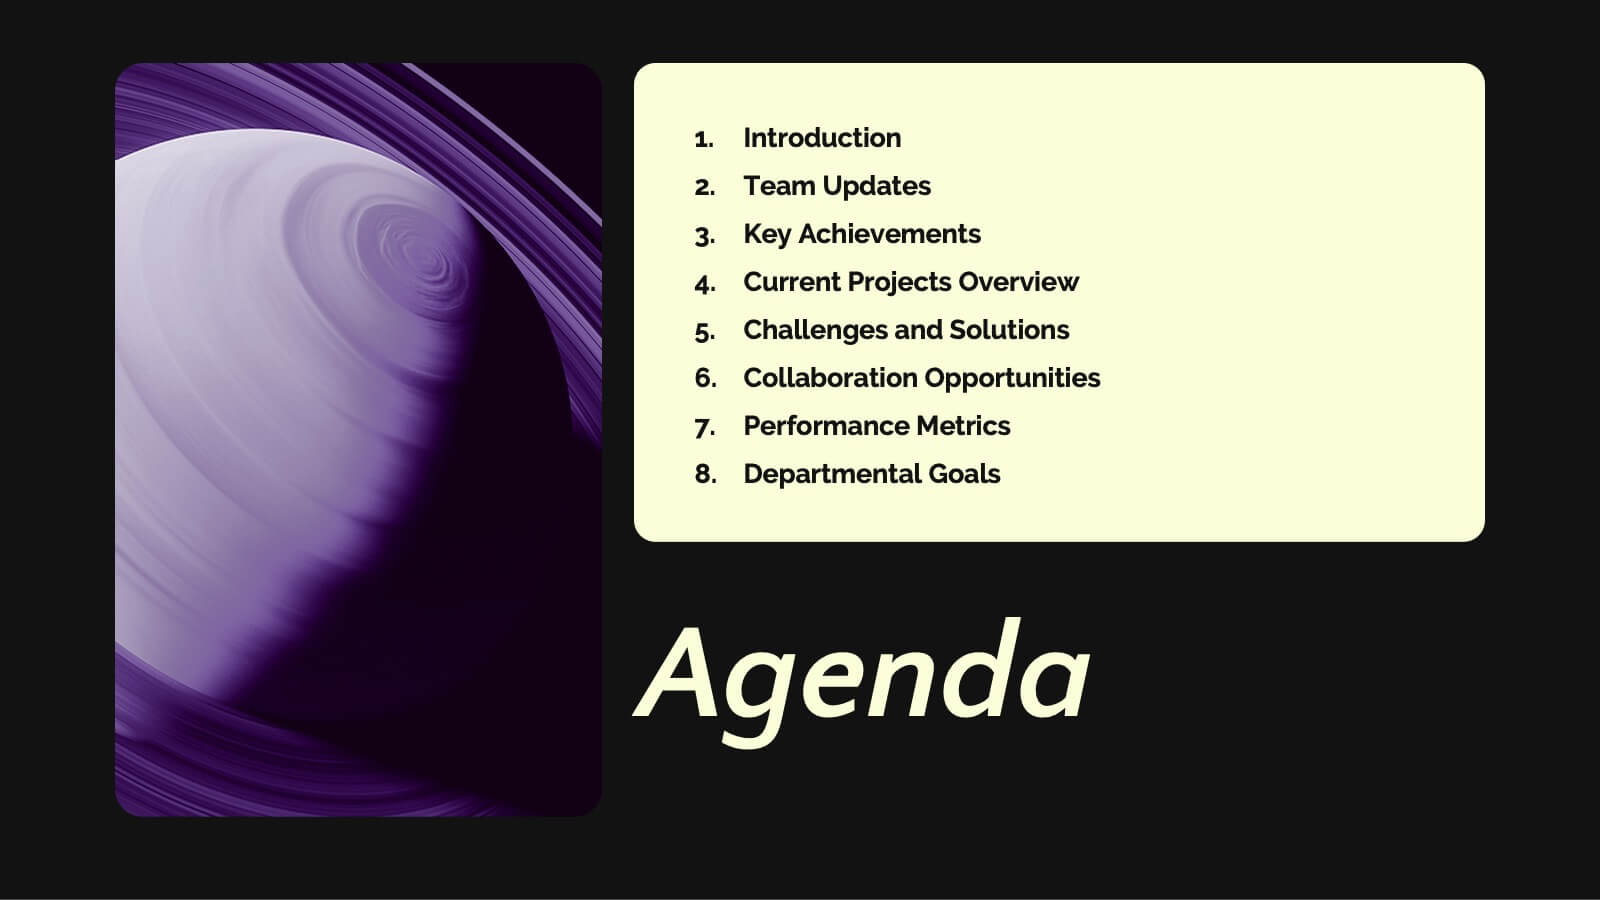
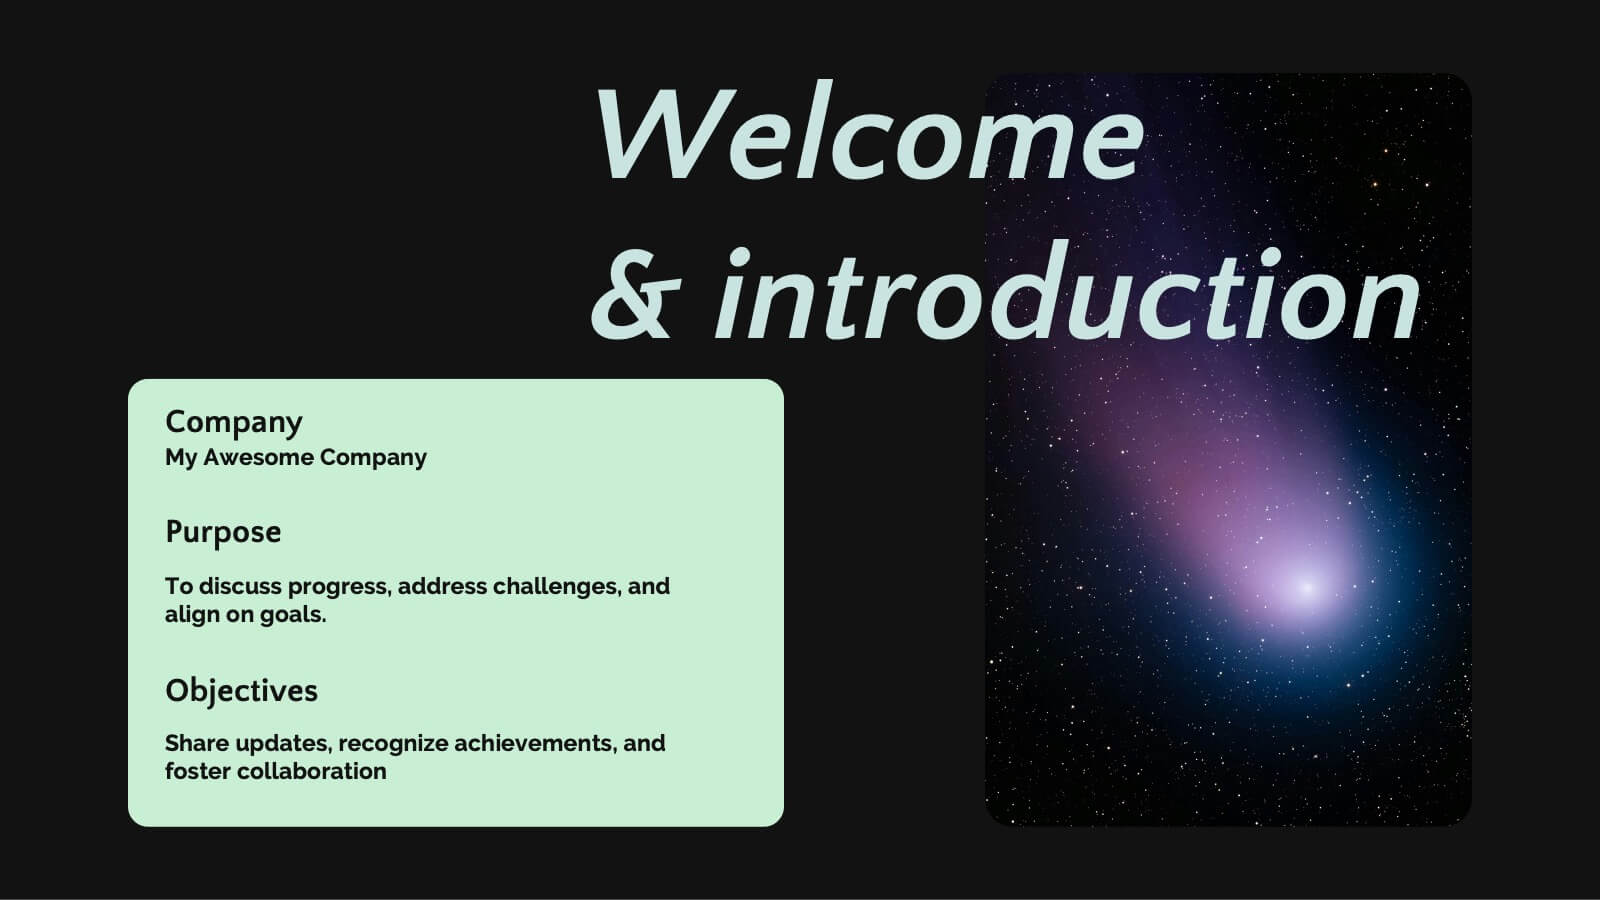
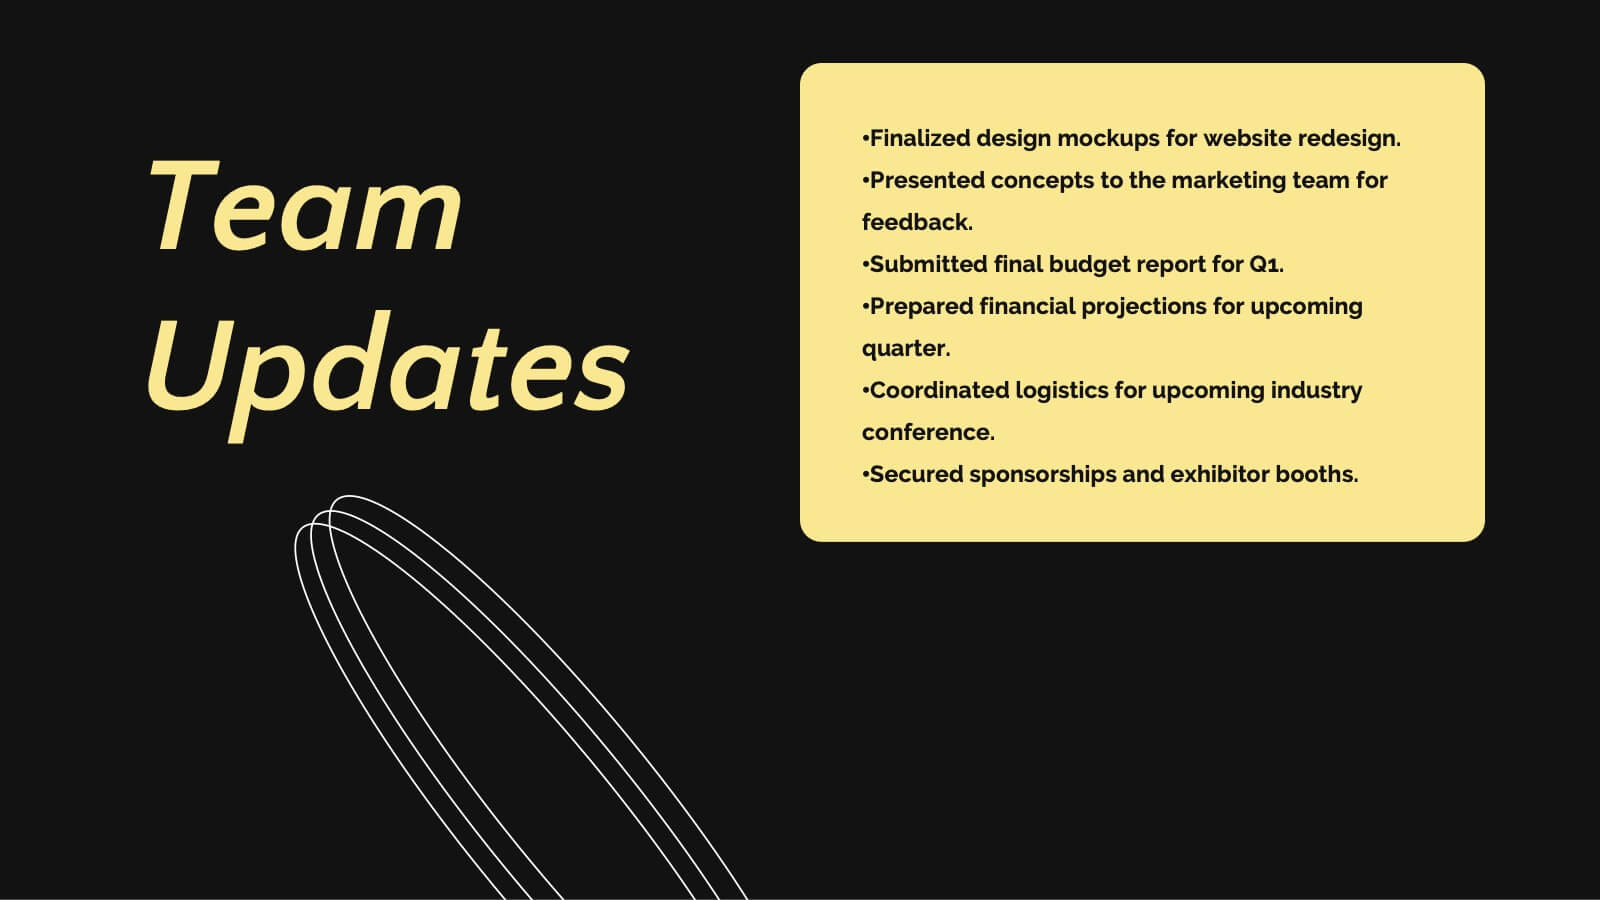
Saturn Business Plan Presentation
Embark on a journey to present your business plan like never before with this stellar presentation template! Perfect for diving deep into key updates, achievements, collaborations, and future goals, it guides your team through essential business strategies and challenges. Compatible with PowerPoint, Keynote, and Google Slides, it offers seamless flexibility and polished professionalism.


5 diapositivas
Business and Personal Goal Planning Presentation
Align your vision with action using the Business and Personal Goal Planning slide. This clean, professional layout helps break down up to four key objectives using flag-themed visuals, customizable text blocks, and supportive icons. Perfect for comparing business goals with personal development targets in a single view. Fully editable in PowerPoint, Keynote, and Google Slides—ideal for team meetings, coaching sessions, or strategic planning.


5 diapositivas
Iceberg Chart Template Infographics
Navigate the depths beneath the surface with the iceberg chart template infographics. This resource, bathed in varying shades of blue, captures the essence of uncovering hidden data, much like an iceberg reveals only a fraction of its mass above water. Professionals across diverse sectors, including business analysts and educators, will find value in this creative, ice-themed vertical template. It's especially beneficial for presentations aiming to explore beneath-the-surface dynamics, or unseen risks. The template is complete with customizable graphics, icons, and image placeholders, structured to visually break down complex concepts into digestible information.


5 diapositivas
Breast Cancer Prevention Infographics
Breast Cancer is a serious disease that affects millions of people worldwide. These infographics are visual representations of information that provide tips and strategies to help prevent breast cancer. These infographics include statistics about breast cancer, risk factors, and preventative measures that can be taken to reduce the risk of developing the disease. You can also use these to provide information on screening and early detection, such as mammograms and self-exams. The visuals in these infographics may include icons, images, graphs, and charts to make the information easy to understand.


5 diapositivas
Causes of Poaching Infographics
Poaching refers to the illegal hunting, capturing, or killing of wildlife, typically for commercial or personal gain. These infographic templates are designed to raise awareness about the underlying drivers of poaching activities and the need for concerted efforts to combat this illegal and harmful practice. The text boxes and illustrations included can be used to highlight the causes and factors contributing to the issue of poaching. Present the complex factors driving this issue, and empower your audience to support conservation efforts, advocate for stricter regulations, and contribute to the protection of wildlife.


6 diapositivas
Virtual Team Collaboration and Productivity Presentation
Boost team synergy and streamline communication with this Virtual Team Collaboration and Productivity presentation. Designed around a 6-step path, this visual layout helps illustrate key strategies for remote teamwork, digital workflows, and efficient task distribution. Each step is clearly labeled with space for your insights, making it ideal for team training, project kickoff meetings, or collaboration tool tutorials. Fully editable and compatible with PowerPoint, Keynote, and Google Slides.


26 diapositivas
Wilten Presentation Template
This template is a design foundation, and has been built with modern esthetic principles. The shapes are organic and earthy, with image place holders to allow customization. Designed for companies that have a strong connection to nature and the aesthetic, who wants to go beyond just being organic. Wilten template allows you to save time while getting the best result possible. A great clean modern template for creative agencies, business or branding deck. Enhance your presentations with this minimalistic design and impress your audience with smart ideas.
6 diapositivas
Investment Insights and Budget Tracker Presentation
Stay on top of your financial strategy with the Investment Insights and Budget Tracker Presentation. This slide layout organizes six financial metrics or priorities into clear, color-coded blocks—ideal for summarizing investment options, budget breakdowns, or cost categories. Perfect for finance teams, analysts, or consultants. Fully editable in Canva, PowerPoint, Google Slides, and Keynote.


5 diapositivas
Clear Strategy in Five Stages Presentation
Outline your strategic roadmap with this five-step cube staircase layout. Perfect for planning, growth tracking, or project milestones, each stage is color-coded with icons and numbered steps for clarity. Easy to edit in PowerPoint, Keynote, and Google Slides—ideal for business planning, strategy sessions, or performance reviews.


5 diapositivas
Leadership and Team Management
Showcase roles, responsibilities, and the structure of your team with this clear and engaging leadership diagram. Ideal for HR professionals, team leads, and project managers to explain reporting lines and team composition. Easily editable in PowerPoint, Keynote, and Google Slides—customize colors, icons, and content in minutes.