


Características


¿Tienes alguna pregunta?
Recomendar


28 diapositivas
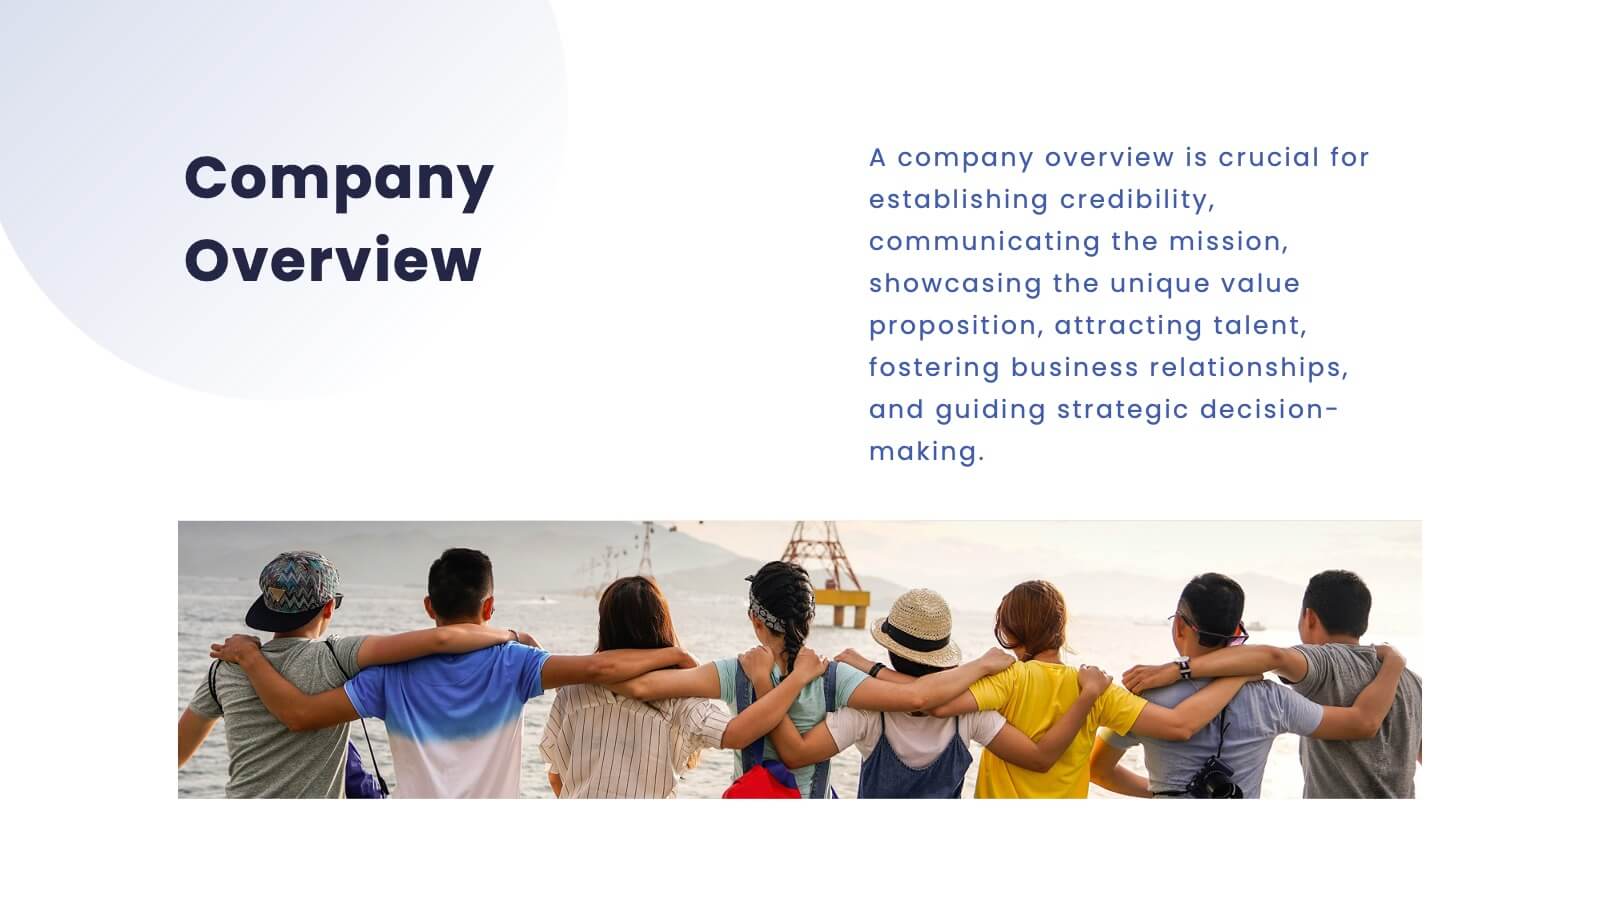
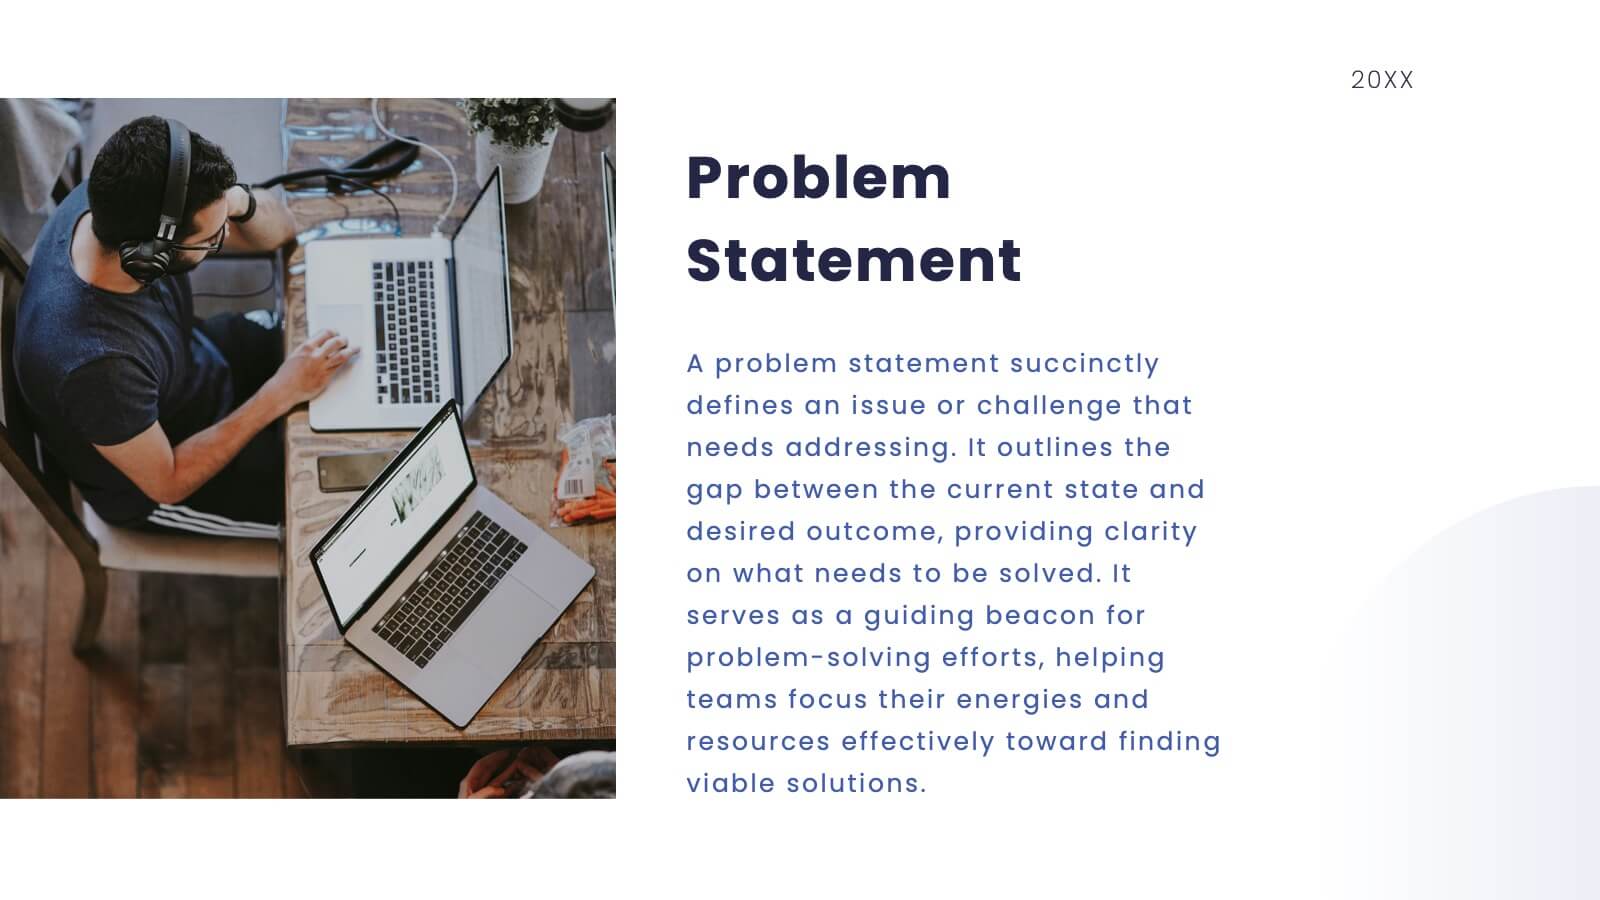
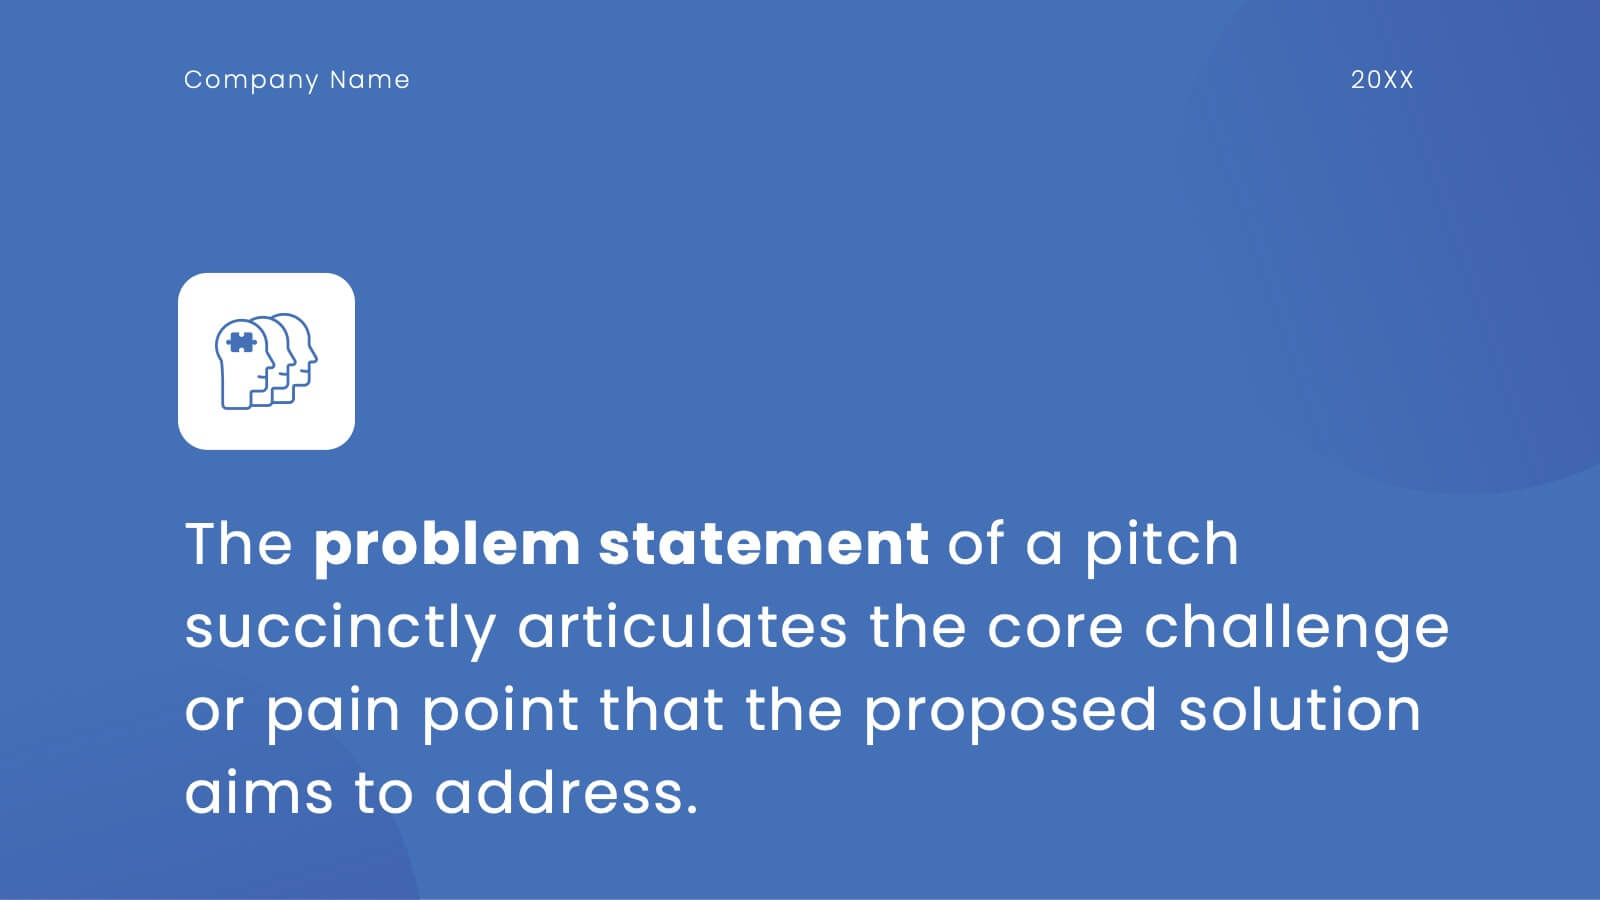
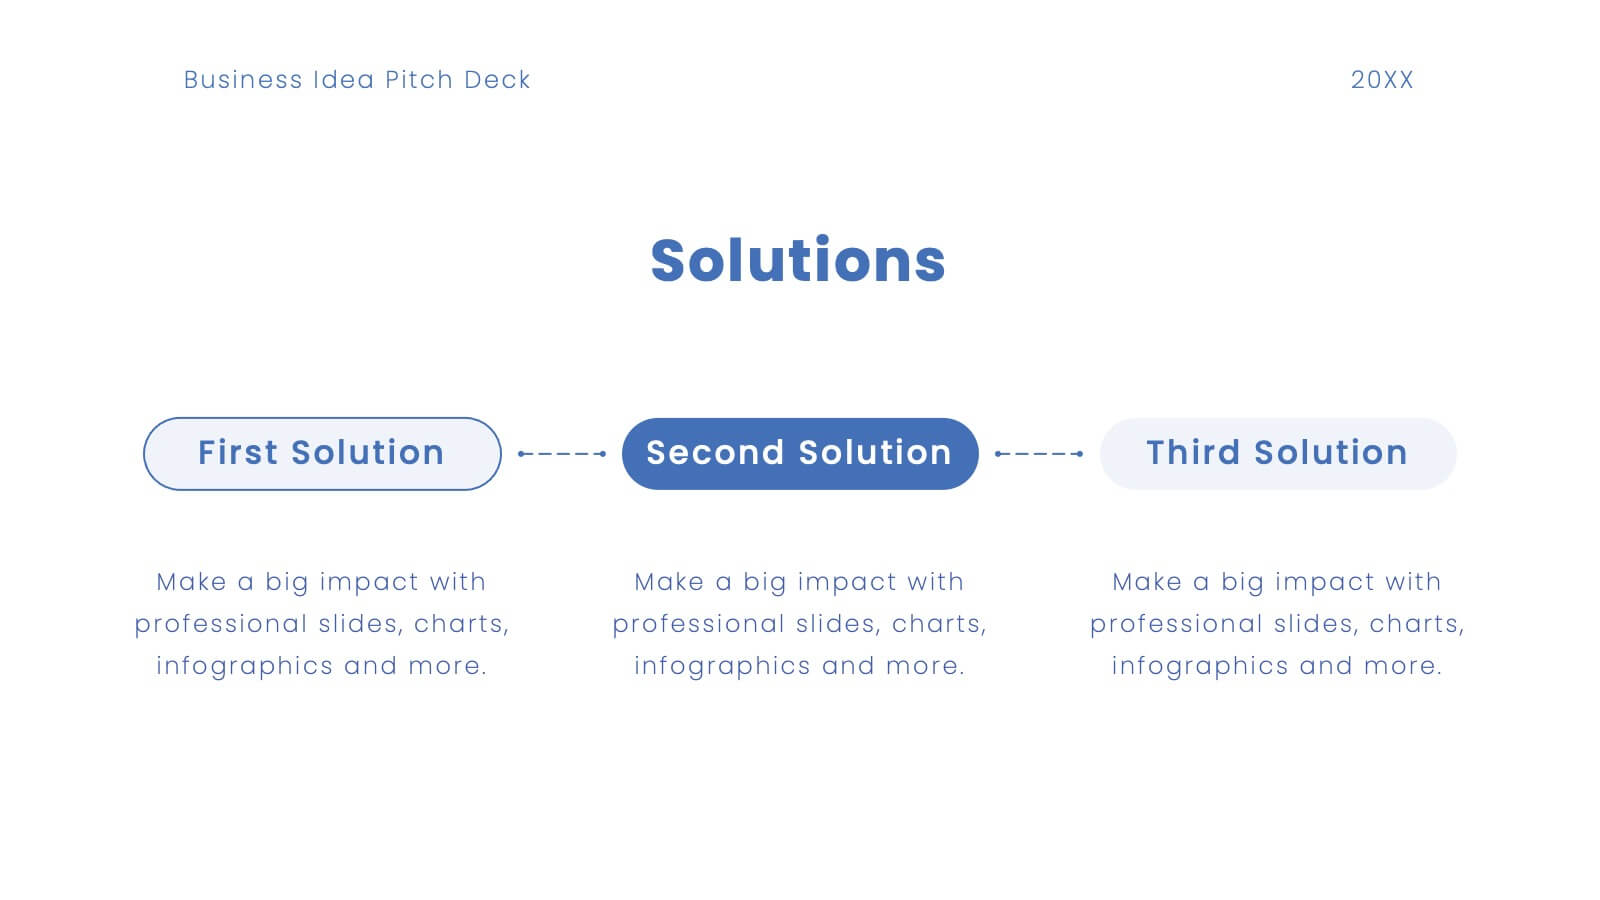
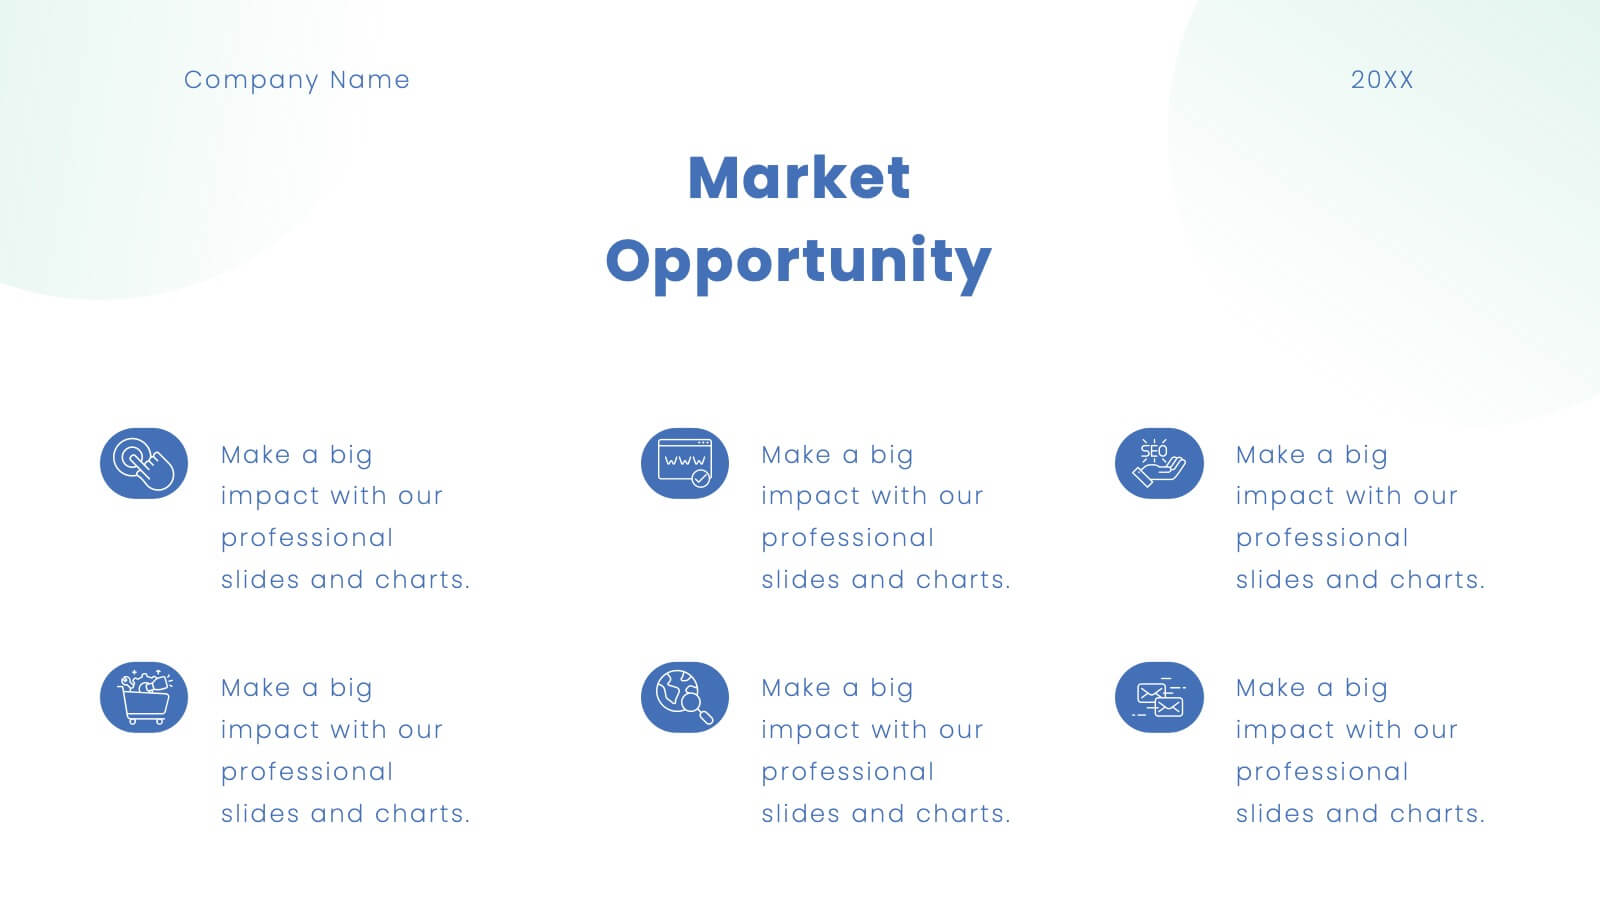
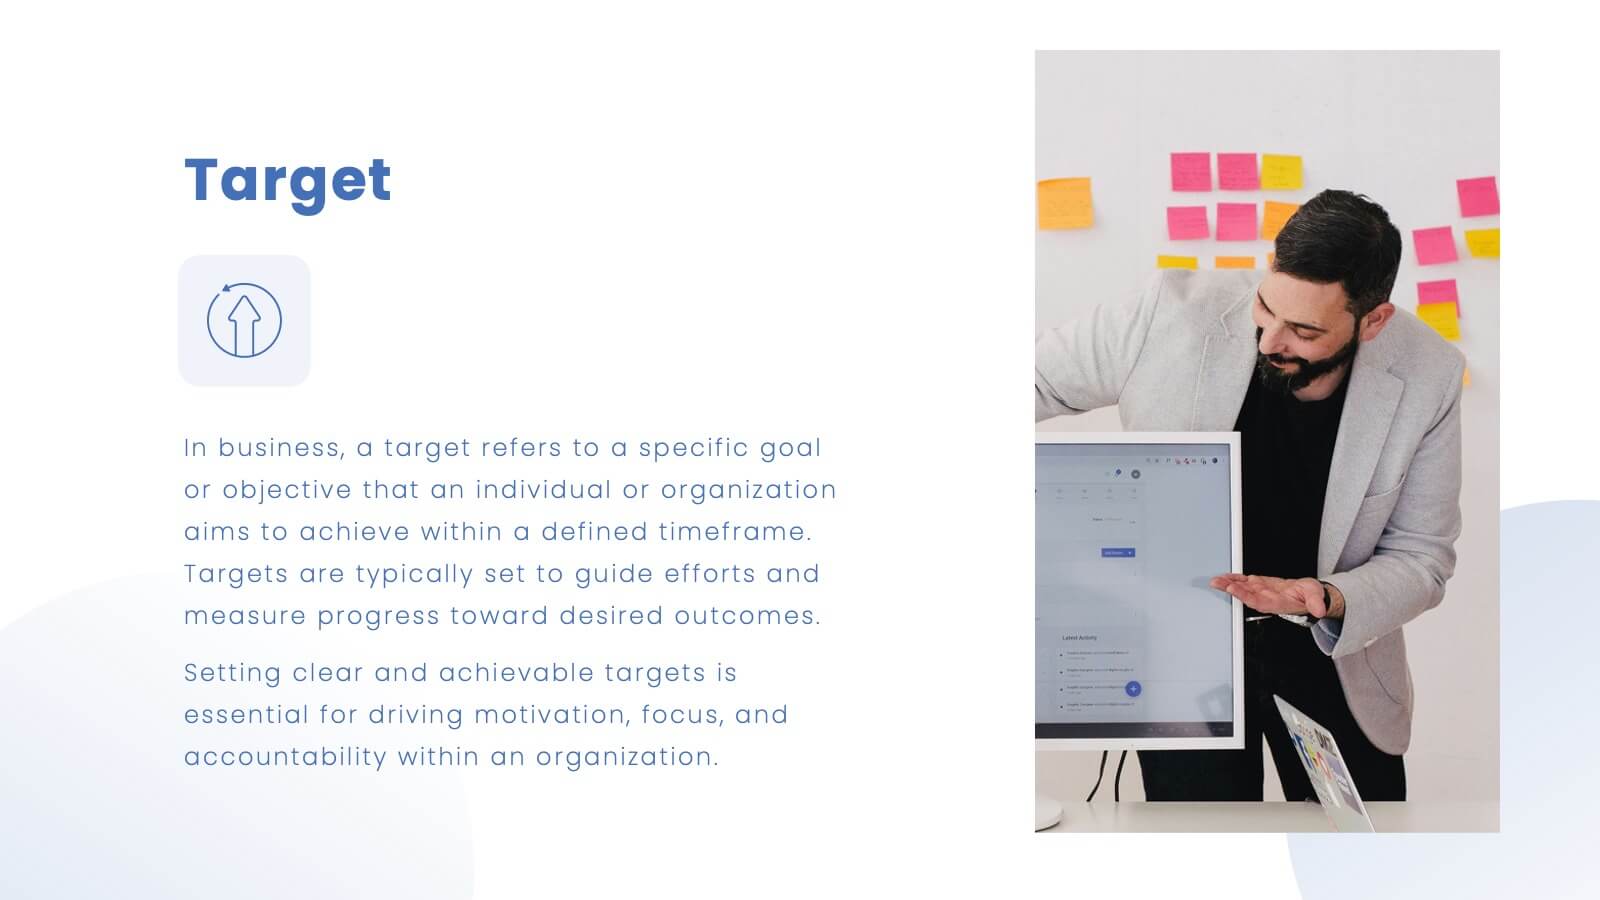
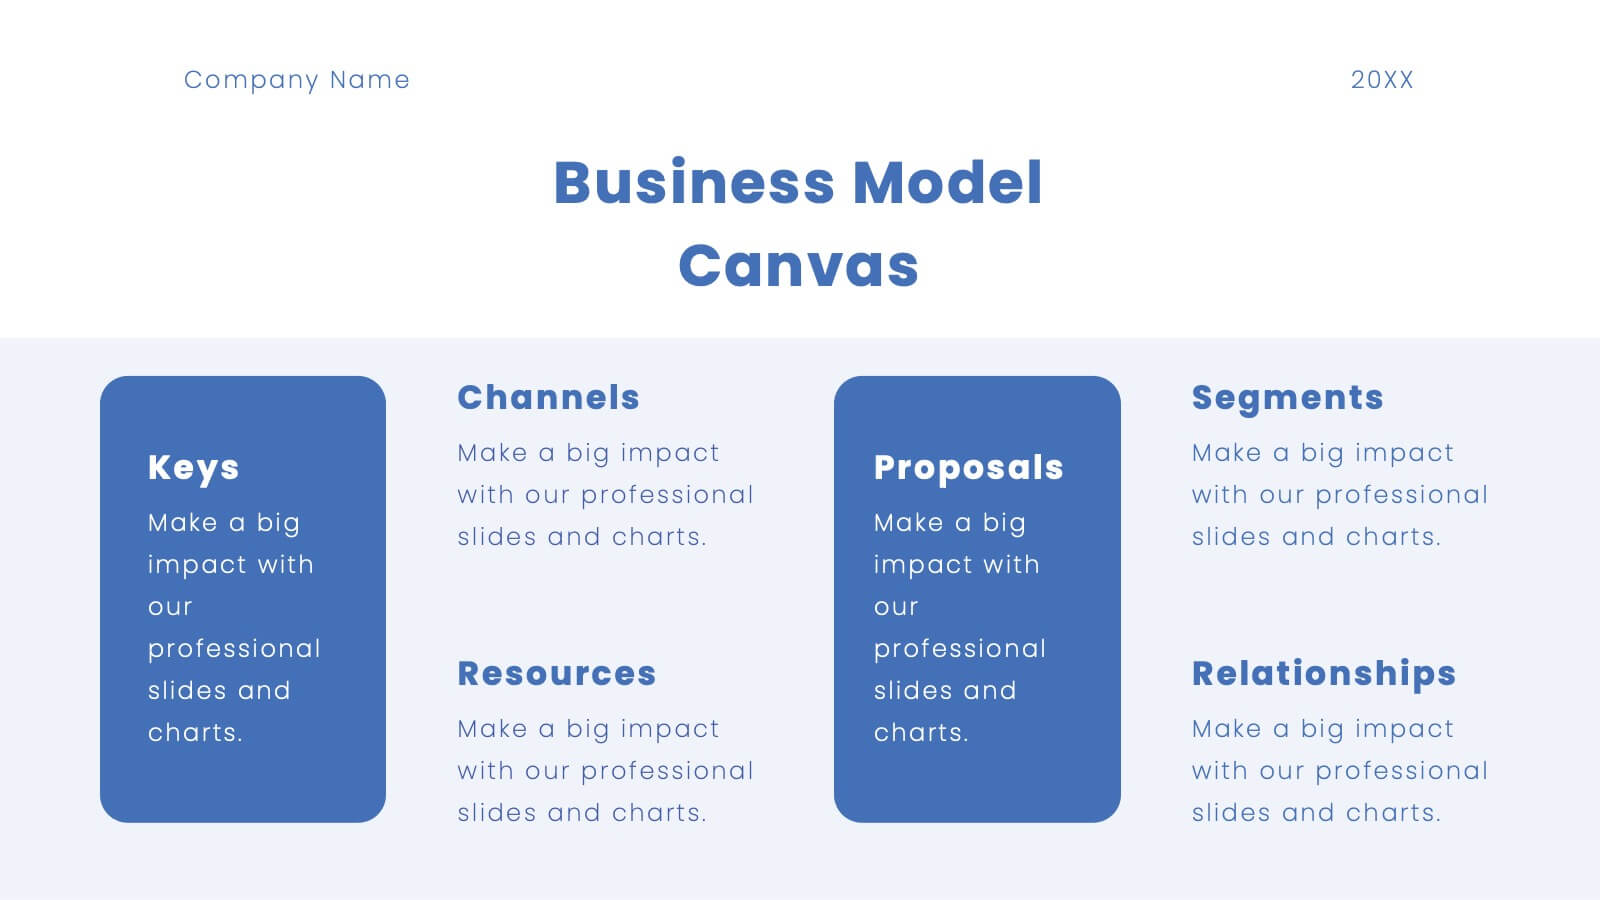
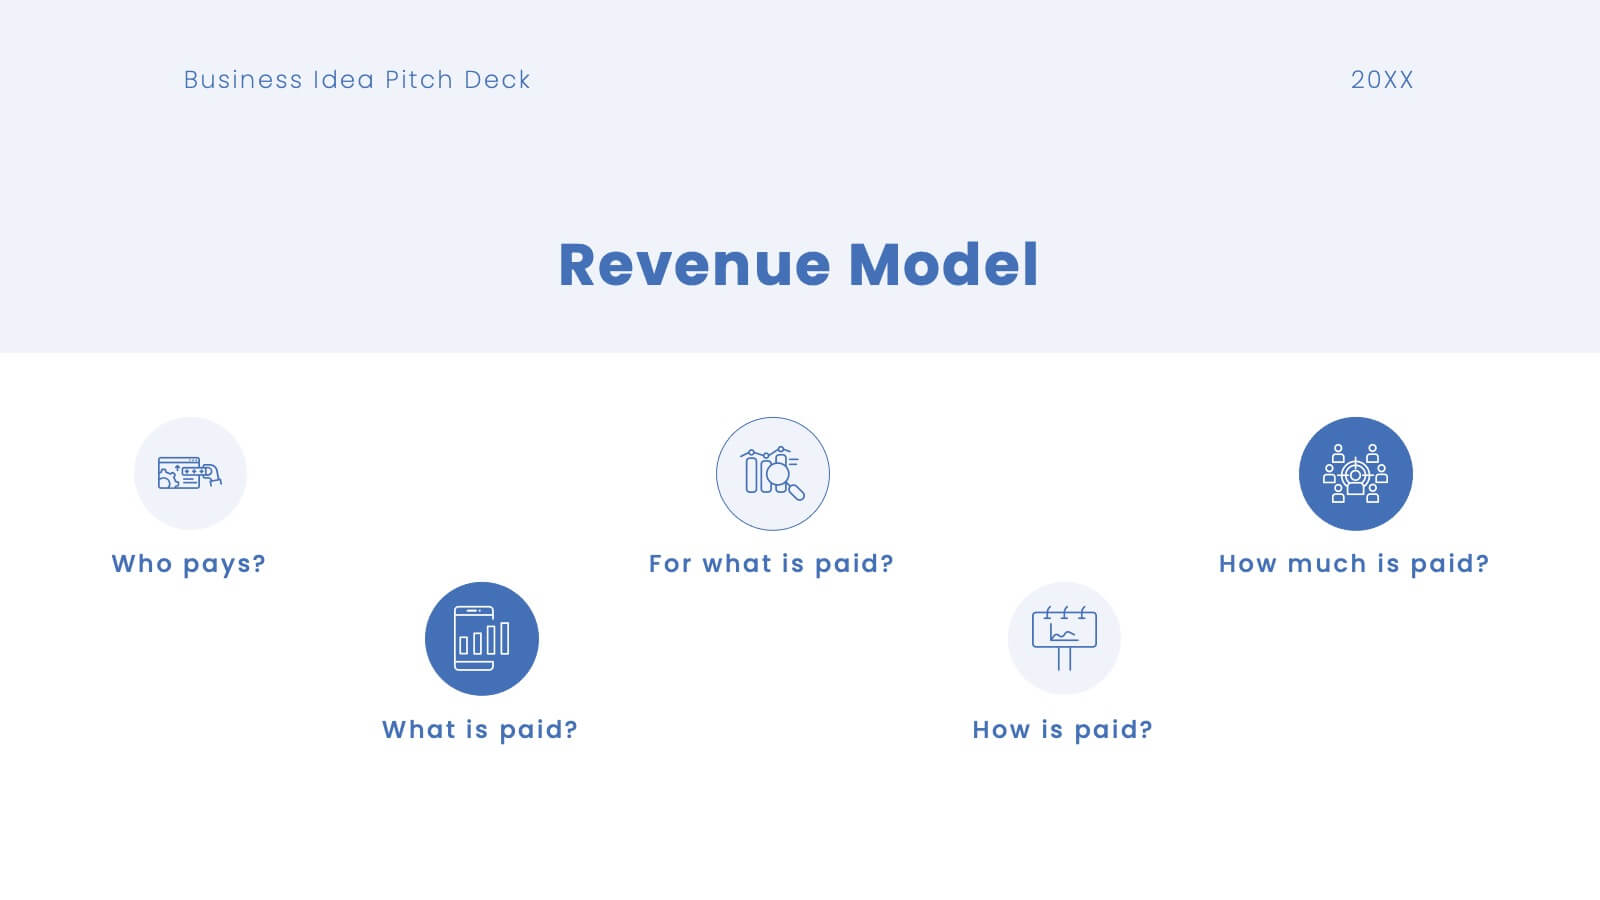
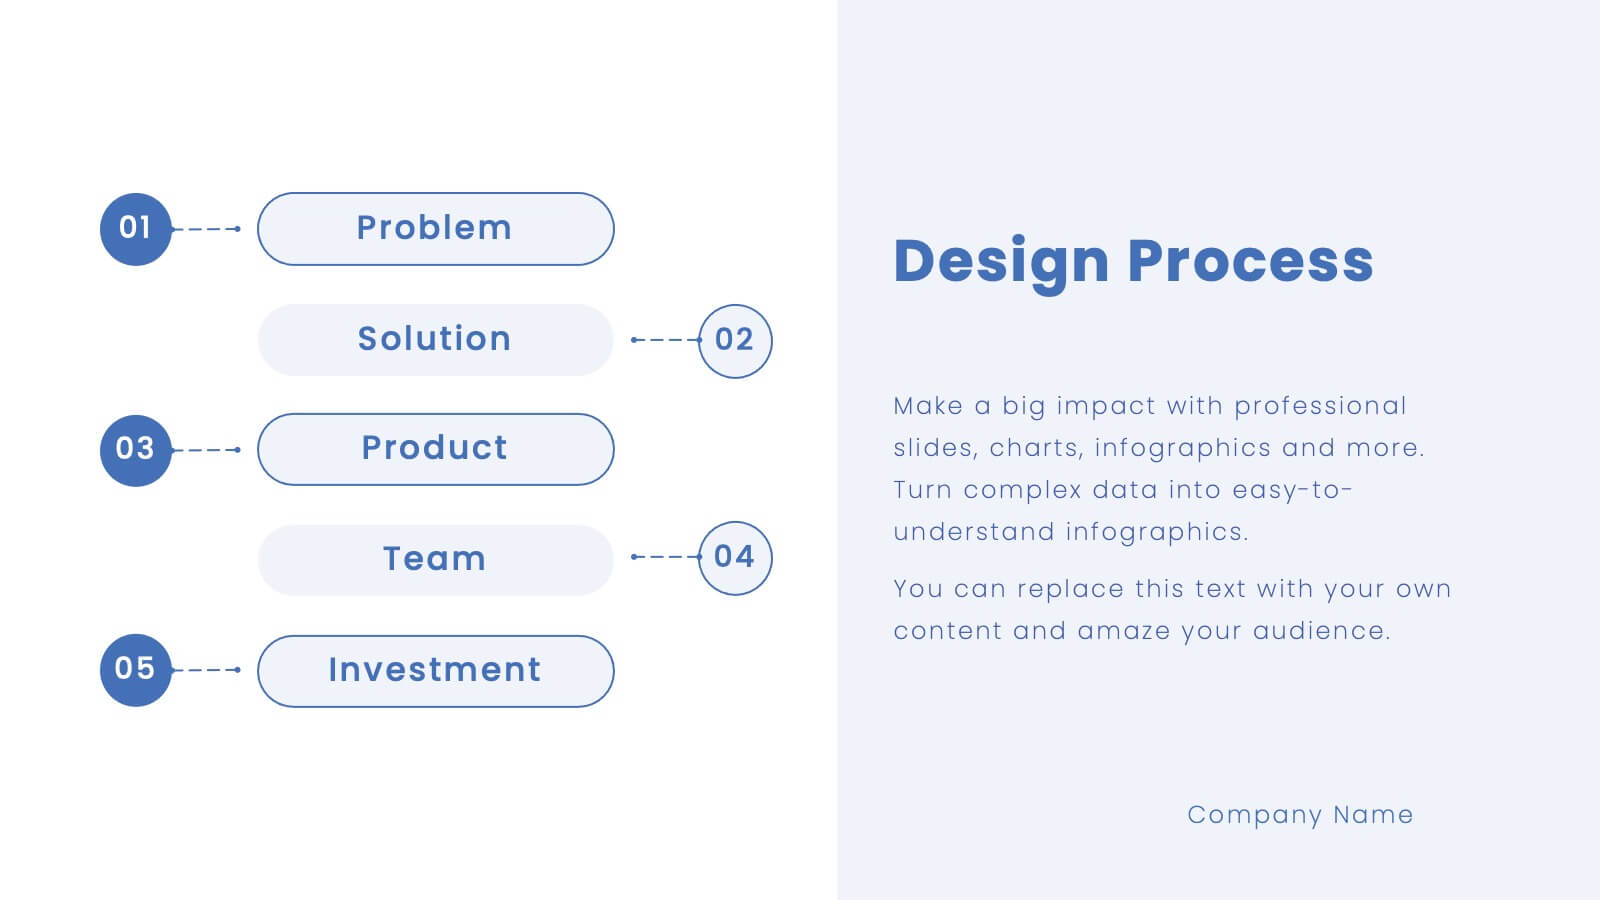
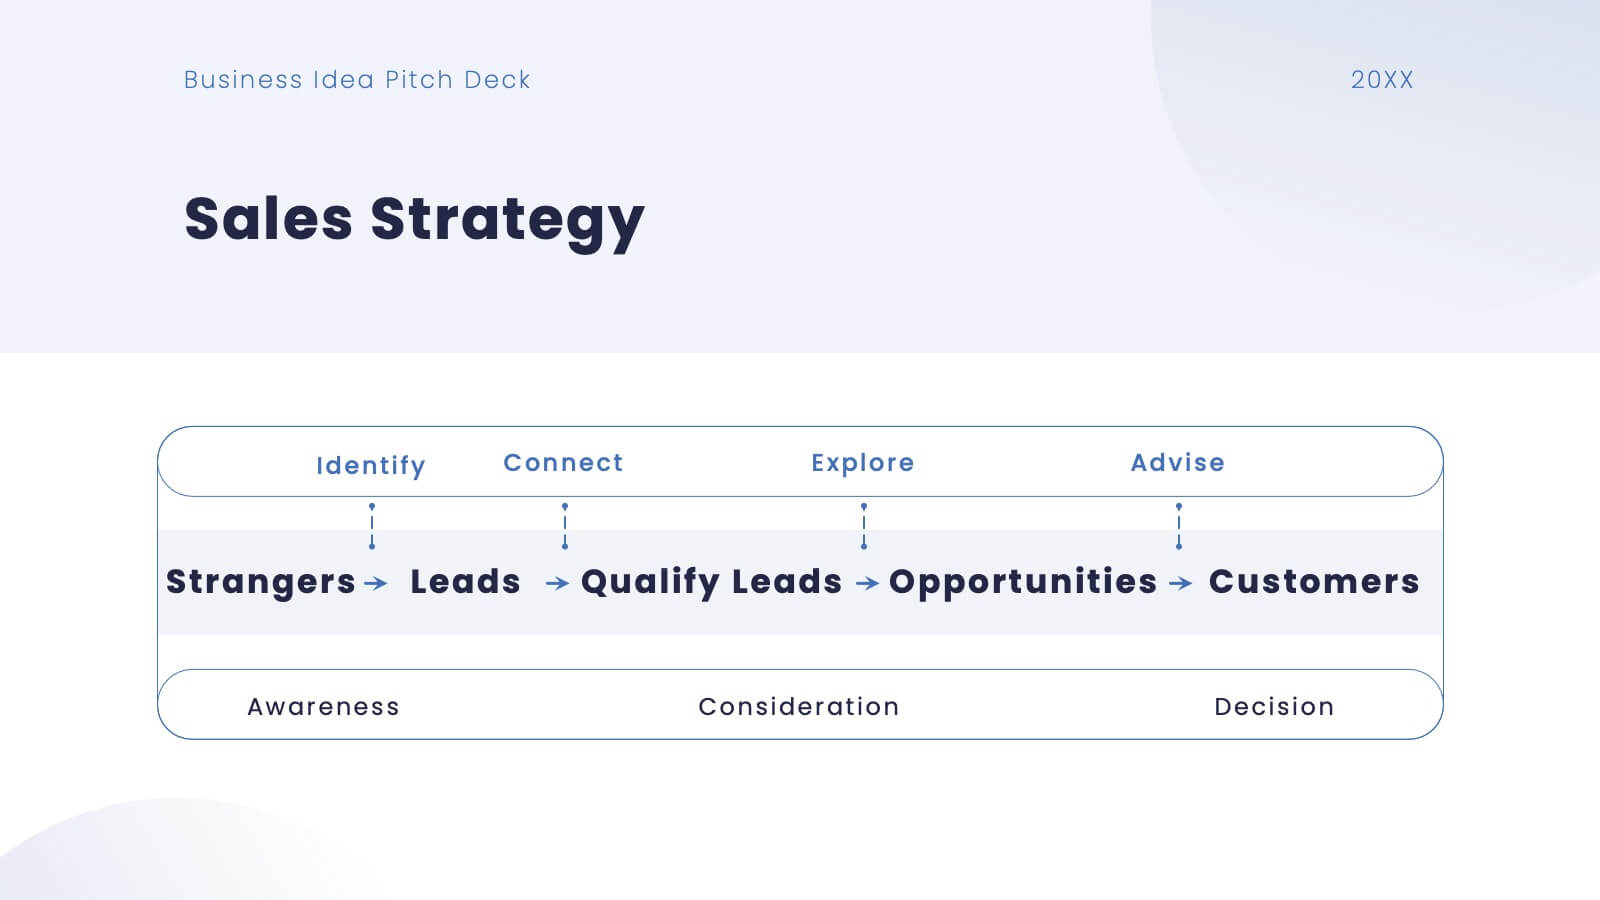
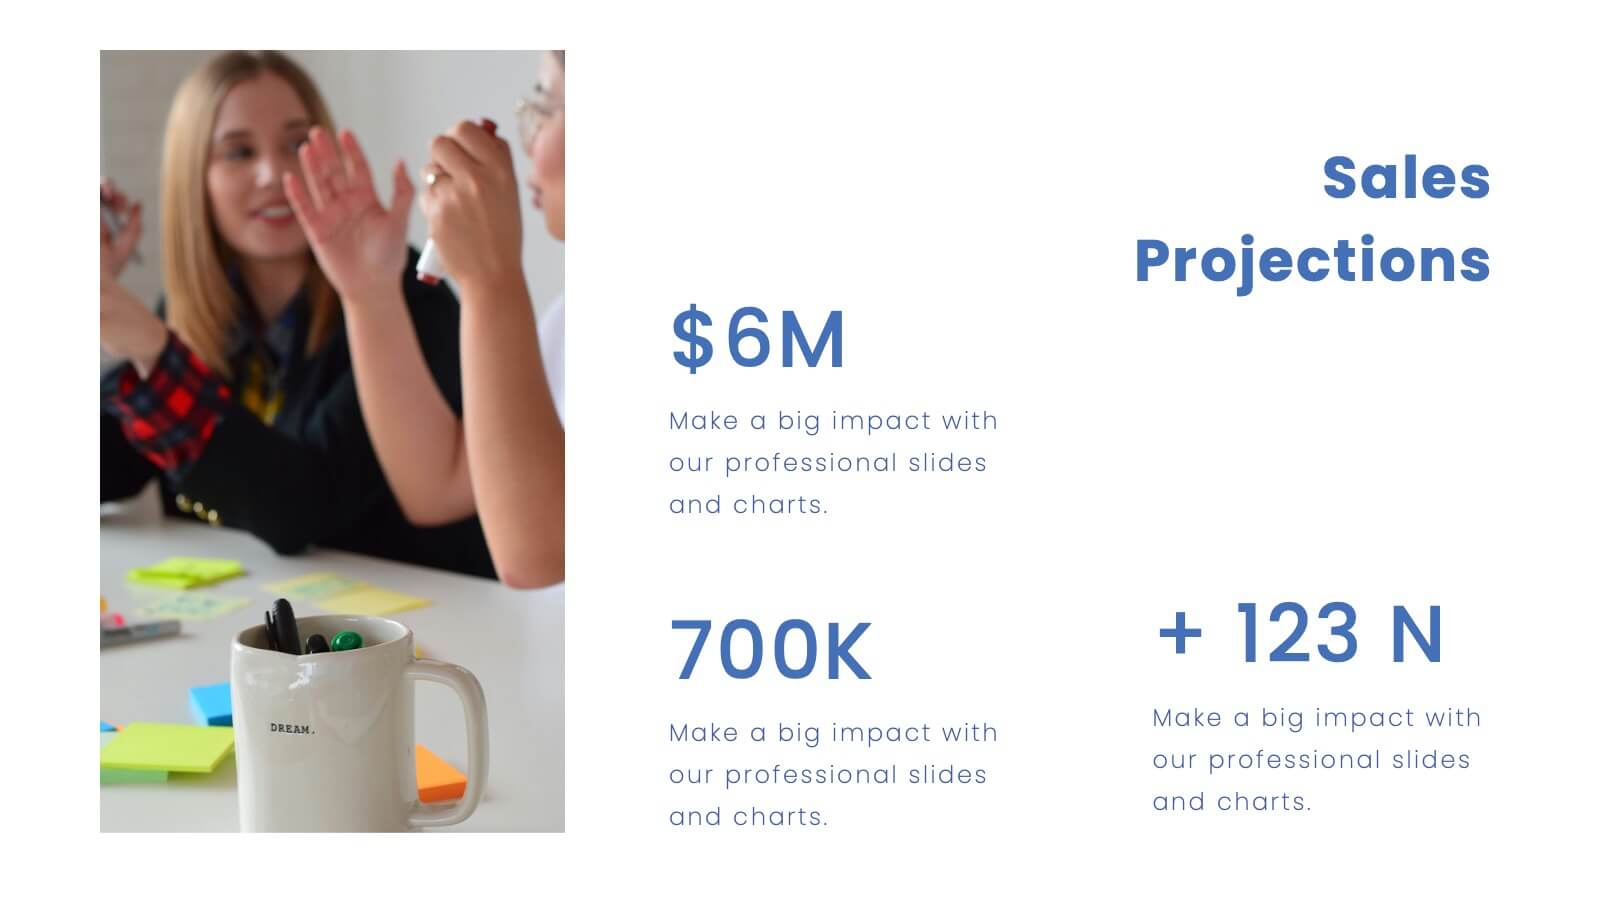
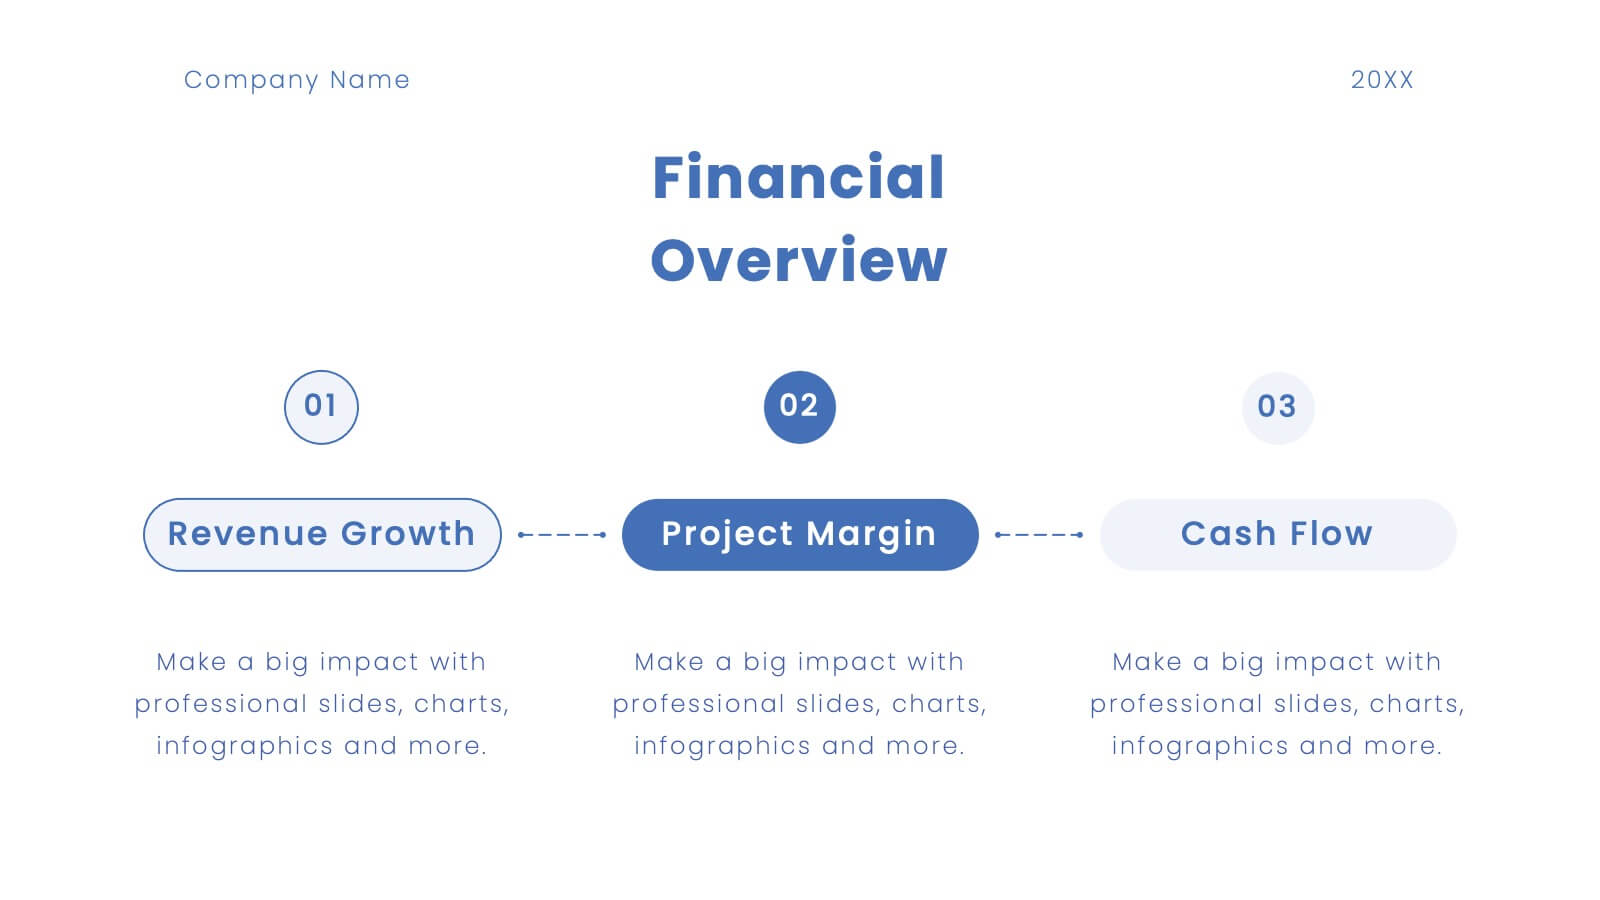
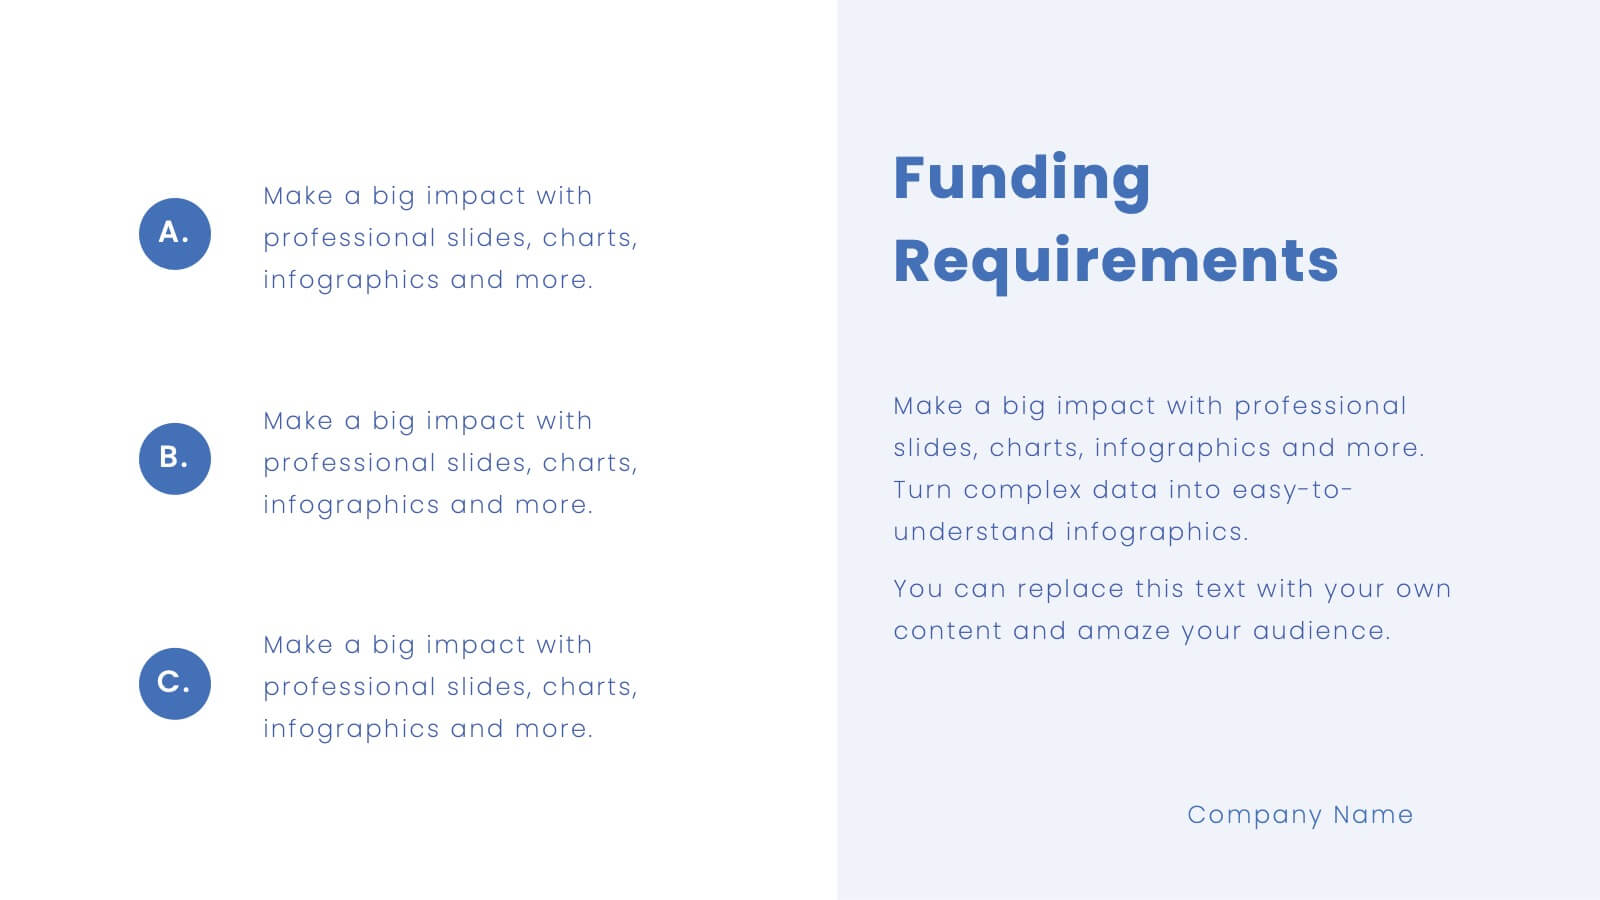
Platinum Business Idea Pitch Deck Presentation
Present your business idea with this sleek and professional pitch deck template! It includes everything from market opportunities to financial projections and sales strategies, providing a comprehensive structure for your pitch. Fully customizable and compatible with PowerPoint, Keynote, and Google Slides, this template is ideal for impressing investors and stakeholders.


5 diapositivas
4-Stage Gap Identification Presentation
A clear, engaging way to map progression, this presentation helps you illustrate each stage of identifying business gaps with structure and clarity. It guides audiences through challenges, priorities, and opportunities in a simple step-by-step flow that’s easy to follow and present. Fully compatible with PowerPoint, Keynote, and Google Slides.


6 diapositivas
Leadership Vision and Strategy Presentation
Present your organization’s goals with this leadership vision and strategy template, designed with a hierarchy graphic to represent team structure and growth. Perfect for strategic planning, leadership meetings, and corporate presentations. Fully editable in Canva, PowerPoint, or Google Slides, making it easy to customize colors, text, and layout to fit your brand.


7 diapositivas
Safety Rules Infographic
Safety rules are crucial in various settings, including workplaces, public spaces, and homes, because they play a fundamental role in protecting individuals from harm and ensuring their well-being. This infographic template aims to present essential safety rules and guidelines in a visually appealing manner. Compatible with Powerpoint, Keynote, and Google Slides. Tailor the content to suit your specific safety guidelines and ensure the infographic effectively communicates the importance of safety across different contexts. This will allow you to effectively communicate essential safety guidelines in your presentations.


8 diapositivas
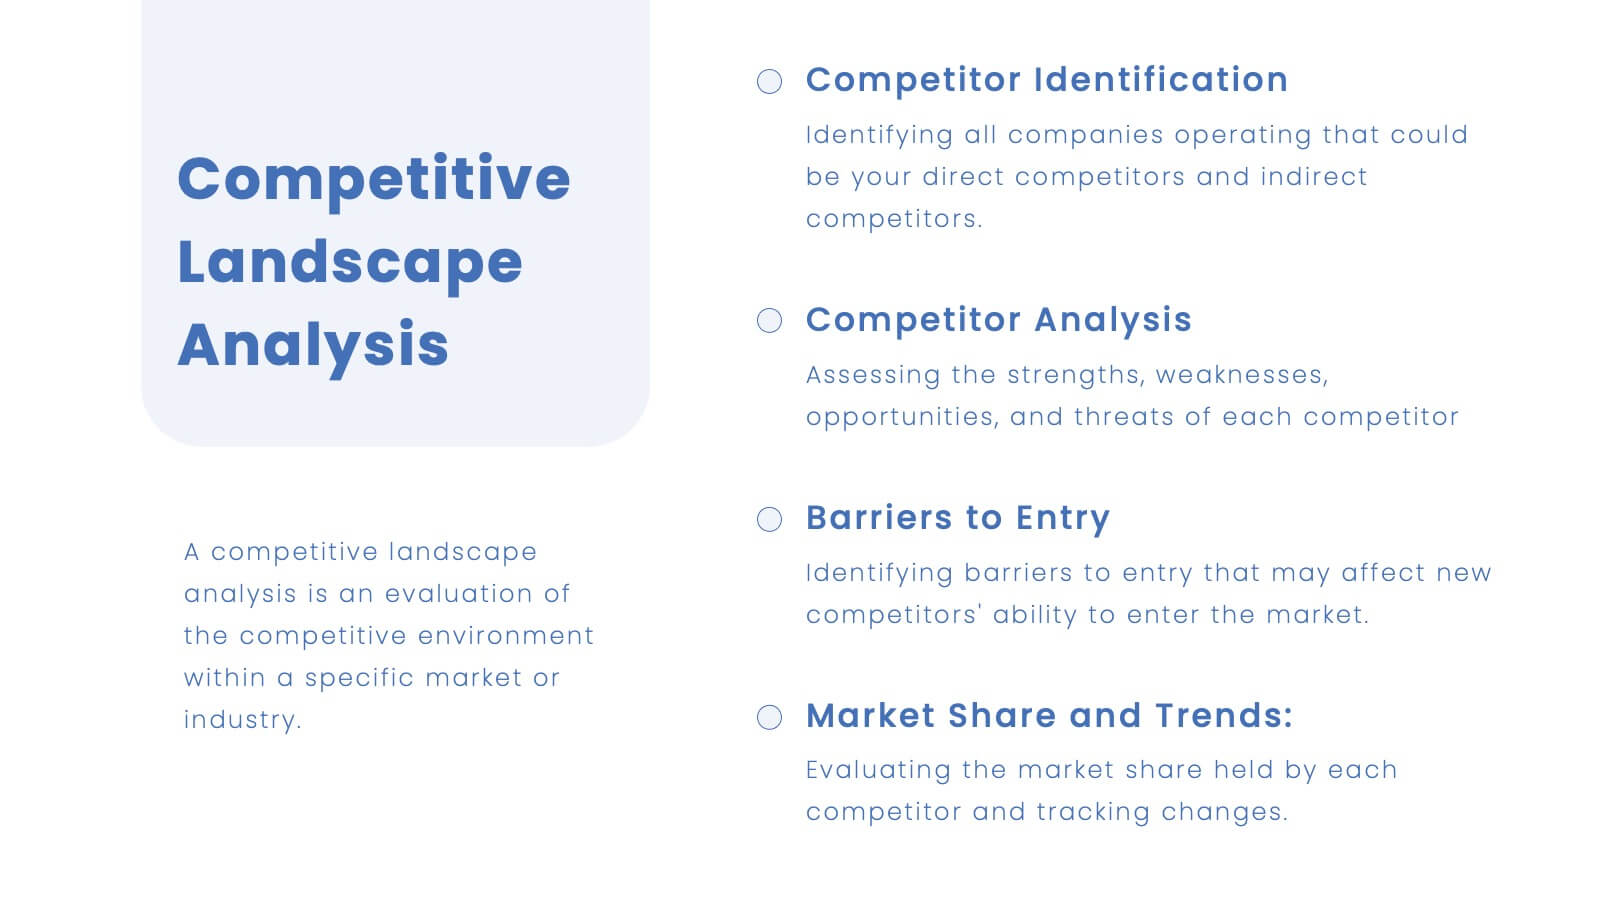
Editable SWOT Infographic Presentation
Analyze your business strategy with the Editable SWOT Infographic Presentation. This modern and professional template highlights Strengths, Weaknesses, Opportunities, and Threats in a visually structured format. Perfect for business planning, competitive analysis, and decision-making, it allows for easy customization of colors, text, and layout. Fully compatible with PowerPoint, Keynote, and Google Slides, ensuring seamless editing and presentation.


2 diapositivas
Online Course Structure and Syllabus Deck Presentation
Welcome students with a vibrant and modern course intro slide. This template is perfect for online educators outlining course objectives and syllabus details. Features an image placeholder and text sections for clear communication. Fully editable in PowerPoint, Keynote, and Google Slides—ideal for virtual learning environments and eLearning programs.


7 diapositivas
Smile Rating Infographic Presentation Template
Our Smile Rating Infographic is a template that is best used for promoting services. This useful template includes charts that can assist you to convey information about your business, company or product. This Smile Rating infographic is a powerful tool for instilling positive behavior in your customers. This template will show customer's interactions with you and gives you valuable information about what they expect from their most recent experience. This infographic is designed to help your customers rate their experience, and let you know where they think improvements can be made.


7 diapositivas
Agenda Infographic
Organize and present your meeting or event agendas with our professionally designed slide templates. Each template is tailored to help you clearly outline the schedule and topics, ensuring that your meetings are both structured and efficient. These templates feature a variety of layouts that can accommodate different types of agendas, from detailed hourly breakdowns to high-level overviews. The use of engaging graphics, bullet points, and timeline visuals aids in presenting the sequence of events or discussion topics in a clear and appealing manner. Color coding and distinct typographic hierarchies make it easy to navigate through the agenda, enhancing readability and viewer engagement. Fully customizable, these slides allow you to adapt the design to your corporate colors, add your logos, and rearrange elements to suit your specific meeting needs. Ideal for business meetings, conferences, workshops, and seminars, these agenda slides are essential tools for keeping your events organized and on track.


6 diapositivas
Circle Diagram for Organizational Structure Presentation
Visualize team roles and functions with the Circle Diagram for Organizational Structure Presentation. This hexagon-centered circular layout clearly displays six departments or categories around a unified core, using icons and color coding for easy interpretation. Perfect for showcasing business units, workflows, or collaborative systems. Fully editable in PowerPoint, Google Slides, and Canva.


8 diapositivas
Meeting Agenda Presentation
Streamline your meeting agendas with our "Meeting Agenda Presentation" template. This design features a central node linked to four key points, each representing a separate agenda item, ensuring a clear and organized discussion flow. Color-coded segments aid in visually distinguishing between topics, making it easy for participants to follow and engage. Ideal for team meetings, project updates, and strategic discussions, this template enhances communication and efficiency. Its intuitive layout keeps your sessions on track and productive. Compatible with PowerPoint, Keynote, and Google Slides, it's an essential tool for any professional aiming to optimize their meeting presentations.


7 diapositivas
Enforcement Law Infographic Presentation
A Law Enforcement Infographic is a visual representation of key concepts, statistics, and procedures related to law enforcement. This template can be used to provide an overview of various aspects of law enforcement, such as crime rates, policing strategies, and legal procedures. This infographic includes a variety of icons, illustrations, and other design elements law themed to enhance the visual appeal and make it more appealing for your viewers. This template is compatible with Powerpoint, Keynote and Google Slides making it easy to customize and edit with your own text and information.


5 diapositivas
Buyer Persona Strategy Presentation
Enhance Customer Understanding! The Buyer Persona Strategy Presentation template helps analyze customer behaviors, goals, and frustrations to create targeted marketing strategies. Fully editable and compatible with PowerPoint, Keynote, and Google Slides, it’s perfect for marketers and strategists looking to optimize engagement with a modern, professional, and visually compelling layout.


10 diapositivas
HR Management Presentation
The HR Management Presentation template is expertly designed to communicate crucial aspects of human resource management. It features a visually engaging layout that systematically breaks down important HR elements such as recruitment, training, employee engagement, and performance metrics. Each section is clearly labeled and accompanied by intuitive icons that aid in quick comprehension, making it an ideal choice for HR professionals aiming to present complex data in an accessible format. This template enhances audience engagement through its structured presentation of information, focusing on strategic management within HR. It is perfectly suited for showcasing HR strategies, policy updates, or organizational improvements in a clear and effective manner.


21 diapositivas
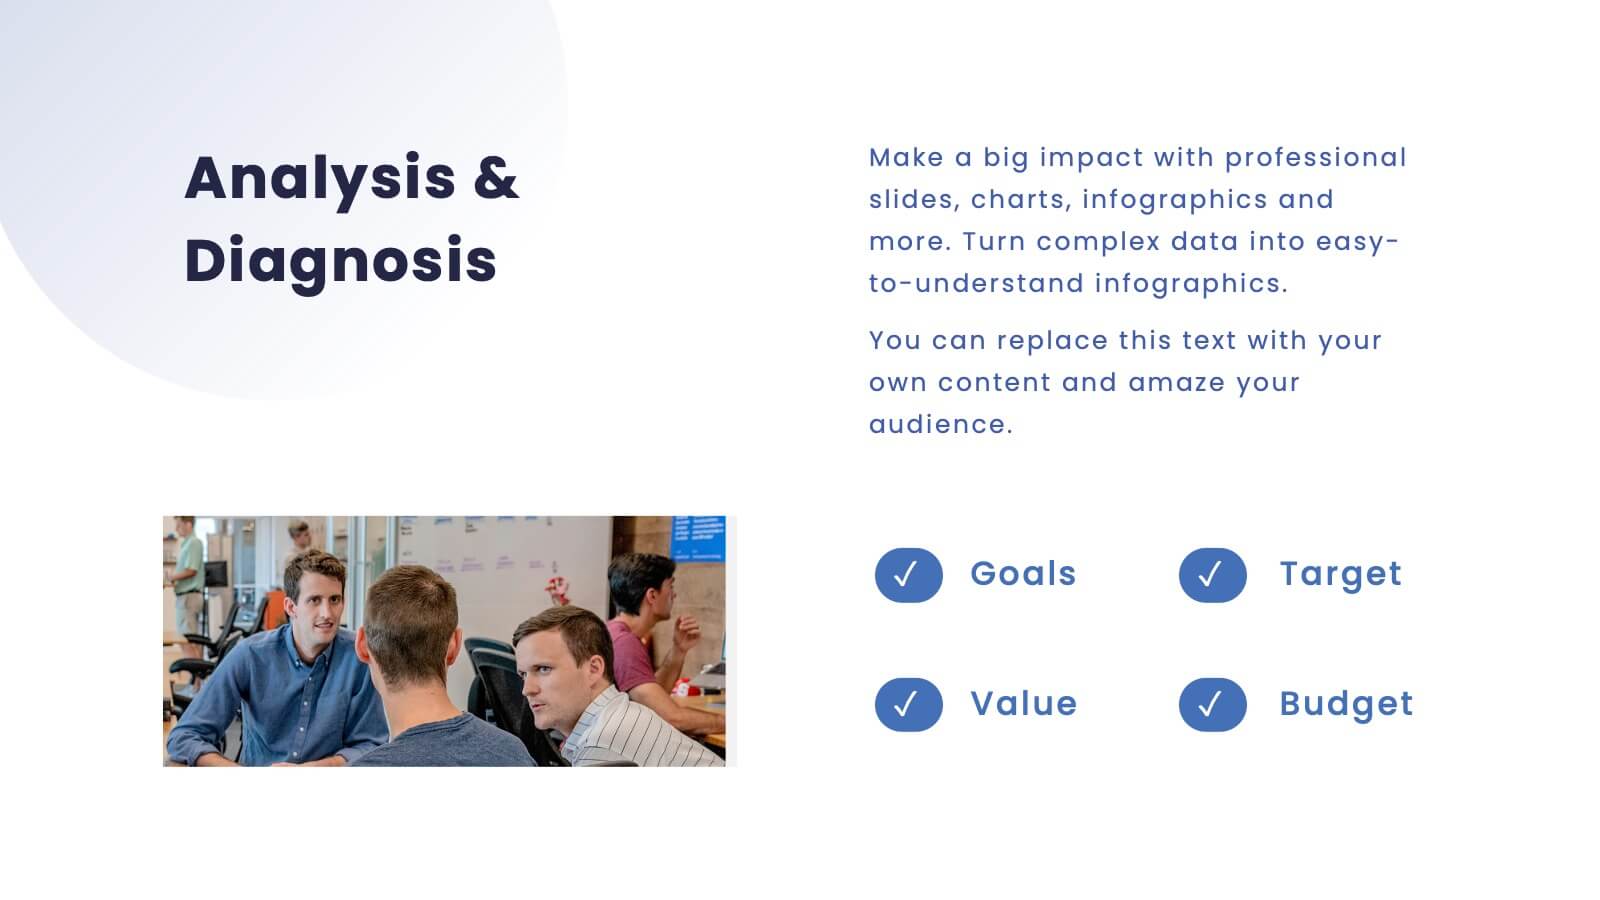
Delta Marketing Campaign Presentation
This dynamic Marketing Campaign template covers everything from market presence to target audience and financial highlights. With a sleek, professional design, it helps you showcase your brand’s unique selling points and industry recognition. Compatible with PowerPoint, Keynote, and Google Slides for easy, impactful presentations.


4 diapositivas
Workflow Bottleneck Fishbone Analysis
Identify slowdowns and streamline performance with the Workflow Bottleneck Fishbone Analysis Presentation. This diagram features a horizontally aligned fishbone structure with segmented semicircles, ideal for pinpointing process inefficiencies across stages. Fully customizable in PowerPoint, Keynote, and Google Slides for professional workflow diagnostics.


6 diapositivas
Relationship Compatibility Infographic
Relationship compatibility refers to the degree to which two individuals are well-suited for each other in a relationship. This infographic can be a fun and informative way to explore the compatibility between individuals in a relationship. This template is designed to help individuals gain a better understanding of their relationships and make informed decisions about their interactions with others. Compatible with Powerpoint, Keynote, and Google Slides. The combination of visual elements and informative content can make this topic engaging and accessible. Making it easy for readers to navigate and understand the content.


5 diapositivas
Business Success Case Study Presentation
Showcase impactful results with the Business Success Case Study Presentation template. This structured layout highlights key milestones, challenges, and solutions in a visually engaging format, making it perfect for demonstrating business achievements and growth strategies. Fully editable and compatible with PowerPoint, Keynote, and Google Slides, it’s ideal for case studies, reports, and business reviews.